growing competition in food and fresh produce markets
TRANSCRIPT
Growing Competition in Food and Fresh Produce Markets
DR. ROBERTA COOKDept. of Ag and Resource Economics
University of California, DavisEmerita Faculty
for 2018 Horticultural Growers’ Short Course
Abbotsford, BC
January 26, 2018
Agenda• Fresh produce basics
• Comments on branding in fresh produce
• Changing food markets and consumers: Choice and substitution abounds!
• Blueberries
• Conclusions

Fresh Produce Basics

•About 20 retailers estimated to account for over 70% of US total retail food sales.
•Buyer consolidation has led to shipper consolidation – fewer, bigger firms. But most suppliers are still relatively small compared with retailers.
•Retail and foodservice buyers demand yr-round supply.
•Shippers have big investments in facilities, technology, seed trials, research to improve efficiency, sustainability, precision farming.
Fresh Produce Marketing Basics
• Imports increasingly handled by U.S. grower-shippers that import during the off-season.
• Same requirements for foreign and domestic growers.• Role of forward contracts increasing but challenging
to manage across growers in different locations and seasons.
• Foodservice leads in forward contracting.• As forward contracting grows for retailers as well,
the marketing system becomes less focused on transactions (daily spot market) and more on building marketing “programs” designed to increase sales.
Fresh Produce Marketing Basics
• Major food safety requirements, higher cost structure. Table stakes.
• Sustainability and social responsibility practices factoring into buyer-seller negotiations but don’t trump price, consistent availability and volumes.
• Buyers expect suppliers to be much more data-driven in their selling/marketing approaches, requires IT investments.
• Fewer, larger buyers have enabled shippers to reduce their customer lists and to focus more on understanding the needs of key accounts - becoming account-driven and strategic.
Fresh Produce Marketing Trends

• Firms attempting to differentiate their products to get out of the “commodity trap,” but perishability will always make that challenging.
• Product differentiators: quality, color, shape, flavor, texture, culinary factors, proprietary seeds.
• Service differentiators: marketing, transportation, shopper insights, etc.
• Shippers focusing more on understanding and communicating with consumers, attempting to stimulate consumer demand; social media facilitates.
• Branding and private label are both growing. Deep discount retailers (e.g. Aldi) emphasize private label.
Fresh Produce Marketing Basics

Frequency of Purchasing Private Label Fresh Produce, 2016
Source: U.S. Grocery Shopper Trends 2016, FMI.
Almost Always29%
Occasionally27%
Fairly often37%
Never8%

Historical role of branding and consumer marketing in fresh produce
•Food marketing dominated by brand-based consumer packaged goods (CPGs). Produce is an exception. Beyond the banana players and Sunkist cooperative, brands were not prevalent.
•Commodity (undifferentiated) marketing the norm.•Where brands existed, achieving consumer brand loyalty was difficult due to: inconsistent quality and distribution (shelf-presence); seasonality; lack of differentiation.
•Produce often costs more when quality is the worst (weather related). Why should a consumer be loyal?

Role of branding in fresh produce marketing
•Hard to get ROI on investments in branding.•Under-investment in consumer marketing in produce.•Growth in social media making it less costly to reach target consumers with marketing messages.
•For larger grower-shippers consumer marketing may make sense. Cutie’s, Halo’s, Driscoll’s berries.
•Incentives are becoming more aligned to improve quality and flavor and educate consumers about how to use and prepare fresh produce. Traceability, GTIN’s.
•Role of generic marketing/advertising programs.

Historical role of branding and consumer marketing in fresh produce
•Value-added produce (VAP) is marketed like CPGs –consistent weekly volumes, shelf-space, pricing and quality.
•Salads brought more emphasis on branding, marketing & promo support. Dedicated shelf-space.
•ROI on investments in consumer marketing for commodity produce is more challenging due to supply side fragmentation, inconsistent weekly distribution.
•Under-investment in consumer marketing; promotion typically trade-oriented (commercial buyers).

27% 37%
64% 51%
9% 12%
0%
20%
40%
60%
80%
100%
2010 2016
Branded Unbranded Private Label
Share of Branded vs Unbranded Fresh Produce $ Sales in US Retailers, 2010 vs. 2016 and CAGRs
Sources: Fresh Facts on Retail Q3 2015, United Fresh and Nielsen; and FMI Power of Produce 2017.
12% 8%2011-16 Year CAGRs:
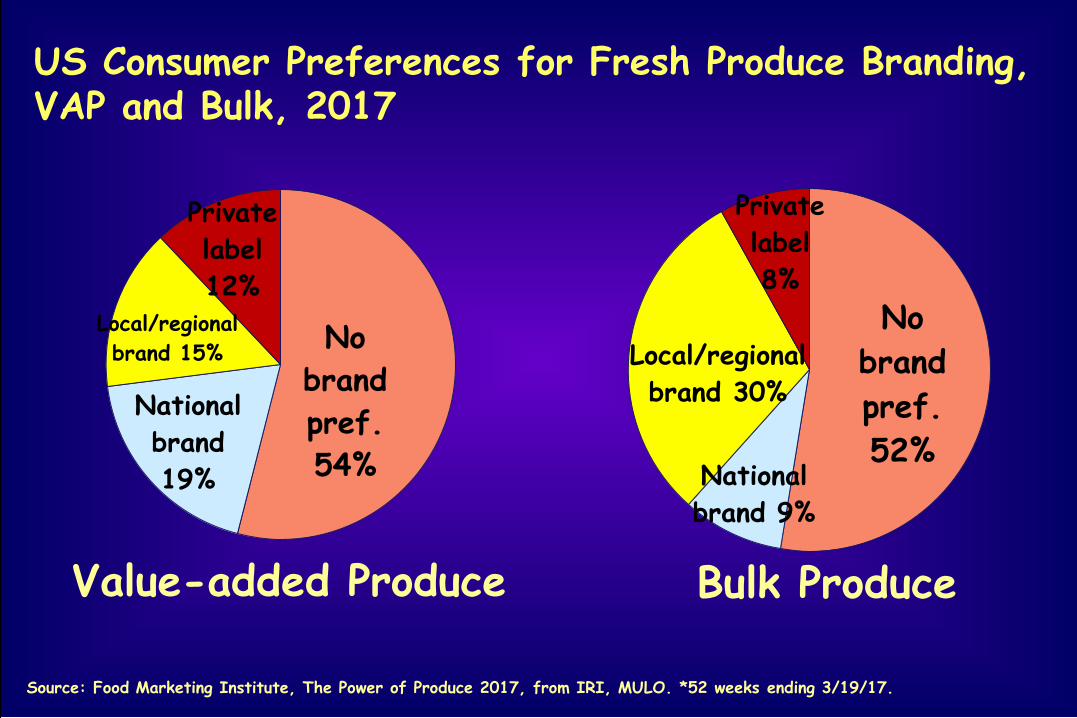
Value-added Produce Bulk Produce
No brand pref.54%
National brand19%
Local/regional brand 15%
Private label12%
No brand pref.52%
National brand 9%
Local/regional brand 30%
Private label8%
US Consumer Preferences for Fresh Produce Branding, VAP and Bulk, 2017
Source: Food Marketing Institute, The Power of Produce 2017, from IRI, MULO. *52 weeks ending 3/19/17.

3
20
36
8 9
2
17
38
37
$ sales
Quantity (lbs) soldOrganic Fruit
Organic Veg
Conventional, Organic and Value-Added Fresh Fruit/Veg Sales in Key US Food Retailers, % Change 2017* vs 2016
Conventional Fruit
Value-Add Fruit
Conventional Veg
Value-Add Veg
Source: Food Marketing Institute, The Power of Produce 2017, from IRI, MULO. *52 weeks ending 3/19/17.

Changing Food Markets and Consumers: Choice and Substitution
Abounds!

Accelerated pace of change in the food marketing system
• New entrants. Channel blurring – retail, foodservice, online – more competition!
• Firms must have clear value propositions.• Shift to “shopper-centrism.”• Price deflation – price wars at retail a threat.• Margin pressure at all levels of the food system!• Growing food safety, traceability, sustainability,
social welfare expectations all increase costs.• Need for major investments in IT systems.• Mergers and consolidation continue, scale is key.

Shifting Grocery Formats: Growth in nontraditional channels has transformed the US grocery industry
Sources: Willard Bishop, various The Future of Food Retailing reports; and for 2016, Inmar Webinar May 17, 2017 for the Food Institute.
Club23%Supercenter
47%
Dollar7%
Drug13% Mass
9%
Military1%
90%50% 48% 44%
8%
16% 15% 16%
2%
34% 37% 40%
1988 2006 2009 2016
Traditional Convenience Nontrad.Dollar Share by Channel
Dollar Share of Food Sales in NontraditionalFormats
Traditional=conventional supermarket, fresh format, ltd assortment, super warehouse, other

New Retailing Positioning Dilemma: USA
Value-Added: hi
Price: hi
Value-Added: lo
Price: lo
SafewayHEB
Ahold
Whole Foods
Aldi
PublixSchnucks
Kroger
Wegmans
Save-A-Lot
Dollar Stores
Costco
Trader Joe’s
Amazon
DelhaizeWal-Mart
Lidl
Meal delivery
Source: Dr. Ed McLaughlin, Cornell
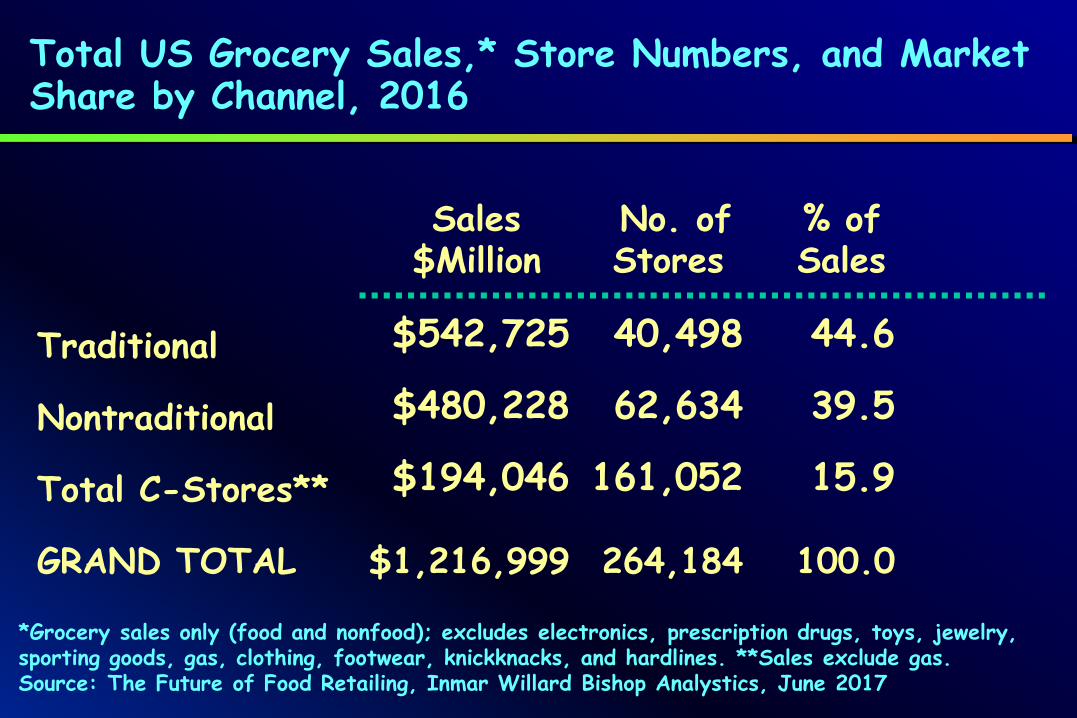
*Grocery sales only (food and nonfood); excludes electronics, prescription drugs, toys, jewelry, sporting goods, gas, clothing, footwear, knickknacks, and hardlines. **Sales exclude gas.Source: The Future of Food Retailing, Inmar Willard Bishop Analystics, June 2017
Sales No. of % of$Million Stores Sales
Total US Grocery Sales,* Store Numbers, and Market Share by Channel, 2016
Traditional $542,725 40,498 44.6
Nontraditional $480,228 62,634 39.5
Total C-Stores** $194,046 161,052 15.9
GRAND TOTAL $1,216,999 264,184 100.0

Wawa C-store Chain Offers Convenient Healthful Produce
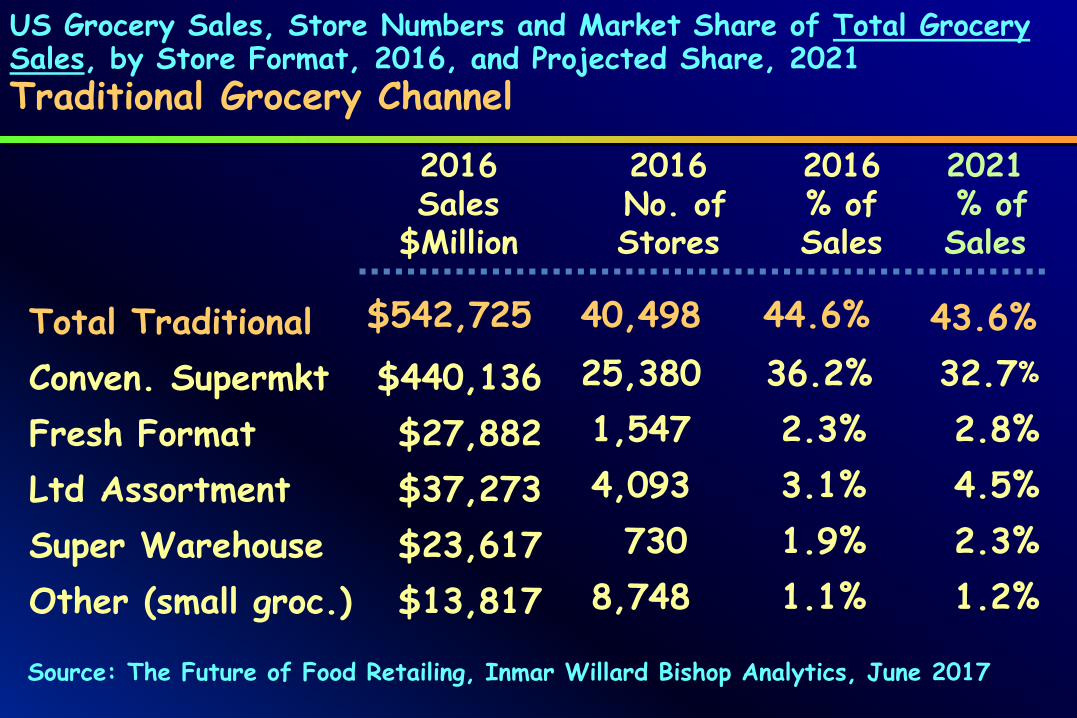
US Grocery Sales, Store Numbers and Market Share of Total Grocery Sales, by Store Format, 2016, and Projected Share, 2021 Traditional Grocery Channel
Source: The Future of Food Retailing, Inmar Willard Bishop Analytics, June 2017
2016 2016 2016 2021Sales No. of % of % of
$Million Stores Sales Sales
Total Traditional $542,725 40,498 44.6% 43.6%Conven. Supermkt $440,136 25,380 36.2% 32.7%
Fresh Format $27,882 1,547 2.3% 2.8%Ltd Assortment $37,273 4,093 3.1% 4.5%Super Warehouse $23,617 730 1.9% 2.3%Other (small groc.) $13,817 8,748 1.1% 1.2%

US Grocery Sales,* Store Numbers & Market Share of Total Grocery Sales, by Store Format, 2016, & Projected Share, 2021Nontraditional Grocery Channel
*Grocery sales only (includes food and non-food); excludes electronics, prescription drugs, toys, jewelry, sporting goods, gas, clothing, footwear, knickknacks, and hardlines. Source: The Future of Food Retailing, Inmar Willard Bishop Analytics, June 2017
2016 2016 2016 2021Sales No. of % of % of
$Million Stores Sales Sales
Total Nontrad’l $480,228 62,634 39.5% 39.6Wholesale Club $109,183 1,472 9.0% 9.7Supercenter $228,331 4,106 18.8% 19.7Dollar Store $33,757 30,496 2.8% 2.8Drug $61,998 23,607 5.1% 4.6Mass $42,627 2,775 3.5% 2.5Military $4,332 178 0.4% 0.4
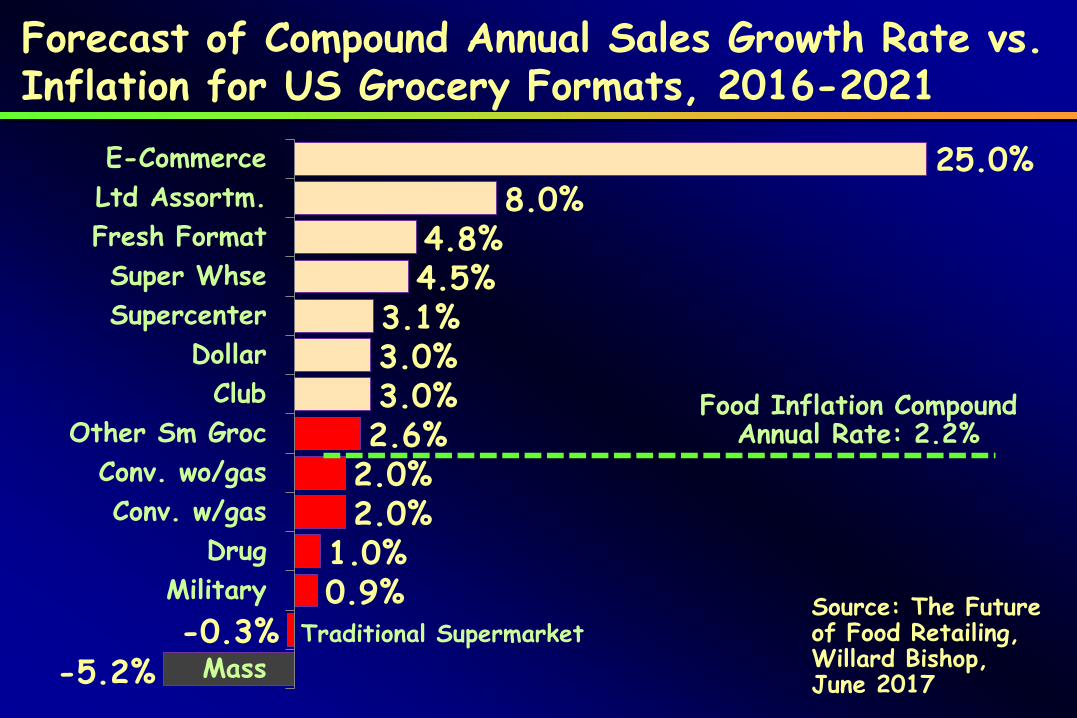
Forecast of Compound Annual Sales Growth Rate vs. Inflation for US Grocery Formats, 2016-2021
Source: The Future of Food Retailing, Willard Bishop, June 2017-5.2%
-0.3%0.9%1.0%2.0%2.0%2.6%3.0%3.0%3.1%
4.5%4.8%
8.0%25.0%
Mass
MilitaryDrug
Conv. w/gasConv. wo/gas
Other Sm GrocClub
DollarSupercenterSuper Whse
Fresh FormatLtd Assortm.E-Commerce
Traditional Supermarket
Food Inflation Compound Annual Rate: 2.2%

Changing Marketing Channels, 2016
• Consumers took ~3% more trips to deep discounters. • Lidl entering market with up to 100 stores in a yr.
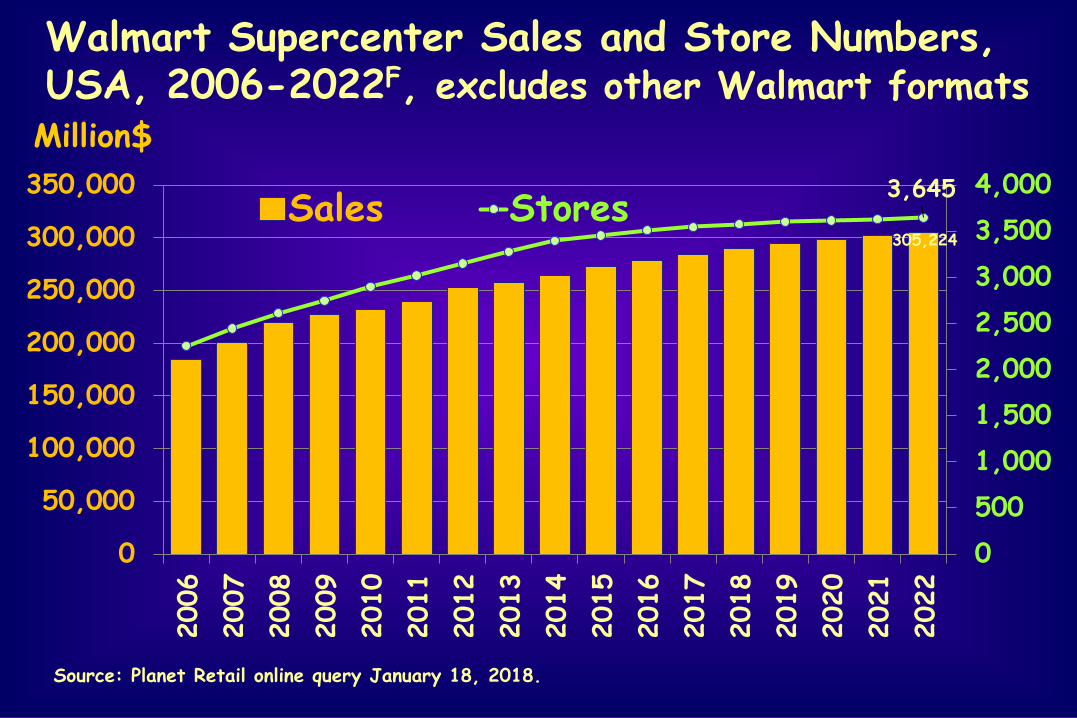
(Reuters). Stumbling blocks.• Aldi controls 1.5% of market, growing 15%/yr vs
Walmart has 22% market share and 2% sales growth expected 2017 (Reuters May 11, 2017).
• Only about 40% of shoppers shop at deep discounters.
• Significant opportunities for growth ahead.• Deep discount and online channels were top
beneficiaries of consumer spend leak from mass merchandisers.
Sources on remainder: Nielsen, June 2017
Million$
Source: Planet Retail online query January 18, 2018.
305,224
3,645
05001,0001,5002,0002,5003,0003,5004,000
0
50,000
100,000
150,000
200,000
250,000
300,000
350,00020
0620
0720
0820
0920
1020
1120
1220
1320
1420
1520
1620
1720
1820
1920
2020
2120
22
Sales Stores
Walmart Supercenter Sales and Store Numbers, USA, 2006-2022F, excludes other Walmart formats
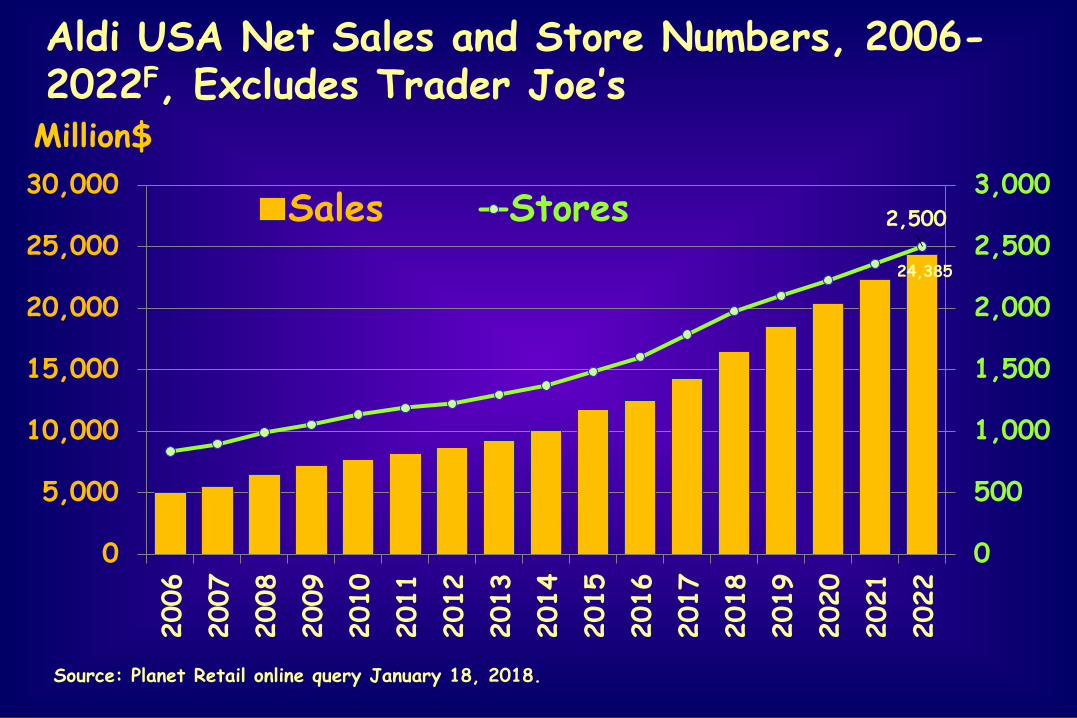
Aldi USA Net Sales and Store Numbers, 2006-2022F, Excludes Trader Joe’sMillion$
Source: Planet Retail online query January 18, 2018.
24,385
2,500
0
500
1,000
1,500
2,000
2,500
3,000
0
5,000
10,000
15,000
20,000
25,000
30,00020
06
2007
2008
2009
2010
2011
2012
2013
2014
2015
2016
2017
2018
2019
2020
2021
2022
Sales Stores

Changing Marketing Channels, Online Sales, 2017
• Amazon acquisition of Whole Foods.• Many grocery retailers engaged in online sales.• 31% of consumers likely to shop online for
groceries. • 23% of consumers already buy groceries online.• Among those shoppers ordering groceries online in
the last 12 months, 47% did so 5 or more times.• Personalization of offers growing.• 2016 food/bev. e-com. sales $33B (4% of total).• Online food shopping may reach $100 billion by
2025 (8% of total food/bev forecast sales).Sources: Inmar Willard Bishop Analytics Webinar May 17, 2017 for the Food Institute; and Inmar Willard Bishop Analytics 2017 Future of Food Retailing.

28%20%
34%
7%11%
Wouldn't buygroceries
online period
Wouldn't buyfresh produceonline period
May buy Would buysome specialty
produce
Would buy forall my produce
Likelihood of Buying Produce Online if Capability Were Available with Your Current Primary Produce Store
Source: Acosta, Inc., The Why behind the Dine 2016.
52% may buy produce online

Rate of Growth in Online Sales by MyWebGrocer
Growth vs. YAGO
% of orders with x in cart
Citrus fruits 126% 15%Peppers and chilis 124% 18%
Lettuce 43% 14%
Broccoli and cauliflower 39% 7%Beans 36% 4%Melons 33% 8%Squash and zucchini 24% 8%
Source: Food Marketing Institute, Power of Produce, 2016.

Basket Data for Online Sales by MyWebGrocer% of orders
with x in cartBananas 43%Onions/garlic; cukes and celery 22% eachTomatoes 21%Apples 19%Grapes 16%Tropical fruits 15% Organic vegetables 14%Source: Food Marketing Institute, Power of Produce, 2016.

Factors affecting demand for fresh produce• Commodity price, consumer income, ethnicity, age,
pop. growth, price and convenience of substitutes and complements, culture/lifestyle/values, credence attributes
• Quality: appearance, flavor, texture, color, shape, size, unique varieties
• Info on produce selection, ripening, recipes• Convenience in prep, usage; packaging role• Consistent availability, year-round supply• Distribution – # stores and shelf-space• Promotion and advertising: trade v. consumer,
generic v. brand; free riders; private label

Annual Growth Rates in $ Sales of Conventional and Organic Produce in Key US Retailers, 2012-2017*
2%
7%3% 3% 3%
18%22%
19%
13%11%
2012 vs 2011 2013 vs 2012 2014 vs 2013 2015 vs 2014 2017 vs 2016
Conventional Produce Organic Produce
Sources: Food Marketing Institute, The Power of Produce, 2016, and 2017. *52 weeks ending 3/19/17.

US Household Penetration Rates for Organically-Grown Fresh Produce, 2017
Yes62%
No28%
Unsure10%
Source: Food Marketing Institute (FMI), The Power of Produce 2017.
More likely to purchase:
Club shoppers 77%
Annual Income >$100K71%
Living in the west 69%
24% of organic buyers are core=15% of all produce buyers

Source: FMI The Power of Produce, 2017.
60%
37%
36%
35%
32%
29%
21%
11%
Free-from pesticides…
Long-term personal health
Less environmental impact
Better taste
Better nutrition
Freshness
For family/kids
Reasons for Buying Organically Grown Fresh Produce at Retail, 2017

Responding to Consumer Preferences: Convenience,Nutrition/Wellness, andPersonalization
New VAV Items Addressing Demand for Convenience, Health and Customization
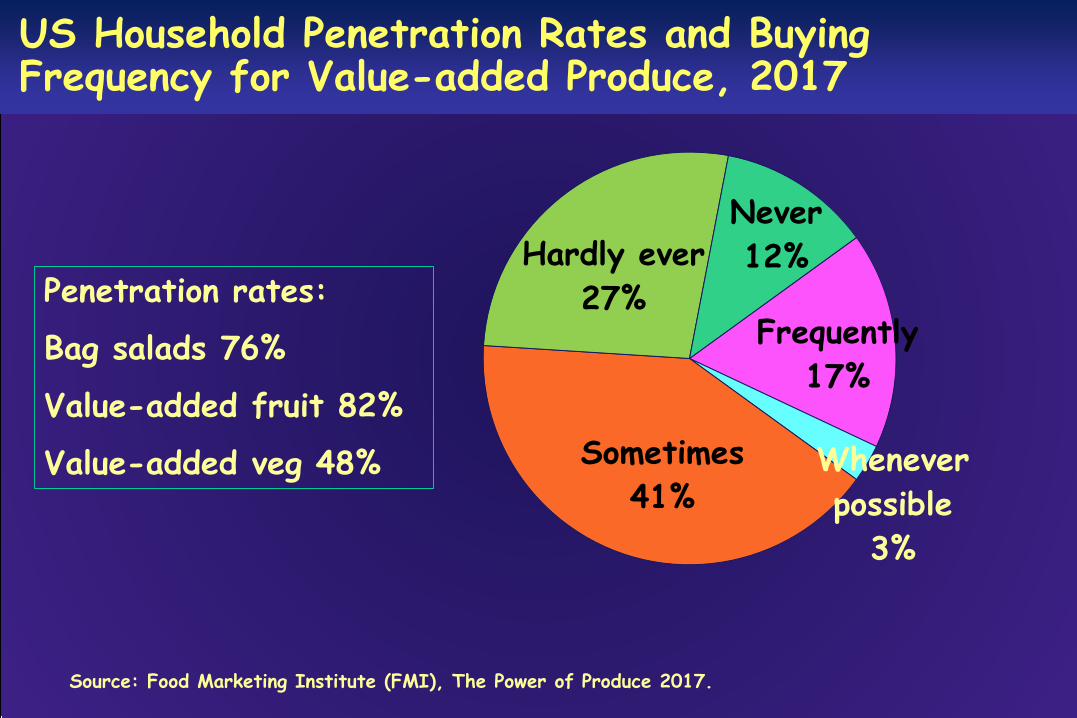
US Household Penetration Rates and Buying Frequency for Value-added Produce, 2017
Frequently17%
Whenever possible
3%
Sometimes41%
Hardly ever27%
Never12%
Source: Food Marketing Institute (FMI), The Power of Produce 2017.
Penetration rates:
Bag salads 76%
Value-added fruit 82%
Value-added veg 48%

Convenience and Organic
• Value-added produce contributed 17% of produce dept sales; lesser share of quantity. (FMI Power of Produce 2016.)
• Both tend to be consumed proportionally more by consumers with higher incomes and educational levels, also millennials.
• Organic share of VAP growing.• Economic and wage/income growth rates have a
major positive influence on produce demand –consumption is positively correlated with income.

Growing demand for organic fresh produce, 2016
• Organic produce sales: $4.46 billion. • Accounted for 9% of produce dept. sales, yet
contributed 30% of all produce growth in sales.• Organic shoppers make 8 more trips to the
grocery store than non-organic shoppers.• Penetration rates are <20% for most items.• >30% of cooking green & carrot $ are organic,
these have the most developed organic sales.• Organic bag salad share of $ bag sales=20%.• Organic berries represent 11% of organic sales.Source: FreshFacts® on Retail, Whole and Fresh Cut Produce Trends: 2016, United Fresh Produce Association and Nielsen, March 2017.
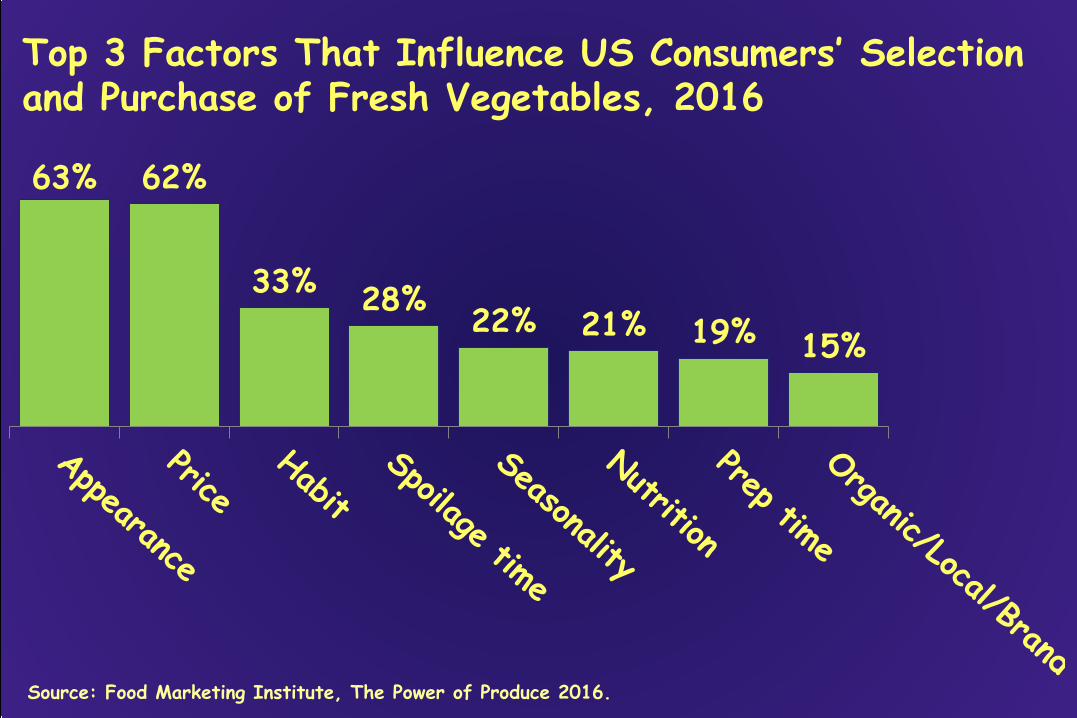
Top 3 Factors That Influence US Consumers’ Selection and Purchase of Fresh Vegetables, 2016
63% 62%
33% 28% 22% 21% 19% 15%
Source: Food Marketing Institute, The Power of Produce 2016.

Definition of “Locally Grown” Products according to Shoppers, 2017
Source: FMI, Power of Produce 2017.
grown in my state 27%
within certain mile radius 36%
grown on family farm
5%
in my town17%
USA 8%Direct from farmer 5%

Source: FMI The Power of Produce, 2017.
80%
73%
44%
41%
27%
24%
21%
19%
Support local economy
Freshness
Knowing where grown
Less environmental impact
Unique product
Knowing farm story
Better nutrition
Better price
Reasons for Buying Locally Grown Fresh Produce at Retail, 2017
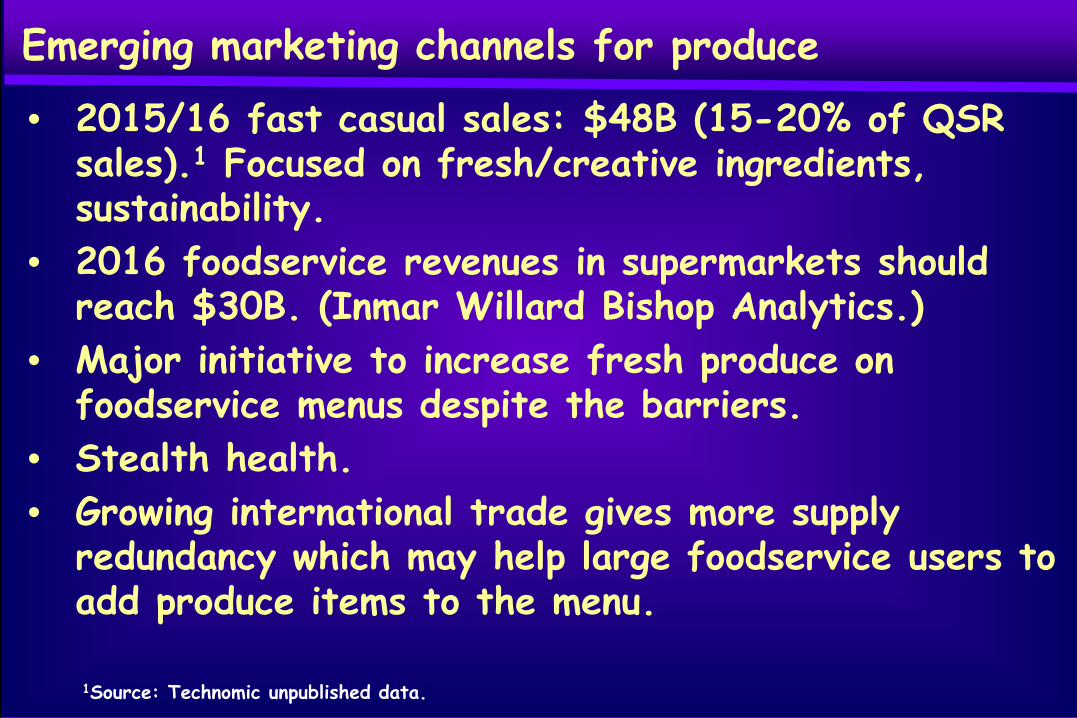
Emerging marketing channels for produce
• 2015/16 fast casual sales: $48B (15-20% of QSR sales).1 Focused on fresh/creative ingredients, sustainability.
• 2016 foodservice revenues in supermarkets should reach $30B. (Inmar Willard Bishop Analytics.)
• Major initiative to increase fresh produce on foodservice menus despite the barriers.
• Stealth health.• Growing international trade gives more supply
redundancy which may help large foodservice users to add produce items to the menu.
1Source: Technomic unpublished data.

Obstacles to Fresh Produce in Foodservice• Cost• Seasonality • Perishability • Price volatility• Seasonal shoulders especially risky• Labor for prep; VAP helps but costs more• Even the largest fresh produce suppliers are
small relative to food manufacturers• Sourcing often not as direct as for retail• Variations in quality, flavor
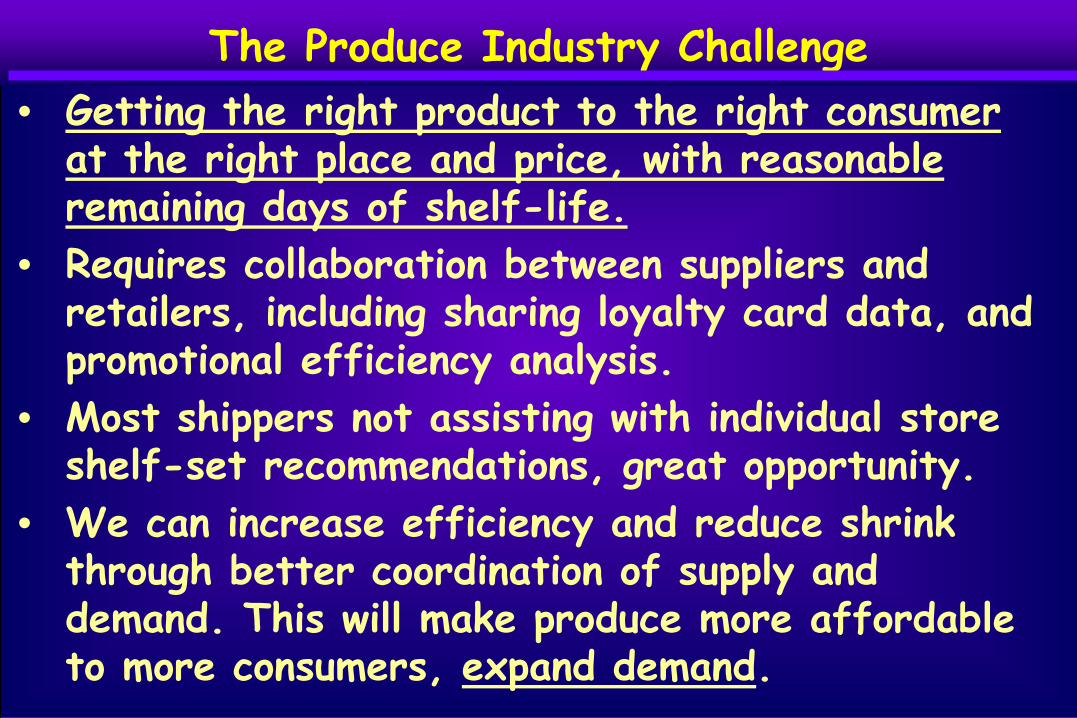
The Produce Industry Challenge• Getting the right product to the right consumer
at the right place and price, with reasonable remaining days of shelf-life.
• Requires collaboration between suppliers and retailers, including sharing loyalty card data, and promotional efficiency analysis.
• Most shippers not assisting with individual store shelf-set recommendations, great opportunity.
• We can increase efficiency and reduce shrink through better coordination of supply and demand. This will make produce more affordable to more consumers, expand demand.

Blueberries

US Retail Fresh Berry Sales, by Type, Share of Dollar Sales and Quantity, 2011*
Dollars Quantity
53%26%
12%7%
3% Strawberry
Blueberry
Raspberry
Blackberry
Other
70%
18%
6%4%2%
Source: Retail Category Trends: Total US, California Strawberry Commission. *IRI/Freshlook data ending October 10, 2011.
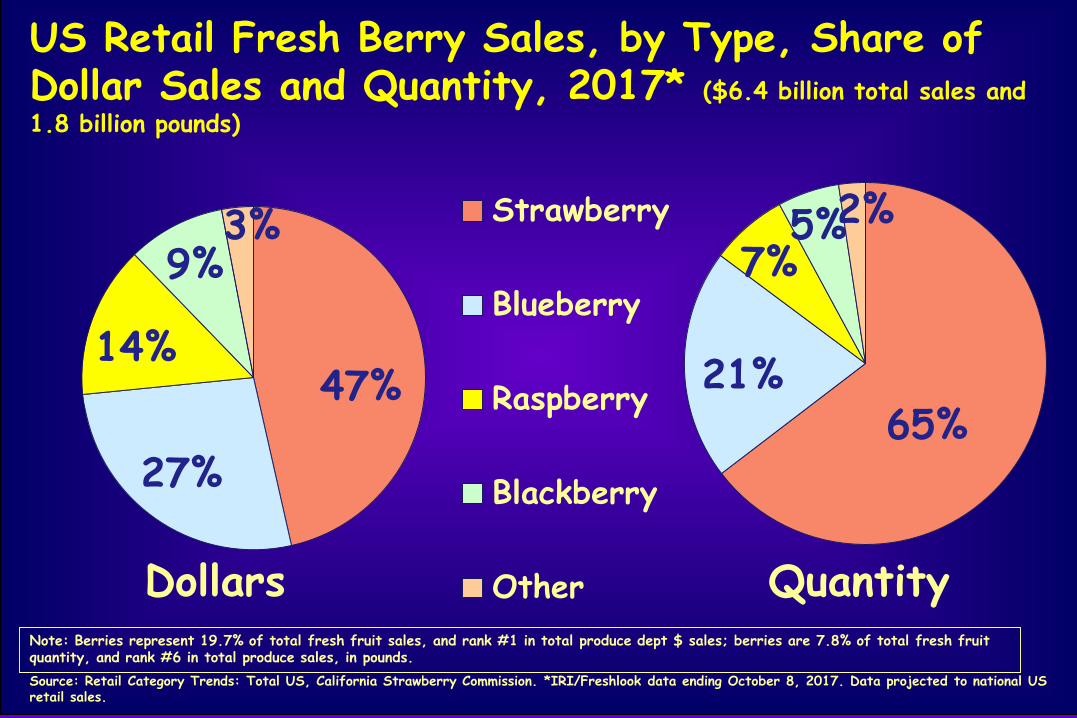
US Retail Fresh Berry Sales, by Type, Share of Dollar Sales and Quantity, 2017* ($6.4 billion total sales and 1.8 billion pounds)
Dollars Quantity
47%
27%
14%
9%3% Strawberry
Blueberry
Raspberry
Blackberry
Other
65%21%
7%5%2%
Source: Retail Category Trends: Total US, California Strawberry Commission. *IRI/Freshlook data ending October 8, 2017. Data projected to national US retail sales.
Note: Berries represent 19.7% of total fresh fruit sales, and rank #1 in total produce dept $ sales; berries are 7.8% of total fresh fruit quantity, and rank #6 in total produce sales, in pounds.

1.8
1.2
0.40.1 0.1 0.05% 6% 7%
-6%
14% 4%
-0.5
0.0
0.5
1.0
1.5
2.0
US Berry Sales, by Type: Quantity Sold and Annual Growth Rates in Key Food Retailers, Lbs, 2017
Billions
Source: Retail Category Trends: Total US, California Strawberry Commission. *IRI/Freshlook data ending October 8, 2017.
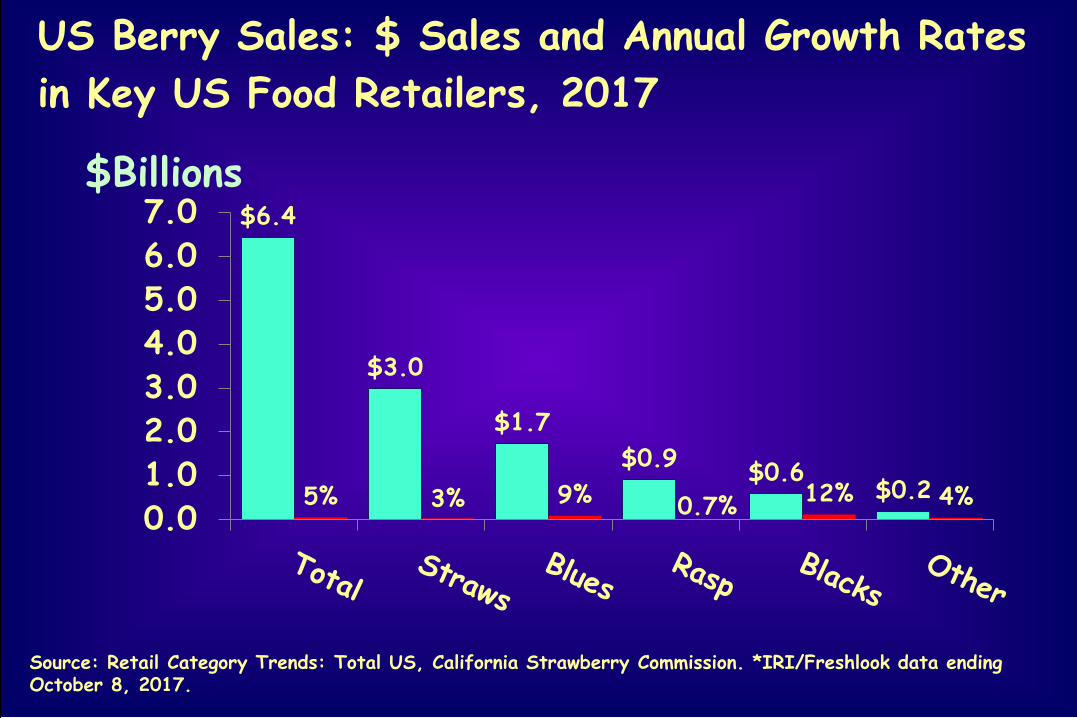
$6.4
$3.0
$1.7 $0.9 $0.6
$0.2 5% 3% 9% 0.7% 12% 4%0.01.02.03.04.05.06.07.0
US Berry Sales: $ Sales and Annual Growth Rates in Key US Food Retailers, 2017
$Billions
Source: Retail Category Trends: Total US, California Strawberry Commission. *IRI/Freshlook data ending October 8, 2017.

US Per Capita Consumption/Disappearance of Fresh Blueberries and Strawberries, 1992-2016
Pounds per capita
Source: 2017 Fruit and Tree Nuts Yearbook, ERS/USDA, October 31, 2017. Includes retail and foodservice.
1.8
8
02468
10
Blueberries Strawberries
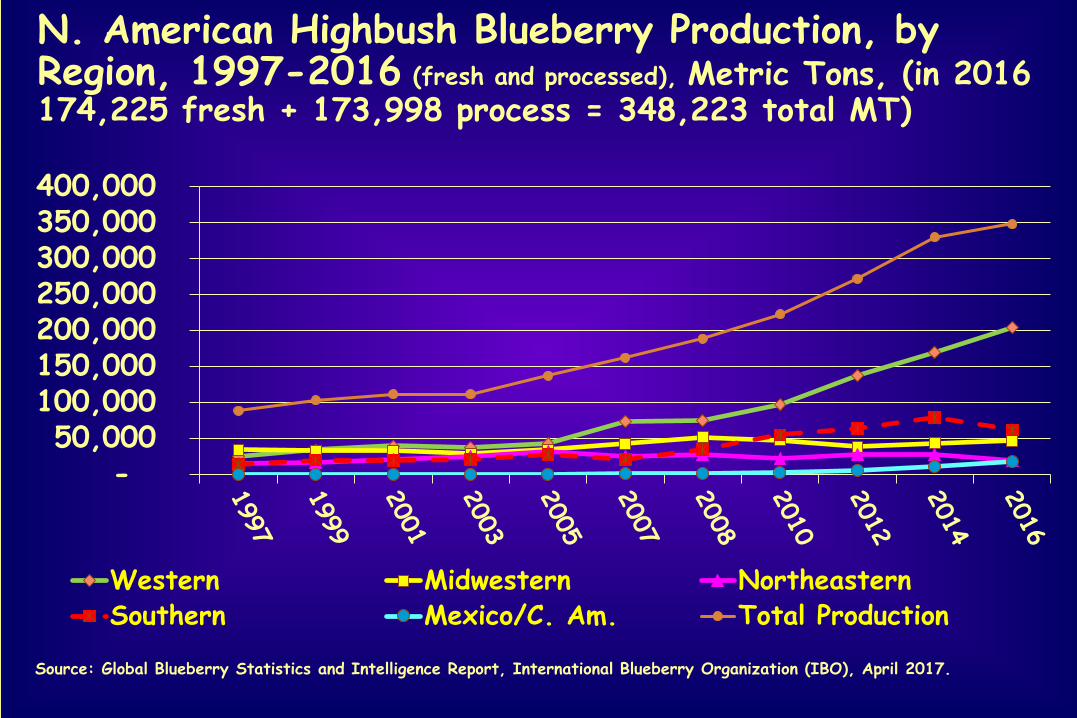
N. American Highbush Blueberry Production, by Region, 1997-2016 (fresh and processed), Metric Tons, (in 2016 174,225 fresh + 173,998 process = 348,223 total MT)
- 50,000
100,000 150,000 200,000 250,000 300,000 350,000 400,000
Western Midwestern NortheasternSouthern Mexico/C. Am. Total Production
Source: Global Blueberry Statistics and Intelligence Report, International Blueberry Organization (IBO), April 2017.

0
50,000
100,000
150,000
200,000
250,000
300,00019
9019
9119
9219
9319
9419
9519
9619
9719
9819
9920
0020
0120
0220
0320
0420
0520
0620
0720
0820
0920
1020
11 2
012
201
3 2
014
201
5 2
016
US Fresh Blueberry Production, Utilization, Imports, and Exports, 1990-2016, MT (260,129 MT in 2016)Metric tons
Consumption
Production
Imports
Exports
Source: 2017 Fruit and Tree Nuts Yearbook, ERS/USDA, October 31, 2017. Includes retail and foodservice.

Metric Tons
Source: GATS/FAS/USDA online data queries.
USA Fresh Blueberry Imports by Key Country of Origin, 1990-2016, (148,911 MT in 2016)
69,930
36,527
11,033
010,00020,00030,00040,00050,00060,00070,00080,000 Chile
Canada
Argentina
Mexico
Other
Note: In 2016, 14,626 MT of Other is Peru vs 5,234 in 2015.
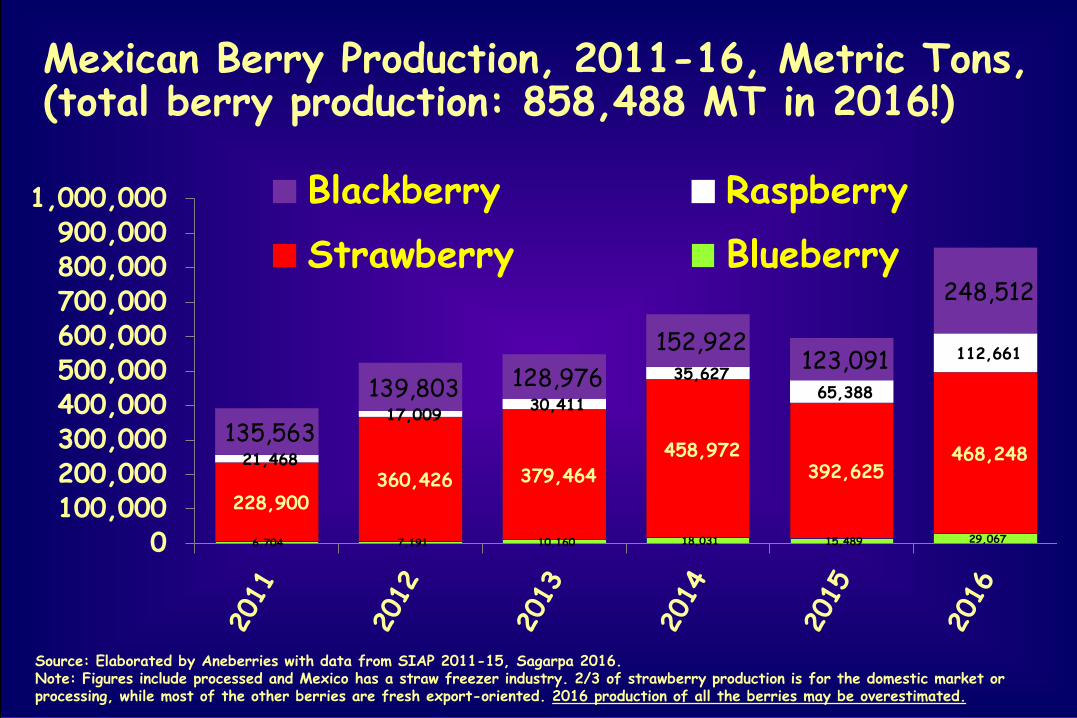
6,704 7,191 10,160 18,031 15,489 29,067
228,900 360,426 379,464
458,972 392,625
468,248 21,468
17,009 30,411
35,627 65,388
112,661
135,563
139,803 128,976 152,922
123,091
248,512
0100,000200,000300,000400,000500,000600,000700,000800,000900,000
1,000,000 Blackberry RaspberryStrawberry Blueberry
Mexican Berry Production, 2011-16, Metric Tons, (total berry production: 858,488 MT in 2016!)
Source: Elaborated by Aneberries with data from SIAP 2011-15, Sagarpa 2016.Note: Figures include processed and Mexico has a straw freezer industry. 2/3 of strawberry production is for the domestic market or processing, while most of the other berries are fresh export-oriented. 2016 production of all the berries may be overestimated.
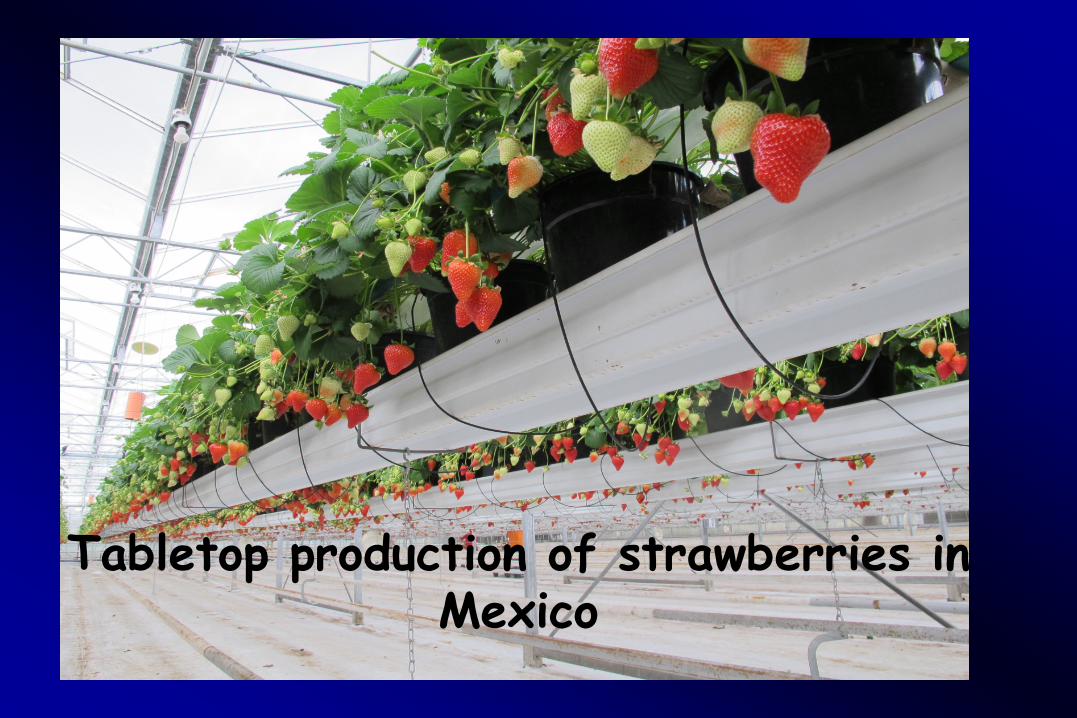
Tabletop production of strawberries in Mexico

• Mexico one of few countries to offer the full berry line for fresh market, and has a long-standing straw freezer industry.
• It has a large domestic market for fresh straws and emerging domestic markets for the other berries.
• Michoacán and Jalisco most important berry states: • Jalisco most important for blues; • Michoacán for straws & blacks; • Jalisco for rasps; • Baja California plays a role in straws & rasps.
Changing Role of Mexico

Mexico

Mexican Fresh Highbush Blueberry Exports, by Key Destination Market, 2016, (17,107 MT total exports)
94%
3%1%
2%USA
Japan
LowCountries
Other
Source: SIAVI 2016.
US$187 million total value

• In 2014, Mexico got market access to China for blackberries and raspberries; in 2017 for blues.
• Several flights/week from Guadalajara to Hong Kong.
• Export volumes to China may reach around 5% of export value but the market is very challenging.
• Chile and Peru have duty-free access for blues while Mexico faces 12-16% duties for blues and ~20% for other berries.
Changing Role of Mexico
• In 2017, Peru’s blue exports surpassed Argentina: Peru= 18% of S. American exports vs 12% Argentina.
• Targeting fall window, before Chile, for now. Can ship August-April if economically attractive.
• In next 5 yrs some experts expect Peru to surpass Chile in fresh exports.
• Most production in north, led by La Libertad. • Peru is going through a rapid learning curve on locations, varieties, cultural practices, postharvest handling, etc.
Peruvian Blueberry Industry
Source: www.ArandanosPeru.pe

Peruvian Fresh Highbush Blueberry Exports, by Key Destination Market, CY2017, (41,329 MT total exports)
44%
26%
11%
10%9%
U.S.
Netherlands
UK
China
Other
Source: http://agraria.pe/noticias/exportaciones-peruanas-de-arandanos-crecieron-15695

• Plants come into production quickly; fast paybacks.• Plants can be pruned to produce almost any time of yr. Large growers can afford to pull out & plant new varieties. With current pruning practices the same plants won’t stay in prod’n for many yrs, so expansion in total production must come from new plantings.
• Most new plantings are open varieties. Biloxi and Ventura are common.
• Land and water are abundant. However, labor is becoming a challenge. Housing is being built.
Peruvian Blueberry Industry

• Production has been dominated by few firms. Foreign investment growing.
• Camposol recently announced a special consumer slogan, “The berry that cares,” showing it’s growing focus on consumers. As of Sept 2017 in Camposol’sQ3 2017 report, blue area planted was 1628 HA.
• Only 68% of Camposol planted area has reached piekyields.
• In October 2017, Chilean blueberry grower-exporter Hortifrut and Talsa merged, now with 2200 hectares total.
Peruvian Blueberry Industry
• Peru can ship by boat to the USA using a cold treatment and avoid fumigation. It can land product in the US with prices below the Argentine cost of production (and still make money).
• Peru will challenge Argentina in the USA and European markets in the fall. Will face competition from S. Africa in Europe.
• Peru got access to China in 2016.• Chile is ahead in servicing Asian markets but both Peru and Chile have duty free access in China, an advantage relative to Mexico.
Peruvian Blueberry Industry

Argentine Fresh Highbush Blueberry Exports, by Key Destination Market, MY2015/2016, (14,921 MT total exports)
65%16%
14%
4% 2% USA
UK
ContinentalEuropeCanada
Asia &Others
Source: Global Blueberry Statistics and Intelligence Report, International Blueberry Organization (IBO), April 2017.

• Federico Baya, new president of the ABC: “the international market has changed and Argentina is preparing for a new global scenario.”
• Changes include more maritime shipments to improve cost competitiveness. ABC forecast for 2017 indicates air shipments may decline to 80% vs almost all in 2015.
• Improvements in varieties, growing practices, logistics, postharvest handling, statistics, internal market, market promotion and buyer communications are underway.
• Int’l campaign “Taste the difference;” & local, “Mejorcon arandanos.”
• Gaining new market access, including China and Japan.
Argentine Blueberry Industry
Sources: Argentine Blueberry Committee (ABC), including https://www.argblueberry.com/home/en/arandanos-argentinos-record-de-exportacion-por-via-maritima/

• Competitive pressure on retailers and foodservice operators means on-going margin pressure for suppliers as well.
• Firms at all levels of the fresh produce supply chain must take management practices to a higher level to improve efficiency and survive on lower margins.
• Information technology will play a growing role.
• Shopper-centrism and targeted marketing to specific segments will grow; social media will help.
• Strategic alignment between suppliers and commercial buyers will grow.
• Fresh produce demand improving along with the economy.
Conclusions