growing evidence for a “divorce divide”? education and ... · in divorce rates. thus, estimates...
TRANSCRIPT
Growing Evidence for a “Divorce Divide”?
Education and Marital Dissolution Rates in the U.S. since the 1970s.
Steven P. Martin
University of Maryland-College Park
* Direct all correspondence to Steven P. Martin, Department of Sociology, 2112 Art-Sociology Building, College Park MD. ([email protected]). I gratefully acknowledge research funding from a Russell Sage Foundation Grant on The Consequences of Social Inequality for Families, Schools, and Communities.
2
Growing Evidence for a “Divorce Divide”? Education, Race, and Marital Dissolution Rates in the U.S. since the 1970s.
Abstract: In this study, I use the Survey of Income and Program Participation (SIPP) and supplementary data to measure trends in marital dissolution rates across educational and racial groups in the United States. From the 1970s to the 1990s, rates of marital dissolution fell by almost half among 4-year college graduates, but remained relatively high and steady among women with less than a 4-year college degree. Such a pattern is consistent with results from censuses and other surveys, appears to be present among both men and women, and persists when I control for shifts in marriage timing and premarital childbearing. The results suggest a growing association between socioeconomic disadvantage and family instability, although the causes of that association are not elucidated.
3
Divorce rates in the United States have fallen somewhat from their unprecedented
high levels in the late 1970s (Goldstein 1999, Schoen and Standish 2001). However, in
the context of increasing inequality in the United States (c.f. Bernhardt, Morris,
Handcock, and Scott 2001), separate shifts in divorce rates for different socioeconomic
groups may be as important as the overall trends. If the recent decline in divorce rates
has been limited to groups already doing well economically, it could have an unfortunate
side effect of increasing the “inequality” of family stability. To the extent that marital
dissolutions contribute to deficits in children’s physical and emotional health, educational
attainment and performance, and adult outcomes (Hetherington and Stanley-Hagan 1997;
Amato 2000; McLanahan and Bumpass 1988; Reifman et al. 2001), a “divorce divide”
has the potential to exacerbate economic inequality across generations.
Evidence for diverging trends in marital dissolution has been mixed. Less
educated persons traditionally have higher divorce rates than the national average (US
Bureau of the Census 1992, White and Rogers 2000). The most comprehensive recent
analysis of trends in the determinants of divorce finds that these educational differentials
are not increasing (Teachman 2002). This result contrasts with earlier studies that found
some increase in the association between women’s educational attainment and marital
stability (c.f. Castro Martin and Bumpass 1989).
Teachman’s 2002 analysis provides the best recent information on trends in
determinants of marital dissolution, but his source data have some potential weaknesses.
The five waves of the National Survey of Family Growth (NSFG) which served as the
data source for the Teachman article contain a rich set of demographic and family
background variables. Unfortunately, the NSFG is administered to women with an
4
average age at interview of less than 31 (range 15 – 44), leaving many respondents with
only a truncated marriage history or no marriage history at all on which to estimate trends
in divorce rates. Thus, estimates of divorce trends based on NSFG data have relatively
wide margins of uncertainty, making it difficult to prove an absence of trend from a
negative finding. In addition, Teachman’s analysis examines trends for marriages formed
from the 1950s through the early 1980s, a time period which overlaps but does not
encompass the period of interest for family researchers interested in possible effects of
increasing economic inequality.
In this paper I reevaluate and update the part of Teachman’s analysis of trends in
marital dissolution rates that examines educational attainment, for women and men who
entered first marriages from the early 1970s to the early 1990s. To increase confidence in
the findings, I examine trends in marital dissolution across several independent survey
sources, as well as results from one percent Census micro-samples. I also use event
history models to examine whether any divergence in marital dissolution rates might be
explained by recent delays in marriage or by the increasing incidence of a first birth prior
to a first marriage among some groups rather than others. My results indicate marital
dissolution rates have fallen dramatically among highly educated men and especially
women, but have remained high and steady among persons with lower educational
attainment.
5
Education and marital stability
Education is the key explanatory variable in this analysis and a commonly used
variable in demographic research on class and socioeconomic differences. In some
respects, educational attainment is a better socioeconomic indicator than income, which
is difficult to measure in retrospective surveys and (for women’s income) is strongly
endogenous with marital stability (Rogers 1999). However, education is also associated
with individual and social variables that may be powerful predictors of marital
dissolution, yet are only indirectly correlated with socioeconomic status or social
inequality. In this section I discuss some of the possible reasons to expect educational
divergence in marital dissolution rates.
From a socioeconomic perspective, there are several reasons to anticipate an
educational divergence in marital dissolution rates. First of all, growing income
inequality has meant that the economic circumstances of families have diverged since the
1970s. Wage inequality from the 1970s to the 1990s appears to be strongly related to
changes in the wage premium associated with a college degree (Morris and Western
1999), and both women’s and men’s incomes have diverged strongly by education in
recent decades (McCall 2000; Blau 1998). Secondly, one could argue that differences in
income and earning potential have become increasingly important predictors of family
stability. As more women have entered the sphere of paid work during their childbearing
and childrearing years, family and household work has increasingly become a commodity
that can be purchased (Bergmann 1986) and a commodity that is disproportionately
purchased by families in the top of the income distribution (Cohen 1998; Meagher 2002.)
6
Based on observations such as these, White and Rogers (2000) have anticipated a
growing class split in divorce rates, most easily measured as a divergence in marital
dissolution across educational levels.
However, it might not be necessary to invoke economic inequality as an
explanation for educational shifts in marital dissolution rates. An alternate explanation for
educational differences in marital stability could be that women and men of different
education levels time their marriages and births later, and that delayed family formation
is more conducive to family stability. Age patterns of family formation have shifted
rapidly and diverged by educational attainment in recent decades (Rindfuss, Morgan, and
Offutt 1996). Also, age at marriage and age at first birth predict marital dissolution rates
more strongly than any other demographic variables (Moore and Waite 1981; Castro
Martin and Bumpass 1989; Heaton 2002). Furthermore, much of the association between
marriage and birth timing and marital stability is explained by maturity and competence
for marital roles (Booth and Edwards 1985), and early studies indicated that for women
who delay marriage and childbearing, age appears to mediate the effects of education on
marital dissolution rather than the other way around (Bumpass and Sweet 1972). In
response to these concerns, I will add age at marriage as a statistical control in the
statistical models.
Educational differences in nonmarital fertility could provide another explanation
for educational differences in marital dissolution rates. Less educated women are the
most likely to bear children outside of marriage, and increasingly so (Elwood and Jencks
2001). As a result, women with lower educational attainment are increasingly likely to
enter marriage having already borne one or more children, and educational differences in
7
marital dissolution rates could indirectly reflect any destabilizing effects of premarital
births on marriages. I can address this concern with a statistical control for childbearing
status at marriage.
Of course, one can posit a counterargument that nonmarital childbearing could
lead to more stable marriage via selection effects. An increasing proportion of women
who do not marry before a first birth may not marry after a first birth either, so some
unions that would have been marriages in the past no longer become marriages. As a
consequence, marriages among less educated women would increasingly exclude the
family unions least likely to stay together, and nonmarital childbearing would tend to
produce an educational convergence in marital dissolution rates. This concern cannot be
directly addressed through statistical controls, because individuals who never marry
cannot appear in a model that predicts divorce. However, one way to assess such
selection effects would be to use a first birth as the basis of analysis rather than a first
marriage, and to count children whose mothers never marry, children whose mothers
marry and then experience a marital dissolution, and children born into a marriage whose
mothers experience a marital dissolution.
A shift in educational attainment itself could provide another explanation for an
educational divergence in marital dissolution rates, and a largely spurious explanation at
that. One could argue that the latent distribution of educational attainment might have a
U-shaped relationship with marital instability, especially for women; women at the low
end of the educational spectrum might have the most difficulty finding quality husbands,
while women at the high end of the educational spectrum might have strong career
attachment and economic independence that weaken their marital commitment.
8
Educational attainment has increased in recent decades, so an increase in the proportion
of college graduates will draw primarily from the middle of that latent distribution with
the most stable marriages. According to this argument, an increase in educational
attainment can create a false impression that educational attainment is becoming a
stronger determinant of marital stability. This concern can be partly addressed by
assessing marital dissolution rates by more detailed education levels and searching for
evidence of a telltale U-shaped distribution of marital dissolutions by education.
Finally, there are possible links between education and marital stability that are
not available for examination in this study. For example, many theorists have attributed
changing divorce rates less to socioeconomic status than to other factors, such as personal
values, the shift from collective to individual interests, and changes in society unrelated
to economic inequality (Bumpass 1990; Popenoe 1993; Espenshade 1985). Such values-
based explanations could predict increasing differences in divorce rates across
educational levels, if college graduates are in some respects the vanguard of a cultural
shift away from divorce, having been the first to access or internalize information about
negative effects of marital dissolution on families.
In summary, a finding of educational divergence in marital dissolution rates
should generate social concern, but it would still leave unresolved the question of how
that divergence is related to increasing economic inequality. Statistical controls for birth
and marriage timing, along with detailed breakdowns of educational attainment and
marriage and childbearing patterns, can help us evaluate some of the most obvious
interpretations.
9
Data and Methods:
In these analyses I use the combined 1996 and 2001 Surveys of Income and
Program Participation (SIPP) (U.S. Census Bureau 2001). The Wave 2 Topical Modules
of the SIPP contain nearly complete marital histories for women and for men, with large
samples to allow tests for interactions between cohort trends and educational attainment.
Fertility histories are only available for women, so covariates for birth timing are only
used in the models for women.
The SIPP marriage history records the years of the first two marriages and the
most recent marriage, along with any accompanying separations, divorces or spousal
deaths, for women and men age 15 and older at interview. I count the reported data of a
separation as the date of marital dissolution. The main analysis includes all respondents
with a first marriage between 1970 and 1994 regardless of race or nativity, for a total
sample size of 24,990 women and 22,406 men. In sensitivity analyses I limited the
universe to U.S. born respondents and to nonhispanic blacks and whites and obtained
substantively equivalent results.
I use educational attainment and year of first marriage as the key explanatory
variables in the analysis. Educational attainment is measured at interview and scaled in
two ways – with a dichotomous variable for whether the respondent has a four-year
college degree, and with a more detailed set of five dichotomous variables. Year of first
marriage is evaluated across five-year categories in the descriptive analyses, and as a
linear trend in the statistical models. The use of education at interview implies that
personal characteristics associated with educational attainment are in some sense
10
permanent across the life course. Such a presumption may bias the results if a marital
dissolution either precipitates or hinders a return to schooling, an endogenous relationship
which may be a particular problem for high school completion or equivalency, or else for
“some” post-high-school college enrollment. I limit most of my analyses to differences
between four-year college graduates and other women.
To describe broad trends in marital dissolution, I employ a Kaplan-Meier life
table procedure to identify the outcome of a marital dissolution within 10 years of a first
marriage. To verify the results for women in the SIPP, I construct Kaplan-Meier life
tables for the June 1985/June 1990/June 1995 Current Population Surveys (CPS) and for
the 1973/1976/1982/1988/1995 cycles of the National Surveys of Family Growth
(NSFG). As a final, imperfect check of the descriptive results, I identify divorced or
separated persons as a percent of ever-married persons age 35-44 from the U.S. Census
Public Use Micro Samples (PUMS) for 1980, 1990, and 2000.
In this study I focus primarily on first marriages. In general, it is not a problem to
exclude subsequent marriages from a statistical analysis, because this restriction has no
selection effect on first marriages. However, unions with a first birth in a second marriage
merit some discussion. In general, subsequent marriages are less stable than first
marriages (Coleman, Ganong and Fine 2000), due to destabilizing effects specific to
second marriages (Booth and Edwards 1992), as well as individual-specific heterogeneity
in people who leave a first marriage, such as “quarrelsome temperaments” and inefficient
skills at searching for a marriage partner (Becker 1981). However, it is not clear whether
standard arguments about remarriage apply to the growing proportion of women who
11
divorce while childless (perhaps in search of a more stable marital relationship in which
to bear and raise children) and then have children in a second marriage.
In the last part of the descriptive analysis, I focus on the stability of marriages
with respect to a first birth. Instead of identifying first marriages that dissolve within ten
years as a percent of all first marriages, I identify all first births that do not involve one
intact marriage through at least the first child’s tenth birthday, as a percent of all first
births. To do this analysis, I combine life tables for the following processes:
1.) First marriages following a nonmarital first birth to a never-married woman.
2.) First marital dissolutions following a marriage following a premarital first birth.
3.) First marital dissolutions following a marital first birth.
4.) Second marriages following a nonmarital first birth to a previously married woman.
5.) Second marital dissolutions following a marriage following a post-marital first birth.
6.) Second marital dissolutions following a first birth in a second marriage.
For each of these processes, I take the observed relative frequency of exposure to
each process and multiply by the relative frequency of outcomes from each process to
arrive at a relative frequency distribution of marital outcomes in the ten years following a
first birth.
In the covariate part of the analysis, I employ Cox proportional hazard models to
estimate coefficients for education, year of first marriage, race, ethnicity, nativity, age at
marriage, and childbearing status at first marriage. (For a review of event history models,
see Cox and Oates 1984.) The event history models identify the coefficient for each
covariate on the yearly rate or hazard of a marital dissolution. I specify the yearly hazard
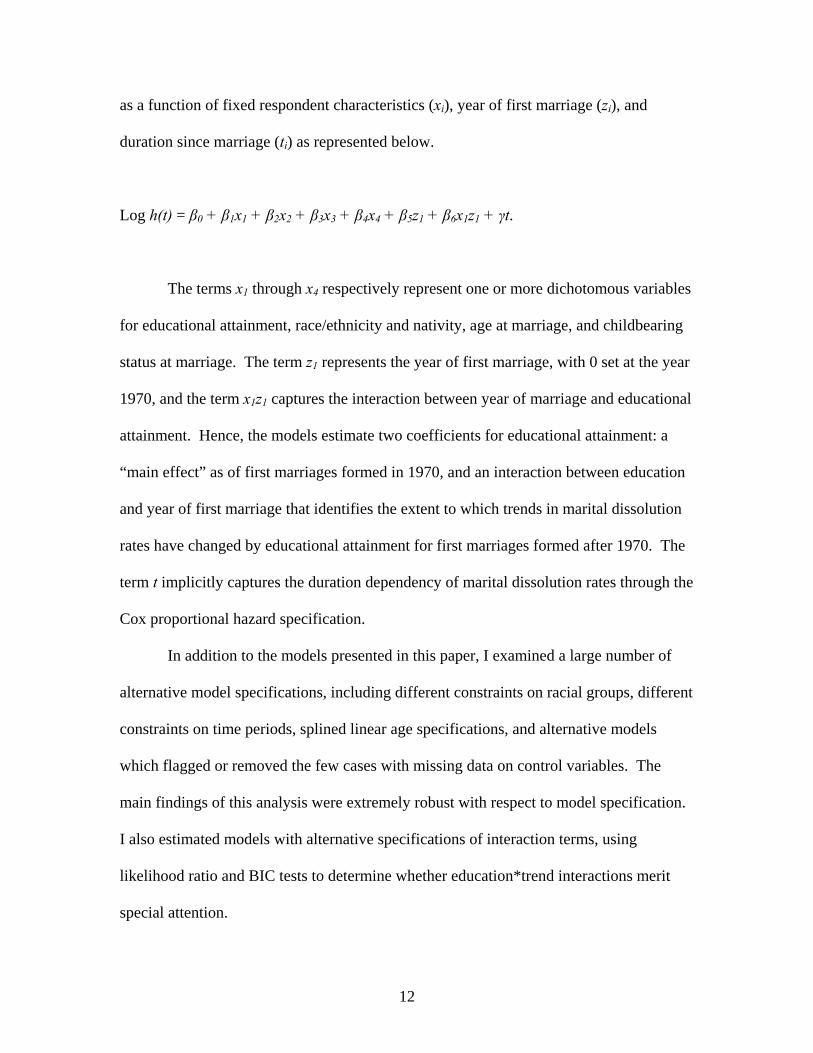
12
as a function of fixed respondent characteristics (xi), year of first marriage (zi), and
duration since marriage (ti) as represented below.
Log h(t) = β0 + β1x1 + β2x2 + β3x3 + β4x4 + β5z1 + β6x1z1 + γt.
The terms x1 through x4 respectively represent one or more dichotomous variables
for educational attainment, race/ethnicity and nativity, age at marriage, and childbearing
status at marriage. The term z1 represents the year of first marriage, with 0 set at the year
1970, and the term x1z1 captures the interaction between year of marriage and educational
attainment. Hence, the models estimate two coefficients for educational attainment: a
“main effect” as of first marriages formed in 1970, and an interaction between education
and year of first marriage that identifies the extent to which trends in marital dissolution
rates have changed by educational attainment for first marriages formed after 1970. The
term t implicitly captures the duration dependency of marital dissolution rates through the
Cox proportional hazard specification.
In addition to the models presented in this paper, I examined a large number of
alternative model specifications, including different constraints on racial groups, different
constraints on time periods, splined linear age specifications, and alternative models
which flagged or removed the few cases with missing data on control variables. The
main findings of this analysis were extremely robust with respect to model specification.
I also estimated models with alternative specifications of interaction terms, using
likelihood ratio and BIC tests to determine whether education*trend interactions merit
special attention.
13
Results
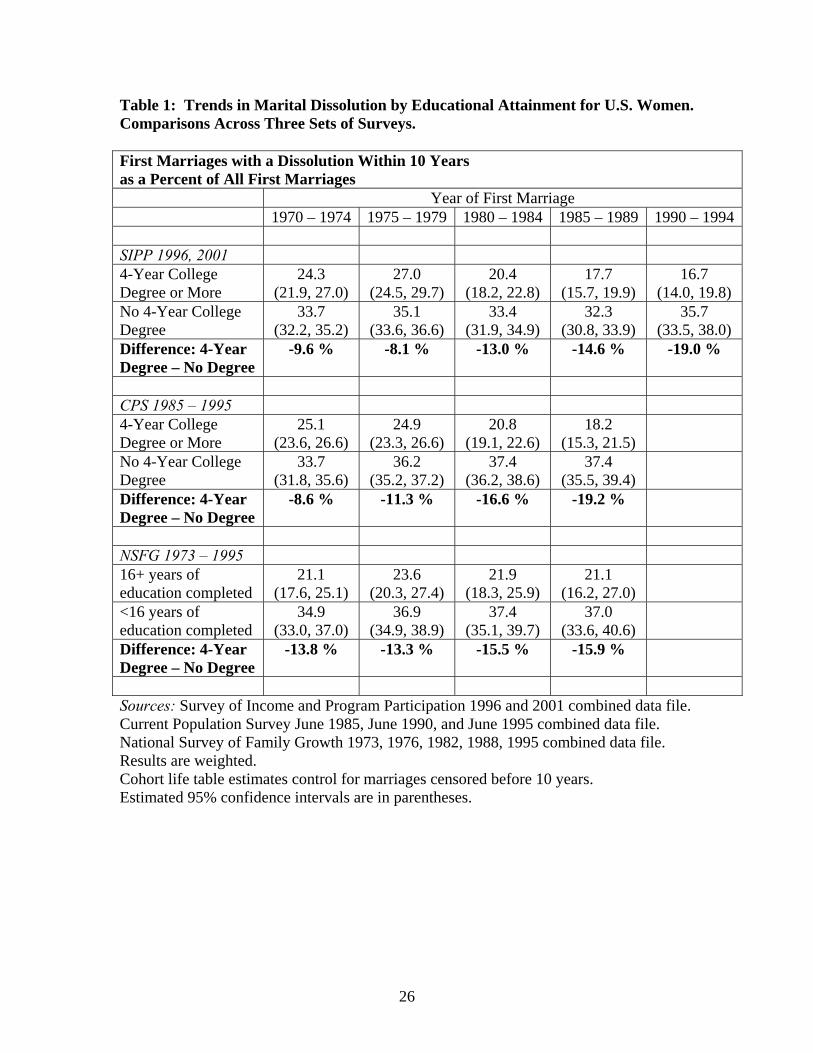
Table 1 shows trends in marital dissolution by educational attainment for U.S.
women in a comparison across three sets of surveys. The results for the 1996 and 2001
SIPP indicate a growing gap in divorce rates between women with a four-year college
degree and women with less than a four-year college degree. Among women married in
1970 to 1974, 24.3 percent of college graduates experienced a marital dissolution within
ten years, compared to 33.7 percent of women with less educational attainment, a
difference of 9.6 percent. For women married in 1990 to 1994, only 16.7 percent of four-
year college graduates experienced a marital dissolution within ten years, compared to a
still high 35.7 percent of women with less educational attainment. As a result, the gap in
marital dissolutions had increased to 19 percent. Thus, the SIPP data suggest that (for
first marriages at least), the overall slight decline in divorce rates since the 1970s has
been a result of rapidly declining divorce rates among highly educated women and high,
stable divorce rates among less educated women.
< Table 1 about here >
Additional results in Table 1 from other sources generally support the trends in
the SIPP data. The marriage and fertility histories from the June Current Population
Surveys for 1985, 1990, and 1995 also suggest that ten-year marital dissolution rates have
become much different for four-year college graduate women than for less educated
women. According to the CPS data, the difference in marital dissolutions by education
increased from 8.6 percent for marriages in 1970 to 1974 to 19.2 percent for marriages in
1985 to 1989. Data from the NSFG series are less convincing, with a difference of 13.8

14
percent for 1970 to 1974 marriages increasing only slightly to 15.9 percent for 1985 to
1989 marriages. However, the results from the NSFG series also have the most
uncertainty, reflected in the widest standard errors. This uncertainty is due in part to a
sample design that interviews women at a younger average age than the other surveys.
Within this wide range of uncertainty, results from the NSFG are generally consistent
with the results from the CPS and SIPP.
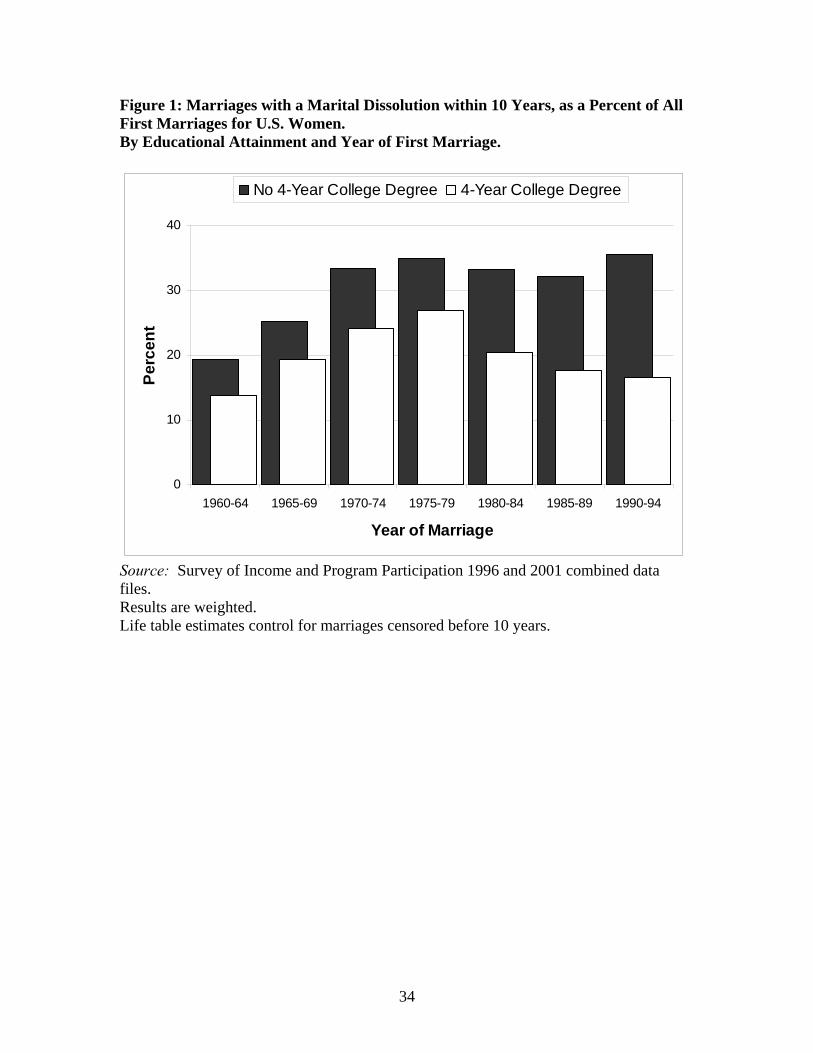
Figure 1 presents in graphic form the results from the SIPP data in Table 1. To
extend the historical context, I have added series for first marriages in 1960 to 1964 and
1965 to 1969, also from the SIPP data. This time series clearly shows that marital
dissolution rates increased for women of all educational levels in the 1960s and 1970s.
However, since the 1970s, marital dissolution rates have declined substantially for
college graduates while remaining about the same for everyone else. As a result, by the
1990s women with a four-year college degree were only about half as likely as other
women to experience a marital dissolution in the first ten years of a marriage.
< Figure 1 about here >
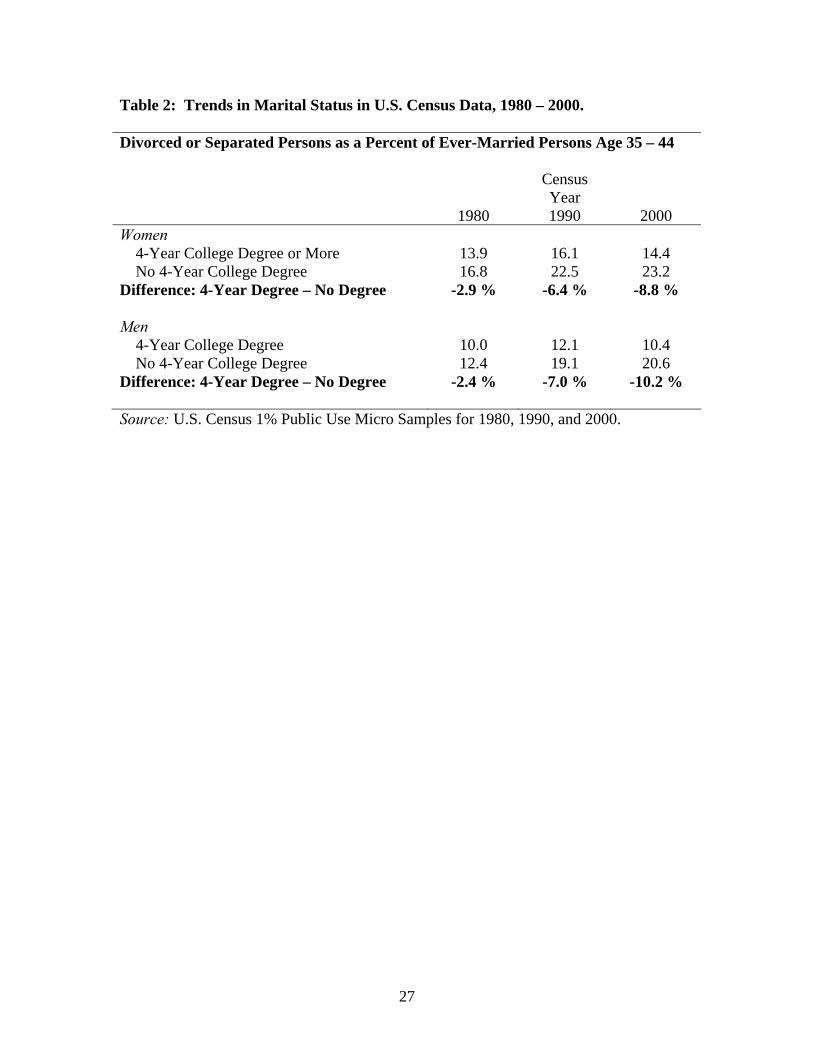
Table 2 shows results from another data source to verify that there is indeed a
growing “divorce divide” by educational attainment. US Census PUMS data from 1980
to 2000 cannot provide a full marital history, but they can identify the current marital
status and educational attainment of census respondents. Census counts of divorced or
separated persons as a percent of ever-married persons age 35 to 44 are fully consistent
with the growing gap in divorce rates suggested by the survey data sources. In 1980,
divorced or separated women represented 13.9 percent of ever-married women age 35 to
44 who were college graduates, compared to 16.8 percent of women with less education,
15
for a difference of 2.9 percent. By 2000, this difference had increased to 8.8 percent.
Results for men show a similar increase in the divorce divide from 1980 to 2000, from
2.4 percent to 10.2 percent.
< Table 2 about here >
The results so far demonstrate a growing gap in marital dissolution rates between
college graduates and persons of lower educational attainment. Next I examine whether
this same pattern is evident across a more detailed classification of education levels.
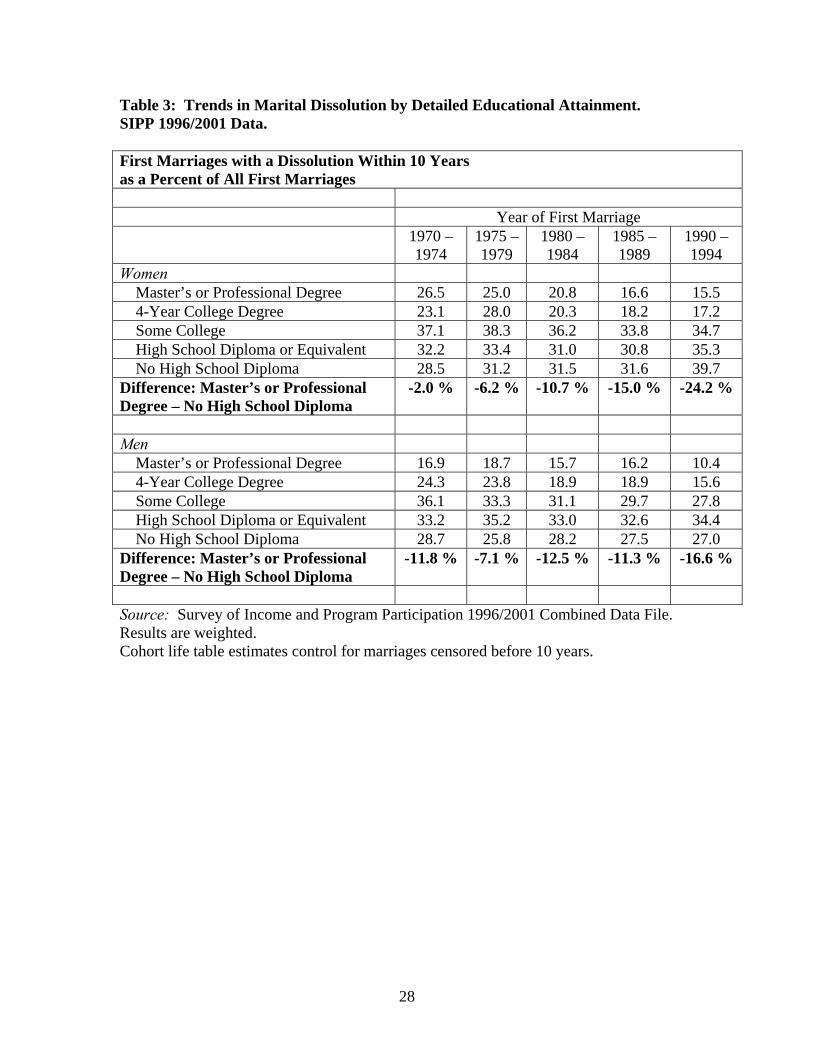
Table 3 shows trends in marital dissolution rates, broken down by detailed educational
attainment for the SIPP data. If anything, the detailed education categories magnify the
divergence in marital dissolution rates. Among women married in 1970 to 1974, 26.5
percent with a master’s or professional degree at interview experienced a marital
dissolution within ten years, compared to 28.5 percent of women with no high school
diploma, a difference of only 2.0 percent across the spectrum of educational categories.
For women married in 1990 to 1994, only 15.5 percent of master’s or professional degree
recipients experience a marital dissolution within ten years, compared to 39.7 percent of
women with no high school diploma, a gap of 24.2 percent. Results for men show a less
clear pattern of divergence over time, with a difference in marital dissolution rates
increasing from 11.8 percent for men married in 1970 to 1974 to 16.6 percent for men
married in 1990 to 1994. Results for men also show slightly fewer marital dissolutions
than for women; this difference might reflect a slightly higher proportion of second
marriages for men that are first marriages for women than first marriages for men than
are second marriages for women, or it might simply reflect sex differences in the quality
of response data.

16
< Table 3 about here >
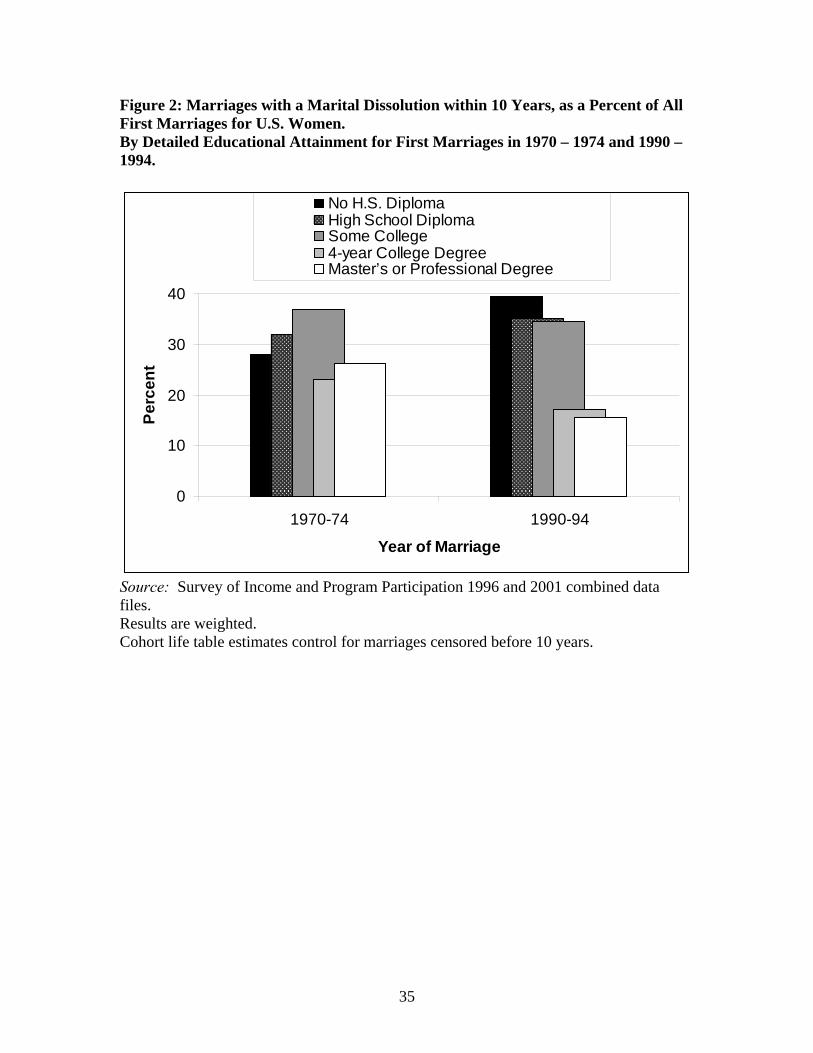
Figure 2 presents selected results from Table 3, showing marriages with a marital
dissolution within 10 years as a percent of all first marriages for women married in 1970
to 1974, compared to women married in 1990 to 1994. In both time periods one can see a
relationship between lower educational attainment and higher marital dissolution rates,
but that pattern has become more pronounced and more consistent by the 1990s.
Figure 2 also provides little or no support for the idea of a “U-shaped” distribution
of marital instability by education. An increasing number of college graduates in the
1990 to 1994 cohort would presumably be similar in latent characteristics to women with
some college education in 1970 to 1974, who in contrast to the argument of a “U-shaped”
distribution actually had quite high marital dissolution rates (although attainment of some
college education might be partly endogenous with marital dissolution).
< Figure 2 about here >
I now shift the focus from marital instability in the context of first marriages to
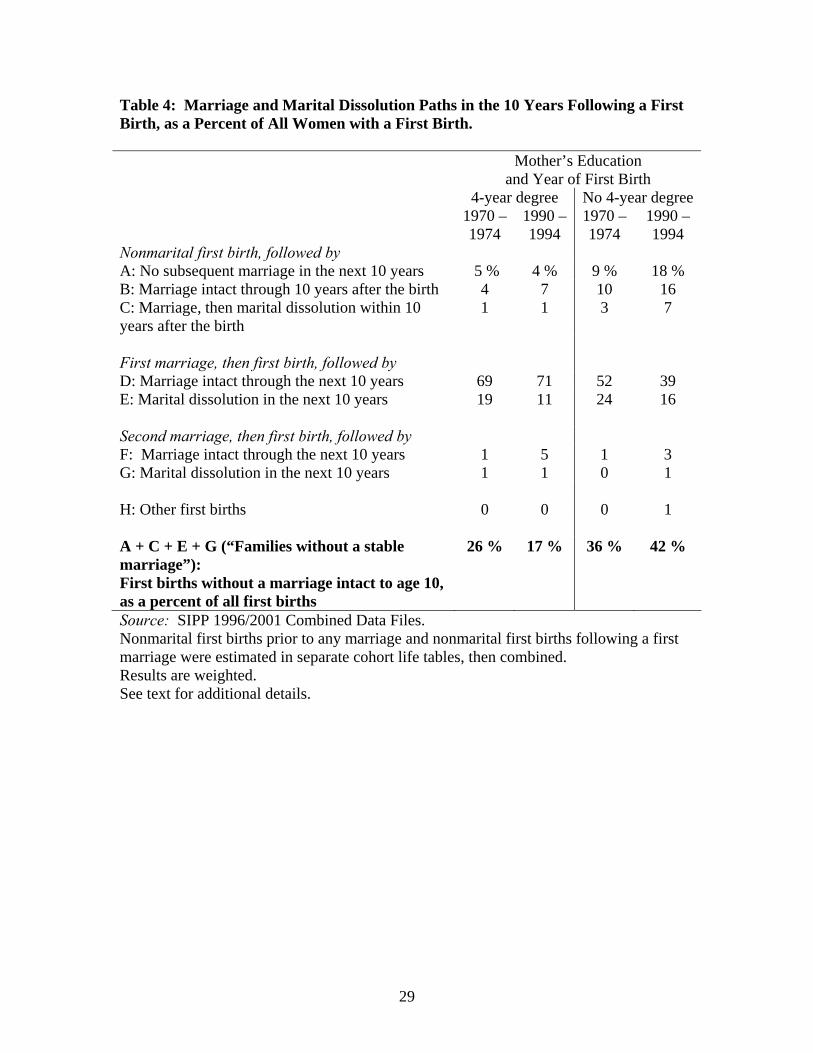
family instability in the context of first births. Table 4 shows a breakdown of the
marriage and marital dissolution paths in the ten years following a first birth. The first
two columns show results for women with a four year college degree. Results for college
graduates show the increasing diversity in family formation paths since the 1970s, as
nonmarital first births increased from 10 percent of all first births (5 + 4 + 1) to 13
percent of all first births ( 4 + 7 + 1 ), while births in a second marriage increased from
just 2 percent of all first births ( 1 + 1 ) to 6 percent of all first births ( 5 + 1). The
percent of first births with no subsequent marriage in the next ten years remained about
the same at 4 to 5 percent of all first births. Despite this increase in diversity of paths, the
17
outcomes for first births to college graduates were increasingly stable across this time
period. First births without one marriage intact over ten years decreased from 26 percent
of all first births (5 + 1 + 19 + 1) to 17 percent of all first births ( 4 + 1 + 11 + 1).
< Table 4 about here >
In comparison, the results from columns three and four show that first births to
less educated women have been marked by increased diversity and decreased stability.
Nonmarital first births increased from 22 percent (9 + 10 + 3) to 41 percent (18 + 16 + 7)
or all first births, and the percent of first births with no subsequent marriage by age 10
doubled from 9 to 18 percent of all first births. This increase in childbearing and
childrearing outside of marriage suggests that married families are an increasingly
selected subset of all families where the mother has less than a four-year college degree.
Hence, stable or slightly increasing divorce rates among the increasingly selected
population of less educated married mothers reflect a substantial increase in overall
family instability, as first births without a marriage intact to age 10 increased from 36
percent of all first births (9 + 3 + 24 + 0) to 42 percent of all first births (18 + 7 + 16 + 1).
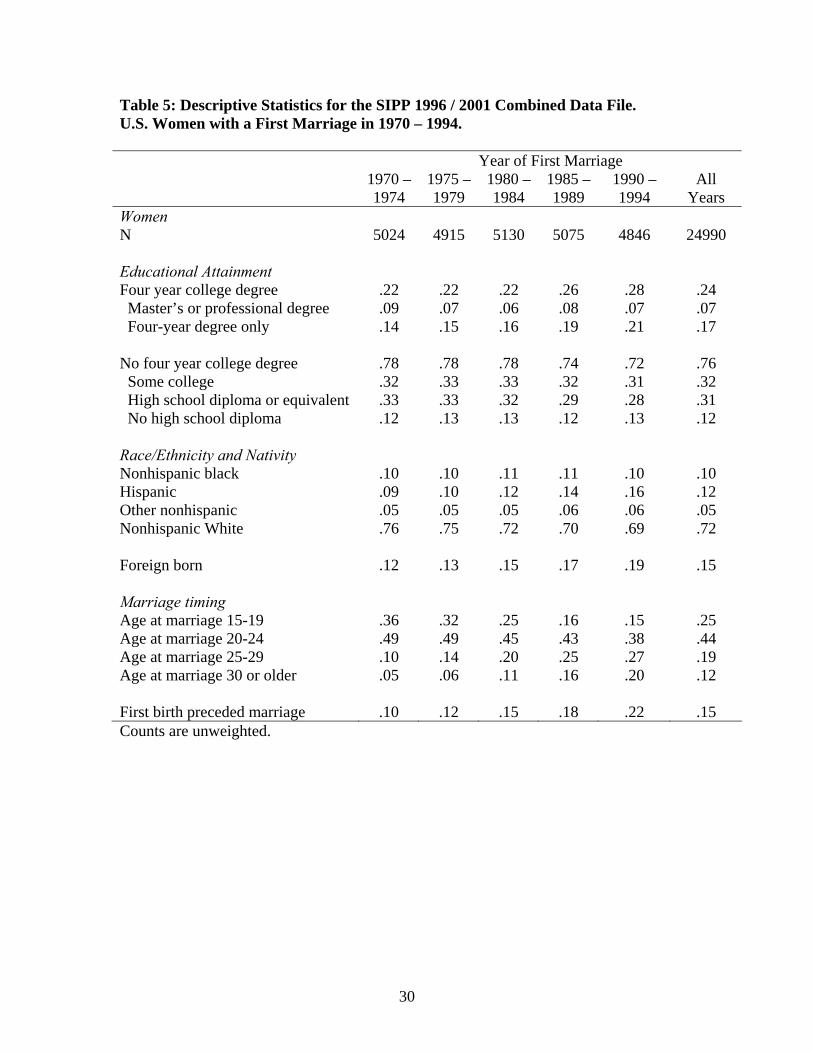
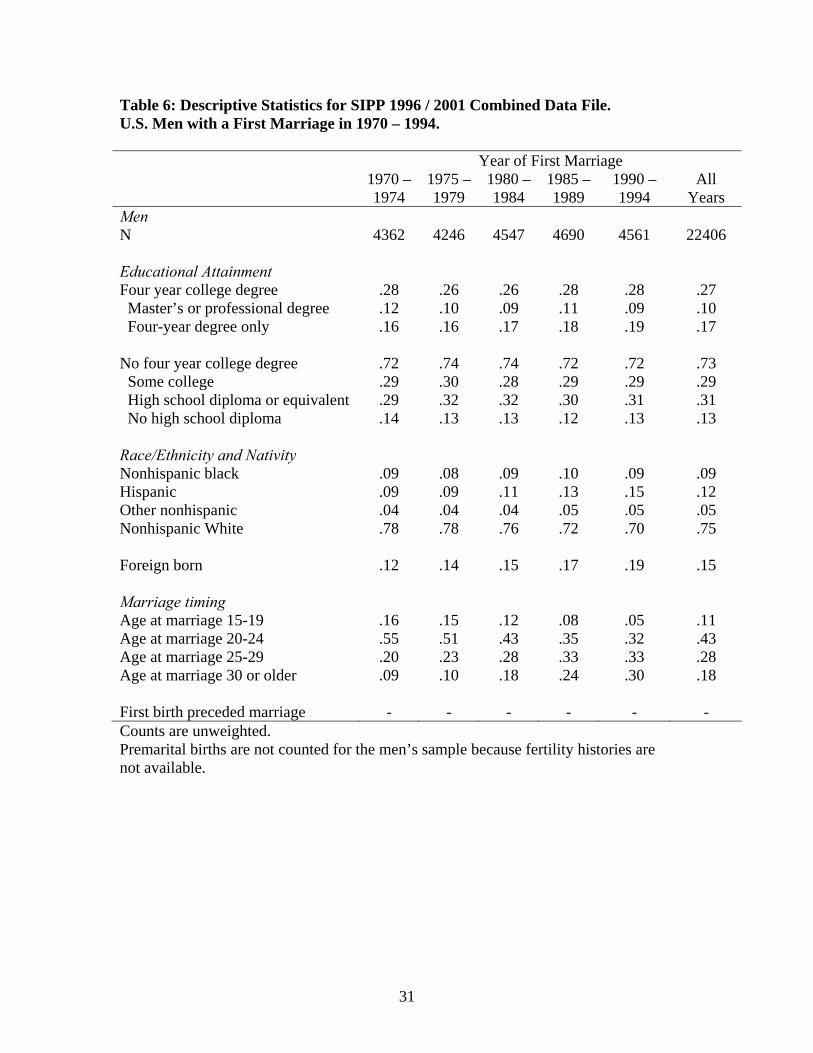
Tables 5 and 6 describe the unweighted statistics for the variables in the cox
hazard models. It is worth noting that four-year college graduates have increased as a
proportion of women in the sample, from .22 for the 1970 to 1974 first marriage cohort to
.28 for the 1990 to 1994 first marriage cohort. This shift could explain some of the
increase in marital stability of college graduates if the added .06 represents a draw from a
latent distribution of women particularly oriented or suited to stable marriages. However,
as I previously noted, patterns in Figure 2 do not support this interpretation. Furthermore,
the proportion of women reporting a master’s or professional degree has remained
18
relatively stable over time, yet this group shows the most pronounced decline in marital
dissolution rates in Figure 2.
< Tables 5 and 6 about here >
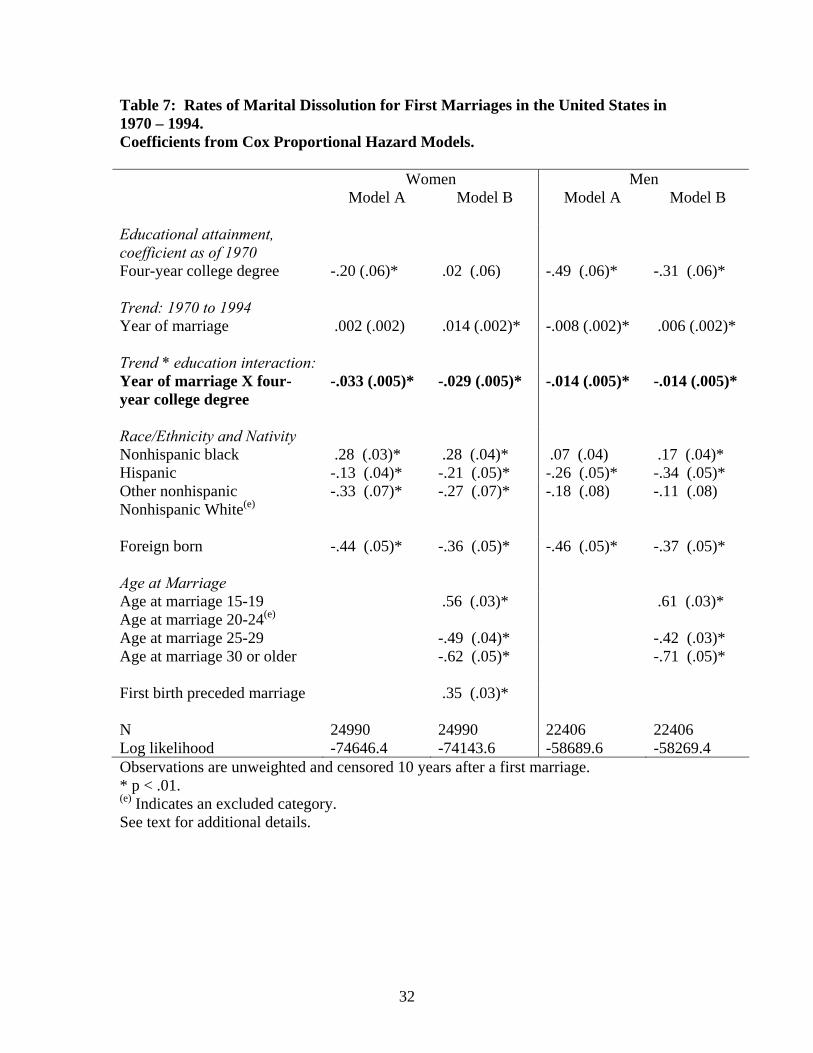
Table 7 shows the results from Cox proportional hazard models of marital
dissolution rates for women’s and men’s first marriages in the United States formed in
1970 to 1994. Model A for women in the first column estimates coefficients for
education, year of marriage, race and nativity. The coefficient for educational attainment
of -.20 indicates that for first marriages in1970, women with a four-year college degree
had marital dissolution rates exp(-.20) or 0.82 as high as for women with no four-year
college degree. The main effect of year of first marriage is essentially zero (.002),
indicating that marital dissolution rates were mostly flat for women with no four year
college degree from the 1970s through the 1990s. The interaction term of -0.033 for year
of marriage X four-year college degree indicates that marital dissolution rates have been
dropping for college graduates relative to other women by over three percent each year, a
substantial drop across a 24-year span.
< Table 7 about here >
Model B adds covariates for age at marriage and for marriages preceded by a
nonmarital birth. In this model, the main effect of education disappears, suggesting that
educational differences in marital dissolution rates in the 1970s may have been due to
later marriages and fewer premarital births among college graduates. The main trend
effect of year of first marriage also changes dramatically from model A to model B,
suggesting that were it not for a mitigating increase in average age at marriage, marital
dissolution rates among less educated women might have increased dramatically since
19
the 1970s. Finally, the interaction term for year of marriage * four-year college degree is
slightly reduced at -0.29, but is largely unchanged and still strongly statistically
significant. This result suggests that the increasing divergence in marital dissolution rates
is not simply a result of trends in marriage and birth timing.
The third and fourth column in Table 7 show results from Cox proportional
hazard models of marital dissolution rates for men’s first marriages. In the results for
men, the coefficients for educational attainment as of 1970 are more strongly negative (
-.49 in model A) than the corresponding results for women, indicating that high education
has consistently been a strong predictor of marital stability for men. The interaction term
for year of marriage * four-year college degree (-.14 in model A) is negative and
statistically significant for men, but not as strongly negative as the corresponding
coefficient for women. Hence, results for both men and women provide evidence for a
growing educational divergence in marital dissolution rates, but the evidence is stronger
for women.
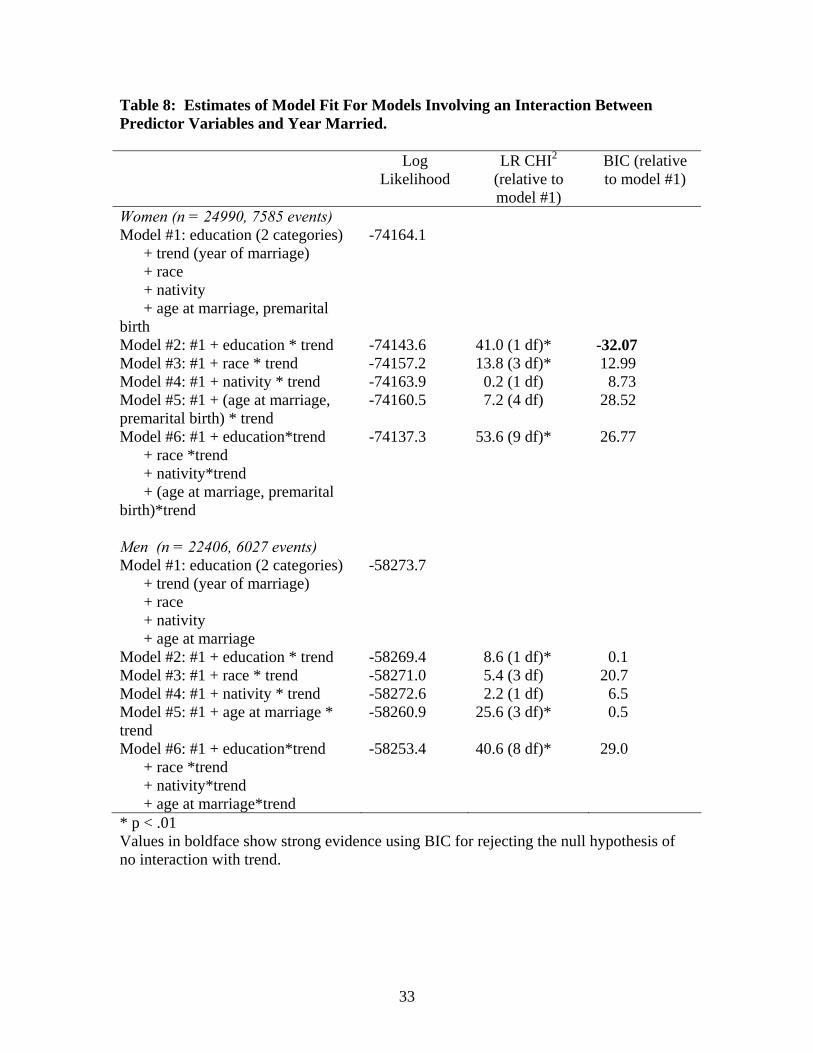
Table 8 has estimates of model fit for a number of supplementary analyses
involving trend interactions. Model #2 in Table 8 corresponds to Model B in Table 7. In
the sample of women, Model #2 clearly has the best model fit; an education*trend
interaction term is justified both by a likelihood ratio test and by a comparison of BIC
statistics. Furthermore, the models for women indicate little or no shift in the other
predictors of marital dissolution. In the sample of men, Model #2 is justified according to
a likelihood ratio test, but a BIC comparison indicates that the education*trend
interaction term provides only a borderline improvement in model fit over a model with
no interaction terms. In addition, Model #5 for men shows a possible interaction between
20
year of marriage and age at marriage. (The coefficients for Model #5 suggest that men
who marry at older ages still have relatively low marital dissolution rates, but the
differences by age are becoming less pronounced over time.)
< Table 8 about here. >
Discussion To update and test Teachman’s 2002 finding of no significant shifts in the
determinants of marriage, this analysis has used a wider array of data, a more recent time
period, and a focus on one particularly important determinant of marriage – educational
attainment. I find that from 1970 through the 1990s, educational attainment became an
increasingly important predictor of marital stability.
In the early 1970s, a four-year college degree predicted relatively low marital
dissolution rates for men and to a lesser extent for women. At least in part, this effect of
educational attainment was explained by college graduates’ later ages at marriage and
lower probability of a premarital birth.
Since the late 1970s, marital dissolution rates have declined, but only for
individuals with a four year college degree, and perhaps especially for women with a four
year college degree. For the majority of U.S. men and women with no four-year college
degree, marital dissolution rates have not declined at all, and would likely have risen but
for the fact men and women of all educational levels tended to marry at later ages.
Educational divergence since 1970 is not explained by delays in marriage, by increases in
nonmarital childbearing, or by shifts in women’s educational attainment.
21
These findings have particularly important implications for families with children.
Marital dissolutions certainly affect the divorcing adults, but the effects on children are
generally more profound and a subject of much greater social interest (Eastman 1996,
Popenoe 1993, Amato 2000). Furthermore, when one accounts for the increasing
proportion of children whose mothers do not marry within ten years of a first birth, the
character of the diverging trends becomes more disturbing. Educational divergence in
divorce rates might be considered a benign sort of inequality, in that the advantaged
group is doing better but the disadvantaged group is doing no worse. The divergence in
stable married families with children, however, is such that families with highly educated
mothers and families with less educated mothers are clearly moving in opposite
directions, and the disadvantaged group is indeed doing worse.
This study has demonstrated a divergence in marital dissolution rates that is
concurrent with the rise in social inequality in the United States, but I have not identified
the causal relationships that might be involved. Further inquiry into the association
between inequality and marital instability can have a special bearing on recent policy
programs aimed at promoting marriage and discouraging divorce. Many new and
proposed policies advocate removing incentives for nonmarital childbearing and divorce
in government programs and divorce laws (Bogenscheider 2000), educating couples
about the benefits of marriage and costs of divorce (Waite and Gallagher 2000; Waite,
Browning, Gallagher, Luo, and Stanley 2002), and advancing family-oriented values by
creating special categories of committed “covenant” marriages (c.f. Sanchez, Nock,
Wright, and Gager 2002). Such programs emphasize individual decisions in marriage
and divorce and downplay the causal importance of social and economic circumstances.

22
A prima facie interpretation of diverging marital dissolution rates would suggest
the opposite; that economic circumstances are becoming more important to marriage
outcomes and marriage formation, relative to individual decisions. The results of this
study thus lend some support to arguments that improving the circumstances of fragile
families is the best way to increase marital stability (c.f. Ooms 1998), and that relatively
poor odds of a successful marriage are deterring socioeconomically disadvantaged single
mothers from marriage (c.f. Edin 2000). However, the results of this study could also be
fully consistent with the theory that college graduates are the vanguard of a cultural shift
away from divorce. Hence, we should not draw firm conclusions until we have a better
understanding of the association between socioeconomic trends and marital trends. By
demonstrating that such an association exists, this paper will hopefully spur
investigations into why the association exists.

23
References: Amato, Paul R. 2000. “The Consequences of Divorce for Adults and Children.” Journal of Marriage and the Family 62:1269-1287. Becker, Gary S. 1981. “A Treatise on the Family.” Cambridge, Massachusetts: Harvard University Press. Bernhardt, Annette, Martina Morris, Mark S. Handcock, and Marc A. Scott. 2001. Divergent Paths: Economic Mobility in the New American Labor Market. New York: Russell Sage Foundation. Bergmann, Barbara R. 1986. The Economic Emergence of Women. New York: Basic Books. Blau, Francine D. 1998. “Trends in the Well-Being of American Women, 1970-1995.” Journal of Economic Literature 36:112-165. Bogenscheider, Karen. 2000. “Has Family Policy Come of Age? A Decade Review of the State of U.S. Family Policy in the 1990s”. Journal of Marriage and the Family 62(November):1136-1159. Booth, Alan, and John Edwards. 1992. “Starting Over: Why Remarriages are More Unstable.” Journal of Family Issues 13:179-194. Booth, Alan, and John Edwards. 1985. “Age at Marriage and Marital Instability.” Journal of Marriage and the Family 47(February): 67-75. Bumpass, Larry L. and James A. Sweet. 1972. “Differentials in Marital Stability.” American Sociological Review 37(4):754-766. Bumpass, Larry L. 1990. “What is Happening to the Family? Interactions between Demographic and Institutional Change.” Demography 27(4): 483-498. Bush Administration. 2002. “Working Toward Independence.” White House News Release: http://www.whitehouse.gov/news/releases/2002/02/welfare-reform-announcement-book.pdf Castro Martin, Teresa, and Larry Bumpass. 1989. “Recent Trends in Marital Disruption.” Demography 26(1): 37-51. Cohen, Philip. N. 1998. “Replacing Housework in the Service Economy: Gender, Class, and Race-Ethnicity in Service Spending.” Gender and Society 12(2):219-231. Coleman, M., L. Ganong and M. Fine. 2000. “Reinvestigating Remarriage: Another Decade of Progress.” Journal of Marriage and Family 62(4): 1288-1307.
24
Cox, D.R. and D. Oakes. 1984. Analysis of Survival Data. London: Chapman and Hall. Eastman, M. 1996. “Myths of Marriage and Family.” In D. Popenoe, J.B. Elshtain, and D, Blankenhorn (Eds.), Promises to Keep: Decline and Renewal of Marriage in America. (pages 35-68.) Lanham MD: Rowman and Littlefield. Edin, Kathryn. 2000. “What do single mothers say about marriage?”. Social Problems 47(1):112-133. Ellwood, David T. and Christopher Jencks. 2001. “The Growing Differences in Family Structure: What Do We Know? Where Do We Look For Answers?” Paper presented at a joint conference for the Institute for Research on Poverty and the Russell Sage Foundation’s New Inequality Program. Espenshade, Thomas N. 1985. “Marriage Trends in America: Estimates, Implications, and Underlying Causes.” Population and Development Review 11:193-245. Goldstein, Joshua R. 1999. “The Leveling of Divorce in the United States.” Demography 36(3):409-414. Heaton, Tim B. 2002. “Factors Contributing to Increasing Marital Stability in the United States.” Journal of Family Issues 23(3):392-409. Hetherington, E.M. and M.M. Stanley-Hagan. 1997. “The Effects of Divorce on Fathers and Their Children.” Pages 191-211,361-369 in M.E. Lamb, ed., The Role of the Father in Child Development. 3rd Edition. New York: Wiley. McCall, Leslie. 2000. “Gender and the New Inequality: Explaining the College/Non-College Wage Gap.” American Sociological Review 65(2):234-255. McLanahan, Sara, and L.L. Bumpass. 1988. “Intergenerational Consequences of Marital Disruption.” American Journal of Sociology 94:130-152. Meagher, Gabrielle. 2002. “Is it Wrong to Pay for Housework?” Hypatia 17(2):52-66. Moore, Kristin, and Linda J. Waite. 1981. “Marital Dissolution, Early Motherhood, and Early Marriage.” Social Forces 60(3):20-40. Morris, Martina, and Bruce Western. 1999. “Inequality in Earnings at the Close of the 20th Century.” Annual Review of Sociology 25:623-657. Ooms, T. 1998. “Towards More Perfect Unions: Putting Marriage on the Public Agenda.” Washington DC: Family Impact Seminar.
25
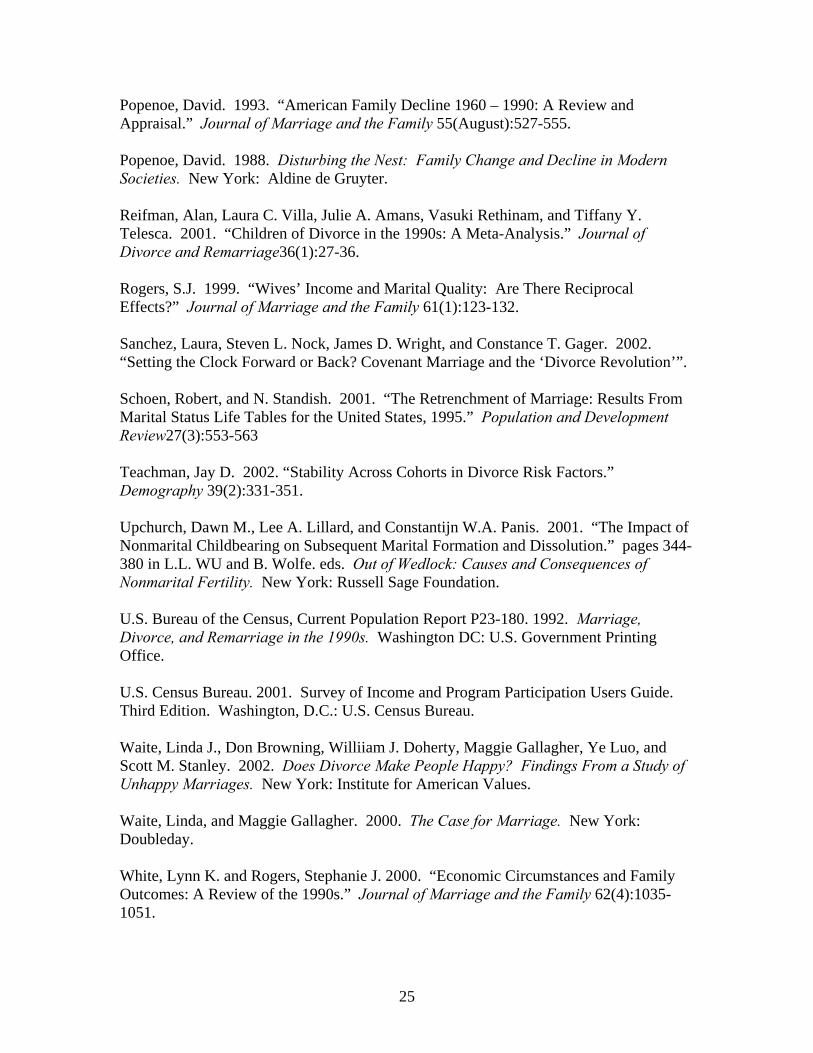
Popenoe, David. 1993. “American Family Decline 1960 – 1990: A Review and Appraisal.” Journal of Marriage and the Family 55(August):527-555. Popenoe, David. 1988. Disturbing the Nest: Family Change and Decline in Modern Societies. New York: Aldine de Gruyter. Reifman, Alan, Laura C. Villa, Julie A. Amans, Vasuki Rethinam, and Tiffany Y. Telesca. 2001. “Children of Divorce in the 1990s: A Meta-Analysis.” Journal of Divorce and Remarriage36(1):27-36. Rogers, S.J. 1999. “Wives’ Income and Marital Quality: Are There Reciprocal Effects?” Journal of Marriage and the Family 61(1):123-132. Sanchez, Laura, Steven L. Nock, James D. Wright, and Constance T. Gager. 2002. “Setting the Clock Forward or Back? Covenant Marriage and the ‘Divorce Revolution’”. Schoen, Robert, and N. Standish. 2001. “The Retrenchment of Marriage: Results From Marital Status Life Tables for the United States, 1995.” Population and Development Review27(3):553-563 Teachman, Jay D. 2002. “Stability Across Cohorts in Divorce Risk Factors.” Demography 39(2):331-351. Upchurch, Dawn M., Lee A. Lillard, and Constantijn W.A. Panis. 2001. “The Impact of Nonmarital Childbearing on Subsequent Marital Formation and Dissolution.” pages 344-380 in L.L. WU and B. Wolfe. eds. Out of Wedlock: Causes and Consequences of Nonmarital Fertility. New York: Russell Sage Foundation. U.S. Bureau of the Census, Current Population Report P23-180. 1992. Marriage, Divorce, and Remarriage in the 1990s. Washington DC: U.S. Government Printing Office. U.S. Census Bureau. 2001. Survey of Income and Program Participation Users Guide. Third Edition. Washington, D.C.: U.S. Census Bureau. Waite, Linda J., Don Browning, Williiam J. Doherty, Maggie Gallagher, Ye Luo, and Scott M. Stanley. 2002. Does Divorce Make People Happy? Findings From a Study of Unhappy Marriages. New York: Institute for American Values. Waite, Linda, and Maggie Gallagher. 2000. The Case for Marriage. New York: Doubleday. White, Lynn K. and Rogers, Stephanie J. 2000. “Economic Circumstances and Family Outcomes: A Review of the 1990s.” Journal of Marriage and the Family 62(4):1035-1051.
26
Table 1: Trends in Marital Dissolution by Educational Attainment for U.S. Women. Comparisons Across Three Sets of Surveys. First Marriages with a Dissolution Within 10 Years as a Percent of All First Marriages Year of First Marriage 1970 – 1974 1975 – 1979 1980 – 1984 1985 – 1989 1990 – 1994 SIPP 1996, 2001 4-Year College Degree or More
24.3 (21.9, 27.0)
27.0 (24.5, 29.7)
20.4 (18.2, 22.8)
17.7 (15.7, 19.9)
16.7 (14.0, 19.8)
No 4-Year College Degree
33.7 (32.2, 35.2)
35.1 (33.6, 36.6)
33.4 (31.9, 34.9)
32.3 (30.8, 33.9)
35.7 (33.5, 38.0)
Difference: 4-Year Degree – No Degree
-9.6 % -8.1 % -13.0 % -14.6 % -19.0 %
CPS 1985 – 1995 4-Year College Degree or More
25.1 (23.6, 26.6)
24.9 (23.3, 26.6)
20.8 (19.1, 22.6)
18.2 (15.3, 21.5)
No 4-Year College Degree
33.7 (31.8, 35.6)
36.2 (35.2, 37.2)
37.4 (36.2, 38.6)
37.4 (35.5, 39.4)
Difference: 4-Year Degree – No Degree
-8.6 % -11.3 % -16.6 % -19.2 %
NSFG 1973 – 1995 16+ years of education completed
21.1 (17.6, 25.1)
23.6 (20.3, 27.4)
21.9 (18.3, 25.9)
21.1 (16.2, 27.0)
<16 years of education completed
34.9 (33.0, 37.0)
36.9 (34.9, 38.9)
37.4 (35.1, 39.7)
37.0 (33.6, 40.6)
Difference: 4-Year Degree – No Degree
-13.8 % -13.3 % -15.5 % -15.9 %
Sources: Survey of Income and Program Participation 1996 and 2001 combined data file. Current Population Survey June 1985, June 1990, and June 1995 combined data file. National Survey of Family Growth 1973, 1976, 1982, 1988, 1995 combined data file. Results are weighted. Cohort life table estimates control for marriages censored before 10 years. Estimated 95% confidence intervals are in parentheses.
27
Table 2: Trends in Marital Status in U.S. Census Data, 1980 – 2000. Divorced or Separated Persons as a Percent of Ever-Married Persons Age 35 – 44 Census
Year
1980 1990 2000 Women 4-Year College Degree or More 13.9 16.1 14.4 No 4-Year College Degree 16.8 22.5 23.2 Difference: 4-Year Degree – No Degree -2.9 % -6.4 % -8.8 % Men 4-Year College Degree 10.0 12.1 10.4 No 4-Year College Degree 12.4 19.1 20.6 Difference: 4-Year Degree – No Degree -2.4 % -7.0 % -10.2 % Source: U.S. Census 1% Public Use Micro Samples for 1980, 1990, and 2000.
28
Table 3: Trends in Marital Dissolution by Detailed Educational Attainment. SIPP 1996/2001 Data. First Marriages with a Dissolution Within 10 Years as a Percent of All First Marriages Year of First Marriage 1970 –
1974 1975 – 1979
1980 – 1984
1985 – 1989
1990 – 1994
Women Master’s or Professional Degree 26.5 25.0 20.8 16.6 15.5 4-Year College Degree 23.1 28.0 20.3 18.2 17.2 Some College 37.1 38.3 36.2 33.8 34.7 High School Diploma or Equivalent 32.2 33.4 31.0 30.8 35.3 No High School Diploma 28.5 31.2 31.5 31.6 39.7 Difference: Master’s or Professional Degree – No High School Diploma
-2.0 % -6.2 % -10.7 % -15.0 % -24.2 %
Men Master’s or Professional Degree 16.9 18.7 15.7 16.2 10.4 4-Year College Degree 24.3 23.8 18.9 18.9 15.6 Some College 36.1 33.3 31.1 29.7 27.8 High School Diploma or Equivalent 33.2 35.2 33.0 32.6 34.4 No High School Diploma 28.7 25.8 28.2 27.5 27.0 Difference: Master’s or Professional Degree – No High School Diploma
-11.8 % -7.1 % -12.5 % -11.3 % -16.6 %
Source: Survey of Income and Program Participation 1996/2001 Combined Data File. Results are weighted. Cohort life table estimates control for marriages censored before 10 years.
29
Table 4: Marriage and Marital Dissolution Paths in the 10 Years Following a First Birth, as a Percent of All Women with a First Birth. Mother’s Education
and Year of First Birth 4-year degree No 4-year degree 1970 –
1974 1990 – 1994
1970 – 1974
1990 – 1994
Nonmarital first birth, followed by A: No subsequent marriage in the next 10 years 5 % 4 % 9 % 18 % B: Marriage intact through 10 years after the birth 4 7 10 16 C: Marriage, then marital dissolution within 10 years after the birth
1 1 3 7
First marriage, then first birth, followed by D: Marriage intact through the next 10 years 69 71 52 39 E: Marital dissolution in the next 10 years 19 11 24 16 Second marriage, then first birth, followed by F: Marriage intact through the next 10 years 1 5 1 3 G: Marital dissolution in the next 10 years 1 1 0 1 H: Other first births 0 0 0 1 A + C + E + G (“Families without a stable marriage”): First births without a marriage intact to age 10, as a percent of all first births
26 % 17 % 36 % 42 %
Source: SIPP 1996/2001 Combined Data Files. Nonmarital first births prior to any marriage and nonmarital first births following a first marriage were estimated in separate cohort life tables, then combined. Results are weighted. See text for additional details.
30
Table 5: Descriptive Statistics for the SIPP 1996 / 2001 Combined Data File. U.S. Women with a First Marriage in 1970 – 1994. Year of First Marriage 1970 –
1974 1975 – 1979
1980 – 1984
1985 – 1989
1990 – 1994
All Years
Women N 5024 4915 5130 5075 4846 24990 Educational Attainment Four year college degree .22 .22 .22 .26 .28 .24 Master’s or professional degree .09 .07 .06 .08 .07 .07 Four-year degree only .14 .15 .16 .19 .21 .17 No four year college degree .78 .78 .78 .74 .72 .76 Some college .32 .33 .33 .32 .31 .32 High school diploma or equivalent .33 .33 .32 .29 .28 .31 No high school diploma .12 .13 .13 .12 .13 .12 Race/Ethnicity and Nativity Nonhispanic black .10 .10 .11 .11 .10 .10 Hispanic .09 .10 .12 .14 .16 .12 Other nonhispanic .05 .05 .05 .06 .06 .05 Nonhispanic White .76 .75 .72 .70 .69 .72 Foreign born .12 .13 .15 .17 .19 .15 Marriage timing Age at marriage 15-19 .36 .32 .25 .16 .15 .25 Age at marriage 20-24 .49 .49 .45 .43 .38 .44 Age at marriage 25-29 .10 .14 .20 .25 .27 .19 Age at marriage 30 or older .05 .06 .11 .16 .20 .12 First birth preceded marriage .10 .12 .15 .18 .22 .15 Counts are unweighted.
31
Table 6: Descriptive Statistics for SIPP 1996 / 2001 Combined Data File. U.S. Men with a First Marriage in 1970 – 1994. Year of First Marriage 1970 –
1974 1975 – 1979
1980 – 1984
1985 – 1989
1990 – 1994
All Years
Men N 4362 4246 4547 4690 4561 22406 Educational Attainment Four year college degree .28 .26 .26 .28 .28 .27 Master’s or professional degree .12 .10 .09 .11 .09 .10 Four-year degree only .16 .16 .17 .18 .19 .17 No four year college degree .72 .74 .74 .72 .72 .73 Some college .29 .30 .28 .29 .29 .29 High school diploma or equivalent .29 .32 .32 .30 .31 .31 No high school diploma .14 .13 .13 .12 .13 .13 Race/Ethnicity and Nativity Nonhispanic black .09 .08 .09 .10 .09 .09 Hispanic .09 .09 .11 .13 .15 .12 Other nonhispanic .04 .04 .04 .05 .05 .05 Nonhispanic White .78 .78 .76 .72 .70 .75 Foreign born .12 .14 .15 .17 .19 .15 Marriage timing Age at marriage 15-19 .16 .15 .12 .08 .05 .11 Age at marriage 20-24 .55 .51 .43 .35 .32 .43 Age at marriage 25-29 .20 .23 .28 .33 .33 .28 Age at marriage 30 or older .09 .10 .18 .24 .30 .18 First birth preceded marriage - - - - - - Counts are unweighted. Premarital births are not counted for the men’s sample because fertility histories are not available.
32
Table 7: Rates of Marital Dissolution for First Marriages in the United States in 1970 – 1994. Coefficients from Cox Proportional Hazard Models. Women Men Model A Model B Model A Model B Educational attainment, coefficient as of 1970
Four-year college degree -.20 (.06)* .02 (.06) -.49 (.06)* -.31 (.06)* Trend: 1970 to 1994 Year of marriage .002 (.002) .014 (.002)* -.008 (.002)* .006 (.002)* Trend * education interaction: Year of marriage X four-year college degree
-.033 (.005)* -.029 (.005)* -.014 (.005)* -.014 (.005)*
Race/Ethnicity and Nativity Nonhispanic black .28 (.03)* .28 (.04)* .07 (.04) .17 (.04)* Hispanic -.13 (.04)* -.21 (.05)* -.26 (.05)* -.34 (.05)* Other nonhispanic -.33 (.07)* -.27 (.07)* -.18 (.08) -.11 (.08) Nonhispanic White(e) Foreign born -.44 (.05)* -.36 (.05)* -.46 (.05)* -.37 (.05)* Age at Marriage Age at marriage 15-19 .56 (.03)* .61 (.03)* Age at marriage 20-24(e) Age at marriage 25-29 -.49 (.04)* -.42 (.03)* Age at marriage 30 or older -.62 (.05)* -.71 (.05)* First birth preceded marriage .35 (.03)* N 24990 24990 22406 22406 Log likelihood -74646.4 -74143.6 -58689.6 -58269.4 Observations are unweighted and censored 10 years after a first marriage. * p < .01. (e) Indicates an excluded category. See text for additional details.
33
Table 8: Estimates of Model Fit For Models Involving an Interaction Between Predictor Variables and Year Married. Log
Likelihood LR CHI2
(relative to model #1)
BIC (relative to model #1)
Women (n = 24990, 7585 events) Model #1: education (2 categories) + trend (year of marriage) + race + nativity + age at marriage, premarital birth
-74164.1
Model #2: #1 + education * trend -74143.6 41.0 (1 df)* -32.07 Model #3: #1 + race * trend -74157.2 13.8 (3 df)* 12.99 Model #4: #1 + nativity * trend -74163.9 0.2 (1 df) 8.73 Model #5: #1 + (age at marriage, premarital birth) * trend
-74160.5 7.2 (4 df) 28.52
Model #6: #1 + education*trend + race *trend + nativity*trend + (age at marriage, premarital birth)*trend
-74137.3 53.6 (9 df)* 26.77
Men (n = 22406, 6027 events) Model #1: education (2 categories) + trend (year of marriage) + race + nativity + age at marriage
-58273.7
Model #2: #1 + education * trend -58269.4 8.6 (1 df)* 0.1 Model #3: #1 + race * trend -58271.0 5.4 (3 df) 20.7 Model #4: #1 + nativity * trend -58272.6 2.2 (1 df) 6.5 Model #5: #1 + age at marriage * trend
-58260.9 25.6 (3 df)* 0.5
Model #6: #1 + education*trend + race *trend + nativity*trend + age at marriage*trend
-58253.4 40.6 (8 df)* 29.0
* p < .01 Values in boldface show strong evidence using BIC for rejecting the null hypothesis of no interaction with trend.
34
Figure 1: Marriages with a Marital Dissolution within 10 Years, as a Percent of All First Marriages for U.S. Women. By Educational Attainment and Year of First Marriage.
0
10
20
30
40
1960-64 1965-69 1970-74 1975-79 1980-84 1985-89 1990-94
Year of Marriage
Perc
ent
No 4-Year College Degree 4-Year College Degree
Source: Survey of Income and Program Participation 1996 and 2001 combined data files. Results are weighted. Life table estimates control for marriages censored before 10 years.
35
Figure 2: Marriages with a Marital Dissolution within 10 Years, as a Percent of All First Marriages for U.S. Women. By Detailed Educational Attainment for First Marriages in 1970 – 1974 and 1990 – 1994.
0
10
20
30
40
1970-74 1990-94
Year of Marriage
Perc
ent
No H.S. DiplomaHigh School DiplomaSome College4-year College DegreeMaster’s or Professional Degree
Source: Survey of Income and Program Participation 1996 and 2001 combined data files. Results are weighted. Cohort life table estimates control for marriages censored before 10 years.