growing income, growing inclusion: how rising … income, growing inclusion: how rising incomes at...
TRANSCRIPT

Center for Financial InclusionPublication 19
Growing Income, Growing Inclusion: How Rising Incomes at the Base of the Pyramid Will Shape Financial InclusionFinancial Inclusion 2020 Project:Mapping the Invisible Market
The Center for Financial Inclusion at Accion (CFI) helps bring about the conditions to achieve full financial inclusion around the world. Constructing a financial inclusion sector that reaches everyone with quality services will require the combined efforts of many actors. CFI contributes to full inclusion by collaborating with sector participants to tackle challenges beyond the scope of any one actor, using a toolkit that moves from thought leadership to action.
www.centerforfinancialinclusion.orgwww.financialinclusion2020.org
Founding Partner
Financial Inclusion 2020 is funded by:
Lead Partner & FI2020 Founding Sponsor
Principal PartnersPrincipal Partner & FI2020 Founding Sponsor
Project PartnersMapping the Invisible
Market SponsorFounding Partner

Growing Income, Growing Inclusion: How Rising Incomes at the Base of the
Pyramid Will Shape Financial Inclusion
Financial Inclusion 2020 Project:Mapping the Invisible Market
Sonja KellyElisabeth Rhyne
June 2013


Table of Contents
Preface 1
Part 1. Introduction, Context, and Methodology 2 The Financial Inclusion 2020 Project and Mapping the Invisible Market 3 Data and Methodology 3
Part 2. The Income Opportunity 5 Decades of Growth 5 Regional Trends 5 Income Group Trends 6 Growth at the Base of the Pyramid 6
Part 3. Financial Services Use Among the Bottom 40 Percent 10 The Income-Inclusion Connection 10 Inclusion Trends in Savings and Accounts among the Bottom 40 Percent 11
Part 4. Toward A Model of Transition 14 Moving from Informal to Formal 14
Part 5. Implications for Providers and Policymakers 17 Providers 17 Policymakers 18
Part 6. Country Contexts 20 South Africa 20 Mexico 21 Nigeria 21
Annex 1: Average Per Capita Income Per Day by Country in the Bottom 40 Percent, 2010 and 2020 23
Annex 2: World Bank Regional and Income Groups 26


Table of Figures
Figure 1. Global GDP and Growth Rate, 1980-2020 5Figure 2. Total GDP by Region, 1980-2020 6Figure 3. Total GDP in the Bottom 40 Percent of National Populations by Region, 1980-2020 6Figure 4. Total Income Growth in the Bottom 40 Percent in Low and Middle Income Economies,
2010-2020 7Figure 5. GDP Per Capita Per Day by Region in Q1 and Q2, 1980-2020 7Figure 6. GDP Per Capita Per Day by Region in Q1 and Q2, 2010 and 2020 8Figure 7. Movement of the Bottom 40 Percent into the Vulnerable Class, 2010-2020 9Figure 8. Percent of Population in Poverty ($1.25 per capita per day, select countries) 9Figure 9. Self-Reported Barriers to the Use of Formal Accounts, 2011 11Figure 10. Income vs. Account Ownership Among the Bottom 40 Percent, 2011 11Figure 11. Formal Savings vs. Account Ownership Among the Bottom 40 Percent, 2011 11Figure 12. Participation in Accounts and Savings by Region Among the Bottom 40 Percent 12Figure 13. Global Account Ownership and Activity by Income Country Groups, 2011 12Figure 14. Informal to Formal: A Spectrum of Transition 15Figure 15. South Africa GDP Per Capita Per Day by Quintile, 2010 (observed) and 2020 (projected) 20Figure 16. Financial Services Use in the Bottom 40 Percent in South Africa, 2011 20Figure 17. Mexico GDP Per Capita Per Day by Quintile, 2010 (observed) and 2020 (projected) 21Figure 18. Financial Services Use in the Bottom 40 Percent in Mexico, 2011 21Figure 19. Nigeria GDP Per Capita Per Day by Quintile, 2010 (observed) and 2020 (projected) 22Figure 20. Financial Services Use in the Bottom 40 Percent in Nigeria, 2011 22

Growing Income, Growing Inclusion: How Rising Incomes at the Base of the Pyramid Will Shape Financial Inclusion

1Growing Income, Growing Inclusion: How Rising Incomes at the Base of the Pyramid Will Shape Financial Inclusion
Around the world, incomes among people at the base of the pyramid are rising. Middle income economies in particular are seeing rapid income growth, with massive numbers of people at the base of the pyramid moving from incomes at or near subsistence to a level that provides a small disposable surplus. This change amounts to a movement from $1-$2 a day to perhaps $4 to $10 a day . Some are calling this the rise of a new “vulnerable class.” As this trend continues through the decade, an enormous number of people will gain incomes sufficient to make them attractive customers to a wider range of financial services providers. As they gain income, they are also more likely to demand more and better formal financial tools.
This report, as part of the Mapping the Invisible Market initiative within the Financial Inclusion 2020 project, presents data and analysis on increasing incomes at the base of the pyramid. It analyzes existing financial services use among the bottom 40 percent of the global population and considers the ways this usage may change with rising income. The report illustrates these trends at a national level through examples from South Africa, Mexico, and Nigeria.
Increases in income at the bottom of the pyramid provide both an opportunity and a challenge for the financial inclusion community. The opportunity emerges from the large number of people moving into a new income bracket. The ability and propensity of people in the vulnerable class to use formal financial services is set to increase, forming an enormous new market. Income growth also poses a challenge because serving this market effectively requires providers to understand how and why a person may shift from informal to formal financial services. Providers must use this understanding to innovate in products, delivery, and marketing.
At the same time, we remind readers that it is important to continue to focus on the smaller but still substantial group of people who remain in poverty.
We extend our sincere thanks to Citi for its lead support of Financial Inclusion 2020 and to principal partner MasterCard Worldwide for its support of Mapping the Invisible Market. We are also grateful for generous support from principal partners Visa and the Bill & Melinda Gates Foundation, from project partner Western Union, and from Center for Financial Inclusion founding sponsor, Credit Suisse.
We also wish to thank our reviewers, Hui Wen Chan, Citi Foundation; Amit Jain, MasterCard Foundation; Martin Hintz, Allianz; and Nate Gonzalez, Accion.
Preface
2 Center for Financial Inclusion at Accion Growing Income, Growing Inclusion: How Rising Incomes at the Base of the Pyramid Will Shape Financial Inclusion
Part 1. Introduction, Context, and Methodology
The United Nations’ first Millennium Development Goal is to halve the number of people living on less than $1 per day by 2015. The UN has announced that despite slowed growth related to the global financial crisis, the world met this goal five years ahead of target.1 People are moving out of poverty, and they are doing so in large numbers. This report explores the projected increase in income at the base of the pyramid over the next decade and highlights a growing “vulnerable class” with incomes higher than the $2 per day often used as a marker of poverty but still well below levels that could be considered solidly middle class. The use of the term “vulnerable” highlights that while people in this group live above the poverty line they remain vulnerable to falling into poverty.2
The report analyzes how such income changes will affect the use of financial services and what they will mean for financial inclusion policymakers and providers. The World Bank’s Global Findex,3 a cross-country survey of financial services use, reports that rates of formal financial services use are far lower for the bottom 40 percent of a country’s population (based on income), than they are for the top 60 percent. About half of the global population still remains without a bank account, and account ownership is much lower among those in the bottom 40 percent in their economies. The income increases discussed here will make it more economically feasible and attractive to reach this segment with formal financial services.
While this change in income poses a great opportunity, it brings new challenges as well. With increased incomes come shifts in the ways people manage their financial portfolios. In very general terms, as incomes rise, people previously outside the formal financial services sector begin to use formal financial services for more of their financial needs. They will find informal financial tools increasingly inadequate to meet day-to-day transaction needs and achieve longer-term financial goals. However, this transition to formal services will depend on whether the formal services offered meet needs as well as or better than informal services used traditionally.
The findings in this report speak to both financial service providers and national policymakers. The analysis presented here identifies the countries and regions where income growth signals important new opportunities for growth in financial inclusion. Juxtaposing these changes with current financial services use highlights the gaps where policy action may be needed and market opportunities are opening.
After this brief introduction and explanation of our methodology (Part 1), the report discusses the global context, demonstrating that incomes at the base of the pyramid around the world are increasing (Part 2). We present existing financial use patterns at the base of the pyramid using the World Bank’s Global Findex data (Part 3) and explore how these use patterns might change with an increase in income (Part 4). We then turn to the implications of this analysis for policymakers and financial service providers (Part 5), and, finally, we illustrate the connection between income growth and financial inclusion in three contexts with varying income and inclusion patterns: South Africa, Mexico, and Nigeria (Part 6). We also include a visual picture of per capita income growth by quintile between 2010 and 2020 in each country, based on our projections (Annex 1).
1. United Nations, Millennium Development Goals Report, 2012 (New York: United Nations Statistics Division, 2012). 2. The World Bank coined the term in Francisco H.G. Ferreira et al., Economic Mobility and the Rise of the Latin American Middle Class (Washington, DC: World Bank, 2013).3. The World Bank Global Financial Inclusion Index (Global Findex) provides indicators on financial services usage in 148 economies. It is the first large-scale demand-side survey of financial inclusion. It utilizes nationally representative surveys conducted as part of the Gallup World Poll. For more information, see datatopics.worldbank.org/financialinclusion or Asli Demirguc-Kunt and Leora Klapper, “Measuring Financial Inclusion: The Global Findex Database,” DataBank (Washington, DC: World Bank, 2012).

3Growing Income, Growing Inclusion: How Rising Incomes at the Base of the Pyramid Will Shape Financial Inclusion
informal sector, and groups that are often particularly excluded (women, ethnic minorities, disabled).
Who provides: A range of providers in a competitive marketplace including organizations from private, social, and government sectors.
Financial capability: The users of financial services have the knowledge, skills, and behaviors needed to make good, informed financial decisions.
Determining the feasibility of full financial inclusion requires an understanding of demand- and supply-side trends and knowledge of the current projected financial inclusion gap. This report focuses on one of the most important demand-side trends – income – which is critical to the ability and propensity of people at the bottom of the economic pyramid to use formal financial services.
Data and Methodology
This report is based on multiple publicly available datasets from multilateral sources, combined with projections by those sources and by the authors. GDP data come from the International Monetary Fund’s World Economic Outlook. Data on poverty rates come from the World Bank’s DataBank. Data on financial services usage are from the World Bank Global Financial Inclusion Index (Global Findex), unless otherwise specified.5 Data on inequality are from a variety of sources, captured by the World Bank and the updated UNU-WIDER World Income Inequality Database, which compiles data from an array of sources.6 Data on population, used to determine the size of population quintiles to create per capita measures, are from the United Nations World Population Prospects.7
The income projections on which this analysis rests were made by the World Economic Outlook up to
5. Asli Demirguc-Kunt and Leora Klapper, “Measuring Financial Inclusion: The Global Findex,” World Bank Policy Research WP6025 (Washington, DC: World Bank, 2012). 6. World Bank, DataBank; United Nations, World Income Inequality Database V2.0. (Helsinki, Finland: United Nations, 2008). 7. United Nations Department of Economic and Social Affairs, World Population Prospects: The 2010 Revision (New York: United Nations, 2010).
The Financial Inclusion 2020 Project and Mapping the Invisible Market
This report is part of the Center for Financial Inclusion at Accion’s ongoing Mapping the Invisible Market initiative within the Financial Inclusion 2020 project. Financial Inclusion 2020 is building a movement that mobilizes stakeholders around the globe to achieve full financial inclusion, using the year 2020 as a focal point for action. Mapping the Invisible Market examines major forces, such as demographic change and income growth, that will strongly influence whether and how this goal will be achieved. This report is a companion to a report on demographic change.4
The Center views full financial inclusion as much more than “banking the unbanked.” Financial Inclusion 2020 works with the following comprehensive definition:
Full financial inclusion is a state in which all people who can use them have access to a suite of quality financial services, provided at affordable prices, in a convenient manner, and with dignity for the clients. Financial services are delivered by a range of providers, most of them private, to a financially literate and capable clientele.
This vision puts clients at the forefront. It recognizes that the financial services needs of the poor have fundamental similarities to those of the better off, such that there is a continuum of specific needs and demands across the income spectrum. More specifically, this definition of financial inclusion focuses on five dimensions:
What is provided: A full range of services, which includes a basic product in each of four main areas: savings, credit, insurance, and payments.
How it is provided: With quality (convenience, affordability, safety, and dignity of treatment) and client protections.
Who receives: Everyone who can use the services, including the poor, rural, those working in the
4. Peter Kasprowicz and Elisabeth Rhyne, “Looking Through the Demographic Window: Implications for Financial Inclusion,” Center for Financial Inclusion Publication 18 (Washington, DC: Center for Financial Inclusion, 2013).

4 Center for Financial Inclusion at Accion Growing Income, Growing Inclusion: How Rising Incomes at the Base of the Pyramid Will Shape Financial Inclusion
2017 using observed data from 1980 to the latest available year (generally 2010, although it varies by country). The authors extended these projections for three more years, from 2018 to 2020, using a five-year moving average assumption. The projections, therefore, involve no attempt to predict income based on the current economic outlook. They simply extend the trends of the past 30 years, a period long enough to smooth out most business cycle fluctuations.
The World Economic Outlook reports GDP data in current U.S. dollars (USD), using updated purchasing power parity assumptions along with current exchange rates. The authors converted this current USD into constant 2010 USD using the U.S. Bureau of Labor Statistics’ CPI-U, a yearly conversion factor that corresponds to the consumer price index.8 Estimates of future USD consumer price indices were made according to a linear projection of inflation from the base year of 2010, using an average of the U.S. Office of Management and Budget and Congressional Budget Office inflation estimates at the beginning of 2011, which range from 1.5 percent in 2011 to 2.2 percent at the end of the decade. The data therefore are comparable between years and among countries, accounting for purchasing power parity.
Where the inequality data disagree on percent income by quintile, an average of indicators was taken. Where there were missing years of income share by quintile, the authors interpolated or extrapolated from the data to make estimates about the missing years. To estimate future income distribution, the authors used ordinary least squares assumptions for each quintile based on available data showing past trends.
Country groups are based on the World Bank’s regional or income groups as determined in 2012 and are listed in Annex 2. Regional groups do not include high income economies.
8. Bureau of Labor Statistics, Consumer Price Index (Washington DC: United States Department of Labor, 2011).

5Growing Income, Growing Inclusion: How Rising Incomes at the Base of the Pyramid Will Shape Financial Inclusion
Part 2. The Income Opportunity
Real incomes are rising among the currently poor, moving hundreds of millions of people from more extreme levels of poverty into levels at which they begin to have some income flexibility.9 This change will provide the opportunity for a fast-growing uptake in financial services, if providers can effectively meet the needs of this emerging vulnerable class. These changes are taking place at different rates in different regions and countries, with important implications for financial inclusion.
Decades of Growth
The world’s total economic output rose between 1980 and 2010, with a high growth period starting in 2003. Growth has been around 2.5 percent per year on average over the last 30 years. Even after two major global recessions (1982 and 2008) and with slowing population growth, global GDP continues to rise. In 1980, global GDP was $27 trillion, measured in 2010 constant dollars. In 2010, it was $61 trillion. If we project the trend forward, we predict that by 2020 the world will have a GDP of $85 trillion, a fourfold increase over four decades.
Figure 1. Global GDP and Growth Rate, 1980-2020
Regional Trends
While most countries display this upward growth in GDP, there are regional and country-level variations that correspond to particular demographic and economic patterns.
9. In this report, we operationalize incomes as GDP per capita.
-10%
-5%
0%
5%
10%
15%
20%
$0
$10,000,000
$20,000,000
$30,000,000
$40,000,000
$50,000,000
$60,000,000
$70,000,000
$80,000,000
$90,000,000
$100,000,000
1980
1982
1984
1986
1988
1990
1992
1994
1996
1998
2000
2002
2004
2006
2008
2010
2012
2014
2016
2018
2020
Glo
bal G
DP
(mill
ions
)
GDP (2010 US dollars)
Percent Change
Perc
ent C
hang
e
projected
observed

6 Center for Financial Inclusion at Accion Growing Income, Growing Inclusion: How Rising Incomes at the Base of the Pyramid Will Shape Financial Inclusion
Figure 2. Total GDP by Region, 1980-2020
$0
$2,000,000
$4,000,000
$6,000,000
$8,000,000
$10,000,000
$12,000,000
$14,000,000
$16,000,000
$18,000,000 19
80
1982
1984
1986
1988
1990
1992
1994
1996
1998
2000
2002
2004
2006
2008
2010
2012
2014
2016
2018
2020
Regi
onal
GD
P (m
illio
ns)
East Asia and Paci c Eastern Europe and Central Asia Latin America and Caribbean Middle East and North Africa South Asia Sub-Saharan Africa
projected
observed
Income has increased in all regions of the developing world from 1980 to today, but some have seen more dramatic growth than others in the last 10 years. The estimated fastest growing regions between now and 2020 – East Asia and the Pacific and Eastern Europe and Central Asia – contain a high proportion of middle income economies. Sub-Saharan Africa, Middle East and North Africa (MENA), and South Asia contain more low-income economies, but these regions overall are also expected to grow steadily over the next decade. Latin America and the Caribbean will continue to grow more than twice as quickly as high income economies.
Income Group Trends
The projected increase in income among middle income countries is especially striking, which is to be expected given the typical s-curve of economic growth. High income economies have, as a group, already seen their highest rates of growth, and low income economies will likely see their highest growth in the future. Middle income economies, on the other hand, are experiencing a high growth phase right now, made possible by demographic and technology trends.
The BRICS (Brazil, Russia, India, China, and South Africa and other economically similar countries) made significant contributions to the increase in global output in the most recent decade. Most middle income economies have entered into a demographic window in which slowing birthrates and declining mortality give rise to a significantly larger working age population, a development that is directly tied to their capacity for economic growth. Given that middle income economies hold a large proportion of the world’s total population, the productive capacity of these countries
is now fueling the higher global economic output. The implications of demographic trends are discussed further in CFI’s companion publication, Looking Through the Demographic Window.
In contrast, high income economies are facing rapidly aging populations, which is a partial explanation for their slower growth. Low income economies, at the other end, have yet to experience this demographic shift and continue to have high birthrates and high dependency. They can expect to enter the demographic window and see their productive capacity rise in the next few decades.
The overall picture of global income growth is an optimistic one. However, the question most relevant for our purposes is whether the world’s poor will share in this growth. To investigate this question, we examine global income by population quintile.10
Growth at the Base of the Pyramid
Growth in the world’s economy is moving large numbers of people out of poverty, and if trends continue, the shift will be dramatic in many countries by the end of the decade. It is not that inequality is declining: The bottom 20 percent of the world’s population will still likely hold only 5 percent of total GDP in 2020. However, as we have just seen, this 5 percent is cut from a growing pie. The increase will be especially substantial within the second population quintile, which holds 11 percent of GDP globally.
Figure 3. Total GDP in the Bottom 40 Percent of National Populations by Region, 1980-2020
10. In this report we often refer to the first quintile, or the bottom 20 percent, as Q1, the second quintile as Q2, and so on.
$0
$500,000
$1,000,000
$1,500,000
$2,000,000
$2,500,000
$3,000,000
1980
1982
1984
1986
1988
1990
1992
1994
1996
1998
2000
2002
2004
2006
2008
2010
2012
2014
2016
2018
2020
Regi
onal
GD
P (m
illio
ns)
East Asia and Paci c Eastern Europe and Central Asia Latin America and Caribbean Middle East and North Africa South Asia Sub-Saharan Africa
projected
observed

7Growing Income, Growing Inclusion: How Rising Incomes at the Base of the Pyramid Will Shape Financial Inclusion
The rise in absolute incomes at the base of the pyramid moves large portions of the world’s population from poverty into what is now being dubbed the “vulnerable class.”11 Among the bottom 40 percent of the population in low and middle income economies, additional contributions to national income from the bottom 40 percent over the decade will total $15.8 trillion. By 2020, the annual income of this group will be $5.8 trillion, $2.7 trillion more than in 2010. This growth is most evident in East Asia and the Pacific, but is also quite significant in Eastern Europe and Central Asia, Latin America and the Caribbean, and South Asia. In these regions, the bottom 40 percent of the country will see, on average, a doubling in income over the decade.
Figure 4. Total Income Growth in the Bottom 40 Percent in Low and Middle Income Economies, 2010-2020
11. Ferreira et al., Economic Mobility and the Rise of the Latin American Middle Class.
$0.0
$1.0
$2.0
$3.0
$4.0
$5.0
$6.0
$7.0
2010 2012 2014 2016 2018 2020
Trill
ions
Growth $5.8 trillion
$3.1 trillion
Baseline
Cumulative growth = $15.8 T
The rise in income among the poorest in the world is creating a new income class – not quite poor and not quite middle class. While most of these people do not have enough money to be considered middle class by OECD standards, they have increased buying power for both financial services and consumer goods. Nancy Birdsall of the Center for Global Development uses the phrase “4 to 10s” to describe them because the relevant income range for this group can be identified as approximately $4 to $10 per person per day.12 People in this income group are not wealthy enough to be out of danger of falling below the poverty line again, but have income beyond the level required to barely cover minimum expenses. We believe that the shift now taking place is particularly relevant for financial inclusion because it moves people from living from day to day to being able to plan for the future. They have at their disposal a “useful” sum of money that they may increasingly wish to manage in the formal financial sector.
12. Nancy Birdsall, “India’s 4-10s: The New Not-Poor Not-Middle Class and Its Implications,” Blog post, Global Development: Views From The Center, Nov. 19, 2012. Center for Global Development.
$0
$5
$10
$15
$20
$25
1980
1982
1984
1986
1988
1990
1992
1994
1996
1998
2000
2002
2004
2006
2008
2010
2012
2014
2016
2018
2020
Q2 East Asia and Paci c Eastern Europe and Central Asia Latin America and Caribbean Middle East and North Africa South Asia Sub-Saharan Africa
$0
$5
$10
$15
$20
$25
1980
1982
1984
1986
1988
1990
1992
1994
1996
1998
2000
2002
2004
2006
2008
2010
2012
2014
2016
2018
2020
Q1 East Asia and Paci c Eastern Europe and Central Asia Latin America and Caribbean Middle East and North Africa South Asia Sub-Saharan Africa
projected
observed
projected
observed
Figure 5. GDP Per Capita Per Day by Region in Q1 and Q2

8 Center for Financial Inclusion at Accion Growing Income, Growing Inclusion: How Rising Incomes at the Base of the Pyramid Will Shape Financial Inclusion
Regardless of its name, people in the bottom two quintiles in many countries are quickly moving into this category. By 2020, we estimate that the vulnerable class may become the largest income group in many countries, bigger than the poor, the middle class, or the wealthy. In Latin America alone, over 40 percent of the total population had already moved into the vulnerable class by 2010, accounting for a larger percentage of the population than the poor.13 In all low and middle income economies, on average about a quarter of the population, a roughly threefold increase from 2010, will be in the $4 to $10 per day range by 2020.
This rising prosperity will be concentrated among middle income countries, where it will penetrate even into the lowest quintile of the population. If projections hold, by the end of the decade the majority of the lowest two quintiles of the population in four regions will, on average, have crossed into the vulnerable class (East Asia and the Pacific, Eastern Europe and Central Asia, Latin America and the Caribbean, and
13. For these broad observations, we use $4 per day as poor, between $4 and $10 as vulnerable, between $10 and $50 as middle class, and above $50 as wealthy, consistent with the definitions outlined in Ferreira et al.
MENA). South Asia and sub-Saharan Africa will not see such a massive movement of the bottom quintiles into the vulnerable class, but increasing incomes will move a significant number of people into it.
Among the countries whose bottom quintiles will cross into this vulnerable class during this decade are several of the world’s most populous countries. Given their population size and the scale of the income shifts, these are countries where opportunities for gains in financial inclusion are great. The poorest quintile of the population will move up into the vulnerable class in China, Indonesia, Brazil, Egypt, and Thailand. Other large population countries whose poorest quintile will move into the vulnerable class are Iraq, Morocco, Sri Lanka, Argentina, Peru and Ukraine. In a few large countries (India, Democratic Republic of Congo, and South Africa), only the second-poorest quintile will enter the vulnerable class, while Q1 in these countries will remain poor.
Q1 Q2 Q1 Q2 Q1 Q2 Q1 Q2 Q1 Q2 Q1 Q2
E. Asia & Paci c E. Europe & C. Asia LAC MENA South Asia
20102020
Sub-Saharan Africa
2010 $3.53 $5.81 $6.56 $11.14 $3.80 $8.72 $3.67 $5.83 $1.60 $2.18 $0.75 $1.34
2020 $7.07 $11.61 $12.31 $20.40 $4.44 $11.22 $5.46 $8.48 $2.68 $3.59 $0.92 $1.87
$0
$5
$10
$15
$20
$25
Figure 6. GDP Per Capita Per Day by Region in Q1 and Q2, 2010 and 2020

9Growing Income, Growing Inclusion: How Rising Incomes at the Base of the Pyramid Will Shape Financial Inclusion
0%
10%
20%
30%
40%
50%
60%
70%
80%
90%
100%
1990
19
91
1992
19
93
1994
19
95
1996
19
97
1998
19
99
2000
20
01
2002
20
03
2004
20
05
2006
20
07
2008
20
09
2010
Bangladesh
Brazil
China
India
Indonesia
Mali
Mexico Russian Federation South Africa Tanzania Turkey
While this positive story may dominate headlines, it is also still important to look specifically at those who will remain poor. Shown below is the trajectory of the percent of people living on $1.25 per day, the international deep-poverty line published by the World Bank. This figure is falling throughout the world, in some places dramatically, as large numbers of people rise out of poverty.
Figure 8. Percent of Population in Poverty ($1.25 per capita per day, select countries)
Figure 7. Movement of the Bottom 40 Percent into the Vulnerable Class (2010-2020)
Note: Figures rounded where appropriate. Economies that are high income or have no data are colored white by default.
In the poorest countries, mostly in sub-Saharan Africa and South Asia, the bottom 40 percent will experience some income growth, but by the end of the decade most of Q1 and many of Q2 will still live below $1.25 per day. Among the populous countries whose bottom 40 percent will not move into the vulnerable class by the end of the decade are: Nigeria, Philippines, Bangladesh, Pakistan, Nigeria, Ethiopia, and Kenya. Nevertheless, even in these countries the vulnerable class will grow – made up of Q3s, rather than Q1s or Q2s.
There will also still be very poor people in countries across the world, although this poverty may be difficult to spot using national-level data. Ethnic and racial minorities and people living in remote areas may remain economically disadvantaged in spite of overall growth at a national level.

10 Center for Financial Inclusion at Accion Growing Income, Growing Inclusion: How Rising Incomes at the Base of the Pyramid Will Shape Financial Inclusion
Part 3. Financial Services Use Among the Bottom 40 Percent 14
Will the higher incomes at the base of the pyramid translate into greater financial inclusion? If appropriately tooled and marketed products are made available there is every reason to believe so. The use of formal financial products among the bottom 40 percent tends to follow per capita income. Regions with high and rising income per capita also have higher rates of participation in formal accounts among people at the base of the pyramid. Individuals with higher incomes tend to rely on formal financial services more than people with lower incomes. There are many nuances and challenges that come with transition to formal financial services, however. In this section, we will first provide additional evidence that supports the income-inclusion connection, and then discuss what financial services use looks like today to understand how it might grow as incomes increase around the world.
The Income-Inclusion Connection
Thus far, we have emphasized absolute levels of income (dollars per person per day) rather than relative incomes (percent share), because evidence suggests that absolute levels reveal more about likely financial services usage.
But how, exactly, do higher absolute incomes translate into financial services demand? Do higher incomes cause people to seek and use more formal financial services? Survey data suggests that they do. When the Global Findex asked people why they did not have a bank account, nearly two-thirds of the non-banked responded that they did not have enough money, and other responses dovetailed indirectly with not having enough money. A quarter of respondents said that formal services are too costly. Several other responses bear some relation to low incomes. If the service outlet is considered too far away, it may imply that the individual does not have enough money to get there. A lack of necessary documentation could also be related to low income.
At the national level, per capita income per day in the bottom 40 percent is closely related to participation in formal accounts within the same segment. Among people living on $2 per day or less globally, only 23 percent have accounts.15 In Figure 10, each dot represents an average of the bottom 40 percent of earners in a country.
The clear pattern shown and strong correlation (.76) between income and account ownership suggests that rising incomes will likely be accompanied by a significant increase in financial services usage among those in the bottom 40 percent.16 While the points on these scatterplots represent averages, these data are indicative of what is likely to happen as individuals gather more income.
In a paper on ownership and use of accounts, Allen et al. point out that the correlation between the use of financial services and income level drops considerably when only low income economies are examined, suggesting that other factors such as policy and financial sector structure also play an important role.17 Our analysis, however, focuses specifically on the bottom 40 percent of national economies. When we analyze the connection between income and inclusion among countries where the average income of the bottom 40 percent is $10 or less, we find that GDP per capita in the bottom 40 percent still explains about 50 percent of the variation in country-level account participation in the bottom 40 percent. We also hypothesize that movement into the vulnerable class is likely to be accompanied by a rise in demand for formal financial services.
14. All data in this section come from the World Bank’s Global Findex. 15. Demirguc-Kunt and Klapper, 2012.16. The correlation figures in this section are basic and do not take into account any control variables.17. Franklin Allen et al., “The Foundations of Financial Inclusion: Understanding Ownership and Use of Formal Accounts,” World Bank Policy Research Paper 6290 (Washington, DC: World Bank, 2012).

11Growing Income, Growing Inclusion: How Rising Incomes at the Base of the Pyramid Will Shape Financial Inclusion
Figure 9. Self-Reported Barriers to the Use of Formal Accounts, 2011
Why don’t you have an account?
Not enough money 65%
Too expensive 25%
Family member already has account 23%
Too far away 20%
Lack of necessary documentation 18%
Lack of trust 13%
Religious reasons 5%
Note: Respondents were able to choose more than one response. Chart adapted from Demirguc-Kunt and Klapper, 2012.
Figure 10. Income vs. Account Ownership Among the Bottom 40 Percent
Figure 11. Formal Savings vs. Account Ownership Among the Bottom 40 Percent
There is also a strong raw correlation among the bottom 40 percent (.81) between income and saving in a financial institution. While there are a few outlier countries where many people are saving even with
0% 10% 20% 30% 40% 50% 60% 70% 80% 90%
100%
$0 $10 $20 $30 $40 $50 $60 $70 $80 $90 $100
Perc
ent w
ith
a Fo
rmal
Acc
ount
Per Capita Income Per Day
extremely low per capita income, the rate of saving among bottom 40 percent of earners in each country is generally related to their per capita income. We can also disaggregate these figures on savings and accounts by region and country income level.
Inclusion Trends in Savings and Accounts Among the Bottom 40 Percent
In every region in the world, the bottom 40 percent are less likely to have an account in a formal financial institution than the top 60 percent of the population. People in the bottom two quintiles of the income distribution in most countries also save less overall and save less in formal financial institutions than the top 60 percent.
Despite low formal account use for savings, there is abundant research showing that the poor conduct active financial lives, including saving. Collins et al.’s Portfolios of the Poor18 argues that everyone saves, whether they have access to formal financial tools or not. It could be that saving in a formal financial institution is not economically feasible until individuals reach a particular income level.
Saving in a formal institution is different than just having an account. The Findex data shows that while about 30 percent of people in Q1 and Q2 in middle income economies have an account, only about 10 percent of people in the same group reported that they saved in a formal financial institution. This pattern holds for poorer and richer countries as well. Only about a third of account holders say that they save in a formal institution.
The fact that there are more people that report having an account than those who report saving in a formal financial institution indicates that people are not necessarily using their accounts for saving, but rather for other things. Setting aside for the moment a significant rate of account dormancy, in low and middle income economies, many people open accounts to receive payments, remittances, or government benefits. They withdraw most of these payments and thereafter operate in cash. Only in rich countries do we see the active account use that
18. Daryl Collins et al., Portfolios of the Poor: How the World’s Poor Live on $2 a Day (Princeton: Princeton University Press, 2010).
0%
10%
20%
30%
40%
50%
60%
$0 $10 $20 $30 $40 $50 $60 $70 $80 $90 $100 Per Capita Income Per Day
Perc
ent S
avin
g in
a F
orm
al In
stitu
ion

12 Center for Financial Inclusion at Accion Growing Income, Growing Inclusion: How Rising Incomes at the Base of the Pyramid Will Shape Financial Inclusion
suggests that people use their accounts as money management hubs for transaction purposes.The gap between savings behavior and use of financial institutions is most striking in sub-Saharan Africa. Over 30 percent of people report saving somewhere in the past year among the bottom two quintiles in sub-Saharan Africa – a number that is higher than in any other developing region. Despite high saving activity overall, however, only 6.5 percent of sub-Saharan Africans in the bottom 40 percent have saved at a financial institution. This trend points to pent-up demand.19
There are also regional differences among the bottom 40 percent when it comes to accounts. Whereas the bottom 40 percent in both MENA and sub-Saharan Africa have only about a 10 percent participation in formal accounts, the same demographic in East Asia and the Pacific and Europe and Central Asia have almost 40 percent participation. This discrepancy parallels the income growth trends we saw in Part 2 of this report: MENA and sub-Saharan Africa show the lowest growth rates of all of the regions, and East Asia and the Pacific and Europe and Central Asia show the highest growth rates – both historic and projected. We see this trend in the macroeconomic data and in the quintile-level data among the bottom 40 percent of the population.
Figure 12. Participation in Accounts and Savings by Region Among the Bottom 40 Percent
These observations about how people use accounts and how people save suggest that the concept of
19. The extremely rapid growth in Kenya of M-Shwari, a savings account offered by Safaricom and the Commercial Bank of Africa through M-PESA, is also indicative of the existence of large latent demand.
accounts as “on-ramps” to formal financial inclusion must be approached with caution. If accounts become a money management hub, then people would be more likely to use additional services connected with accounts. Someone using an account actively might use it to pay bills, set up a direct deposit to receive wages, use the account as collateral or prior history when applying for a loan, or to prove liquidity if applying for housing. But if accounts are merely used as a conduit for receiving money, these supplemental uses and their accompanying benefits will not necessarily arise.
Indeed, in many cases, accounts end up dormant. Among account-holders, we find that in East Asia 20 percent of accounts are dormant (0 deposits or withdrawals in an average month) and in MENA 15 percent are dormant. We also see differences in country income groupings. Middle income countries have the highest dormancy of accounts compared to high income and low income groups. Reasons for this high rate dormancy cannot be derived from the survey data, but a plausible explanation may be that accounts were opened for payments from a government or employer and never closed after that relationship ended. Dormancy poses a challenge for initiatives like the Better than Cash Alliance20 that seek to promote the shift of bulk payments to electronic form.
Figure 13. Global Account Ownership and Activity by Income Country Groups, 2011
20. Better than Cash Alliance, The Journey Toward “Cash Lite”: Addressing Poverty, Saving Money, and Increasing Transparency by Accelerating the Shift to Electronic Payments (Somerville, MA: Bankable Frontiers Associates, 2013).
0%
10%
20%
30%
40%
50%
60%
70%
80%
90%
100% High income East Asia & Paci�cEastern Europe & Central Asia Latin America & Caribbean Middle East & North Africa South Asia Sub-Saharan Africa
Account at a formal �nancial institution
Saved any money in the past year
Saved at a �nancial institution in the past year
49.5 10.5 56.7 76.3
3.5
5.1
25.70.9
7.0
16.8
3.3
5.0
26.1
3.5
6.8
14.0
13.8
64.1
7.4 3.8 0
10
20
30
40
50
60
70
80
90
100
World High Income Middle Income Low Income
Perc
ent o
f the
Pop
ulat
ion
no account
uncertain activity
no activity (0 withdrawals/month)
low activity (1-2 withdrawals/month)
high activity (>2 withdrawals/month)

13Growing Income, Growing Inclusion: How Rising Incomes at the Base of the Pyramid Will Shape Financial Inclusion
As we think about how rising incomes will influence participation in formal financial services, we must consider influences on both demand and supply. Countries will likely travel along the income-inclusion curve shown in Figure 10, but the gradient of that curve will be affected by the ways that the market interacts with individuals to encourage, tailor, and promote financial services. To best understand this process, it is necessary to know more about how people move from largely informal to formal financial services as their incomes change.

14 Center for Financial Inclusion at Accion Growing Income, Growing Inclusion: How Rising Incomes at the Base of the Pyramid Will Shape Financial Inclusion
Part 4. Toward A Model of Transition
With high income growth projections and low use of formal financial services, the base of the pyramid represents a significant untapped market segment for financial service providers. The income accruing to people in Q1 and Q2 of low and middle income economies will be $5.8 trillion higher in 2020, a near doubling since 2010. Over the decade the cumulative gain will be $15.8 trillion. Truly, the market opportunity at the bottom of the pyramid is large.
Capturing this market requires providers to offer services that prospective customers want and are comfortable using. There is often a gap between the opening of access through a new financial product or delivery channel and the actual use of the new product or channel, especially by first-time customers. This access versus use gap may accompany any new product introduction. If large or persistent, the gap may signal that product designers have not completely responded to client needs – in this case, to the process of transition from informal to formal services. In order to know if a given product will be an entry point to further financial inclusion, it is important to understand how individuals navigate this transition.
In this part of the report, we take steps toward a model of transition that may be useful to providers as they decide how to pursue the market opportunities that rising incomes offer.
Moving from Informal to Formal
The data shown in the previous section, together with qualitative research such as Portfolios of the Poor suggest that as income grows, people do not abruptly change from managing their financial portfolios in the informal financial sector to managing in the formal sector. Instead, with an increase in income, people enter a process by which they begin to “shift” their funds and transactions in a more formal direction. The move will be more like shifting one’s weight than like hopping from one foot to another. A person does not simply quit using informal financial tools, but gradually begins to use formal tools, first in addition to informal ones, and over time moving from one or two formal products to others. Understanding how this shift happens is critical to being able to capture the potential market that emerges from rising incomes. Change happens slowly, and for good reason. It also varies by person, as different people have different financial needs. We now consider the range of factors that may affect this shift.
One primary reason that this transition is not simple is the way in which the informal and formal sectors coexist. We know this from a number of sources. The economics literature shows that an increase in GDP in a country corresponds with increases in both the formal and the informal sectors. Theoretical pictures of this phenomenon conceptualize the informal and formal sectors as developing independently from one another, fulfilling different needs. For individuals, participation in one sector may not replace or preclude participation in the other. Customers will pick financial products and providers from across the spectrum of formality to meet their needs.
There are a number of different variables that affect the transition from informal to formal. Setting aside supply-side questions, demand-side factors relevant to this shift include a person’s flow of income, how dependable the income is, what kinds of products the person currently uses, and how many choices he already has. These factors influence how likely a person is to seek formal services. A visual summary is shown in Figure 14.

15Growing Income, Growing Inclusion: How Rising Incomes at the Base of the Pyramid Will Shape Financial Inclusion
Figure 14. Informal to Formal: A Spectrum of Transition 21
While in general, higher incomes correlate with use of more formal services, different kinds of income have different effects. For example, an unsteady flow or a one-time influx is less likely to move an individual to use formal services than a dependable increase in income, particularly if income comes from a formal source (formal employer or government). One-time influxes of income are often dealt with in the informal financial sector, with people trying to separate their assets into “chunks” by, for example, purchasing livestock or expensive jewelry. Such purchases allow money to be kept safe and provide a disciplinary mechanism that does not permit savings to be drawn down. These methods become impractical or insufficient when there are steadier, more predictable income flows. In broad strokes, steady and predictable income flows lend themselves more readily to formal products.
The source of income matters as well. Formality of employment is critical because the informal sector tends to pay in cash, while the formal sector tends to pay using formal methods such as checks and direct deposit, which require a bank account. For example, in many countries in Latin America, when a person gets a formal sector job, she also receives a bank account into which wages are paid. Thus, formal employment acts as an on-ramp to financial inclusion. For those employed in the informal sector and paid in cash, there is an extra
21. This typology is descriptive rather than normative. For example, it implies that on average, at low incomes, people’s portfolios will be primarily composed of informal services. The chart does not mean to say that portfolios should, however, be primarily composed of informal financial services – or vice versa.
Figure 14. Informal to Formal: A Spectrum of Transition 21
Income level
Income �ow
Employment Formality
Income Volatility
Absorptive Capacity Needs
Financial Services Formality
Low income
Unpredictable
High
Informal
Informal
Small absorption needs
High income
Predictable
Low
Formal
Formal
Large absorption needs
Social Relationships Friends, family, community members Institutions
barrier to financial inclusion as they have to transfer funds away from cash in order to use formal financial services. Microfinance organizations were established to provide credit to people whose sources of income were informal, as their access to loans was limited by their undocumented employment and income.
The types of products that an individual is already using will affect future choices. Given that people tend to be comfortable with what they know, consumer choices are often path-dependent. Someone who often uses informal credit may also tend to choose informal savings. Similarly, someone who already has a formal bank account may also tend to go first to the bank when applying for a loan.
Absorptive capacity – the ability of a financial product to “absorb” additional income – also has a bearing on future financial service choice. Most self-help groups, rotating savings, and credit associations, or accumulating savings and credit associations, for example, can only absorb a certain amount of money from each member before an individual “outgrows” the group. It would be useful to know more about the upper limits to informal mechanisms, an area for further research.
Finally, social relationships play a role in this shift. Trust and comfort can be additional factors that affect the shift from informal to formal financial services. If one’s existing cadre of financial services is largely informal, then the trust networks will also largely be in the informal sector. To be willing to

16 Center for Financial Inclusion at Accion Growing Income, Growing Inclusion: How Rising Incomes at the Base of the Pyramid Will Shape Financial Inclusion
shift to the formal financial sector, an individual has to trust a different kind of institution. People using informal means understand how to operate in an environment based on personal relationships and are uncomfortable with the impersonal and rules-based operations of formal institutions.
These factors – income, existing patterns of financial use, and social relationships – must be taken into consideration in product design. If a savings product requires maintaining a high minimum balance, for instance, someone with an irregular cash flow may not be able to commit funds to the account. If a product is unfamiliar or complex compared to products in an existing informal portfolio, these traits may be deterrents to use.
Many supply-side influences will also, of course, determine whether someone will want to or be able to use formal services. Eligibility and documentation requirements, proximity of infrastructure, interest rates, and inflation all contribute to the decision to operate in the formal financial system. Supply factors are not, however, the focus of this report. The transition from informal to formal is likely as incomes rise, but not it is not necessarily easy. Policymakers and providers have the opportunity to foster an environment that supports individuals in making the transitions they choose.
17Growing Income, Growing Inclusion: How Rising Incomes at the Base of the Pyramid Will Shape Financial Inclusion
Part 5. Implications for Providers and Policymakers
Growing income at the bottom of the pyramid translates into market opportunity, which is especially large in the low and middle income economies where most of the world’s people live, though this trend is not yet pronounced in the poorest countries. The bottom 40 percent of low and middle income economies will earn a cumulative $15.8 trillion over the course of this decade. While this amount is much lower than the earnings of the top 60 percent over the same time period, the lower segment is far less saturated with formal financial services. In order to be competitive in frontier and emerging markets as these income shifts occur, providers must invest now in connecting with new clients. Those that do will see a significant future return.
Providers
We assume that the objectives of providers are:
• To create profitable customer relationships that will last for years.• To maintain a favorable position in a rapidly changing retail financial services market.• For some providers, to contribute to a social mission of benefitting lower income people.
In order to capitalize on these market opportunities, providers need to understand how prospective customers who now use mainly informal financial services are likely to transition to formal services. This effort involves understanding how their incomes and economic activities are likely to change with rising incomes, the levels of cultural comfort they have with informal and formal services, and how the specific elements of their financial lives intersect. Traditional products, scaled down from products for the middle class, may not attract them.
Providers often speak about “on-ramps” to financial inclusion, implying that the use of a given formal service by a new customer operates as an entry point to the full suite of services we envision financial inclusion to involve. Many different services have been proposed as preferred on-ramps to financial inclusion. No-frills bank accounts, government benefit payments, bill payment services, mobile money transfers, prepaid debit cards, and even microloans have all been put forward. What these candidates all have in common is that they are currently viable products (viable for providers) that can be fairly easily rolled out to multitudes of low income people. However, while all these services could pull clients into using a broader range of services, there is no guarantee that they will. There is more to learn about how creative product design can entice people.
Providers need to approach engagement with prospective clients flexibly, with an understanding of the patterns that comprise their existing financial lives. They can benefit from getting to know sub-segments among the broad vulnerable class, whether segmenting by age, income source, or gender.
As providers contemplate the challenge of reaching these new customers, the need for attention to financial education and client protection should be apparent. First-time clients will need extra information, education, and support to induce them to cross into the unfamiliar territory of formal services. Financial capability involves not only information (knowledge) but also skills (learned through practice) and attitudes (confidence in approaching formal institutions). Providers are well-positioned to support the development of financial capability, and if their efforts bring in new clients who use multiple services.
Client protections – transparency, fair treatment, recourse systems – are not only good business practices, but can also affect trust in the formal financial sector. As trust is one of the factors that influence the transition from informal to formal financial services, client protection can have an important bearing on the attitudes that determine what people will do. Moreover, attention to client protection may minimize the reputational risk that can accompany

18 Center for Financial Inclusion at Accion Growing Income, Growing Inclusion: How Rising Incomes at the Base of the Pyramid Will Shape Financial Inclusion
working with vulnerable populations. Providers need not wait to hear from regulators on client protection, but can take affirmative responsibility for putting protections in place.
While we have focused on the market opportunity created as people move into the vulnerable class, there remains the question of how providers can engage with people who are still poor. Many people’s incomes will rise only modestly by the end of the decade, concentrated in the least developed economies, but also in pockets throughout countries of all income levels. While still-poor segments may not be reachable by all providers, we know that specialized providers like microfinance institutions can target the poor in a financially sustainable and scalable manner. And the frontier of possibility is changing. Over the next few years, even where incomes do not rise greatly, technology may bring costs down enough to make an expansion of services possible even to clients of very limited means. For providers with an explicitly social mission, entering into markets with the greatest need will be an important factor in facilitating low income economies’ economic growth.
Policymakers
The rise in incomes at the base of the pyramid during this decade will undoubtedly trigger a rapid increase in financial inclusion, driven from both the demand side (“I’m outgrowing my current informal services”) and supply side (“Capture newly available revenue pools”). Policymakers have both an active and a reactive responsibility in the face of this increase, first to encourage growth, and second to safeguard those who participate in it.
We assume that policymakers pursue financial inclusion with three interconnected objectives:
• To create a just and inclusive society that enhances the well-being of a significant portion of their population.
• To maximize the economic potential of their economies through the inclusion of previously excluded and underserved people.
• To contribute to financial stability by ensuring that a competitive market develops in a safe way as new customers enter the system.
Policymakers in many countries are engaged in crafting financial inclusion strategies and creating targets to track progress on financial inclusion objectives.22 Clear strategies can hasten inclusion by focusing efforts of various stakeholders to complement each other in moving towards common ends. To actively foster financial inclusion, policymakers can reduce barriers to entry for providers. Setting proportional know-your-customer requirements, encouraging interoperability between institutions, and allowing new players with new business models to enter the market are all examples of fostering the opportunity created by rising incomes.
The most effective strategies will not be overly prescriptive. We have argued that people will choose their own paths to financial inclusion. Policymakers are often tempted to envision a specific path and craft policies to promote that path. At various times and in various countries we have seen bank accounts touted as the best starting points under the banner of “banking the unbanked,” as we have seen savings-first, credit-later strategies. More recently, payments, particularly electronic money transfers and government benefit payments, have been highlighted as the best starting point. Government to person (G2P) payments have become a recent focal point, and they offer a powerful tool for encouraging a shift to digital transactions and formal accounts. But again, government benefit payments in digital form will not be an on-ramp for everyone who receives them.
The reality will be far messier, with multiple paths developing simultaneously as people assert their various needs, and providers of many types attempt to meet them. Flexibility is of special importance as technology creates additional entry points to financial inclusion and as new providers beyond traditional regulated financial institutions come into the sector. Regulators do not enjoy “messy,” but they must be willing to build flexibility into their strategies. The
22. For more on national strategies for financial inclusion, see: Douglas Pearce and Claudia Ruiz Ortega, Financial Inclusion Strategies Reference Framework (Washington, DC: World Bank, 2012); Alliance for Financial Inclusion, Organizing for Financial Inclusion (Bangkok: AFI, 2012); and Consultative Group to Assist the Poor, A Guide to Regulation and Supervision of Microfinance: Consensus Guidelines (Washington DC: CGAP, 2012).

19Growing Income, Growing Inclusion: How Rising Incomes at the Base of the Pyramid Will Shape Financial Inclusion
more they learn about how people transition from informal to formal, the better they will be at guiding an orderly marketplace.
A rapid influx of new customers into the financial system brings special risks to the attention of policymakers. The necessity of protecting and educating customers is intensified during a period of rapid change such as income growth in this decade. True to their name, clients in the vulnerable class may be vulnerable to problems arising from their inexperience. These problems include susceptibility to aggressive sales pitches and even scams, fraud, or pyramid schemes. New clients who are eager to obtain the trappings of a middle-class lifestyle, or who simply lack experience with credit, may fall into over-indebtedness. There is a compelling case for the urgency of stepped-up client protection and in financial education efforts, and governments should be prepared to make investments in this area well beyond those they have made in the past.
One particular area for policymaker attention is consumer credit. Consumer credit among base-of-the-pyramid customers is growing rapidly in many countries. Department store credit may in fact be an unheralded (and sometimes unhealthy) financial inclusion on-ramp. In Chile, for example, 42 percent of low income families were found to have store credit, while only 15 percent have bank credit.23 Regulators may have previously viewed consumer credit as a middle-class phenomenon or looked at it from a macro-prudential rather than consumer protection perspective. Past lack of attention also springs from the fact that many providers of consumer credit, such as retailers, are not regulated financial institutions and operate in the shadows of the financial sector, at least from a regulatory perspective. Regulators lack jurisdiction and monitoring capabilities. This reality needs to change, and quickly, as over-indebtedness often follows rapid consumer credit growth.
Efforts to protect clients against financial crimes also need to be stepped up, as people with rising
23. Presentation by Rodrigo Cifuentes, Banco Central de Chile, workshop: “International Dialogue on Consumer Credit in Latin America,” sponsored by FOMIN, CGAP and ASBA, Washington DC, March 2013.
incomes and little experience are attractive targets for fraudsters and scams. Interviews with low income people reveal that getting caught in a pyramid scheme or involved with fraudulent providers is a frequent fact of life. Not only can people in the vulnerable class ill-afford the consequences of being financial crime victims, negative experiences that appear to involve formal providers will likely sour both the victims and their neighbors on the use of formal financial services.
In developing strategies to educate and protect new customers, regulators will have to adjust their span of concern to bring shadow banking, which they have not previously regulated, into the open and to use a special lens to focus on the experience of lower income customers (whose numbers are often ignored because the money amounts involved are small). This focus will require a profound shift in the way regulators operate, as well as different skills.
Finally, policymakers have a special responsibility to consider how to engage and provide for people who will remain poor throughout the decade. Those in the bottom quintile in middle income economies and in the bottom two quintiles in low income economies will continue on average to have incomes below the level of the vulnerable class. Even the poorest countries can foster progress in financial inclusion, especially through technologies that allow massive access at low cost. One need only observe the progress that has been taking place in Kenya, led by Equity Bank and M-PESA and supported by policy, to see that possibilities exist even where incomes remain low.
Policymakers in middle income countries should focus on the pockets of poverty in their countries and examine how their social safety net programs, such as conditional (or non-conditional) cash transfers and pension schemes relate to financial services. They should also continue to support and partner with organizations that continually direct their efforts toward reaching the very poor.
20 Center for Financial Inclusion at Accion Growing Income, Growing Inclusion: How Rising Incomes at the Base of the Pyramid Will Shape Financial Inclusion
Part 6. Country Contexts
We have chosen three countries to illustrate income growth at the base of the pyramid. Each country has shown global financial inclusion leadership, though each faces different opportunities and challenges. These three countries are also examined in CFI’s accompanying report on demography.24
South Africa
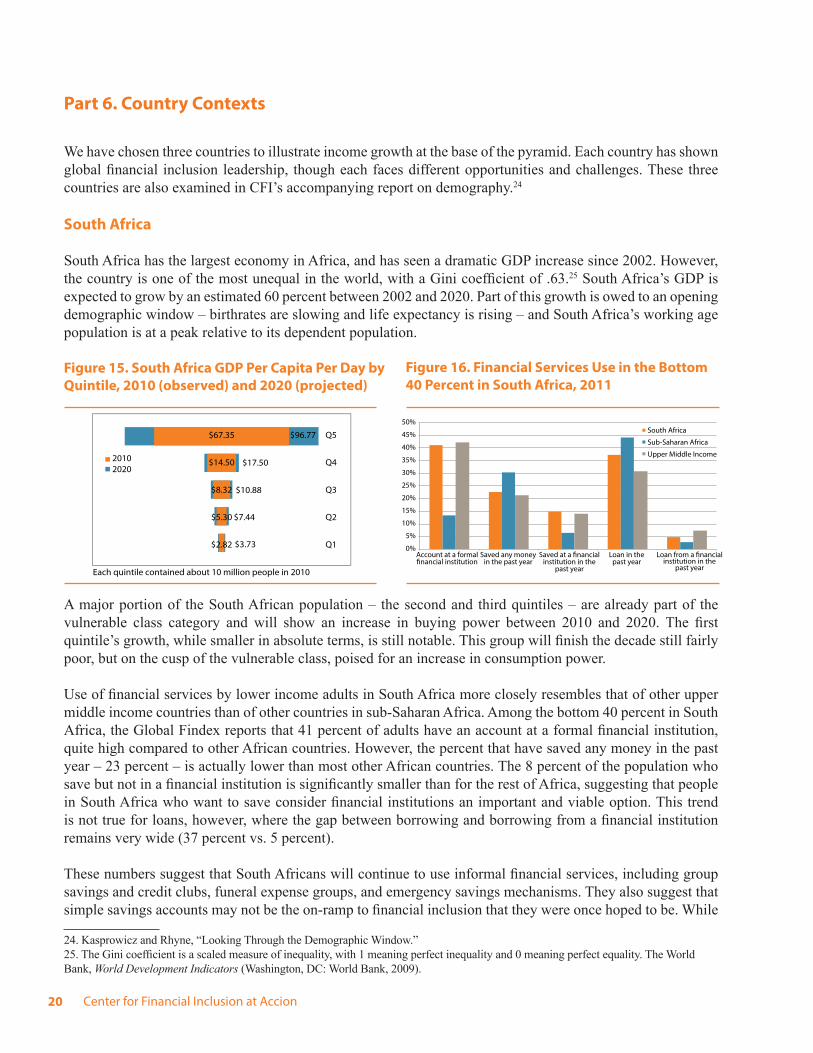
South Africa has the largest economy in Africa, and has seen a dramatic GDP increase since 2002. However, the country is one of the most unequal in the world, with a Gini coefficient of .63.25 South Africa’s GDP is expected to grow by an estimated 60 percent between 2002 and 2020. Part of this growth is owed to an opening demographic window – birthrates are slowing and life expectancy is rising – and South Africa’s working age population is at a peak relative to its dependent population.
Figure 15. South Africa GDP Per Capita Per Day by Quintile, 2010 (observed) and 2020 (projected)
A major portion of the South African population – the second and third quintiles – are already part of the vulnerable class category and will show an increase in buying power between 2010 and 2020. The first quintile’s growth, while smaller in absolute terms, is still notable. This group will finish the decade still fairly poor, but on the cusp of the vulnerable class, poised for an increase in consumption power.
Use of financial services by lower income adults in South Africa more closely resembles that of other upper middle income countries than of other countries in sub-Saharan Africa. Among the bottom 40 percent in South Africa, the Global Findex reports that 41 percent of adults have an account at a formal financial institution, quite high compared to other African countries. However, the percent that have saved any money in the past year – 23 percent – is actually lower than most other African countries. The 8 percent of the population who save but not in a financial institution is significantly smaller than for the rest of Africa, suggesting that people in South Africa who want to save consider financial institutions an important and viable option. This trend is not true for loans, however, where the gap between borrowing and borrowing from a financial institution remains very wide (37 percent vs. 5 percent).
These numbers suggest that South Africans will continue to use informal financial services, including group savings and credit clubs, funeral expense groups, and emergency savings mechanisms. They also suggest that simple savings accounts may not be the on-ramp to financial inclusion that they were once hoped to be. While
24. Kasprowicz and Rhyne, “Looking Through the Demographic Window.”25. The Gini coefficient is a scaled measure of inequality, with 1 meaning perfect inequality and 0 meaning perfect equality. The World Bank, World Development Indicators (Washington, DC: World Bank, 2009).
20102020
$67.35
$14.50
$8.32
$5.30
$2.82
$17.50
$10.88
$7.44
$3.73
Q5
Q4
Q3
Q2
Q1
Each quintile contained about 10 million people in 2010
$96.7750%
45%
40%
35%
30%
25%
20%
15%
10%
5%
0%Account at a formal�nancial institution
Saved any money in the past year
Saved at a �nancialinstitution in the
past year
Loan in the past year
Loan from a �nancialinstitution in the
past year
South Africa
Sub-Saharan Africa
Upper Middle Income
Figure 16. Financial Services Use in the Bottom 40 Percent in South Africa, 2011

21Growing Income, Growing Inclusion: How Rising Incomes at the Base of the Pyramid Will Shape Financial Inclusion
the Reserve Bank of South Africa mandated a no-frills savings account almost a decade ago, and many people opened them, this has not translated into high use of accounts for savings.
Mexico
Mexico has enjoyed fairly consistent GDP growth since 1980, and is expected to continue to see a rise in GDP. The bottom 40 percent are sharing in Mexico’s national success, though of course their gains have been moderate in comparison to the highest earners. The average incomes for the bottom two quintiles in Mexico already place most of their members in the vulnerable class. Extreme poverty is expected to decline significantly in Mexico over the decade. By 2020, it is predicted that 70 percent of Mexico’s population will be living above the national poverty line, a great improvement over 2000 when only 50 percent of people were above the line, and a level at which people have more than enough money for nutritional needs and can begin to build assets.26
Figure 17. Mexico GDP Per Capita Per Day by Quintile, 2010 (observed) and 2020 (projected)
Mexico’s population is aging. The largest population growth during the decade will be people moving into their 40s through 60s. Given this trend, it is essential that people apply their increased incomes to prepare for old age, signaling the importance of long-term savings, pensions, and health insurance.
While Mexico’s physical banking presence is impressive, thanks to a coordinated effort to move to more rural communities, participation in formal financial services in Mexico is low relative to its income level and to other Latin American countries.
26. CFI, 2009
Only 12 percent of the bottom two quintiles have an account at a formal financial institution (compared to 41 percent in South Africa). This result may be due in part to a large proportion (38 percent) of households that were informally employed and therefore do not receive their income from a formal source via an account.
McKinsey calls Mexico a “red hot” country, among those in the world that have a “fast-growing, large and partly unserved... banking market.”27 According to the same report, financial inclusion is increasing at about 3 percent per annum.28
Figure 18. Financial Services Use in the Bottom 40 Percent in Mexico, 2011
In Mexico, those with formal employment automatically receive a formal bank account. There is an opportunity, therefore, to test and establish on-ramps for households that are not formally employed in Mexico. Consumer credit in Mexico is alarmingly high, and policymakers should make sure that services are being delivered to an informed and empowered customer base. If consumer credit is not curbed, Mexico could face a credit crisis before the end of the decade.
Nigeria
Nigeria’s GDP is projected to continue a modest yearly rise, but the country remains a low income economy. A surprisingly high percent of expected income gains
27. Mutsa Chironga et al. Micro-, Small and Medium-Sized Enterprises in Emerging Markets: How Banks Can Grasp a $350 Billion Opportunity (Washington, DC: McKinsey, 2012), pg. 3.28. As reported in Chironga et al., 2012. Figure indicates the yearly increase in percent of population with access to financial services, based on five-year growth of deposits per capita according to the IMF Financial Access Survey 2006-2010. In 2006, for example, Mexico had .61 deposits per capita compared to .63 deposits per capita in 2007.
20102020
$67.31
$25.14
$16.11
$10.10
$4.62
$32.78
$21.27
$13.25
$5.75
Q5
Q4
Q3
Q2
Q1
Each quintile contained about 23 million people in 2010
$83.82
0%
5%
10%
15%
20%
25%
30%
35%
40%
45%
50%
Account at a formal Saved any money in the past year institution in the
Loan in the past year institution in the
Mexico
Latin America and the Caribbean
Upper Middle Income
�nancial institutionSaved at a �nancial Loan from a �nancial
past year past year
22 Center for Financial Inclusion at Accion Growing Income, Growing Inclusion: How Rising Incomes at the Base of the Pyramid Will Shape Financial Inclusion
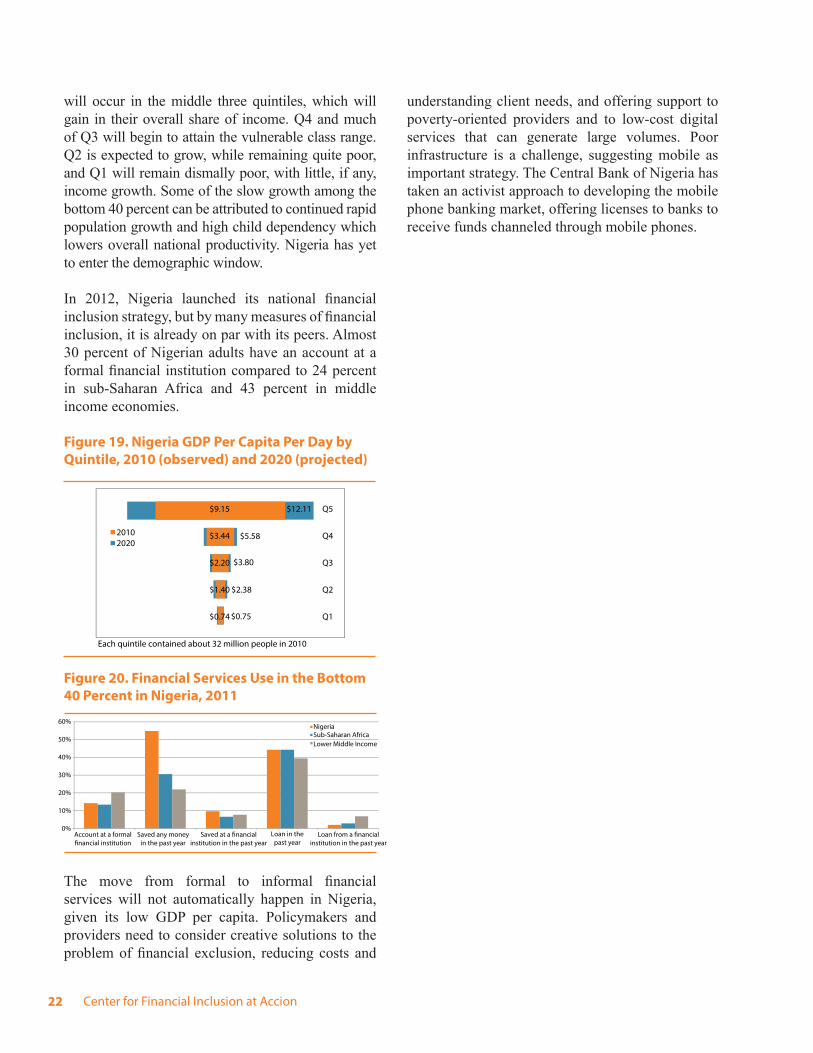
will occur in the middle three quintiles, which will gain in their overall share of income. Q4 and much of Q3 will begin to attain the vulnerable class range. Q2 is expected to grow, while remaining quite poor, and Q1 will remain dismally poor, with little, if any, income growth. Some of the slow growth among the bottom 40 percent can be attributed to continued rapid population growth and high child dependency which lowers overall national productivity. Nigeria has yet to enter the demographic window.
In 2012, Nigeria launched its national financial inclusion strategy, but by many measures of financial inclusion, it is already on par with its peers. Almost 30 percent of Nigerian adults have an account at a formal financial institution compared to 24 percent in sub-Saharan Africa and 43 percent in middle income economies.
Figure 19. Nigeria GDP Per Capita Per Day by Quintile, 2010 (observed) and 2020 (projected)
Figure 20. Financial Services Use in the Bottom 40 Percent in Nigeria, 2011
The move from formal to informal financial services will not automatically happen in Nigeria, given its low GDP per capita. Policymakers and providers need to consider creative solutions to the problem of financial exclusion, reducing costs and
understanding client needs, and offering support to poverty-oriented providers and to low-cost digital services that can generate large volumes. Poor infrastructure is a challenge, suggesting mobile as important strategy. The Central Bank of Nigeria has taken an activist approach to developing the mobile phone banking market, offering licenses to banks to receive funds channeled through mobile phones.
20102020
$9.15
$3.44
$2.20
$1.40
$0.74
$5.58
$3.80
$2.38
$0.75
Q5
Q4
Q3
Q2
Q1
Each quintile contained about 32 million people in 2010
$12.11
0%
10%
20%
30%
40%
50%
60%
Loan in the past year
Nigeria Sub-Saharan Africa Lower Middle Income
Account at a formal�nancial institution
Saved any moneyin the past year
Saved at a �nancialinstitution in the past year
Loan from a �nancialinstitution in the past year

23Growing Income, Growing Inclusion: How Rising Incomes at the Base of the Pyramid Will Shape Financial Inclusion
Annex 1: Average Per Capita Income Per Day by Country in the Bottom 40 Percent, 2010 and 2020 29
$0 $2 $4 $6 $8 $10 $12 $14 $16 $18 $20 $22 $24 $26
Cambodia
China
Indonesia
Lao
Malaysia
Mongolia
Philippines
Thailand
Timor-Leste
Viet Nam
East Asia and Paci c
Q2 2020 Q2 2010 Q1 2020 Q1 2010
29. Countries with populations over 1,000,000.
$0 $2 $4 $6 $8 $10 $12 $14 $16 $18 $20 $22 $24 $26
Albania
Armenia
Azerbaijan
Belarus
Bulgaria
Georgia
Kazakhstan
Kyrgyz Republic
Latvia
Lithuania
Macedonia
Moldova
Romania
Russian Federation
Serbia
Tajikistan
Turkey
Turkmenistan
Ukraine
Uzbekistan
Eastern Europe and Central Asia
($35)
($27)
Bosnia and Herzegovina
$0 $2 $4 $6 $8 $10 $12 $14 $16 $18 $20 $22 $24 $26
Argentina
Bolivia
Brazil
Chile
Colombia
Costa Rica
Dominican
Ecuador
El Salvador
Guatemala
Honduras
Jamaica
Mexico
Nicaragua
Panama
Paraguay
Peru
Uruguay
Venezuela
Latin America and Caribbean

24 Center for Financial Inclusion at Accion Growing Income, Growing Inclusion: How Rising Incomes at the Base of the Pyramid Will Shape Financial Inclusion
$0 $2 $4 $6 $8 $10 $12 $14 $16 $18 $20 $22 $24 $26
Algeria
Egypt
Iran
Iraq
Jordan
Morocco
Tunisia
Yemen
Middle East and North Africa
Q2 2020 Q2 2010 Q1 2020 Q1 2010
$0 $2 $4 $6 $8 $10 $12 $14 $16 $18 $20 $22 $24 $26
Bangladesh
India
Nepal
Pakistan
Sri Lanka
South Asia
$0 $2 $4 $6 $8 $10 $12 $14 $16 $18 $20 $22 $24 $26
Botswana
Burkina Faso
Burundi
Cameroon
Central African
Chad
Congo, Dem.
Cote d`Ivoire
Ethiopia
Gabon
Gambia
Ghana
Guinea
Guinea-Bissau
Kenya
Lesotho
Madagascar
Malawi
Mali
Mauritania
Mozambique
Namibia
Niger
Nigeria
Rwanda
Senegal
Seychelles
Sierra Leone
South Africa
Sudan
Swaziland
Tanzania
Uganda
Zambia
Zimbabwe
Sub-Saharan Africa

25Growing Income, Growing Inclusion: How Rising Incomes at the Base of the Pyramid Will Shape Financial Inclusion
$0 $25 $50 $75 $100 $125 $150 $175
Australia
Austria
Belgium
Canada
Croatia
Czech Republic
Denmark
Estonia
Finland
France
Germany
Greece
Hungary
Ireland
Israel
Italy
Japan
Korea, Republic of
Netherlands
New Zealand
Norway
Poland
Portugal
Singapore
Slovak Republic
Slovenia
Spain
Sweden
Switzerland
Trinidad and Tobago
United Kingdom
United States
High Income
Q2 2020 Q2 2010 Q1 2020 Q1 2010
Note that the scale is different for high-income countries than other regions

26 Center for Financial Inclusion at Accion
Annex 2: World Bank Region and Income Groups 30
30. As classified by the World Bank for the fiscal year beginning on July 1, 2012. These region and income groups change yearly, but for the sake of year-by-year comparison, we apply these classifications to all years.
HIGH INCOMEAndorra Germany NorwayAruba Greece OmanAustralia Greenland PolandAustria Guam PortugalBahamas, The Holy See Puerto RicoBahrain Hong Kong SAR, China QatarBarbados Hungary San MarinoBelgium Iceland Saudi ArabiaBermuda Ireland SingaporeBrunei Darussalam Isle of Man Sint Maarten (Dutch part)Canada Israel Slovak RepublicCayman Islands Italy SloveniaChannel Islands Japan SpainCroatia Korea, Rep. St. Kitts and NevisCuracao Kuwait St Martin (French part)Cyprus Liechtenstein SwedenCzech Republic Luxembourg SwitzerlandDenmark Macao SAR, China Trinidad and TobagoEquatorial Guinea Malta Turks and Caicos IslandsEstonia Monaco United Arab EmiratesFaeroe Islands Netherlands United KingdomFinland New Caledonia United StatesFrance New Zealand Virgin Islands (U.S.)French Polynesia Northern Marina Islands
EAST ASIA AND PACIFICLow Income Middle Income (Lower) Middle Income (Upper)Cambodia Fiji American SamoaKorea, Dem. Rep Indonesia ChinaMyanmar Kiribati Malaysia
Lao PDR PalauMarshall Islands ThailandMicronesia, Fed. Sts. TuvaluMongoliaPapua New GuineaPhilippinesSamoaSolomon IslandsTimor-LesteTongaVanuatuVietnam
EASTERN EUROPE AND CENTRAL ASIALow Income Middle Income (Lower) Middle Income (Upper)Kyrgyz Republic Albania AzerbaijanTajikistan Armenia Belarus
Georgia Bosnia and HerzegovinaMoldova BulgariaUkraine KazakhstanUzbekistan Latvia
LithuaniaMacedonia, FYRMontenegroRomaniaRussiaSerbiaTurkeyTurkmenistan
LATIN AMERICA AND THE CARIBBEANLow Income Middle Income (Lower) Middle Income (Upper)Haiti Belize Antigua and Barbuda
Bolivia ArgentinaEl Salvador BrazilFrench Guiana ChileGuatemala ColombiaGyuana Costa RicaHonduras CubaNicaragua DominicaParaguay Dominican Republic
EcuadorGrenadaJamaicaMexicoPanamaPeruSt. LuciaSt. Vincent and the GrenadinesSurinameUruguayVenezuela, RB
MIDDLE EAST AND NORTH AFRICALow Income Middle Income (Lower) Middle Income (Upper)
Djibouti AlgeriaEgypt, Arab Rep. Iran, Islamic Rep.Iraq JordanMorocco LebanonSyrian Arab Republic LibyaWest Bank and Gaza TunisiaYemen, Rep.
SOUTH ASIALow Income Middle Income (Lower) Middle Income (Upper)Afghanistan Bhutan MaldivesBangladesh IndiaNepal Pakistan
SUB-SAHARAN AFRICALow Income Middle Income (Lower) Middle Income (Upper)Benin Cameroon AngolaBurkina Faso Cape Verde BotswanaBurundi Congo, Rep. GabonCentral African Republic
Cote d'Ivoire Ghana
Mauritius Namibia
Chad Lesotho SeychellesComoros Nigeria South AfricaCongo, Dem. Rep. Sao Tome and PrincipeEritrea SenegalEthiopia South SudanGambia, The SudanGuinea SwazilandGuinea-Bissau ZambiaKenyaLiberiaMadagascarMalawiMaliMauritaniaMozambiqueNigerRwandaSierra LeoneSomoliaTanzaniaTogoUgandaZimbabwe
Center for Financial InclusionPublication 19
Growing Income, Growing Inclusion: How Rising Incomes at the Base of the Pyramid Will Shape Financial InclusionFinancial Inclusion 2020 Project:Mapping the Invisible Market
The Center for Financial Inclusion at Accion (CFI) helps bring about the conditions to achieve full financial inclusion around the world. Constructing a financial inclusion sector that reaches everyone with quality services will require the combined efforts of many actors. CFI contributes to full inclusion by collaborating with sector participants to tackle challenges beyond the scope of any one actor, using a toolkit that moves from thought leadership to action.
www.centerforfinancialinclusion.orgwww.financialinclusion2020.org
Founding Partner
Financial Inclusion 2020 is funded by:
Lead Partner & FI2020 Founding Sponsor
Principal PartnersPrincipal Partner & FI2020 Founding Sponsor
Project PartnersMapping the Invisible
Market SponsorFounding Partner