growing money on trees in latin america: growth rates for ... · growing money on trees in latin...
TRANSCRIPT

American-Eurasian J. Agric. & Environ. Sci., 16 (1): 01-19, 2016ISSN 1818-6769© IDOSI Publications, 2016DOI: 10.5829/idosi.aejaes.2016.16.1.12833
Corresponding Author: Gregory J. Scott, CENTRUM, Graduate Business School, Pontificia Universidad Católica De Perú Lima, Perú.
1
Growing Money on Trees in Latin America: Growth Rates for Cocoa 1961-2013 and Their Implications for Industry
Gregory J. Scott
CENTRUM, Graduate Business School, Pontificia Universidad Católica De Perú Lima, Perú
Abstract: Despite being the center of origin for cocoa, cocoa cultivation and use, Latin America witnessed onlymodest increases in output, area harvested and yields for this commodity during the last half century.However, these long-term trends mask a diverse array of booms, then busts for cocoa in many parts of theregion. Recent years have seen a run-up in international prices, the diffusion of improved varieties and thelaunching of various public-private alliances to improve cocoa productivity, quality and incomes. This paperanalyses these and other important developments at both the regional and country level over the last fivedecades. In so doing it seeks to provide a more nuanced assessment of regional developments for cocoa as wellas highlight important implications for industry.
Key words: Production Area Yields Technology Prices Trade
INTRODUCTION Noteworthy factors driving the growth in demand
As the global economy moved into the new flavored products by middle class consumers inmillennium, the planet´s growing appetite for more, higher developing countries, especially in China, Brazil and Indiaquality and more exotic foods and food products became [8, 15]; from 2008 to 2011, for example, China grew from theincreasingly more evident [1, 2, 3]. Changing tastes and 12th to 9th largest importer of cocoa paste and from thepreferences combined with falling tariffs and barriers to 15th to 9th largest importer of cocoa powder and cake [7].trade meant that many developing countries were eager to On the supply side, prices for cocoa have also beenexplore avenues to better position themselves to take full bolstered by recurrent uncertainty regarding productionadvantage of these emerging trends [4, 5, 6]. in the West African countries — in particular Ivory Coast,
Cocoa stands out as one of various agricultural but including Ghana and Nigeria, where over 70% ofcommodities attracting renewed attention for a number of annual global output is harvested [8]. While recentreasons. With an estimated five to six million producers in assessments seek to refute pessimistic notions about thedeveloping countries [7], annual global trade in cocoa and future outlook for cocoa production in these countries,cocoa-based processed products (e.g., cocoa butter, they go on to acknowledge the decline in cocoapaste, as well as chocolates) is measured in the US$ production in Asia [13, 16]. Added to that is the concernbillions [8]. Moreover, as growing demand repeatedly about the possible impact of climate change on cocoaexceeded available supplies [9, 10], cocoa prices rose from production in West Africa in the not too distant futureless than US$ 800/mt in 2000 [11] to hit a 30-year high of [17]. The combined effect has contributed to renewedUS$3, 625 in January 2010 [12]. They then fell back to interest in cocoa in Latin America (LAC), the center ofroughly US$ 2, 300/mt in Feb 2012 as harvested volumes origin for the commodity for several additional reasons. increased and demand momentarily weakened. Despite the A number of LAC countries have identified cocoa aslatest gyrations, more recent (Nov 2015) market data show having unrealized potential to help diversify agriculturalprices at roughly US$ 3100/mt with a robust outlook for exports, capitalize on the rise in international prices,the years ahead [7, 13, 14]. reduce greenhouse gas emissions and help preserve
include the growing appetite for chocolate and chocolate-

Am-Euras. J. Agric. & Environ. Sci., 16 (1): 01-19, 2016
2
bio-diversity [18, 19, 20, 21, 22, 23]. They also see cocoa half century, this study follows the method first presentedproduction as a way to generate higher incomes for the in Scott [33] then further developed in Scott, Labarta andlow-income households that frequently dominate Suarez [34]. To that end, the paper utilizes FAO times-domestic production systems and spur opportunities for series data for these key indicators first to calculateincreased value-added off the farm all of which are annual averages for the beginning (1961-63) and the endcontingent upon increases in productivity and (2011-13) of the period and then to calculate the ACGRsimprovements in quality [15, 24, 25 26, 27]. over the entire fifty years, first for the region as a whole
While several recent studies have examined and then for particular countries in different sub-regions,prospects for cocoa in LAC, these reports typically e.g., Brazil andean region. The study uses FAO data tohave focused on the entire region [13, 16, 28] without serve as a common source of information for LAC and forincluding much country-level analysis. Moreover, they comparing across countries within the region.tend to examine trends in absolute production rather Subsequently, ACGRs were also calculated over the firstthan growth rates over time, their evolution and the (1961-63 to 1986-88) and second (1986-88 to 2011-13)possible implications for future prospects for output, halves of the times-series in an initial attempt toarea and yields. Alternatively, a number of previous determine if these growth rates were slowing down orpapers have studied the cocoa sector in individual speeding up.countries and/or their principal growing areas in some A second dimension to this study involved trackingdetail [24, 29, 30, 31, 32], but given their focus have done the rate of change in the ACGRs for production, areaso with little regard for comparing domestic results with harvested and yields on a continuous basis during thethose for other countries. Among other limitations, last five decades. In other words, as referencing athese studies typically present a series of national particular set of years (e.g., 1984-86) or a given sub-set ofstatistics without comparing different domestic sources, time periods is arbitrary, this study also estimated, thenmuch less so country data with that made available by analysed the evolution of the growth rates themselves.international sources, their possible differences, or their ACGRs therefore were calculated using all the annual datamagnitude, let alone the possible reasons for such for every ten-year period beginning with 1961-71 at firstdiscrepancies. the regional and then country level (e.g., for Brazil,
In light of these considerations, this paper seeks to: calculated on a moving ten-year basis, i.e. 1961-63 to
Consolidate the historical data and related studies on 2011-13. These growth rates were then plotted to observecocoa in LAC so as to quantify the growth rates in the changes in their trajectory over the last five decades,production, area and yields over the last five examined to compare the shifting relative importance ofdecades, pointing out major patterns otherwise growth rates for area versus those for yields in relation toobscured by calculations for a given time period and those for production and used to estimate an overall trenddelineate the principal contributing factors; for each of the three variables first for LAC as a whole,Analyse the major differences for these performance then for the major cocoa-producing countries in theindicators for the five major cocoa-producing region.countries the region, attempting to clarify their A third key component of this study was theunderlying causes and in so doing provide a more associated “wall-to-wall” field work [35] involved innuanced assessment of regional developments; ferreting out and then analyzing not just previouslyBenchmark future prospects for cocoa in LAC in light published documents but also the so-called “gray” orof current trends and emerging tendencies; unpublished literature that examined some aspect ofHighlight important implications for industry; and, cocoa production, area and yields in one or more LACIdentify some key topics for future research. countries in recent years. In that regard, this study does
DATA SOURCES AND ANALYSIS topics considered or the results reported on related to the
In order to identify and then analyse average annual America, particularly given the long history of productioncompound growth rates (ACGRs) in cocoa production, in the region [29, 36, 37, 38]. Instead, it attempts toarea harvested and yields in Latin America over the last synthesize the major findings of earlier studies as a means
Ecuador, Mexico, Peru). In other words, growth rates were
1971-73, 1962-64 to 1972-74 and so on up to 2001-03 to
not pretend to provide an exhaustive treatment of all the
evolution of output, area and yields for cocoa in Latin

Am-Euras. J. Agric. & Environ. Sci., 16 (1): 01-19, 2016
FOB equivalent using an average annual price of US$ 2, 600 mt of cocoa for the three years using World Bank data, 1
http://www.worldbank.org/en/research/commodity-markets3
of helping to explain the trends that have been quantified fell in noteworthy fashion in Brazil and to a lesser extentor interpret the growth rates presented and in so doing for the Caribbean Region over the last quarter centuryprovide a more substantive analysis of regional (Table 1, Fig. 3), but these developments were partlydevelopments for cocoa production, area and yields. offset by noteworthy improvements in productivity
REGIONAL GROWTH RATES Two initial observations about these growth rates for
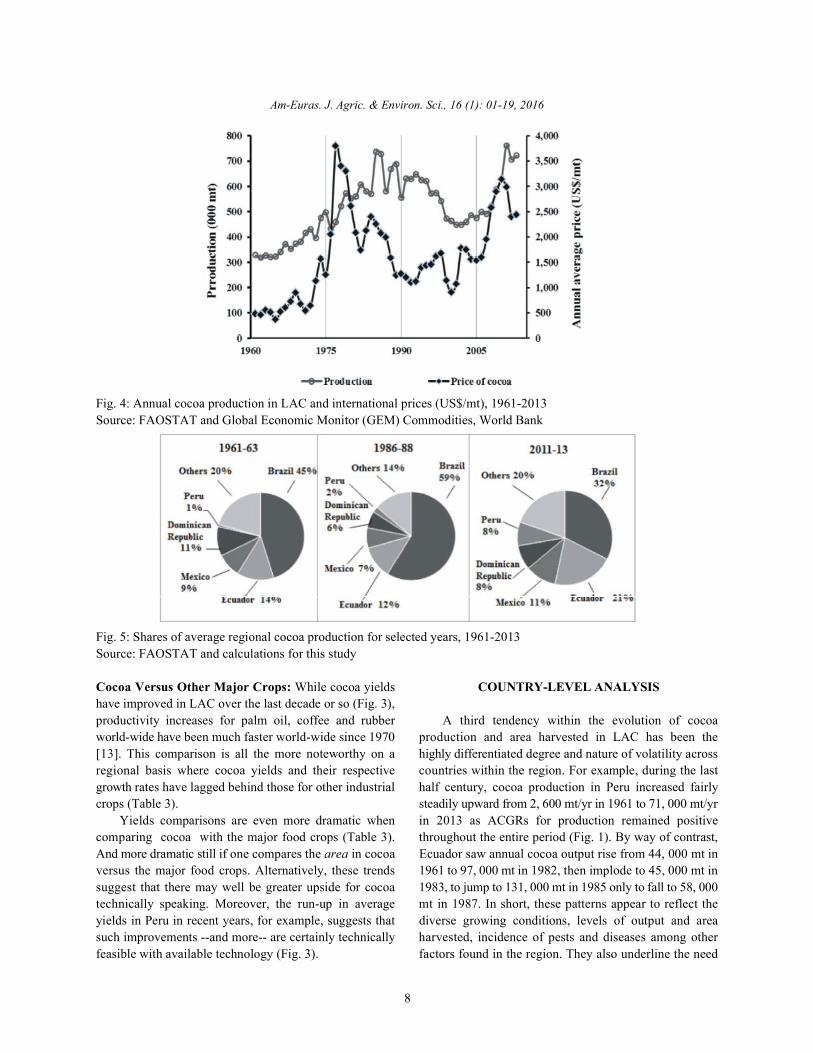
Cocoa production in LAC increased by over 400, 000 output followed, albeit with a lag, the quasi-cyclicalmetric tonnes (mt) or 125% during the last fifty years as evolution of international cocoa prices (Fig. 4). As pricesoutput increased at an annual average growth rate of trended upward from the early 1960s to late 1970s, output1.7%/yr to reach 730, 000 mt/yr by 2011-2013 (Table 1) expanded. Once they continued to fall from the mid-1980swith an estimated annual value of US$ 1.90 billion. to the late 1990s [11, 40], production, albeit with certain1
Notwithstanding, 90% of that increase took place in the exceptions, contracted considerably. After pricesinitial 25-yr period from 1961-63 to 1986-88 as ACGRs rose rebounded beginning in 2000, so did output. to over 3%/yr, then spiked to nearly 4%/yr (Fig. 1). After Secondly, as cocoa is a perennial tree crop, growthregional cocoa production reached a momentary peak of rates in area harvested in Latin America --generally688, 000 mt in 1989, output steadily declined to 449, 000 mt speaking-- have been much less volatile than those forin 2002, i.e., by some 239, 000 mt or 35% as ACGRs fell to yields or production (Table 1, Fig. 1-3). From that-4%/yr during this time, before subsequently recovering, perspective, other factors besides simply prices: weatherthen expanding to recent levels of over 5%/yr. Hence, the conditions (e.g., excess rainfall, drought, hurricanes), the50-yr growth rate in production obscures three distinct incidence of pests and diseases, age of the trees, soilstendencies embedded within the two sub-periods: the rise and soil management, macro-economic and politicalin output from the early 1960s to the mid-to-late 1980s, the stability, also assume importance in terms of theirdeclining growth rates through to 2003 and then the up- potential influence on harvesting rates and ultimatelyturn in growth rates until 2013 (Fig. 1). yields, on production. Noteworthy exceptions to this
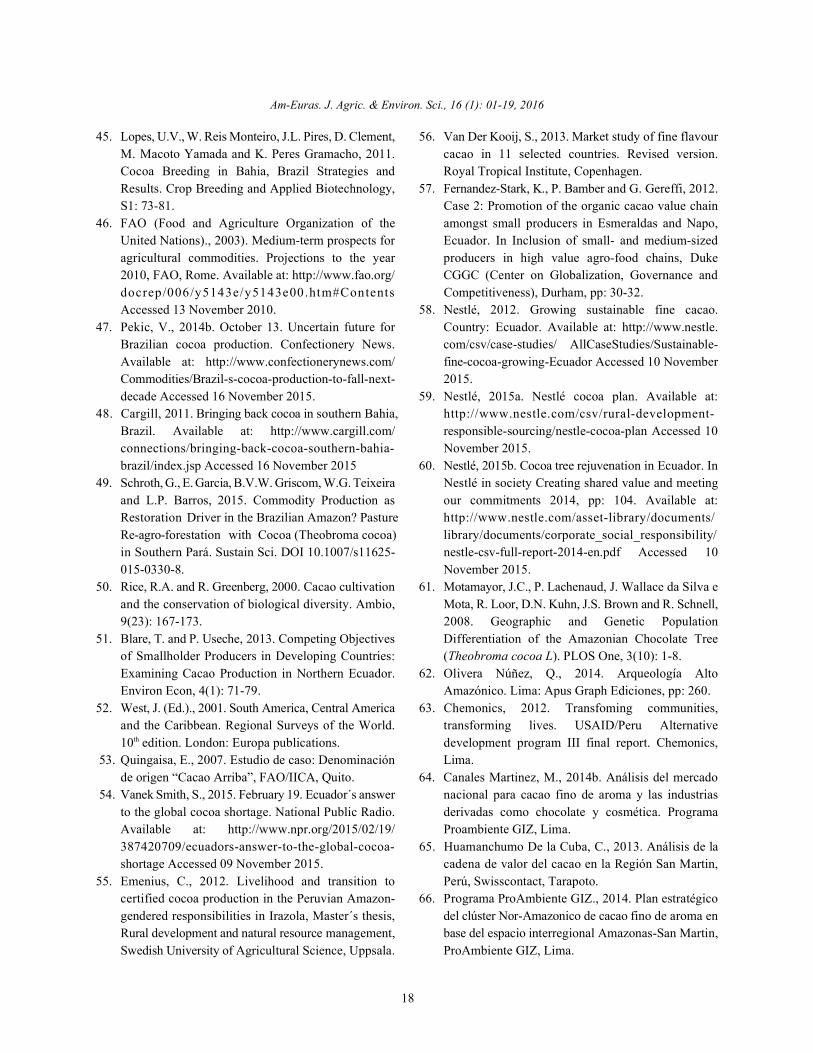
Area harvested in cocoa in LAC stood at 1.68 million observation as applies to the last half century would behectares (ha) in 2011-2013 as its evolution mirrored, albeit Mexico and Peru where growth rates for area far exceedednot entirely, that of production (Table 1). Area harvested those for yields (Table 1).surged in the period 1961-63 to 1986-88, going from Within Latin America cocoa production and area1.04 to 1.46 million ha as the ACGRs rose to over 3%/yr. harvested remains highly concentrated. Five countries:After then rising to 1.64 million ha in 1995, area contracted Brazil, Dominican Republic, Ecuador, Mexico and Peruby 249, 000 ha or 15% to 1.39 million ha by 2003 as ACGRs accounted for 80% of regional production and 86% of areafell to --1%/yr before subsequently rebounding to current harvested in 2011-13 versus 79% of production and 81%levels. Hence, for LAC as a whole, growth rates for area of area in 1961-63. These same five countries producedharvested slowed considerably over the last quarter 91% of the increase in production and generated 95% ofcentury (Table 1), although even those tendencies mask the expansion in area harvested over the last five decadesmajor fluctuations within the latter period and at the as well. Moreover, as will be indicated in greater detailsub-regional level (Fig. 2). below, with the noteworthy exception of Peru, commercial
As production and area harvested in cocoa in LAC area harvested within these same countries is also highlyexpanded over the last half century, average yields concentrated in a remarkably small number of geographicshowed only modest improvement to less than 500 kg locations. Conversely, 25 of the region´s 33 countriesha . This outcome was the result of sharply produce little (<10, 000 mt/yr) or no cocoa (Table 2). As a1
countervailing trends during the last five decades and consequence of these disparate patterns and trendsacross the region. While regional yields ratcheted upward across counties in the region, the relative importance offrom an average of 312 kg ha during 1961-63 to reach the major cocoa-producing countries has shifted with1
499 kg ha in 1984-86, they then plummeted to 302 kg Brazil declining and most notably Ecuador and Peru1
ha in 2000-2002 before recovering to 436 kg ha in increasing their respective shares of regional output1 1
2011-13 [39]. Furthermore, growth rates for cocoa yields (Fig. 5).
elsewhere in the region during the same period.
cocoa in Latin America are in order. Firstly, trends in

Ending 3 year average 1 1 *100Benginning 3 year average Number of year between beginning and end mid-points
− − −
Am-Euras. J. Agric. & Environ. Sci., 16 (1): 01-19, 2016
4
Table 1: Average annual growth rates for cocoa in Latin America, 1961-2013Growth ratea
2011-2013 ----------------------------------------------------------------------------------------------------------------------------------------------------- Production Area YieldProduction Area Yield ------------------------------- ---------------------------- ---------------------------
Region/country (000 mt) (000 ha) (kg ha ) 1 2 3 1 2 3 1 2 31
Latin America 730 1, 676 436 2.9 0.4 1.6 1.4 0.5 1.0 1.5 -0.1 0.7b
Brazil 253 685 369 4.0 -1.7 1.1 1.4 0.2 0.8 2.6 -1.9 0.3Andean Region 298 657 502 2.7 2.5 2.6 1.7 1.0 1.4 0.9 1.5 1.2c
Ecuador 162 397 407 2.3 3.0 2.6 1.5 0.9 1.2 0.8 2.1 1.4Peru 63 91 694 6.9 6.2 6.6 6.7 4.8 5.8 0.2 1.4 0.8Colombia 42 103 405 5.1 -0.8 2.1 4.6 -0.1 2.2 0.4 -0.8 -0.2Mexico 82 117 702 2.1 2.1 2.1 0.3 1.9 1.1 1.9 0.2 1.0Caribbean Region 79 192 412 0.0 1.6 0.8 1.6 0.1 0.8 -1.5 1.5 0.0d
Dominican Republic 65 152 428 0.5 1.9 1.2 2.6 0.2 1.4 -2.0 1.8 -0.2Central America 17 23 647 -1.4 2.3 0.4 -1.5 -0.7 -1.1 0.1 2.9 1.5e
Guatemala 12 4 2, 916 6.1 7.1 6.6 3.8 0.7 2.2 2.3 6.4 4.31 = 1986-88 vs 1961-63; 2 = 2011-13 vs 1986-88; 3 = 2011-13 vs 1961-63 where the average annual growth rate is calculated as followsa
For this study, Latin America includes Brazil, the Andean Region, Mexico, the Caribbean Region, Central America each defined below as well as Argentina*,b
Chile*, Guyana**, Paraguay*, Suriname** and Uruguay*. Andean Region consists of Bolivia**, Colombia, Ecuador, Peru and Venezuela***. Caribbeanc d
Region is made up of Antigua & Barbuda*, the Bahamas*, Barbados*, Cuba**, Dominica**, Dominican Republic, Grenada**, Haiti**, Jamaica**, St.Lucia**, St. Kitts & Nevis*, St. Vincent & the Grenadines** and Trinidad & Tobago**. Central America consists of Belize**, Costa Rica**, El Salvador**,e
Guatemala, Honduras**, Nicaragua** and Panama**.* according to FAOSTAT (2015), these countries reported producing no cocoa during 2011-13**according to FAOSTAT (2015), these countries reported producing less than 10, 000 mt of cocoa during 2011-13***according to FAOSTAT (2015), these countries reported producing more than 10, 000 mt and less than 50, 000 mt of cocoa during 2011-13Source: FAOSTAT (accessed November 2015) and calculations for this study.
Table 2: Distribution of cocoa-producing developing countries by region, 2011-13Region-----------------------------------------------------------------------------------------------
Production (000) mt/yr Africa Asia Latin America Totala b c
0 or no data 34 43 8 85> 0 <10, 000 2 9 17 38> 10, 000 < 50, 000 3 2 3 8> 50, 000 <250, 000 1 0 4 5>250, 000 4 1 1 6Total 54 55 33 143For this study, Africa consists of North Africa that in turn is made up of Algeria*, Egypt*, Libya*, Morocco*, Tunisia* and the Western Sahara*; West Africaa
that includes Benin**, Burkina Faso*, Cameroon*****, Cape Verde*, Chad*, Côte d´Ivoire*****, Gambia*, Ghana*****, Guinea**, Guinea-Bissau*,Liberia***, Mali*, Mauritania*, Niger*, Nigeria*****, Senegal*, Sierra Leone*** and Togo****; Central Africa that is made up of Burundi*, Central AfricanRepublic**, Congo**, Equatorial Guinea**, Dem. Rep. of the Congo**, Gabon**, Rwanda* and Saõ Tomé and Príncipe**; East Africa that consists ofDjibouti*, Eritrea*, Ethiopia*, Kenya*, Seychelles*, Somalia*, Sudan* ( FAO does not yet report separate data for Sudan and the Rep of South Sudan,Tanzania** and Uganda***; and Southern Africa that consists of Angola**, Botswana*, Comoros**, Lesotho*, Madagascar**, Malawi*, Mauritius*,Mozambique*, Rep. of South Africa*, Swaziland*, Zambia* and Zimbabwe*.
For this study, Asia is made up of South Asia that consists of Afghanistan*, Bangladesh*, Bhutan*, India***, Maldives*, Nepal*, Pakistan* and Srib
Lanka**; West Asia that includes Bahrain*, Cyprus*, Iran*, Jordan*, Kuwait*, Lebanon*, Occupied Palestinian Terr.*, Oman*, Qatar*, Saudi Arabia*,Syria*, Turkey*, United Arab Emirates* and Yemen*; Central Asia that is made up of Armenia*, Azerbaijan*, Georgia*, Kazakhstan*, Kyrgyzstan*,Tajikistan*, Turkmenistan* and Uzbekistan*; East Asia that consists of People’s Rep. of China*, Dem. People’s Rep. of Korea*, Rep. of Korea* andMongolia*; Southeast Asia that includes Brunei Darussalam*, Cambodia*, Indonesia******, Lao’s People Dem. Rep.*, Malaysia**, Myanmar*,Philippines**, Singapore*, Thailand**, Timor-Leste** and Viet Nam*; and, Oceania that includes Fiji**, Kiribati*, Nauru*, Papua New Guinea***,Samoa**, Solomon Islands**, Tonga*, Tuvualu* and Vanuatu**.See Table 1 for details about the classification of countries in Latin America.c
* according to FAO, these territories reported producing no cocoa during 2011-13**according to FAOSTAT (2015), these countries reported producing less than 10, 000 mt of cocoa during 2011-13***according to FAOSTAT (2015), these countries reported producing more than 10, 000 mt and less than 50, 000 mt of cocoa during 2011-13****according to FAOSTAT (2015), these countries reported producing more than 50, 000 mt and less than 250, 000 mt of cocoa during 2011-13****according to FAOSTAT (2015), these countries reported producing more than 250, 000 mt of cocoa during 2011-13Source: FAOSTAT (accessed November 2015) and calculations for this study

Am-Euras. J. Agric. & Environ. Sci., 16 (1): 01-19, 2016
5
Fig. 1: Evolution and growth rates for cocoa production in LAC, 1961-2013Source: FAOSTAT and calculations for this study

Am-Euras. J. Agric. & Environ. Sci., 16 (1): 01-19, 2016
6
Fig. 2: Evolution and growth rates for cocoa area in LAC, 1961-2013Source: FAOSTAT and calculations for this study

Am-Euras. J. Agric. & Environ. Sci., 16 (1): 01-19, 2016
7
Fig. 3: Evolution and growth rates for cocoa yields in LAC, 1961-2013Source: FAOSTAT and calculations for this study
Am-Euras. J. Agric. & Environ. Sci., 16 (1): 01-19, 2016
8
Fig. 4: Annual cocoa production in LAC and international prices (US$/mt), 1961-2013Source: FAOSTAT and Global Economic Monitor (GEM) Commodities, World Bank
Fig. 5: Shares of average regional cocoa production for selected years, 1961-2013 Source: FAOSTAT and calculations for this study
Cocoa Versus Other Major Crops: While cocoa yields COUNTRY-LEVEL ANALYSIShave improved in LAC over the last decade or so (Fig. 3),productivity increases for palm oil, coffee and rubber A third tendency within the evolution of cocoaworld-wide have been much faster world-wide since 1970 production and area harvested in LAC has been the[13]. This comparison is all the more noteworthy on a highly differentiated degree and nature of volatility acrossregional basis where cocoa yields and their respective countries within the region. For example, during the lastgrowth rates have lagged behind those for other industrial half century, cocoa production in Peru increased fairlycrops (Table 3). steadily upward from 2, 600 mt/yr in 1961 to 71, 000 mt/yr
Yields comparisons are even more dramatic when in 2013 as ACGRs for production remained positivecomparing cocoa with the major food crops (Table 3). throughout the entire period (Fig. 1). By way of contrast,And more dramatic still if one compares the area in cocoa Ecuador saw annual cocoa output rise from 44, 000 mt inversus the major food crops. Alternatively, these trends 1961 to 97, 000 mt in 1982, then implode to 45, 000 mt insuggest that there may well be greater upside for cocoa 1983, to jump to 131, 000 mt in 1985 only to fall to 58, 000technically speaking. Moreover, the run-up in average mt in 1987. In short, these patterns appear to reflect theyields in Peru in recent years, for example, suggests that diverse growing conditions, levels of output and areasuch improvements --and more-- are certainly technically harvested, incidence of pests and diseases among otherfeasible with available technology (Fig. 3). factors found in the region. They also underline the need

Am-Euras. J. Agric. & Environ. Sci., 16 (1): 01-19, 2016
9
Table 3: Average annual growth rates for selected crops in Latin America , 1961-2013a
Growth rateb
2011-2013 ------------------------------------------------------------------------------------------------------------------------------------------------------------- Production Area YieldProduction Area Yield ------------------------------ --------------------------- --------------------------
Crop (000 mt) (000 ha) (mt ha ) 1 2 3 1 2 3 1 2 31
Industrial cropsSugarcane 964, 357 13, 123 73.5 3.4 2.9 3.1 2.5 2.1 2.3 1.1 0.7 0.9Oil palm 14, 886 945 15.7 3.6 2.9 3.2 4.6 6.4 5.5 0.2 0.8 0.5Coffee 4, 961 5, 403 0.9 0.5 1.2 0.9 -0.5 -0.6 -0.6 1.1 1.9 1.4Rubber 347 245 1.4 2.9 7.1 5.0 17.6 4.6 10.9 -12.5 2.4 -0.3Cocoa 730 1, 676 0.4 2.9 0.4 1.6 1.4 0.5 1.0 1.5 -0.1 0.7Food crops Maize 134, 045 31, 371 4.3 3.1 3.7 3.4 1.1 0.6 0.8 1.9 3.2 2.5Cassava 31, 415 2, 515 12.5 1.0 0.1 0.6 1.2 -0.1 0.5 -0.2 0.3 0.0Rice 27, 518 5, 635 4.9 3.3 1.6 2.4 2.4 -1.4 0.3 1.2 3.0 2.1Wheat 24, 129 8, 068 3.0 2.9 0.4 1.6 1.2 -1.1 0.0 1.6 1.6 1.6See Table 1 for details about the countries in Latin Americaa
See footnote Table 1 for the formula utilized for these growth rates.b a
Source: FAOSTAT (accessed November 2015) and calculations for this study
for an analysis of growth rates in production, area and quarter century (Table 1) carried over into the mid-1980syield at the national level. as national output peaked at 459, 000 mt (Fig. 1) [39].
Brazil: While Brazil’s cocoa has been commercially 1963 to 1975 were a combination of a spectacular upturnharvested since at least 1820s, subsequent decades in cocoa prices [40] and favourable rainfall patternswitnessed a series of recurrent booms, then busts due to followed from 1975 forward to 1986 by an expansion ofan array of countervailing factors [36]. These would area planted facilitated by government planning andinclude rapidly expanding international demand and technical support [29]. The results manifest themselves inemerging national production capabilities from the late the rapid growth rate in yields reaching over 4%/yr1800s up until the late 1910s. From then on up until the (Table 1, Fig. 3). They rose from 315 kg/yr in 1964 to peak1950s, national output continued to expand, albeit at at 742 kg/yr in 1979—a surge all the more noteworthy asvariable rates, as it witnessed a series disease outbreaks area harvested went from 407, 000 ha in 1976 to over 656,–most notably black pod, years of excessive rainfall, the 000 ha in 1986 [39], i.e., average yields more than doubledfall in prices due to the Great Depression in the early even as area expanded by 60% over the same period.1930s and then again at the end of World War II and the In 1987, national cocoa output came crashing downevolution of cocoa cultivation to other parts of the world, with a devastating outbreak of witches´ broom diseasemost notably Ecuador and Ghana, formerly the Gold Coast [41, 42]. As the impact of the disease spread, average[29]. In the wake of these developments, some observers yields steadily shrank from 664 kg ha in 1986 to 270have postulated that the observed output patterns for kg ha in 2003 (FAOSTAT, 2015). Consequently,Brazilian c ocoa reflect a series of different long-term production imploded to 170, 000 mt/yr over the same(1900-1987) and/or short-term cycles (1900-1947) driven 16-year period with growth rates all turning sharplyby a combination of demand and supply considerations negative reaching -6%/yr during that time (Fig. 1 and 3).ranging from international price movements to changes in Particularly hard hit was the state of Bahia [29]government programs and policies to plant physiology in where cocoa cultivation was first introduced in 1746 [38].shifting cocoa cultivation itself [29]. Some of these cycles Its Atlantic rainforest region traditionally harvests theand their underlying causes have overlapped into the hardier, albeit less flavourful, cocoa variety of Amazonianpresent. origin or related hybrids and accounts for some 80% or
After the drought of the century in the early 1960s more of national area harvested and 60% or more ofand a fall in international prices led to a return to output production [43]. Only a relatively minor share of output islevels for cocoa in Brazil of 30 years previously [29], the harvested in the Amazon states of Pará (14%) in thesubsequent cocoa boom of the mid-1960s to mid-1970s northeast and Rondônia (4%) in the far westerncharacterized by growth rates of over 4%/yr during a Amazon, as well as Espiríto Santo (4%) to the south of
Driving forces behind the surge in production from
1
1

Am-Euras. J. Agric. & Environ. Sci., 16 (1): 01-19, 2016
10
Bahia [44], although the percentages harvested in each productivity nonetheless remains half the 742 kg hastate have varied in recent years according to different obtained in 1979 suggesting ample room for continuedsources [45]. improvement.
The witches´ broom calamity not only led to a drasticfall in production but also the bankruptcy of many of the Ecuador: A long, proud tradition of cocoa cultivation in1, 000 ha cocoa plantations that had been common in the Ecuador dates to Spanish Capuchin friars reportedlycocoa sector for decades in Bahia [42]. Instead, many planting local varieties as long ago as 1635 [37]. Cocoalandless acquired access to their own parcels such that was exported from Guayaquil as far back as the earlythey and other, established small farmers came to occupy 1700s [36]. By the early 1800s, proceeds from the sale ofan important space in the newly emerging profile of cocoa reportedly helped finance the Independenceagricultural systems for the commodity in the cocoa- movement [25]. By the late 1800s, early 1900s, Ecuadorgrowing zones of southern Bahia [41]. According to some once again surpassed Brazil as the world´s largest cocoaobservers, these new, less experienced entrants exporter as the coastal countryside became essentially acomplicated efforts to spur a rebound in output as trees cocoa monoculture [36]. The economic crisis of the 1930swere cut to make money from timber and pastureland and the land reforms of the 1960s forced the large cocoaundermining soil fertility [42]. Hence, even though Brazil´s haciendas to be divided into parcels that were sold tococoa production exceeded FAO [46] projections of 210, small landholders [51].000 mt in 2010 by 12% to 235, 000 mt, the 256, 000 mt Since the early 1960s, annual cocoa output inharvested in 2013 still remained 45% below the 459, 000 mt Ecuador has been highly erratic, ranging from a low ofof cocoa harvested in 1986, or twenty-seven years 35, 000 mt in 1998 to a high of 224, 000 mt in 2011 [39].previously [39]. As such, the evolution of Ecuador´s annual cocoa output
In light of the slow recovery of cocoa production, over the last half century is perhaps best characterized asrecent Ministry of Agriculture projections forecast a a series of recurrent spikes followed by sharp declines15.7% decline in output to 2023/2024 [47] thereby occurring with varying frequency (Fig. 1).reinforcing repeated concerns about the need for more Most notably, production was particularly hard hitimports [10] to meet the booming demand for chocolate by the heavy rainfall that accompanied the El Niño of[15, 28]. Partly for that reason at least two large 1982-83 when output fell from 97, 000 to 45, 000 mt, thenmultinational have financed programs to: 1) reinvigorate again in 1997-98 when a similar phenomenon led to acocoa cultivation amongst 4, 000 smallholder farmers in similar drastic decline from 83, 000 to 35, 000 mt. As asouthern Bahia [48] through better cultural practices such result, cocoa exports fell from 71, 100 mt in 1996 to 12, 135as pruning and the use of fertilizer; 2) plant over 20 million mt in 1998, but then rebounded to 63, 600 mt in 1999 [52].disease-resistant cocoa seedlings in Pará [15, 49]; and, 3) Given these and similar developments over the last fivestimulate greater cultivation of cocoa in Espiríto Santo. decades, growth rates for cocoa production in EcuadorAt the same time, the Ministry of Agriculture has have followed an equally erratic path (Fig. 1). With theundertaken initiatives to reinvigorate the cocoa sector and aforementioned observations about volatility duly noted,to support small cocoa producers more generally. In that Ecuador´s cocoa sector has been remarkably resilient.same spirit, both the federal Chamber of Deputies and The country notched the second highest growth rate instate of Bahia legislators have proposed offering production of any of the major cocoa-producing countriesincentives to growers to grow cocoa in the shade of at in the region over the last half century (Table 1).least 40 native Atlantic forest trees per hectare, or the A reported 12% of the economically activeso-called cabruca sustainable cocoa cultivation system population in Ecuador is involved in cocoa production,employed by growers for over two hundred years, with 90% of the cocoa produced on land holdings lessintended to help conserve the biodiversity of the than 50 ha --with more than 30% of these are farms smallerrainforest and enhance the quantity of cocoa harvested than 10 ha [51]. Over 80% of Ecuador´s cocoa areaannually [22, 23, 43, 50]. In Bahia, over 150, 000 ha of harvested is currently located in the southern, semi-aridsusceptible varieties have been renewed with coastal provinces of Manabí, Los Ríos and Guayas [32].disease-resistant clones developed by the Cocoa As much of Ecuador´s cocoa growing area sits exposed toResearch Centre [45]. While these various initiatives have the variable weather patterns of the eastern Pacific, thecontributed to a 30% increase in average yields upcoming 2015-16 cocoa harvest [21] is once againnationwide from in 2001 to 372 kg ha in 2013, threatened by El Niño-driven developments with ICCO1
1

Am-Euras. J. Agric. & Environ. Sci., 16 (1): 01-19, 2016
By mixing hybrids in the Ecuadorian city of Naranjal, with the best disease resistant and highest yielding cocoa cultivars at his2
disposition, Homero Castro Zurita developed his 51st cocoa hybrid named ‘Colección Castro Naranjal 51’ in 1965 [55].11
(International Cocoa Organization) estimating a 6.6% statistics. In the interim, thanks to higher prices anddecline in output [13]. Cocoa cultivation in the Amazonprovinces accounts for around another seven percent oftotal area [32]. Such ecological considerations would helpto at least partly explain the series of shortfalls reportedon in Ecuadorian statistics between annual area harvestedand area planted. For the period 2008-2014, theseaveraged 100, 000 mt/yr less, or 20% of the annualnational total [32]. Despite these sustained differences onan annual basis in recent years and although growth inarea harvested slowed considerably in the last quartercentury, Ecuador still accounts for nearly 25% of the totalregional area harvested in cocoa in LAC (Table 1, Fig. 5).
The other major factor that contributed to the yearlyshortfalls in area harvested versus area planted—all themore noteworthy given the highly favorable prices on theinternational market—would be the recurrent pestoutbreaks affecting the more vulnerable, prized localcocoa varieties of Cocoa Nacional [53] such as ArribaSuperior Época (ASE) that accounts for 37% ofproduction followed by the hybrid Criollo cloneColección Castro Naranjal (CCN)-51 with 36% [54].2
Other Arribas cultivated include Arriba Superior Selecto(ASS) (20 percent) and Arriba Superior Summer Selecto(ASSS) (seven percent) [32]. Such devastating outbreakspunctuated the history of Ecuadorian cocoa repeatedlyfrom the late 1800s up to the late 1940s [16, 30] and havecontinued on up to the present as the agriculturaleconomy shifted its primary focus away from cocoa firstto coffee and then bananas. The incidence of pestinfestation has been compounded by less-than-optimalcrop management, an aging stock of cocoa trees, ashortage of disease-resistant planting material and theattractiveness of switching to other, more remunerativecrops as some small farmers seek to maximize benefitsfrom an array of farm commodities rather than focusexclusively on cocoa [51]. These considerations havebeen offset by new, larger plantations opened up by localagribusiness firms combined with the spread of CCN-51and other disease-resistant material that together largelyaccount for the growth rate in yields over five times theregional average during the last 25 years (Table 1, Fig. 2).
A related inconsistency, more difficult to reconcile,concerns the differences between national figures forannual production in recent years and those reported byFAO. The former reports national cocoa output reached224, 000 mt in 2013 while FAO lists 129, 000 mt [32, 39].Time will tell if revised data made available by either orboth sources closes the gap between the two sets of
government incentives, Ecuadorian authorities anticipatebecoming the world’s fourth largest cocoa-bean producerby 2016 [21, 32].
In the midst of these various developments,Ecuador has successfully positioned itself as the world´slargest producer/exporter of fine and aromatic cocoabeans accounting for some 65% of the global market of200, 000 mt/yr [9, 56]. This category of product hasattracted considerable interest and debate [16] as globaldemand for cocoa shows increasing signs of diversifyingwith niche markets opening up for those beans withparticular quality characteristics, in particular fine flavorthat includes an array of traits such as exceptional aroma,that cater to the tastes and preferences of discriminating,high-income consumers willing to pay premium prices[8, 13, 28]. Moreover development projects in Ecuadorhave shown that small cocoa producers can reapnoteworthy benefits from improvements in variousdimensions associated with their participation in the valuechain for that type of cocoa [57]. These range from bettercrop management (e.g., pruning), to improvedfermentation, drying and sorting of beans by variety anddirect sale to buyers abroad.
With that highly lucrative segment in mind, theMinistry of Agriculture, Livestock, Aquaculture andFisheries (MAGAP) launched the National Cocoa Programintended to revitalize smallholder cocoa production bypruning 20 million cocoa trees and new plantationestablishment [32]. These efforts have been reinforced byan series of campaigns by different multinationals, e.g.,Nestlé´s cocoa campaign that led to the distribution ofover 45, 000 Arriba fine cocoa highly productive plantsamongst 1, 000 farm families between 2009-2012 [58] inkeeping with the firm´s global commitment to moresustainable cocoa cultivation through among other thingspruning, expanding and improving fertilizer use;improving postharvest practices such as fermentation anddrying; and helping eradicate child labor [59, 60]. Despitethese and other efforts, recent studies, industryrepresentatives and research specialists interviewed forthis study observe that maintaining cocoa quality inEcuador has been undermined by the recurrent tendencyof growers to mix varieties in the lots for sale [53]contributing to inconsistent control in fermenting anddrying of beans [56].
Peru: Although cocoa has been growing in Peru formillennia [61] and was reportedly first given a social use

Am-Euras. J. Agric. & Environ. Sci., 16 (1): 01-19, 2016
The figures reported here are from FAOSTAT presumably based on annual MINAGRI data; according to Huamanchumo [65], the3
4 National Agricultural Census data indicate national area harvested in cocoa was over 144, 000 ha in 2012. Reconciling these twoth
markedly different estimates and their implications for reported average yields is a topic for future research related to Peru´s cocoasector.
12
before anywhere else on the planet some 5, 000 years ago organization and management of produce associationsin the northern Amazon in an area straddling the border and carried out a steady series of cocoa promotionwith Ecuador [62], the crop only assumed commercial initiatives in foreign markets as well as domestically [68].importance in the 1930s with the advent of colonization of With the rapid expansion of cocoa plantings in Santhe Amazon region [30]. Cocoa remained a minor Martin, over the last 15 years the concentration ofcommodity for decades. During the 1980s and 1990s national cocoa cultivation shifted from areas in Peru'sannual output did rise from 4, 000 to over 22, 000 mt/yr as southwestern Amazon region clustered along the lowercommercial interest in cocoa grew, spurred on by slopes and at the base of the Andes to equivalentalternative development projects initiated to eradicate locations in the northern part of the country. San Martincoca cultivation tied to trade in illegal drugs [63]. alone now accounts for nearly 45% of national cocoa
Since 1999 annual cocoa output more than tripled output with Cusco, Ayacucho and Junín regionsto 71, 000 mt, albeit still less 2% of annual global producing another combined 38%. As a result, commercialproduction [39], with Peru becoming the ninth largest area harvested in Peru tends to be both moreproducer worldwide [31]. Area harvested expanded geographically dispersed (i.e., less concentrated in afrom 41, 000 ha to over 96, 000 ha between 2000 and 2013 single state or region) and ecologically diverse (i.e., with[64] with an estimated 60% located in the “high” jungle cultivation on the coast as well as the high and lowabove 600m [61]. Farm households engaged in cocoa jungle) than in any other country in LAC.3
cultivation stood at 30, 000 around 2006 [30], rising to an In the wake of these various initiatives, the sharpestimated 45, 000 in 2013 [66] and to as high as 90, 000 up-turn in cocoa prices and the growing globalcurrently [27]. The outcome of these various recognition of Peru as a source of quality fruits,developments were double-digit growth rates in vegetables and other industrial commodities, e.g. coffeeproduction and area harvested in cocoa- the highest in [5, 69], at least three large (>1000 ha) corporate cocoaall of LAC and over four times the regional averages initiatives began expanding area cultivated in cocoa in the(Table 1, Fig. 1-3). low (< 500 m) jungle in the San Martin, Ucayali and Loreto
The bulk of the increase in area a reported 26, 500 ha Regions [70, 71, 72]. Two of these firms have come underbetween 1999 and 2007 alone, consists of 16, 700 ha sharp criticism for their cutting of primary rainforest forplanted in the San Martin Region [30, 67]. Area under plantation-style cultivation of CCN-51 [73, 74]. A third hascocoa cultivation expanded an additional 27, 300 ha opted for growing a mix of fine flavor varieties inbetween 2008 and 2012 with 16, 900 ha in San Martin, 6, agroforestry fashion as well as buying and processing400 ha in Ucayali and 4, 000 ha in Huanuco Regions cocoa produced by other, typically small growers [27]. respectively [63]. Nearly all of the earlier expansion Among the various recent initiatives adopted byconsisted of CCN-51 introduced in Peru through non-producers aimed at establishing and maintainingalternative development programs and characterized by grower-supplier loyalty in the fierce competition tosome chocolate connoisseurs as tasting “acidic and dirty” procure raw material, some processor/traders offer their[14]. However, according to industry representatives affiliated farmers an elaborate set of services (e.g. zerocontacted for this study, CCN-51 produced in Peru has a interest loans, tool loans free of cost), philanthropicdistinctively different flavor profile from that harvested in activities (rebuilding local schools), education and healthEcuador. Possible reasons for this distinction between programs beyond an equally extensive array of cocoaPeruvian and Ecuadorian CCN-51 would include the production technical assistance and training initiatives asformer is produced on small farms in agroforestry systems an integral part of their respective business models [75].exposed to the fruits and other flora found in the mega- Others employ their own agronomists to provide technicaldiverse Amazonian jungle as opposed to the monoculture support to their affiliate growers as well as promote socialcultivation that according to census data dominates the programs aimed to eliminate child labor, ensure fieldsemi-arid, Ecuadorian coast [67]. In addition, a number of workers are paid a fair wage and abide by certificationpublic sector agencies and other multi-lateral and bi-lateral requirements in producing, processing and handling ofdevelopment programs devoted considerable time and cocoa beans [76].effort training growers in improved agronomic (and to In addition to the private trading companies,a much lesser extent postharvest) procedures, the producer cooperatives have facilitated the expansion in

Am-Euras. J. Agric. & Environ. Sci., 16 (1): 01-19, 2016
13
area harvested, productivity and quality enhancement by at 59, 000 mt in 1988 [39] riding the boom in cocoa pricesfacilitating diffusion of disease resistant planting material; well past its peak in the late 1970s [11]. From then on,supporting reforestation schemes involving organic production fell back to a low of 28, 000 mt in 2000 as theproduction of harvestable timber to reduce erosion, global cocoa boom went bust in the 1990s [40]. From 2000provide shade cover for cocoa and serve as the basis for to present, output recovered, rising first to 40, 000 in 2007the eventual sale of carbon bonds to complement the and from there to 82, 000 mt by 2013 [39] as internationalincome from cocoa sales; and helping grower- members prices surged upward calling forth greater supply. In thatcapture the benefits of from higher prices and those made regard, it is noteworthy that national sources reportpossible through certification schemes [65, 77]. Over the figures considerably lower those than those indicatedlast ten years Peru has reportedly become the world´s by FAOSTAT, e.g. FAOSTAT reports 50, 000 mt in 2008second largest exporter of organic cocoa and was among versus 27, 548 according to SIAP [39, 84]. Similarly,the world´s largest exporters of Fair Trade cocoa [78, 79]. Fundación Cacao México reports that output fell from 46,Of the 62 producer cooperatives world-wide that currently 700 to 24, 700 mt between 2001 and 2009 due to aform part of the Fair Trade USA cocoa network, 16 are in combination of an outbreak of moniliasis, the aged stockPeru [79], up from just three in 2005 [80]. Moreover, of cocoa trees and poor cultural practices [85]. Yet,according to UTZ representatives contacted for this FAOSTAT data indicate production actually rose to 60,study, Peru's UTZ certified cocoa bean exports rose from 000 mt during this same period [39]. With that513 mt in 2010 to 11, 836 mt in 2013 and then 16, 233 mt in qualification, according to FAOSTAT data, growth rates2014. The combination of new area under cultivation, for cocoa output in Mexico have averaged 4.4% over thehigh-yielding varieties and improved cultural practices last half century (Table 1).together have propelled growth rates in productivity well Some 70% of cocoa production in Mexico isabove the regional average over the last fifty years with harvested in the southeastern gulf state of Tabasco [84].yields now 50% higher than the average for LAC as a Nearly 29% grown in Chiapas followed by Oaxaca andwhole (Table 1, Fig. 3). Guerrero accounting for the other 1%, although cocoa is
Mexico: Long before the arrival of the Spanish as Veracruz. In that context, the recent run-up inconquistadores, cocoa had versatile uses for the Aztecs production has apparently been catalyzed by a reboundand even more so for the Mayas. These varied from the in the growth rate for area harvested (Table 1, Fig. 2),key ingredient in a drink for royalty, to a form (beans) of albeit according to FAOSTAT data, apparently incurrency, to the focal point of cultural and religious function of the surge in international prices since 2000.ceremonies, to a unit of taxation, to medicinal applications Notwithstanding, knowledgeable observers point out that[81, 82]. The word “chocolate” itself derives from Aztec the development of the crop has been plagued over thecuisine and in turn is derived from the Nahuatl word years by recurrent pest and disease outbreaks; the small,xocotl; the Mayans cultivated cocoa trees and used the undercapitalized scale of production; as well as thebeans to make a frothy drink called xocotal that according economic returns possible from cultivating alternativeto archeological findings dates back to groups living in commodities [29].the lowland areas adjacent the Gulf of Mexico in the After yields peaked at 762 kg ha in 1986, theysouthern part of the country as long ago as 1750 BC [81]. subsequently collapsed to 346 kg ha in 1993, only toReportedly the world´s first known cocoa plantations rebound to 702 kg ha by 2013 [39]. These gyrations arewere cultivated by the Mayans in southern Mexico reflected in the growth rates for yields (Table 1, Fig. 3).(Yucatan) around 600 AD, perhaps earlier [16, 52]. In They rose strongly in the first quarter century as theMexico today, cocoa in the form of chocolate remains a rapid rise, then fall in prices discouraged further plantingpopular drink and a key ingredient in a number of popular and seemingly stimulated greater productivity to survivefood offerings. Despite its rich history and current use the downturn. The subsequent rapid expansion in areaparticularly in Central and Southeastern Mexico in the in recent years apparently came in response to thepreparation of festive dishes served on holidays and at recovery, then surge in international cocoa prices [11],family reunions, cocoa has remained somewhat although recent grower survey results suggest that theincongruously a relatively minor crop in terms of total prices actually received by cocoa farmers may not reflectproduction [83]. those prevailing in international markets due to their
Since the early 1960s, the evolution of cocoa output geographic isolation, limited negotiating skills, amongin Mexico can be roughly divided into three periods. other factors [26]. Those latter considerations aside, theOutput first meandered from 28, 000 mt in 1961 to top out growth in cultivation appears to have spread so quickly
found on a very small scale in other locations as far north
1
1
1

Am-Euras. J. Agric. & Environ. Sci., 16 (1): 01-19, 2016
14
and extensively that it came to include less productive continued to expand into the late 1980s even asparcels and/or less experienced growers. international cocoa prices plunged off their highs in the
In light of these recent tendencies, the combination late 1970s [11]. In that regard, Berlan and Bergés point outof a long, rich history of cocoa embedded in the Aztec that it was precisely in the late 1980s that leaders of theand Mayan civilizations, rising global demand for cocoa national cocoa-growers´ confederation in collaborationand the apparent potential to produce more and better with German technical assistance made the strategicquality beans have motivated the launching of a series of decision to pivot towards targeting the market for highpublic-private development initiatives in the last few years quality, certified organic cocoa instead of continuingin support of the country´s 37, 000 cocoa growers [85]. to produce conventional cocoa often sold at belowProject goals include increasing productivity and raising market price due to poor fermentation and dryingsmallholder incomes through the renovation of tree stock, practices [24]. In effect, the rapid growth rate for areathe introduction of disease-resistant varieties and the harvested (2%/yr) accompanied by declining yields fromcertifying of eco-friendly cultural practices with the the early 1960s to the late 1980s (Table 1) gave way to asupport of multinationals such as Hershey´s, Mars and period of much greater attention to improving quality andEcom, as well as the World Economic Forum [86]. Among productivity combined with gaining access to newthe benchmarks listed in the Mars-supported project is markets [88].the distribution of 500, 000 cocoa plants amongst 800 Some 50% of the total area harvested in cocoa in thegrowers in Chiapas and Tabasco over 10 years while the Dominican Republic is concentrated in the Northeast andproject supported by Hershey´s anticipates distributing Central regions [87] with the majority of cocoa producersanother 150, 000 cocoa plants in collaboration with the consisting of small farms cultivating less than five ha inNational Institute for Forestry, Agricultural and Livestock agroforestry fashion [24]. There are no large cocoaResearch (INIFAP). plantations in the Dominican Republic as exist elsewhere
in LAC, e.g., Brazil and Peru, although one large privateDominican Republic: Cocoa was reportedly introduced firm owns a reported 5, 000 ha of land devoted to cocoainto the island of Hispaniola in the late 16 , early 17 production. Instead, the farm structure of the cocoa sectorth th
century [87], although other studies report this took place is characterized by small units managed by aging cocoain 1665 [24]. More recently, cocoa production in the farm heads of households. In addition, rural-urbanDominican Republic has dominated trends in the migration leading to a shortage of labor in the countrysideCaribbean over much of the last 50 years (Table 1). combined with the highly seasonal nature of workOutput reached 41, 000 mt in 1964 only to fall to 25, 000 mt requirements and income flows have together raisedthe following year. As the sector then trended upward, questions about the sustainability of the prevailingit suffered similar, albeit less severe drops in 1974-75, system [24].1979-80 and 1984-85 before reaching 43, 000 mt in 1987 Despite these various constraints, the Dominican[39]. The similar ends points of the first quarter century Republic´s cocoa sector has come to occupy a far morethus explain the meager (0.5%) growth rate during this visible place in the international market for this commodityperiod, but mask the recurrent fluctuations and belie the that its modest area harvested might otherwise suggestsector´s resiliency. due its aggressive pursuit of differentiating itself as a
The annual growth rate in production accelerated supplier of fine and aromatic, certified organic and Fairnoticeably (2.0%) in the last quarter century even though Trade cocoa. In that regard, ICCO classified Dominicanoutput was particularly hard hit by Hurricane George in Republic cocoa as 40% fine and aromatic in their latest1999 [24, 52] falling from 68, 000 mt in 1998 to 26, 000 mt designation for different countries [13]. The Dominicanthe following year [39]. The country was struck again in Republic´s organic cocoa exports have risen from 929 kg2004 by Hurricane Jeanne with production imploding in 1999 to 5, 200 kg in 2000 [89] and then to 8, 000 mt infrom 48, 000 mt in 2004 to 31, 000 mt in 2005 before 2006 to 15, 000 mt in 2009 [90]. During 2011-2012, therebounding sharply and then accelerating to the 50-yr Dominican Republic was among the world´s leadinghigh of 72, 000 mt in 2012. countries of Fairtrade cocoa exporting 11, 200 mt [91],
Area harvested in cocoa rose from 75, 000 ha in 1961 shipping double the quantities of Peru and three timesto peak at 179, 000 in 1987 [39], jumping from 129, 000 ha that of Ecuador as part of its overall commercial strategyin 1986, then falling back to 130, 000 ha in 1988 in the of catering to specialized buyers willing to pay higherprocess, or the year after Hurricane Emily passed over prices for beans with both environmental- and socially-part of the country. It is noteworthy that area harvested friendly characteristics.

Am-Euras. J. Agric. & Environ. Sci., 16 (1): 01-19, 2016
15
CONCLUSIONS While countries such as Brazil, Ecuador and the
Despite being the center of origin for cocoa,cocoa cultivation and use, Latin America witnessedonly modest increases in output, area harvested andyields for this commodity during the last half century.A marked decline in production and area began in the late1980s and persisted until the early 2000s, primarilybecause of the prolonged downturn in international pricescombined with the implosion of production in Brazil duethe spread of witches´ broom disease. As prices haverisen sharply since then, production and area haverebounded, however unevenly in many parts of theregion.
Masked by these long-term regional trends are anumber of developments that speak more to the resiliency,if not dynamism of cocoa cultivation in different countriesacross the region. Peru in particular, but also Ecuador,Mexico and the Dominican Republic saw sharp increasesin the growth rates for production in recent years asgrowers tried to take full advantage of the run-up ininternational prices, the diffusion of improved varietiesand the various public-private alliances that sprang-up toimprove productivity, quality and incomes for the vastmajority of small farm households that dot the cocoasector in LAC.
Beyond the trends themselves and how theyevolved, an analysis of cocoa production and area in LACpoints to the high degree of geographic concentration.Not only do just five countries alone account for over80% of output and over 86% of area planted, the trend hasbeen for that concentration to increase over time. Morenoteworthy still is the pattern of concentration withinthose same five countries. Just 11 growing areas:southern Bahia in Brazil; the coastal provinces of Manabí,Los Ríos y Guayas in Ecuador; San Martin, Cusco, Junínand Ayacucho regions in Peru; the state of Tabasco inMexico; and, the Northeast and Central zones in theDominican Republic together account for over 75% ofregional output. Only Peru has witnessed anyconsiderable shift in the central locus of production.Peru also stands out as the country with the greatestecological diversity with cocoa grown in the high and lowAmazon region as well as on the semi-arid coast. Havingsaid that, some 90% of cocoa production in Peru takesplace east of the Andes-unlike all the other major cocoa-producing countries whose major growing areas aresituated on or near the coast, in effect adding anadditional transport expense to the costs of exporting anybeans.
Dominican Republic have engaged in commercial cocoaproduction for nearly two centuries, others such as Peruhave a much more recent history in this type of endeavor.In that regard, some observers consider the long traditionin some established cocoa-producing countries as harderto build on in terms of innovation (e.g., the adoption ofbetter cultural practices such as pruning) than working ina sector or growing region where for the farmers involved,cultivating the crop in itself is an innovation. Hence, theymay be more inclined to embrace changes needed toimprove productivity, quality and incomes. Recentexperience in LAC suggests that such success is possiblein either set of circumstances, but that that requires botha holistic approach to both activities on and off the farmas well as a longer-term commitment than the more typical3-5 year, project-based effort.
Given the prevailing trends in LAC and in WestAfrica, various private firms, both national andmultinational, are actively engaged in multiple initiativesin different parts of LAC to improve productivity, qualityand gain sustained access to necessary supplies to meettheir raw material requirements. This trend suggests thatthose enterprises that are not proactive run the risk oflosing whatever competitive position they may have hadup to that point. Having said that, the aggressive pursuitof differentiation raises questions about the possiblerepercussions in one or more of these niches should thearray of regional efforts carried out in relative isolation allprove to be successful in increasing supply.
Some key topics for future research would includequantifying the potential impacts of climate change, theirdistribution across different ecologies and some estimateof the benefits and costs of these weather-relateddevelopments. A related topic would concern how thevalue chains that link producers to final users in thesedifferent zones might attempt to mitigate any negativeimpacts of climate change while at the same time takefuller advantage of the changes in supply and demandthat are already underway. The incidence ofcontamination of cocoa and cocoa-based products fromvarious sources, e.g. pests, pesticides [8] and in particularfrom heavy metals such as Cadmium in the soil and waterthat may be utilized for cocoa production has alsoattracted increasing concern [31, 92]. Food regulationsscheduled to go into effect in major European cocoa-importing countries in 2019 would ban the sale ofchocolate products that exceed the specified limits; hence,the call for more research on the source, presence andmitigation of these contaminants not only in LAC but inother cocoa-producing regions as well [13].

Am-Euras. J. Agric. & Environ. Sci., 16 (1): 01-19, 2016
16
ACKNOWLEDGEMENTS 13. Pipitone, L., 2015. Nuevas tendencias en el mercado
I am most grateful to Rosaura Laura and Victor Suarez como productor de cacao fino y de aroma.for their assistance in the preparation of this paper. Powerpoint presentation, ICCO (International Cocoa
REFERENCES 14. Schatzker, M., 2014, November 14. Chocolate: Can
1. CREM, 2013a. Cartografiado de tendencias del CBI de Bloomberg.com.café, cacao y te. CBI (Centre for Business 15. Cargill, 2014. A thriving cocoa sector for generationsIntelligence)-Ministry of Foreign Affairs, The Hague. to come. The 2014 Global Cocoa Promise report.
2. CREM., 2013b. Ficha informativa del producto de Cargill Cocoa and Chocolate. Schiphol. Available at:CBI: Cacao en Suiza. CBI (Centre for Business http://www.cargillcocoachocolate.com/wcm/groupsIntelligence)-Ministry of Foreign Affairs, The Hague. /public/@ccc/@all/documents/document/na316573
3. Wilkinson, J. and R. Rocha, 2009. Agro-industry 61.pdf Accessed 16 November 2015trends, patterns and development impacts. In: Agro- 16. Dand, R., 2011. The International Cocoa Trade. 3industries for development, Eds., da Silva, C., D. edition. Oxford: Woodhouse, pp: 648.Baker, A. Shepherd, C. Jenane and S. Miranda-da- 17. Läderach, P., A. Martinez, G. Schroth and N. Castro,Cruz. Wallingford: CAB International and FAO (Food 2013. Predicting the Future Climatic Suitability forand Agricultural Organization of the United Nations), Cocoa Farming of the World’s Leading Producerpp: 46-91. Countries, Ghana and Côte d’Ivoire. CLIMATIC
4. Reardon, T. and C.P. Timmer, 2012. The Economics of CHANGE, 119(3-4): 841-854. the Food System Revolution. Annu Rev Resour 18. Canales Martinez, M., 2014a. Documento deEcon, 4: 1-41. alineamiento estrategico de la cadena de cacao y
5. Scott, G., 2014. Agregando Valores a las Cadenas de chocolate 2014-2018. MINAGRI (Ministerio deValor. Rae., 54(1): 67-79. Agricultura y Riego), Lima.
6. Webber, C.M. and P. Labaste, 2010. Building 19. Donovan, J., 2006. Diversification in internationalCompetitiveness in Africa´s Agriculture. cacao markets: Opportunities and challenges forWashington, D.C.: International Bank for smallholder cocoa enterprises in Central America. AReconstruction Development. consultancy report prepared for RUTA, CATIE,
7. WCF (World Cocoa Foundation), 2014. Cocoa market Turrialba.up-date, April 2014. WCF, Washington, D.C. 20. Gama-Rodrigues, E.F., P.K. Ramachandran Nair,
8. Afoakwa, E.O., 2014. Cocoa Production and V.D. Nair, A.C. Gama-Rodrigues, V.C. Baligar andProcessing Technology. Boca Raton: CRC Press, R.C.R Machado, 2010. Carbon storage in soil sizepp: 329. fractions under two cacao agroforestry systems in
9. CBI (Centre for Business Intelligence), 2013. CBI Bahia, Brazil. Environ Manage, 45: 275-283. Product fact sheet: fine flavour cocoa in Europe. CBI- 21. Güilcapi, M.L., 2015. National system of qualityMinistry of Foreign Affairs, The Hague. improvement and cocoa traceability. Sabor Arriba,
10. Nieburg, C., 2013. Third time unlucky: Cocoa deficits September: 10.to hit prices in 2014? Confectionary news.com 22. Sambuichi, R.H.R., D.B. Vidal, F.B. Paisentin,December 16. Ava i lab le a t : J.G. Jardim, T.G. Viana, A.A. Menes, D.L.N. Mello,http://www.confectionerynews.com/Commodities/ D. Ahnert and V.C. Baligar, 2012. CabrucaThird-time-unlucky-Cocoa-deficit- to-hit-prices-in- Agroforests in Southern Bahia, Brazil: Tree2014 Accessed 13 November 2014 Component, Management Practices and Tree Species
11. Pay, E., 2009. The market for organic and Fair-Trade Conservation. Biodivers Conserv, 21(4): 1055-1077. cocoa. Study part of the FAO project 23. Schroth, G., A. Jeusset, A. Da Silva Gomes,GCP/RAF/404/GER. Trade and Markets Division, C. Tavares Florence, N.A. Pinto Coelho, D. Faria andFAO (Food and Agricultural Organization of the P. Laderach, 2014. Climate Friendliness of CocoaUnited Nations), Rome. Agroforests is Compatible with Productivity
12. WCF (World Cocoa Foundation), 2012. Cocoa market Increases. Mitigation and Adaption Strategies forup-date, March 2012.WCF, Washington, D. C. Global Change, 1: 1-14.
internacional de cacao: Oportunidades para el Perú
Organization), 22 October, Lima.
science save the world´s most endangered treat?
rd

Am-Euras. J. Agric. & Environ. Sci., 16 (1): 01-19, 2016
17
24. Berlan, A. and A. Bergés, 2013. Cocoa production in 35. Scott, G., 1995. Wall-to-wall fieldwork: secondarythe Dominican Republic. Report of findings data collection for food systems research. In Prices,commissioned by Green and Black´s. Manchester products and people: Analyzing agricultural marketsUniversity, Mondelçz International, Cocoa Life, in developing countries, Ed., Scott, G. Boulder:Manchester. Lynne Rienner Pub and International Potato Center
25. Blare, T. and P. Useche, 2014. What does it mean to (CIP), pp: 167-185. be socially responsible? Case study on the impact of 36. Erneholm, I., 1948. Cacao Production of Souththe producer-plus-program on communities, women America. Historical development and presentand the environment in Ecuador. MEAS geographical distribution, Ph.D. thesis, University of(Modernizing Extension and Advisory Service) case Gothenberg, Gothenberg, C.R. Holmqvistsstudy # 11. Available at: www.measextension.org/ Boktryckeri.meas-offers/case-studies Accessed 13 November 37. Jürgen Pohlan, H.A. and V. Diaz Pérez, 2010. Growth2015. and production of cocoa. In: Encyclopedia of Life
26. Fluck, C., 2014. Closing the gap between current and Support Systems (EOLSS): Soils, Plant Growth andpotential conditions in the cocoa production Crop Production. Vol. III, Ed., Verheye. Oxford:industry comparing Colombia and Mexico, M.S. EOLSS publishers, pp: 1-10. thesis, Faculty of Management and Governance, 38. Keithan, E., 1939. Cacao Industry of Brazil. EconUniversity of Twente, Enschede. Geogr, 15(2): 195-204.
27. Yturrios, J., 2015. Alianza Cocoa Perú. Experiencia de 39. FAOSTAT., 2015. Cocoa production. Available at:ampliación de áreas de cocoa fino y de aroma http://faostat3.fao.org/download/Q/QC/E Accessed(Huánuco, Ucayali, San Martín). Powerpoint November 2015presentation. Seminar: Avances y perspectivas del 40. Ul Haque, I., 2004. Commodities under neoliberalism:cocoa peruano para el mundo: Pequeño agricultura The case of cocoa. G-24 Discussion paper series.ante grandes retos. 01 October, 2015. Lima. UNCTAD (United Nations Conference on Trade and
28. EuroMonitor, 2014. Global trends and developments Development), Geneva. G-24 Discussion, pp: 25.in cocoa ingredients (World), EuroMonitor, London. 41. Alger, K., 1998. The Reproduction of the Cocoa
29. Cazorla, I.M., L.P. Dos Santos Filho, A. Gasparetto Industry and Biodiversity in Southern Bahia, Brazil.and Ceplac, 2010. Cocoa harvest shortfalls in Bahia In the proceedings of the Shade Grown CocoaBrazil: short- and long-term factors. In Cocoa cycles: Workshop organized by the Smithsonian Migratorythe economics of cocoa supply, Eds., Ruf, F. and P.S. Bird Center, Panama, March 1998. Available at:Siswaputranto. Cambridge: Woodhouse Publishers, file:///F:/USB%207/Cocoa%20trends%20LAC/Thepp: 75-87. %20Reproduction%20of%20the%20Cocoa%20Ind
30. IICA (Inter-American Institute for Cooperation in ustry%20and%20Biodiversity%20in%20SouthernAgriculture)., 2009. Situación y perspectivas de la %20Bahia, %20Brazil%20-%20Smithsonian%cadena del cacao-chocolate en el Perú, IICA – 20Migratory%20Bird%20Center.htm. Accessed 10MINAG, Lima. November 2015.
31. Technoserve, 2015. Building a sustainable cocoa 42. Silberner, J., 2008, June 14. A not-so-sweet lessonvalue chain in Peru. Technoserve, Lima. Available at: from Brazil´s cocoa farms. National Public Radio.http//www.technoserve.org/files/downloads/case- Available at: http://www.npr.org/templates/story/study-building-a-sustainable-and-competitive-cocoa- story.php?storyId=91479835 Accessed. 17 Novembervalue-chain-in-peru.pdf Accessed 01 November 2015 2015.
32. Vega, H. and M.J. Beillard, 2015. Ecuador cocoa 43. Pekic, V., 2014a, July 30. Back to the future: Brazilianupdate and outlook. USDA (United States federal bill re-discovers sustainable cabruca cocoaDepartment of Agriculture), Quito/Washington, D.C. bean production. Confectionery News. Available at:GAIN report No. EC15002. http://www.confectionerynews.com/Processing-
33. Scott, G., 2011. Growth Rates for Potatoes in Latin Packaging/Brazil-protects-sustainable-cabruca-America in Comparative Perspective: 1961-2007. Am cocoa-bean-production.J. Potato Res., 88(2): 143-152. 44. IBGE (Instituto Brasilero de Geografía e Estadística).,
34. Scott, G., R. Labarta and V. Suarez, 2013. Booms, 2015. Available at: http://seriesestatisticas.ibge.gov.Busts and Emerging Markets for Potatoes in East and br/series.aspx?no=1&op=0&vcodigo=PA01&t=lavCentral Africa 1961-2010. Potato Res., 56(3): 205-236. oura-temporaria-area-plantada#P1.
Am-Euras. J. Agric. & Environ. Sci., 16 (1): 01-19, 2016
18
45. Lopes, U.V., W. Reis Monteiro, J.L. Pires, D. Clement, 56. Van Der Kooij, S., 2013. Market study of fine flavourM. Macoto Yamada and K. Peres Gramacho, 2011. cacao in 11 selected countries. Revised version.Cocoa Breeding in Bahia, Brazil Strategies and Royal Tropical Institute, Copenhagen.Results. Crop Breeding and Applied Biotechnology, 57. Fernandez-Stark, K., P. Bamber and G. Gereffi, 2012.S1: 73-81. Case 2: Promotion of the organic cacao value chain
46. FAO (Food and Agriculture Organization of the amongst small producers in Esmeraldas and Napo,United Nations)., 2003). Medium-term prospects for Ecuador. In Inclusion of small- and medium-sizedagricultural commodities. Projections to the year producers in high value agro-food chains, Duke2010, FAO, Rome. Available at: http://www.fao.org/ CGGC (Center on Globalization, Governance anddocrep/006/y5143e/y5143e00.htm#Contents Competitiveness), Durham, pp: 30-32.Accessed 13 November 2010. 58. Nestlé, 2012. Growing sustainable fine cacao.
47. Pekic, V., 2014b. October 13. Uncertain future for Country: Ecuador. Available at: http://www.nestle.Brazilian cocoa production. Confectionery News. com/csv/case-studies/ AllCaseStudies/Sustainable-Available at: http://www.confectionerynews.com/ fine-cocoa-growing-Ecuador Accessed 10 NovemberCommodities/Brazil-s-cocoa-production-to-fall-next- 2015.decade Accessed 16 November 2015. 59. Nestlé, 2015a. Nestlé cocoa plan. Available at:
48. Cargill, 2011. Bringing back cocoa in southern Bahia, http://www.nestle.com/csv/rural-development-Brazil. Available at: http://www.cargill.com/ responsible-sourcing/nestle-cocoa-plan Accessed 10connections/bringing-back-cocoa-southern-bahia- November 2015.brazil/index.jsp Accessed 16 November 2015 60. Nestlé, 2015b. Cocoa tree rejuvenation in Ecuador. In
49. Schroth, G., E. Garcia, B.V.W. Griscom, W.G. Teixeira Nestlé in society Creating shared value and meetingand L.P. Barros, 2015. Commodity Production as our commitments 2014, pp: 104. Available at:Restoration Driver in the Brazilian Amazon? Pasture http://www.nestle.com/asset-library/documents/Re-agro-forestation with Cocoa (Theobroma cocoa) library/documents/corporate_social_responsibility/in Southern Pará. Sustain Sci. DOI 10.1007/s11625- nestle-csv-full-report-2014-en.pdf Accessed 10015-0330-8. November 2015.
50. Rice, R.A. and R. Greenberg, 2000. Cacao cultivation 61. Motamayor, J.C., P. Lachenaud, J. Wallace da Silva eand the conservation of biological diversity. Ambio, Mota, R. Loor, D.N. Kuhn, J.S. Brown and R. Schnell,9(23): 167-173. 2008. Geographic and Genetic Population
51. Blare, T. and P. Useche, 2013. Competing Objectives Differentiation of the Amazonian Chocolate Treeof Smallholder Producers in Developing Countries: (Theobroma cocoa L). PLOS One, 3(10): 1-8.Examining Cacao Production in Northern Ecuador. 62. Olivera Núñez, Q., 2014. Arqueología AltoEnviron Econ, 4(1): 71-79. Amazónico. Lima: Apus Graph Ediciones, pp: 260.
52. West, J. (Ed.)., 2001. South America, Central America 63. Chemonics, 2012. Transfoming communities,and the Caribbean. Regional Surveys of the World. transforming lives. USAID/Peru Alternative10 edition. London: Europa publications. development program III final report. Chemonics,th
53. Quingaisa, E., 2007. Estudio de caso: Denominación Lima.de origen “Cacao Arriba”, FAO/IICA, Quito. 64. Canales Martinez, M., 2014b. Análisis del mercado
54. Vanek Smith, S., 2015. February 19. Ecuador´s answer nacional para cacao fino de aroma y las industriasto the global cocoa shortage. National Public Radio. derivadas como chocolate y cosmética. ProgramaAvailable at: http://www.npr.org/2015/02/19/ Proambiente GIZ, Lima. 387420709/ecuadors-answer-to-the-global-cocoa- 65. Huamanchumo De la Cuba, C., 2013. Análisis de lashortage Accessed 09 November 2015. cadena de valor del cacao en la Región San Martin,
55. Emenius, C., 2012. Livelihood and transition to Perú, Swisscontact, Tarapoto.certified cocoa production in the Peruvian Amazon- 66. Programa ProAmbiente GIZ., 2014. Plan estratégicogendered responsibilities in Irazola, Master´s thesis, del clúster Nor-Amazonico de cacao fino de aroma enRural development and natural resource management, base del espacio interregional Amazonas-San Martin,Swedish University of Agricultural Science, Uppsala. ProAmbiente GIZ, Lima.

Am-Euras. J. Agric. & Environ. Sci., 16 (1): 01-19, 2016
19
67. INEC (Instituto Nacional de Estadística y Censos)., 81. Attolini Lecón, A., 2011. Cuentas, Dares y Tomaresn.d.. Compendio Estadístico 2013, INEC. Quito. del Cacao: Delicia, Convite, Rito Mesoamericano.
68. IICA (Inter-American Institute for Cooperation in Aspectos Antropológicos. Revista DigitalAgriculture), 2010. Escuelas de campo para Universitaria, 12(4): 1-22. Available at:agricultores de café y cacao- experiencias y lecciones http://www.revista.unam.mx/vol.12/num4/art38/art3aprendidas en la selva central, IICA, Lima. Available 8.pdf Accessed 19 November 2015at: http://orton.catie.ac.cr/repdoc/A5997E/ 82. Khodorowsky, K. and R. Hervé., 2001. The little bookA5997E.PDF Accessed 20 September 2014. of chocolate. Paris: Flammarion, pp: 120.
69. Gómez, R., 2008. Agricultura comercial moderna en el 83. SIAP (Sistema de Información Agroalimentaria yPerú: el caso de la agricultura de exportación no Pesquera)., 2015a. La historia del cacao México.tradicional (1995-2007). In: SEPIA (Seminario Available at http://www.siap.gob.mx/siaprendes/Permanente de Investigacion Agraria). XII: Perú: el contenidos/3/02- cocoa/contexto-4.html Accessed 11problema agrario en debate, Eds., Damonte, G., B. November 2015.Fulcrand and R. Gómez, R. Lima: SEPIA. 84. SIAP (Sistema de Información Agroalimentaria y
70. Gestión, 2014. December 02. United Cacao apunta a Pesquera)., 2015b. Producción agrícola: Cacao.liderar mercado global con proyecto de 3250 Available at: http://www.siap.gob.mx/cierre-de-la-hectáreas en Perú. Lima. produccion-agricola-por-estado/ Accessed 11
71. ICRAF (World Agroforestry Centre)., n.d. Influencia November 2015.de la producción y comercialización de cacao 85. Fundación Cacao México., 2015a. Cocoa en México.certificado y no certificado en aspectos ambientales, Available at: http://www.cocoamexico.org/económicos y sociales de la región Ucayali-Perú, ?page_id=1051 Accessed 19 November 2015.ICRAF, Lima. 86. Fundación Cacao México., 2015b. Proyecto Mars.
72. United Cacao, 2014. Admission statement. United Available at: http://www.cocoamexico.org/Cocoa, Grand Cayman. ?page_id=1402 Accessed 20 November 2015
73. EIA (Environmental Investigation Agency), 2015. 87. Ikei, 2010. Estudio de benchmarking del sector deDeforestation by definition. EIA, Washington, D.C. cacao entre República Dominicana y Colombia.
74. Hill, D., 2015, April 18. Can Peru stop “ethical Estudio de mercado. AIRD (Asociación de Industriaschocolate” from destroying the Amazon? The de República Dominicana), Santo Domingo. Guardian. Available at http://www.theguardian. 88. Fernandez-Stark, K. and P. Bamber, 2012.com/environment/andes-to-the-amazon/2015/apr/17/ Competitividad de pequeños productores de cacaocan-peru-stop-ethical-chocolate-destroying-amazon orgánico de la Confederación Nacional deAccessed 15 May 2015. Cocoacultores Dominicanos (CONACADO). Duke
75. mpf (Machu-Picchu foods)., 2015. Available at: CGGC (Center on Globalization, Governance andhttp://www.mpf.com.pe Accessed 15 September 2015 Competitiveness), Durham. DR-S1007.
76. Mejia, J., 2015. Amazonas Trading Peru. Powerpoint 89. FAO (Food and Agriculture Organization of thepresentation. Seminar: Avances y perspectivas del United Nations)., 2001. World markets for organiccacao peruano para el mundo: Pequeño agricultura fruits and vegetables, Economic and Socialante grandes retos. 01 October 2015. Lima. Development Department, FAO, Rome.
77. Higuchi, A., 2011. Marketing performance of the 90. Dominica on line., n.d. Productives sectors: cocoa.cocoa cooperatives in the Peruvian jungle the Available at: http://www.dominicanaonline.org/Acopagro cooperative case study, Ph.D. Department portal/english/cpo_cocoa.asp Accessed 26of Agriculture and Resource Economics, Graduate November 2015School of Bioresource and Bioenvironmental 91. FLO (FAIR TRADE INTERNATIONAL)., 2013.Science, Kyushu University. Fukuoka. Monitor the Scope and Benefits of Fair Trade. 5th
78. FAIR TRADE USA, 2011. 2010 Almanac. Oakland: edition. FLO, pp: 127. Fair Trade USA. 92. Mite, F., M. Carrillo and W. Durango, 2010. Avances
79. FAIR TRADE USA, 2013. 2012 Almanac. Oakland: del Monitoreo de Presencia de Cadmio en AlmendrasFair Trade USA. de Cacao, Suelos y Agua de Ecuador. In XII
80. AVSF (Agronomes et Vétérinaires Sans Frontieres)., Congreso Ecuatoriano de la Ciencia de Suelo, 17-192013. El desarrollo cocoatero peruano. Estrategias November, Santo Domingo. Available at:para promover y fortalecer la cadena productiva del https://app.box.com/s/ypon3kded0ro48krfuji5sb8s7cocoa, AVSF, Lima. sh2mq8 Accessed 03 December 2015.