growing up in ireland - static.rasset.ie · national longitudinal study of children growing up in...
TRANSCRIPT
National Longitudinal Study of Children
Growing Up in Ireland
INFANT COHORT
REPORT 4
MATERNAL HEALTH BEHAVIOURSAND CHILD GROWTH IN INFANCY

National Longitudinal Study of Children
Growing Up in Ireland
MATERNAL HEALTH BEHAVIOURS AND CHILD GROWTH IN INFANCYAnalyses of the Infant Cohort of the Growing Up in Ireland study
October 2014The views expressed in this report are those of the authors and do not necessarily reflect the views of the funders or of either of the two institutions involved in preparing the report.
Richard Layte & Cathal McCrory
Project1 14/10/2013 16:29 Page 1

Growing Up in Ireland • MATERNAL HEALTH BEHAVIOURS AND CHILD GROWTH IN INFANCY
2
Copyright © Minister for Children and Youth Affairs, 2014
Department of Children and Youth Affairs43-49 Mespil RoadDublin 4Tel: +353 (0) 1 647 3000Fax: +353 (0) 1 647 3101Email: [email protected]: www.dcya.gov.iePublished by The Stationery Office, Dublin
ISBN 978-1-4064-2839-1
All rights reserved. No part of this publication may be reproduced, stored in a retrieval system, or transmitted, in any form or by any means, electronic, mechanical, photocopying, recording or otherwise, without the prior permission in writing of the copyright holder.
For rights of translation or reproduction, applications should be made to the Head of Communications, Department of Children and Youth Affairs 43-49 Mespil Road, Dublin 4.

ACKNOWLEDGEMENTS
3
Growing Up in Ireland • MATERNAL HEALTH BEHAVIOURS AND CHILD GROWTH IN INFANCY
ACKNOWLEDGEMENTS
This report owes a debt of thanks to a large number of people. We would like to acknowledge the funding of the Growing Up in Ireland project by the Department of Children and Youth Affairs (DCYA) and the invaluable work of those working at the DCYA particularly Dr Claire Finn, Ms Anne-Marie Brooks and Mr Tim Heneghan.
Special thanks should be given to Prof. Anne Sanson of the University of Melbourne and Dr Satya Brink of Human Resources and Social Development, Canada who commented on earlier drafts of the report and made a large number of helpful suggestions. Staff and colleagues in both the ESRI and Trinity College Dublin provided assistance in many ways and we would particularly like to thanks James Williams, Emer Smyth, Aisling Murray, Fiona Burke, Amanda Quail and Liz Nixon for giving so generously of their time.
The 84 children who sit on the Children’s Advisory Forum (CAF) provided very important help in developing and testing themes, issues and questionnaires for the study. Lastly, we are deeply indebted to the 11,134 children and their parents who participated in the Infant Cohort of the Growing Up in Ireland study. This report would not have been possible without their time and assistance.

TABLE OF CONTENTS
LIST OF FIGURES AND TABLES 5EXECUTIVE SUMMARY 6
CHAPTER 1: INTRODUCTION 91.1 Introduction 101.2 The conceptual framework of the study 111.3 Data and measures 12 1.3.1 Physical measures 12 1.3.2 Socio-economic status 121.4 Report plan 13
CHAPTER 2: MATERNAL SMOKING AND CESSATION DURING PREGNANCY 152.1 Introduction 162.2 How many mothers in the Growing Up in Ireland study smoked during pregnancy? 162.3 Who smokes during pregnancy? 172.4 Which factors were associated with smoking during pregnancy? 182.5 What are the independent effects of different factors on quitting smoking? 212.6 What factors are associated with the quantity of cigarettes smoked? 232.7 Summary 26
CHAPTER 3: MATERNAL CONSUMPTION OF ALCOHOL DURING PREGNANCY 273.1 Introduction 283.2 How many mothers drank alcohol during pregnancy? 283.3 What are the independent effects of different factors on the probability of consuming alcohol during pregnancy? 313.4 What are the independent effects of different factors on the number of units of alcohol consumed? 333.5 Summary 37
CHAPTER 4: BREASTFEEDING BEHAVIOURS OF MOTHERS 394.1 Introduction 404.2 Breastfeeding trends in Ireland 414.3 The measurement of breastfeeding in Growing Up in Ireland 424.4 How were children breastfed? 424.5 What reasons were given for not breastfeeding? 434.6 How long did mothers breastfeed their babies? 444.7 What reasons were given for stopping breastfeeding? 464.8 What factors were independently associated with the probability of breastfeeding? 464.9 Which characteristics were associated with longer breastfeeding durations? 494.10 Summary 52
CHAPTER 5: CHILD BIRTH-WEIGHT AND GROWTH IN EARLY INFANCY 535.1 Introduction 545.2 The factors associated with child birth-weight 545.3 Which are the key factors associated with birth-weight? 555.4 The reliability of birth-weight data 565.5 What is the independent effect of different factors in birth-weight? 565.6 What were the patterns of growth from birth to nine months? 595.7 Birth-weight and subsequent growth 605.8 Which factors independently predict rapid growth from birth to nine months? 615.9 Summary 64
CHAPTER 6: POLICY IMPLICATIONS 65REFERENCES 69
Growing Up in Ireland • MATERNAL HEALTH BEHAVIOURS AND CHILD GROWTH IN INFANCY
4

LIST OF FIGURES
Figure 1.1: The bioecological model of child development 11Figure 2.1: Percentage of mothers who smoked during pregnancy 17Figure 2.2: Number of cigarettes smoked by mothers during pregnancy, by household social class 18Figure 2.3: Pattern of smoking during pregnancy by mother’s educational level (for those smoking in the first trimester) 25Figure 3.1: Distribution of level of alcohol consumption among mothers by trimester 29Figure 3.2: Average weekly units of alcohol consumption among mothers by trimester for those consuming 1+ in each trimester 29Figure 3.3: Adjusted odds ratio of consuming alcohol in first trimester by trimester of first antenatal visit (adjusted for variables in Table 3.1) 30Figure 3.4: Units of alcohol consumed by mothers during pregnancy, by maternal age and trimester 36Figure 4.1: Proportion of children being breastfed (any breastfeeding) at discharge from hospital 2000-2009 41Figure 4.2: Proportion of children being breastfed (any breastfeeding) at discharge from hospital, by maternal nationality, 2004-2010 42Figure 4.3: Proportion of mothers breastfeeding by type and days since birth of child 45Figure 4.4: Kaplan Meier estimate of non-exclusive breastfeeding by maternal nationality 45
LIST OF TABLES
Table 2.1: Unadjusted and adjusted odds of smoking during pregnancy 19Table 2.2: Unadjusted and adjusted odds of quitting smoking in the second or third trimesters for women who smoked in the first or second trimesters of pregnancy 21Table 2.3: Unadjusted and adjusted predictors of number of cigarettes smoked per day during pregnancy 23Table 3.1: Unadjusted and adjusted odds of predictors of consuming any alcohol during pregnancy 31Table 3.2: Unadjusted and adjusted predictors of the number of units of alcohol consumed on average per week during pregnancy (for those drinking 1+ units during pregnancy) 34Table 4.1: Prevalence of breastfeeding by maternal citizenship 43Table 4.2: Reasons for not breastfeeding (ranked by frequency) given by mothers who did not initiate breastfeeding 44Table 4.3: Reasons for stopping breastfeeding (ranked by frequency) given by mothers who had initiated breastfeeding 46Table 4.4: Unadjusted and adjusted odds of predictors of breastfeeding at discharge from hospital 47Table 4.5: Unadjusted and adjusted odds of predictors of stopping (any) breastfeeding, conditional on initiation of breastfeeding 50Table 5.1: Areas and factors influencing intrauterine growth and birth-weight 55Table 5.2: Comparison of Growing Up in Ireland and National Perinatal Reporting System irth-weight data (2007) 56Table 5.3: Unadjusted and adjusted predictors of birth-weight 57Table 5.4: Growth deciles crossed between birth and nine months of age, by birth-weight (N=10,800) 60Table 5.5: Unadjusted and adjusted odds of predictors of rapid growth from birth to nine months of age 61
CONTENTS
5
Growing Up in Ireland • MATERNAL HEALTH BEHAVIOURS AND CHILD GROWTH IN INFANCY

EXECUTIVE SUMMARY
The research literature on the effects of maternal environment, constitution and lifestyle on the child’s birth-weight and both acute and chronic illness in infancy is now very well developed. There is a smaller but growing literature on the effects of prenatal and early life on the child’s long-term health and wellbeing. This report examines maternal use of cigarettes and consumption of alcohol during pregnancy and whether the child is breastfed and for how long. The report then examines the role of smoking and alcohol consumption, among other factors, on birth-weight and on the pattern of growth in measured child weight from birth to nine months of age.
The Growing Up in Ireland project is following the development of two cohorts of children first visited in 2007/8. The first wave of the project collected data on 11,134 children aged nine months and their parents (the Infant Cohort) and 8,568 children aged nine years (the Child Cohort), their parents, teachers and carers. In this report, the data from the first wave of the Infant Cohort are used to provide analyses of maternal health behaviours and patterns of child growth in infancy.
1. Almost one in five mothers in Ireland smoke during pregnancyComparisons of prenatal smoking between the Child and Infant Cohorts suggest that the proportion of mothers smoking during pregnancy has decreased by over 37 per cent since the late 1990s, yet almost 18 per cent of mothers of the Infant Cohort reported smoking at some stage during their pregnancy, and 13 per cent all the way through. Women from lower income and social-class households and those with lower levels of education were significantly more likely to smoke during pregnancy. Smoking was also strongly related to the woman’s experience of psychological stress, anxiety and depression, higher numbers of previous children, having a partner who smokes and having weaker pregnancy intentions; i.e. the pregnancy was unintended or not intended at the time. Women experiencing a great deal of stress during pregnancy were almost 40 per cent more likely to smoke during pregnancy. Women who had previously had children were less likely to quit during pregnancy, as were those with lower levels of education and women who lived with a partner who smoked.
2. A complex pattern of alcohol consumption during pregnancyAbstinence from drinking alcohol during pregnancy was less likely among older women and those with higher levels of education, higher social class and income. Women aged 35 to 39 were 33 per cent more likely to drink during pregnancy than women aged under 25. Women having their second or third child were over 25 per cent more likely. However, older age, higher income, class and education also tended to be associated with more moderate drinking compared to younger women and those with lower levels of income and education. Compared to UK studies, women were significantly less likely to report drinking during pregnancy, but if they did consume, they were more likely to drink more heavily than their UK counterparts. The average number of units of alcohol consumed during pregnancy was highest in the first trimester but consumption fell after confirmation of the pregnancy. Younger and less educated women tended to drink more in early pregnancy but their consumption fell quickly in the second or third trimesters, whereas consumption among more advantaged women often increased over the pregnancy. Having had children previously was also associated with a higher prevalence of drinking, suggesting that the perception of risk falls with experience.
3. Only half of mothers breastfed their childIreland has one of the lowest national levels of breastfeeding in the world. Overall, Growing Up in Ireland data show that 56 per cent of women breastfed their child to some extent. One of the most pronounced patterns for breastfeeding in Ireland is the difference in rates by nationality: women from the UK were more than twice as likely and those from other European countries at least six times more likely to breastfeed than women from Ireland. There were large differences in behaviour by maternal socio-economic status. Women of higher income, education and social class were much more likely to breastfeed and tended
Growing Up in Ireland • MATERNAL HEALTH BEHAVIOURS AND CHILD GROWTH IN INFANCY
6

to breastfeed for longer. It is important that future research examine why this is so. Similarly, maternal age is important; older mothers were more likely to breastfeed and to breastfeed for longer. Women who delivered by caesarean section were significantly less likely to breastfeed. Hospitals accredited under the Baby-Friendly Hospital Initiative were more effective in promoting breastfeeding initiation than non-accredited hospitals, although this advantage was not sustained once women left hospital. A woman’s return to work was crucial in determining her duration of breastfeeding.
4. Child birth-weight and growth are strongly related to smoking during pregnancyThe determinants of birth-weight for the population in Ireland were similar to those in other developed nations. Child sex, number of previous children, maternal citizenship and maternal height were all significant predictors of birth-weight, controlling for other factors. However, the most important determinant of birth-weight to emerge from the analysis was maternal smoking during pregnancy. Smoking in the first trimester was associated with a 235g reduction in birth-weight, adjusting for other factors, and there was a linear, dose-responsive relationship between the number of cigarettes smoked in the third trimester and birth-weight: heavy smoking (11+ cigarettes daily) reduced birth-weight by 311g on average.
Rapid growth in infancy was an important risk factor for childhood and adult obesity. Less breastfeeding and earlier introduction of solid foods were both important determinants of rapid growth from birth to nine months.
World Health Organisation (WHO) guidelines state that children should be exclusively breastfed until six months of age and only introduced to solid foods at that point. Almost half of children in Ireland were weaned onto solids by four months of age. Just under 10 per cent of children were weaned by three months of age, while less than a third were weaned after six months, as per the WHO recommendation.
5. Policy recommendations• In2008almostafifthofwomenreportedsmokingduringpregnancyinIreland,and13percentallthe
way through. Given the implications of smoking during pregnancy for child health and wellbeing, smoking prevention among young women should be a priority. Smoking cessation interventions among pregnant women will be a good investment against longer-term health and behaviour problems.
• Smokingcessationforpregnantwomenwasmademoredifficultwhentheylivedwithothersmokers.Smoking cessation efforts should therefore be targeted at partners as well as the woman herself.
• Smokingcessationeffortsshouldbecoordinatedacrossmaternityhospitals.
• The probability of smoking during pregnancy increased with the experience of stress, anxiety anddepression. Assessment and intervention for these conditions at first booking appointment should be a priority.
• ThehighconsumptionofalcoholinIrishsocietymeansthatmanychildrenareexposedtohighlevelsofalcohol until a woman’s pregnancy is confirmed. Reducing consumption among younger women would be beneficial for both their own and their future children’s health.
• Growing Up in Ireland data indicate that maternal embarrassment around breastfeeding contributed to the decision not to breastfeed and was more likely among younger, less educated women. This result adds to the findings of previous research from Ireland that found that those not embarrassed were 2.3 times more likely to initiate breastfeeding. Given this, a well-structured programme, similar to those used for drinking and driving, could help to change beliefs and attitudes. Particular emphasis needs to be placed on changing attitudes which portray breastfeeding as embarrassing and ‘unnatural’.
• Ahighproportionofwomenstoppedbreastfeedingbecausetheyperceivedtheirchildwasnotgettingenough nutrition. This is unlikely to be the case and suggests that parents may confuse frequent feeding with child hunger. Improving communication on this issue between parents and health professionals in the antenatal and immediate post-birth period may increase the duration of feeding among a significant proportion of mothers.
EXECUTIVE SUMMARY
7
Growing Up in Ireland • MATERNAL HEALTH BEHAVIOURS AND CHILD GROWTH IN INFANCY

• Thepracticesofmaternityhospitalshavean important impactonbreastfeeding initiation.Hospitalsaccredited under the WHO Baby-Friendly Hospital Initiative were more effective at initiating breastfeeding, but less than half of all maternity hospitals are currently accredited. All maternity hospitals should be accredited under the system as soon as possible.
• TheprevalenceofearlyweaninginIreland(beforesixmonths)suggeststhatparentsinIrelandarenotaware of the health consequences for their child. Health professionals need to communicate a clearer message on this issue to parents.
Growing Up in Ireland • MATERNAL HEALTH BEHAVIOURS AND CHILD GROWTH IN INFANCY
8

Growing Up in Ireland • MATERNAL HEALTH BEHAVIOURS AND CHILD GROWTH IN INFANCY
9
INTRODUCTION
Chapter 1

1.1 INTRODUCTION
The prenatal and early life environment that a child experiences has a profound influence on their health in infancy and subsequent pattern of physical and mental development. There is now a well-developed research literature internationally on the effects of maternal environment, constitution and lifestyle on the child’s birth-weight and on both acute and chronic illness in infancy. There is a smaller, but growing literature on the effects of prenatal and early life on the child’s long-term health and wellbeing. This report examines the patterning and determinants of three factors which have been shown to have important influences on child health and wellbeing: maternal use of cigarettes and consumption of alcohol during pregnancy, and whether the child is breastfed and for how long. As will become evident below, international research shows that each of these health behaviours is associated with important short- and long-term consequences for the child, yet there has been relatively little research on their distribution in Ireland, using nationally representative data. Using the data from the Infant Cohort of Growing Up in Ireland, this report provides a detailed examination of the distribution and predictors of alcohol and tobacco use during pregnancy and the extent of breastfeeding. The report then goes on to examine the relationship between these variables and the child’s pattern of growth from birth to nine months of age.
Smoking during pregnancy is extremely detrimental to both maternal and infant health. Cigarettes contain a large number of compounds which are toxic to foetal development, including nicotine, sulphides, cyanide, cadmium and a host of carcinogenic hydrocarbons (Fried et al, 1987; Stroud et al, 2009). Smoking during pregnancy is the most important determinant of both intrauterine growth retardation (Kramer, 1987) and a contributor to premature birth, either of which can result in low birth-weight (weight at birth less than 2,500g).
Low birth-weight by ‘proportional stunting’ (where the child has proportional reductions in weight, length and head circumference) can result in severe child morbidity among neonates, as well as later cognitive deficits and psychological/behavioural conditions. ‘Disproportionate wasting’, on the other hand, is more common and describes the child who is born with low weight with relatively normal length and head circumference; i.e. the child is ‘thin’, with low weight for length. This pattern is associated with unusually fast catch-up growth, which has been associated with later metabolic syndrome (a precursor to type two diabetes and cardiovascular disease) and child and adult obesity (Barker et al, 1989; Ong et al, 2002).
Maternal smoking during pregnancy has also been shown to be associated with later externalising behaviours in childhood, particularly attention deficit hyperactivity disorder. A recent Irish study using the Child Cohort of Growing Up in Ireland (McCrory & Layte, 2012b) found that nine-year-old children whose mothers were ‘light’ smokers during pregnancy were 2.6 times more likely to score in the ‘abnormal’ range on a measure of externalising behaviours, after adjusting for other relevant factors. Children whose mothers were ‘heavy’ smokers were over five times more likely.
While high levels of maternal alcohol consumption during pregnancy are associated with miscarriage, lower birth-weight and longer-term problems including growth deficiency, and facial and neurological abnormalities (Fetal Alcohol Syndrome; Jones & Smith, 1973), evidence is more mixed on whether low levels of drinking during pregnancy are also harmful to the child. More recently, drinking during pregnancy has been related to externalising behaviours such as conduct problems and hyperactivity (Sayal, 2007; Sood, 2001; Linnet, 2003) as well as cognitive deficits (Streissguth, 1989; 1990; Fried, 1992; Olsen, 1994). However evidence remains inconclusive (Testa, 2003; Gray, 2006; Royal College of Obstetricians and Gynaecologists, 2003), such that the UK does not currently recommend total abstinence from alcohol for women during pregnancy.
Breastfeeding is associated with significant short- and long-term benefits for the mother and child. For
Growing Up in Ireland • MATERNAL HEALTH BEHAVIOURS AND CHILD GROWTH IN INFANCY
10

mothers, breastfeeding is associated with short-term benefits such as faster return to pre-pregnancy body-weight (Kramer et al, 1993) and a lower risk of postpartum depression (Jones, McFall & Diego, 2004). Longer-term benefits for mothers include a lower risk of cardiovascular disease and breast and ovarian cancer (Schwarz et al, 2010). For infants, breastfeeding provides better protection from acute infections (Wilson et al, 1998), otitis media (Aniansson et al, 1994), neonatal enterocolitis (Golding, Emmet & Rogers, 1997) and respiratory illness (Oddy et al, 2003). Evidence is also mounting that breastfeeding has long-term benefits for the child too. Studies have found strong evidence that breastfeeding significantly lowers the child’s risk of obesity in childhood (Stettler, 2007). Recent Irish research using the Growing Up in Ireland Child Cohort has shown that breastfeeding for between three and six months reduces the risk of obesity at age nine by 38 per cent, after adjusting for other factors. Breastfeeding for six months or more reduces the risk by 50 per cent (McCrory & Layte, 2012a).
Another Irish study using the Growing Up in Ireland Child Cohort (McCrory & Layte, 2011) examined the relationship between being breastfed and the child’s educational performance at age nine; it showed that children who had been breastfed scored 3.2 percentage points higher on reading and 2.2 percentage points higher on mathematics compared to those who were never breastfed, adjusting for other factors.
1.2 THE CONCEPTUAL FRAMEWORK OF THE STUDY
Growing Up in Ireland explicitly adopted a bioecological model (Bronfenbrenner, 1979) of child development and wellbeing in the design and methodology of the survey. This bioecological model places the child at the centre of a system of reciprocal influences, represented as a set of concentric rings (see Figure 1.1).
Figure 1.1: The bioecological model of child development
The child, at least in early development, is most influenced by the immediate context in which they live, through the influence of parents, siblings and near relations such as grandparents. This is represented in the ecological model as the microsystem. The child is an active participant in these interactions and influences
Chapter 1 • INTRODUCTION
11
Growing Up in Ireland • MATERNAL HEALTH BEHAVIOURS AND CHILD GROWTH IN INFANCY
MACROSYSTEM
EXOSYSTEM
Attitudes and ideologies of the culture
Extended family
Social welfare services
Massmedia
Legal services
Friendsof
family
NeighboursSchoolFamily
Healthservices
Churchgroup
Neighbourhoodplay area
Daycarecentre
Peers
MESOSYSTEM
MICROSYSTEM
CH
RO
NO
SYSTEM
CHILD

12
Growing Up in Ireland • MATERNAL HEALTH BEHAVIOURS AND CHILD GROWTH IN INFANCY
the nature of the microsystem to a greater or lesser extent. The elements of the microsystem interact themselves (in involvement of grandparents in childcare, for instance) and in turn with the exosystem, that is, the local community and institutions such as schools, crèches and social welfare services. Lastly, these concentric systems lie within the outer ring of the macrosystem which represents the attitudes, ideologies and culture of the society in which the child lives as well as the economic, political, legal and regulatory structure of the society. This conceptual system provides the analytical structure both for Growing Up in Ireland as a whole and this report in particular.
1.3 DATA AND MEASURES
The nationally representative sample of 11,134 infants and their families who participated in Wave 1 of the Infant Cohort of Growing Up in Ireland was randomly selected from the Child Benefit Register maintained by the Department of Social Protection. Children born between December 2007 and May 2008 were selected into the sample for interview at nine months of age; the interviewing took place between September 2008 and April 2009. The sample response rate was 65 per cent of all families approached and 69 per cent of valid contacts made in the course of fieldwork. In line with best practice, the completed sample was statistically grossed (reweighted) on the basis of external population estimates taken from the Census of Population. A total of 73,662 infants were recorded on the Child Benefit Register for the calendar year 2008. This is the population to which the figures in this report are statistically adjusted.
The data were collected by computer-assisted personal interview (CAPI). Families were first sent a letter explaining the aims of the study and what would be involved, including the date that the fieldworker would visit the house. A trained fieldworker would then arrive at the address and carry out a CAPI with the parent(s), one of whom would be nominated as the Primary Caregiver by the parents (where both were resident). The parent(s) were also asked to self-complete a supplementary questionnaire on a laptop provided. This questionnaire included questions of a more sensitive personal nature; self-completion is a well-validated method of minimising response bias for such measures. The next two sub-sections describe the physical and socio-economic measures used in every chapter of this report. Measures only used within single chapters are described in the relevant chapter.
1.3.1 Physical measures As well as collecting information via personal and self-completion interviews, physical measures were also collected on the Study Infant and parents. The infant’s length at nine months of age was measured using a SECA 210 measuring mat (model 210 1821009). The child’s weight at nine months was measured using a SECA 835 portable electronic scales. SECA 835 scales have an upper capacity of 50 kilograms and are graduated in 20g increments below 20 kilograms and in 50g increments above 20kilograms. They are Class III medically approved. Parental weight measurements were recorded to the nearest 0.5 kilogram using a SECA 761 medically approved (Class III) flat mechanical scale that was graduated in one kilogram increments and had an upper capacity of 150 kilograms.
1.3.2 Socio-economic statusAll multivariate analyses in this report include measures of the social class and income level of the household as well as the educational level of the mother. Household social class is measured using the Irish Central Statistics Office’s social class measure, which allocates individuals to households based on occupational position (Professional; Managerial and Technical; Non-manual; Skilled Manual, Semi- and Unskilled Manual, plus an ‘Unclassified’ grouping where no previous occupational position is available). A household class is constructed by taking the highest class where two parents in the household are working. Household income is measured as net income after taxes and social insurance payments, and ‘equivalised’ or adjusted for the number and composition of people in the household. Households are allocated to one of five income quintiles. Households that did not answer the income questions are allocated to a ‘missing’ category in the

Growing Up in Ireland • MATERNAL HEALTH BEHAVIOURS AND CHILD GROWTH IN INFANCY
13
analyses so that they can be retained in analyses. Although it would be possible to combine these three measures into one ‘socio-economic status’ measure, all three are used individually in analyses as their relative effects provide an insight into the underlying process linking them to the variable being predicted (smoking, alcohol, breastfeeding, growth).
1.4 REPORT PLAN
The next chapter of this report examines the patterning of cigarette smoking during pregnancy reported by mothers in Growing Up in Ireland. The chapter examines previous literature on the short- and long-term consequences of cigarette smoking before discussing previous research on the distribution of smoking across the population of pregnant women. It examines both the overall probability of smoking during pregnancy and the pattern of cessation, or lack of it, across the three trimesters of pregnancy. The third chapter, focused on alcohol consumption during pregnancy, follows a similar analytical approach. A literature review of the impact of and distribution of alcohol consumption is followed by both descriptive and multivariate analysis of the data from the Infant Cohort study. The fourth chapter focuses on the pattern and determinants of breastfeeding in Ireland. The Growing Up in Ireland data not only allow examination of the characteristics associated with breastfeeding overall but also those that predict the duration of breastfeeding. This is the first time that such data have been collected and analysed on a national basis for Ireland. The fifth chapter examines the influence of different factors on the birth-weight of the child and their subsequent growth pattern. The sixth and last chapter brings together the insights of the report and teases out some of their policy implications.
Chapter 1 • INTRODUCTION

Growing Up in Ireland • MATERNAL HEALTH BEHAVIOURS AND CHILD GROWTH IN INFANCY
14

Growing Up in Ireland • MATERNAL HEALTH BEHAVIOURS AND CHILD GROWTH IN INFANCY
15
MATERNAL SMOKING ANDCESSATION DURING PREGNANCY
Chapter 2
16
Growing Up in Ireland • MATERNAL HEALTH BEHAVIOURS AND CHILD GROWTH IN INFANCY
2.1 INTRODUCTION
Maternal smoking during pregnancy is known to be detrimental to both maternal and infant health. The Department of Health recommends that women abstain from smoking during the course of their pregnancy. Nevertheless, research in Ireland indicates that a sizeable minority of pregnant women fail to adhere to these recommendations and that smoking during pregnancy remains a major public health problem. As a nationally representative cohort study, Growing Up in Ireland provides the opportunity to examine the overall level of smoking during pregnancy as well as the processes that influence it.
As part of the interview with the Primary Caregiver in the first wave of the Infant Cohort, respondents were asked: [D]id you smoke during the first, second or third trimester of the pregnancy? If they answered in the affirmative, they were asked whether they did so in each trimester of the pregnancy and how many cigarettes, on average, per day. It is important to remember that this information was collected nine months after birth and so may be influenced by recall bias. This could mean that women fail to recall smoking during pregnancy or reduce their reported level of cigarette consumption. There is no external check on the extent of this process but it is assumed here that any bias is uniform across women in the study.
This chapter examines whether smoking during pregnancy is related to the education and level of income of the mother. Studies internationally have shown that low income and education are strongly related to the probability of smoking during pregnancy (Graham & Der, 1999). However, evidence also suggests that low socio-economic status is part of a wider constellation of factors that contribute toward the risk of smoking, including maternal stress and depression, alcohol use, unintended pregnancy and partners who smoke (Dejin-Karlsson, 1996; Gilman et al, 2008). This chapter examines whether these factors are an important determinant of smoking during pregnancy in Ireland.
2.2 HOW MANY MOTHERS IN THE GROWING UP IN IRELAND STUDY SMOKED DURING PREGNANCY?
Overall, 17.6 per cent of mothers reported that they had smoked at some stage during their pregnancy, while 12.6 per cent reported that they had smoked during all three trimesters. This proportion is high compared to northern European countries such as Sweden where the rate of smoking during pregnancy averages 8.9 per cent (European Perinatal Health Report, 2008) but lower than the British rate (see Figure 2.1). There is relatively little national data on trends in rates of smoking during pregnancy but those available suggest that the rate has declined, as shown in Figure 2.1. Data from the Growing Up in Ireland Child Cohort show that 28.1 per cent of mothers whose children were born between 1997 and 1998 reported that they had smoked during pregnancy (McCrory & Layte, 2012b), declining to 20.9 per cent in 2004-2006 according to data provided by the Coombe Women and Infants Study (Tarrant et al, 2011) and 17.6 per cent in 2007-2008 according to Growing Up in Ireland (Infant Cohort). Averaged over the time-span, this means that there has been a proportionate decrease of 37.4 per cent ((28.1-17.6)/28.1) in the number of women who smoke during pregnancy in the past decade. Figures from the Slán Survey (Brugha et al, 2009) suggest that smoking rates among women under 45 have declined by less than 5 per cent over the same period, suggesting an increasing sensitivity to the dangers of smoking during pregnancy above and beyond the general risks associated with smoking.

Growing Up in Ireland • MATERNAL HEALTH BEHAVIOURS AND CHILD GROWTH IN INFANCY
17
Figure 2.1: Percentage of mothers who smoked during pregnancy
2.3 WHO SMOKES DURING PREGNANCY?
Research internationally suggests that women who do not smoke or who quit during pregnancy tend to be more advantaged in terms of level of education and occupational status, are more likely to be employed, and tend to be older (Agrawal et al, 2008; Graham & Der, 1999; Pickett, Wilkinson & Wakschlag, 2009). The British Millennium Cohort Study found that smoking during pregnancy was significantly less likely among black and Asian mothers than among white British mothers (Pickett, Wilkinson & Wakschlag, 2009). Other more specific risk factors have also been identified. Women who smoke during pregnancy tend to have started smoking at a younger age, smoked more heavily before pregnancy, and were more addicted by standard measures (Gilman et al, 2008). Women who are depressed are less likely to quit during pregnancy (Kiernan & Pickett, 2006; Pritchard, 1994), as are women who report high levels of anxiety and stress (Paarlberg et al, 1999; Thue, Schei & Jacobson, 1995). Women who live with a partner who smokes are both more likely to smoke before pregnancy and less likely to quit once they become pregnant (Appleton & Pharoah, 1998; Mondon et al, 2003; Wakefield et al, 1993).
A number of research papers have argued that smoking during pregnancy needs to be understood within a constellation of maternal psycho-social problems (Dejin-Karlsson et al, 1996; Pickett et al, 2002; Pickett, Wilkinson & Wakschlag 2009; Wakschlag et al, 2003). Pickett et al (2009) found that smokers tended to have more problematic interpersonal relationships with partners, family, friends and neighbours and worse adaptive functioning (reporting lacking confidence or competence in parenting and functioning in day-to-day activities).
A consistent finding in the literature is that maternal smoking during pregnancy is strongly socio-economically patterned and that mothers from more disadvantaged backgrounds are more likely to smoke during their pregnancy (Lanting et al, 2009). Figure 2.2 shows that there was a social-class structuring in the Growing Up in Ireland data with respect to the number of cigarettes smoked during pregnancy, with heavier smoking during pregnancy as one moves from left to right from the professional class to those who report never having had a job. Whereas 40.8 per cent of mothers from the semi/unskilled social-class group reported that they smoked during pregnancy, this figure was only 8.3 per cent among those from professional/managerial households.
Chapter 2 • MATERNAL SMOKING AND CESSATION DURING PREGNANCY
0.0%
5.0%
10.0%
15.0%
20.0%
25.0%
30.0%
35.0%
40.0%
Millennium Cohort Study, UK
(2001)
Growing Up inAustralia - birth cohort
(2003-2004)
Growing Up inScotland(2006)
Growing Up inIreland - child cohort
(1997-1998)
Coombe Womenand Infants Study
(2004-2006)
Growing Up inIreland - birth cohort
(2007-2008)
36.0%
18.3%
25.0%
28.1%
20.9%
17.6%

Growing Up in Ireland • MATERNAL HEALTH BEHAVIOURS AND CHILD GROWTH IN INFANCY
18
Figure 2.2: Number of cigarettes smoked by mothers during pregnancy, by household social class
2.4 WHICH FACTORS WERE ASSOCIATED WITH SMOKING DURING PREGNANCY?
The section above identified a number of factors associated with maternal smoking during pregnancy that can be examined using Growing Up in Ireland data. To separate the independent effects of each factor, a multivariate logistic model of the probability of smoking during pregnancy was estimated. This estimates the log of the probability of the mother smoking during pregnancy as a function of a set of predictor variables. In the sample, 82.4 per cent did not smoke during their pregnancy, leaving 17.6 per cent who smoked at some point. The model estimated the influence of different factors on the probability of a woman being in this 17.6 per cent, expressed in terms of an odds ratio (where numbers larger than one indicate a higher probability of being in the smoking group relative to the reference category). This model examined the effects of a number of factors:
• Citizenship(countryoforigin)• Age(inyears)• Numberofpreviouschildrenborn• Highestlevelofeducation• Householdsocialclass• Householdequivalisedincomequintile• Whetherornotmotherwastreatedfordepression,anxietyornervesduringthepregnancy• Whetherornotandtowhatextentthemotherexperiencedpsychologicalstressduringpregnancy(bytrimester)• Unitsofalcoholconsumedduringthefirsttrimester• Numberofothersmokersinhousehold• Pregnancyintentions(whetherthepregnancywasplannedatthetime)• Treatedfordepression,anxietyornerveswhilepregnant
The results of this analysis are presented in Table 2.1. This gives the odds ratio for each factor, first without adjustment (lefthand column), and then with adjustment for all other factors in the table (righthand column).
As found in British studies (Pickett, Wilkinson & Wakschlag, 2009), Irish and UK women were significantly more likely to smoke during pregnancy than women of other nationalities. Younger women, those with lower levels of education, those in a lower social class position (relative to professional workers) and those
100
90
80
70
60
50
40
30
20
10
0Professional/managerial Non-manual/skilled-manual Semi-skilled/unskilled Never worked - no social class
%
Never smoked 1-5 daily 6-10 daily 11-20 daily 20+ daily
91.7
81.668.9
59.2

Chapter 2 • MATERNAL SMOKING AND CESSATION DURING PREGNANCY
19
Growing Up in Ireland • MATERNAL HEALTH BEHAVIOURS AND CHILD GROWTH IN INFANCY
with lower levels of household income were significantly more likely to smoke. These patterns remained even after adjustment for all other factors in the analysis. Women for whom this child was their first pregnancy were significantly less likely to smoke; the odds of smoking increased with the number of previous children (women with three or more previous children were 57 per cent more likely to smoke). This could suggest that concerns about the negative effects of smoking decline with experience of childbirth. As found in literature internationally, women who report higher levels of stress in their pregnancy were significantly more likely to smoke during the first trimester. For example, adjusting for all other factors, women who reported feeling ‘a great deal’ of psychological stress were 37 per cent more likely to smoke than those feeling ‘none at all’. Similarly, women who had intended to become pregnant later or not at all were significantly more likely to smoke during pregnancy compared to women who had planned on becoming pregnant at the time. Women who experienced depression prior to or during pregnancy were a third more likely to smoke. As found in research in other countries, women who live in households where others smoke were significantly more likely to smoke. Since socio-economic position and other factors were adjusted for here, this is likely to reflect the difficulty in quitting smoking when others in the household smoke. Lastly, consumption of alcohol appears to be strongly associated with smoking during pregnancy. Each unit of alcohol consumed in the first trimester was associated with an 18 per cent increase in the odds of smoking. Although this could be interpreted as a direct effect, it may be more likely that alcohol and cigarette consumption are the joint products of another process.
Although this analysis has examined a large number of issues, it nonetheless explains only a fifth of the variation in smoking across the sample of mothers. It is possible to increase the proportion of the variation explained by examining the way that the effect of variable X changes with the value of variable Y (so-called interaction effects). For example, it may be that the effect of stress during pregnancy is higher for low-income mothers, who have fewer resources to be mobilised to buffer the experience. However, adding interactions introduces complexity; it was felt that a more parsimonious approach may be more practical in this report. Similarly, it is likely that there are other important factors missing from our analysis such as the degree of social support, personality type, and history of smoking in the mother’s household when she was growing up, which could also be important determinants. Some measures are not available for use (i.e. personality, history of smoking) but the models could be improved by the addition of other factors (i.e. they would explain more variance). Once again however, adding variables increases the complexity of the analysis and this too has diminishing returns.
Table 2.1: Unadjusted and adjusted odds of smoking during pregnancy
Wald Sig.Unadj. Odds
Sig.Adj.Odds
Sig.
Maternal Citizenship 132.46 *
Irish Ref. Ref.
UK 0.93 n.s 0.90 n.s
EU12 0.76 ** 0.58 ***
EU14 0.60 n.s 0.91 n.s
African 0.18 *** 0.10 ***
Far East 0.16 *** 0.14 ***
Other 0.18 *** 0.17 ***
Maternal Age 486.98 ***
<25 4.45 *** 1.76 ***
25-29 1.87 *** 1.40 ***
30-34 Ref. Ref.
35-39 0.84 * 0.79 **
40+ 0.73 * 0.57 ***

Growing Up in Ireland • MATERNAL HEALTH BEHAVIOURS AND CHILD GROWTH IN INFANCY
20
No. of Previous Children 49.85 ***
First Child Ref. Ref.
Second Child 0.98 n.s 1.21 *
Third Child 1.12 n.s 1.28 *
Fourth+ Child 1.79 *** 1.57 ***
Maternal Highest Education 895.51 ***
Lower 2nd 12.49 *** 3.73 ***
Higher 2nd 5.68 *** 2.27 ***
Post Secondary 3.14 *** 1.72 ***
Degree or Professional Qualification Ref. Ref.
Household Social Class 814.19 ***
Professional Managers Ref. Ref.
Managerial and Technical 2.05 *** 1.44 **
Non-Manual 4.03 *** 1.67 ***
Skilled Manual 5.96 *** 2.13 ***
Semi & Unskilled 8.14 *** 2.93 ***
Unclassified 12.90 *** 2.77 ***
Household Income Quintile 19.34 ***
Lowest 7.77 *** 1.65 ***
2nd 4.85 *** 1.38 *
3rd 3.09 *** 1.36 *
4th 1.82 *** 1.20 n.s
Highest Ref. Ref.
Missing 3.38 *** 1.37 n.s
Psychological Stress 41.39 ***
A Great Deal 1.72 *** 1.37 **
Some 1.20 * 1.22 *
Not Much 0.97 n.s 1.15 n.s
None at All Ref. Ref.
Alcohol Consumption 160.78 ***
Average Units of Alcohol 1.21 *** 1.18 ***
Other Smokers in Household 384.47 ***
None Ref. Ref.
1 2.99 *** 2.23 ***
2+ 3.60 *** 1.33 *
Pregnancy Intentions 380.93 ***
At that Time Ref. Ref.
Much Later 2.62 *** 1.66 ***
Somewhat Later 1.57 *** 1.36 **
Earlier 0.64 ** 0.85 n.s
Never Any Intention to Become Pregnant 3.71 *** 1.78 ***
Other 3.29 *** 2.43 ***Treated for Depression, Anxiety or Nerves
44.25 ***
No Ref. Ref.
Yes 1.78 *** 1.33 **
Constant 0.02 ***
Significance Key: *** p<0.001 **p<0.01 *p<0.05 ns = not statistically significant
N Cases: 10,530
Pseudo R2: 0.19

2.5 WHAT ARE THE INDEPENDENT EFFECTS OF DIFFERENT FACTORS ON QUITTING SMOKING?
While 17.6 per cent of mothers smoked during their pregnancy, 5 per cent of these (or 28 per cent of women reporting smoking) quit at some point during the pregnancy. The overwhelming majority of women who had smoked during pregnancy reported doing so in the first trimester. A small number of women reported starting to smoke in the second or third trimesters after abstaining in the first. This section analyses the factors associated with cessation of smoking by the mother in the second or third trimesters after reported smoking in the first or second. The analysis is based on the 17.6 per cent of women who smoked during their first or second trimesters; it estimates a model of subsequently quitting in the second or third trimesters using identical variables to those used in Table 2.1. Of these 1,632 women, there was full information (i.e. no missing responses) on 1,591 women and these were used in the analysis. Only 273 women quit smoking, which reduced the chance of finding significant relationships, compared to a larger sample. The results of this estimation are presented in Table 2.2.
Table 2.2: Unadjusted and adjusted odds of quitting smoking in the second or third trimesters for women who smoked in the first or second trimesters of pregnancy
Chapter 2 • MATERNAL SMOKING AND CESSATION DURING PREGNANCY
21
Growing Up in Ireland • MATERNAL HEALTH BEHAVIOURS AND CHILD GROWTH IN INFANCY
Wald Sig.Unadj. Odds
Sig.Adj.Odds
Sig.
Maternal Citizenship 18.32 ***
Irish REF. REF.
UK 0.92 n.s 1.16 n.s
EU12 2.38 *** 2.22 **
EU14 1.45 n.s 1.20 n.s
African 1.33 n.s 1.16 n.s
Far East 5.31 n.s 7.20 n.s
Other 2.21 n.s 1.50 n.s
Maternal Age 3.81 n.s
<25 1.25 n.s 1.52 n.s
25-29 1.15 n.s 1.19 n.s
30-34 REF. REF.
35-39 1.04 n.s 1.29 n.s
40+ 0.62 n.s 0.86 n.s
Number of Previous Children 41.9 ***
First Child REF. REF.
Second Child 0.54 *** 0.56 **
Third Child 0.39 *** 0.43 ***
Fourth+ Child 0.32 *** 0.50 *
Maternal Highest Education 46.04 ***
Lower 2nd 0.25 *** 0.33 ***
Higher 2nd 0.35 *** 0.38 ***
Post Secondary 0.53 *** 0.57 *
Degree or Professional Qualification REF. REF.
Household Social Class 8.48 n.s
Professional Managers REF. REF.
Managerial and Technical 0.78 n.s 0.95 n.s

Growing Up in Ireland • MATERNAL HEALTH BEHAVIOURS AND CHILD GROWTH IN INFANCY
22
Non-Manual 0.81 n.s 1.28 n.s
Skilled Manual 0.74 n.s 1.28 n.s
Semi & Unskilled 0.50 * 0.88 n.s
Unclassified 0.58 n.s 0.88 n.s
Household Income Quintile 16.99 ***
Lowest 0.47 ** 0.77 n.s
2nd 0.38 *** 0.52 n.s
3rd 0.41 ** 0.48 *
4th 0.69 n.s 0.66 n.s
Highest REF. REF.
Missing 0.62 n.s 0.92 n.s
Psychological Stress 7.48 n.s
A Great Deal 1.73 * 1.82 *
Some 1.57 * 1.60 *
Not Much 1.31 n.s 1.07 n.s
None at All REF. REF.
Alcohol Consumption 1.62 n.s
Average Units of Alcohol First Trimester 0.97 n.s 0.96 n.s
Other Smokers in Household 73.88 ***
None REF. REF.
1 0.27 *** 0.22 ***
2+ 0.44 ** 0.31 ***
Pregnancy Intentions 9.98 n.s
At that Time REF. REF.
Much Later 1.19 n.s 1.02 n.s
Somewhat Later 1.45 n.s 1.07 n.s
Earlier 0.76 n.s 0.49 n.s
Never any Intention to Become Pregnant 0.72 n.s 0.65 *
Other 0.89 n.s 0.77 n.sTreated for Depression, Anxiety or Nerves
2.8 n.s
No REF. REF.
Yes 0.74 n.s 0.80 n.s
Constant 1.01 n.s.
Significance Key: *** p<0.001 **p<0.01 *p<0.05 ns = not statistically significant
N Cases: 1591
Pseudo R2: 0.14
Table 2.2 shows that relatively few characteristics were statistically significantly associated with quitting behaviour for women initially smoking during pregnancy. Women from EU12 countries (those joining the EU after May 2003) were over 2.2 times more likely to quit. Women who had a previous birth were around 50 per cent less likely to quit. Similarly, women who had lower levels of education were less likely to quit. For example, women with a Leaving Certificate level of education were 62 per cent less likely to quit than women with a third-level qualification. Interestingly, the experience of higher levels of stress during pregnancy appears to be associated with an increase in the odds of quitting among women who smoked during pregnancy; the model suggests a positive relationship between level of stress and probability of quitting. It is possible that this stress is related to quitting smoking itself.
On the other hand, Table 2.2 shows that having others in the household who were smokers was associated with a reduction in the probability of quitting. As found in Table 2.1, the proportion of variation in quitting explained by the model is relatively low at 14 per cent, which suggests that the addition of other factors to the analysis may increase the amount of variation in quitting accounted for.
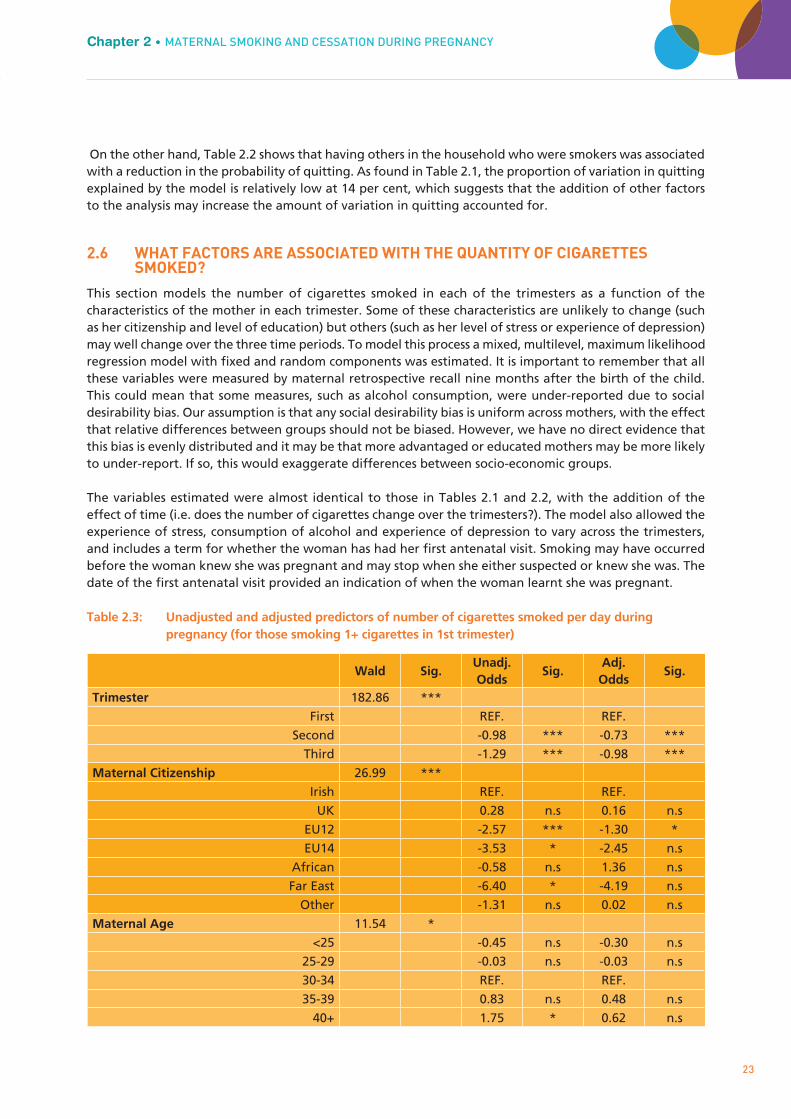
2.6 WHAT FACTORS ARE ASSOCIATED WITH THE QUANTITY OF CIGARETTES SMOKED?
This section models the number of cigarettes smoked in each of the trimesters as a function of the characteristics of the mother in each trimester. Some of these characteristics are unlikely to change (such as her citizenship and level of education) but others (such as her level of stress or experience of depression) may well change over the three time periods. To model this process a mixed, multilevel, maximum likelihood regression model with fixed and random components was estimated. It is important to remember that all these variables were measured by maternal retrospective recall nine months after the birth of the child. This could mean that some measures, such as alcohol consumption, were under-reported due to social desirability bias. Our assumption is that any social desirability bias is uniform across mothers, with the effect that relative differences between groups should not be biased. However, we have no direct evidence that this bias is evenly distributed and it may be that more advantaged or educated mothers may be more likely to under-report. If so, this would exaggerate differences between socio-economic groups.
The variables estimated were almost identical to those in Tables 2.1 and 2.2, with the addition of the effect of time (i.e. does the number of cigarettes change over the trimesters?). The model also allowed the experience of stress, consumption of alcohol and experience of depression to vary across the trimesters, and includes a term for whether the woman has had her first antenatal visit. Smoking may have occurred before the woman knew she was pregnant and may stop when she either suspected or knew she was. The date of the first antenatal visit provided an indication of when the woman learnt she was pregnant.
Table 2.3: Unadjusted and adjusted predictors of number of cigarettes smoked per day during pregnancy (for those smoking 1+ cigarettes in 1st trimester)
Chapter 2 • MATERNAL SMOKING AND CESSATION DURING PREGNANCYGrowing Up in Ireland • MATERNAL HEALTH BEHAVIOURS AND CHILD GROWTH IN INFANCY
23
Wald Sig.Unadj. Odds
Sig.Adj.Odds
Sig.
Trimester 182.86 ***
First REF. REF.
Second -0.98 *** -0.73 ***
Third -1.29 *** -0.98 ***
Maternal Citizenship 26.99 ***
Irish REF. REF.
UK 0.28 n.s 0.16 n.s
EU12 -2.57 *** -1.30 *
EU14 -3.53 * -2.45 n.s
African -0.58 n.s 1.36 n.s
Far East -6.40 * -4.19 n.s
Other -1.31 n.s 0.02 n.s
Maternal Age 11.54 *
<25 -0.45 n.s -0.30 n.s
25-29 -0.03 n.s -0.03 n.s
30-34 REF. REF.
35-39 0.83 n.s 0.48 n.s
40+ 1.75 * 0.62 n.s

Growing Up in Ireland • MATERNAL HEALTH BEHAVIOURS AND CHILD GROWTH IN INFANCY
24
Number of Previous Children 116.69 ***
First Child REF. REF.
Second Child 0.96 ** 0.10 n.s
Third Child 1.90 *** 0.47 n.s
Fourth+ Child 4.81 *** 2.47 ***
Maternal Highest Education 124.75 ***
Lower 2nd 4.89 *** 2.90 ***
Higher 2nd 2.20 *** 1.17 *
Post Secondary 1.44 ** 0.71 n.s
Degree or Professional Qualification REF. REF.
Household Social Class 58.84 ***
Professional Managers REF. REF.
Managerial and Technical -0.19 n.s -0.63 n.s
Non-Manual 0.32 n.s -0.39 n.s
Skilled Manual 1.89 * 1.02 n.s
Semi & Unskilled 1.32 n.s 0.20 n.s
Unclassified 2.88 *** 0.84 n.s
Household Income Quintile 64.09 ***
Lowest 4.19 *** 1.88 *
2nd 3.43 *** 1.66 *
3rd 2.42 *** 1.32 n.s
4th 1.49 n.s 0.86 n.s
Highest REF. REF.
Missing 1.95 * 1.12 ***Psychological Stress This Trimester (time-varying)
1.88 n.s
No REF. REF.
Yes 0.19 n.s 0.18 n.s
Had Antenatal Visit 149.65 ***
No REF. REF.
Yes -1.06 *** 0.02 n.sAlcohol Consumption 34.64 ***
Average Units of Alcohol This Trimester
(time-varying) 0.18 *** 0.10 ***
Other Smokers in Household 385.71 ***
None REF. REF.
1 -3.34 *** -2.36 ***
2+ -7.10 *** -5.50 ***
Pregnancy Intentions 31.46 ***
At that Time REF. REF.
Much Later 0.07 n.s 0.50 n.s
Somewhat Later -1.22 * -0.47 n.s
Earlier -0.24 n.s -0.65 n.s
Never any Intention to Become Pregnant 1.69 *** 0.68 n.s
Other 0.80 n.s 0.62 n.sTreated for Depression, Anxiety or Nerves This Trimester
25.7 ***
No REF. REF.
Yes 1.29 *** 0.27 n.s
Constant 6.65 *** 6.63 ***
Significance Key: *** p<0.001 **p<0.01 *p<0.05 ns = not statistically significant
N Observations: 4,774
N Individuals: 1,592

The results of this model are shown in Table 2.3. On average, mothers who smoked consumed 9.2 cigarettes a day in the first trimester, reducing to 8.2 in the second and 7.9 in the third, suggesting a modest tendency to cut down over time during pregnancy (as shown in the effects for trimester). The model results show that mothers from EU12 countries were significantly more likely to reduce their level of consumption relative to other categories of citizenship, if they continued to smoke during pregnancy. These women were also more likely to quit, as shown in Table 2.2. In contrast, women who had previously had children were more likely to report a higher level of consumption as well as a lower probability of quitting. For example, women who had three or more children previously report smoking 2.5 more cigarettes per day on average (over all three trimesters) than women for whom this is their first child. Table 2.3 confirms international evidence that women from lower income groups smoke a higher number of cigarettes. Women in the lowest two income quintiles smoked almost two cigarettes per day more than other income groups, adjusting for all the factors in the table. The level of alcohol consumed was strongly linked to level of smoking. For each unit increase in alcohol consumption, the number of cigarettes smoked increased by one over a 10-day period. Lastly, the number of other smokers in the household (other than the mother) was also related to cigarette consumption. Having another person smoking in the household was associated with a higher number of cigarettes smoked in the first trimester (compared to women with no other smoker in the household), but their consumption fell more quickly over the pregnancy (compared to those where no-one else was smoking) so that they had a lower consumption in the second and third trimesters. Women with other smokers in the household thus smoked more cigarettes (on average) in the first trimester, but the number smoked fell quicker than for women with no other smokers in the household.
The differential effect of the number of other smokers in the household with time was one example of an interaction effect, where the effect of one variable, such as number of smokers in the household, varies with the level of another variable, such as time. Another was the effect of maternal education with time. Tests showed that not only was maternal education strongly associated with the average number of cigarettes smoked but that there was significant variation in the pattern of change over the three trimesters. The variation across maternal education groups in the number of cigarettes smoked by trimester, adjusting for all of the factors in Table 2.3, is shown in Figure 2.3. This shows that the higher the level of education of the mother, the steeper the fall in cigarettes smoked on average between the first and second trimesters.
Figure 2.3: Pattern of smoking during pregnancy by mother’s educational level (for those smoking in the first trimester)
Chapter 2 • MATERNAL SMOKING AND CESSATION DURING PREGNANCY
25
Growing Up in Ireland • MATERNAL HEALTH BEHAVIOURS AND CHILD GROWTH IN INFANCY
6
7
8
9
10
11
12
1st Trimester 2nd Trimester 3rd Trimester
Nu
mb
er C
igar
ette
s Sm
oke
d P
er D
ay
Lower 2nd
Higher 2nd
Post Secondary
Degree or Above

Whereas mothers with lower secondary education reduced their consumption of cigarettes by 6 per cent between the first and third trimesters, this reduction was 11 per cent for those with upper secondary education, 13 per cent for those with post-secondary and 17 per cent for those with third-level education. This pattern of reduction for women with third-level education was also significantly steeper between the first and second trimesters, compared to other groups.
2.7 SUMMARY
Maternal smoking during pregnancy is widely acknowledged to be the primary determinant of low birth-weight in developed nations, and an increasing literature suggests that it is also associated with longer-term physical and mental development of the child. Comparisons of prenatal smoking between the Child and Infant Cohorts of Growing Up in Ireland suggest that the proportion of mothers smoking during pregnancy has decreased by almost 35 per cent since the late 1990s, yet almost 18 per cent of mothers in the Infant Cohort still reported smoking at some stage during their pregnancy, and almost 13 per cent reported smoking the whole way through. In the general population smoking was far more common among individuals with lower income, education and social class; this pattern is also true during pregnancy.
The analyses in this chapter also suggest other, more specific factors associated with smoking during pregnancy. The probability of smoking is strongly related to the woman’s experience of psychological stress; higher levels of perceived stress increase the risk of smoking. Being treated for depression or anxiety and higher levels of alcohol consumption also increase the odds of smoking, as do weaker pregnancy intention and having a partner in the household who smoked. These patterns strongly suggest, as argued in the international literature, that smoking during pregnancy is part of a constellation of psychosocial problems that are linked to, but not determined by, social disadvantage. However, these analyses explain only one-fifth of the variation in smoking so it is likely that other, unmeasured factors were also influencing smoking rates.
The analyses of the factors associated with quitting smoking revealed fewer statistically significant relationships. This may be partly because so few women quit smoking, thus lowering the statistical power available: just 2.7 per cent of the sample or 16 per cent of all women who smoked during pregnancy successfully quit between the first and third trimesters. This rate is similar to that found in the general population and is evidence of the difficulty of giving up. However, some patterns did emerge. Women who had previously had children were less likely to quit, as were those women with lower levels of education and women who lived with a partner. This underlines the importance of considering smoking behaviour within the context of the individual’s life.
The analysis of the number of cigarettes smoked showed that women tended to cut down consumption over the course of the pregnancy, but the fall in consumption was more pronounced among women with higher levels of education. Women with lower levels of education or income and more previous births smoked a higher number of cigarettes, as did those who consumed more alcohol. The implications of these findings for policy will be drawn out in Chapter 6.
Growing Up in Ireland • MATERNAL HEALTH BEHAVIOURS AND CHILD GROWTH IN INFANCY
26

Growing Up in Ireland • MATERNAL HEALTH BEHAVIOURS AND CHILD GROWTH IN INFANCY
27
Chapter 3MATERNAL CONSUMPTION OF
ALCOHOL DURING PREGNANCY

28
Growing Up in Ireland • MATERNAL HEALTH BEHAVIOURS AND CHILD GROWTH IN INFANCY
3.1 INTRODUCTION
The most recent advice from the Department of Health’s Chief Medical Officer is that women should refrain from consumption of alcohol during pregnancy because of the developmental risks for the child. Although there is evidence that high levels of alcohol consumption during pregnancy are associated with child developmental problems, the evidence is far from clear on the risks of light alcohol consumption. This ambiguity is one reason why studies of the distribution of alcohol consumption during pregnancy across the population of pregnant mothers have repeatedly shown that the pattern is complex and significantly different to that found for tobacco.
Whereas smoking during pregnancy tends to be found largely among lower socio-economic groups and increases in prevalence with social and psychological problems, the opposite has been found for alcohol both in the US and UK. For example, Perreira and Cortes (2006), who examined alcohol and tobacco use among different ethnic groups in the US, found that the probability of alcohol consumption increased with maternal age and education among all ethnic groups. Kelly and colleagues (2009) found a similar profile in the UK. However, although socio-economically advantaged mothers were less likely to abstain, they were more likely to drink moderately if they did consume. This tendency to ‘light’ consumption among more advantaged mothers may have contributed to the finding in the Millennium Cohort Study (MCS) by Kelly et al (2009) that light consumption was associated with more positive child development. The literature on alcohol consumption during pregnancy is less developed on the role of other factors such as maternal depression, psychological stress and pregnancy intentions in shaping drinking during pregnancy.
The Primary Caregivers (over 98 per cent of whom were the child’s mother) in the Infant Cohort survey were asked a set of questions about consumption of alcohol during the pregnancy, as part of the supplementary or sensitive questionnaire. Women were first asked [D]id you consume alcohol during your pregnancy?; if they answered in the affirmative, they were asked whether they did so in each trimester of the pregnancy and how much on average they drank per week. Responses were coded into pints of beer/cider, glasses of wine, measures of spirits and bottles of ‘alcopops’. These responses were then transformed into total units of alcohol by assigning each glass of wine or measure of spirits as a unit of alcohol and a pint of beer/cider or ‘alcopop’ as two units, and then summing the total per week across all drinks. There is evidence for Ireland (Hope, 2009) to suggest that this may be a conservative estimate of consumption (even if respondents are accurately recalling consumption) since a pint of many beers and ciders contained substantially more than two standard units of alcohol. As well as the influence of social desirability, it is also possible that women perceived the question to be asking only about the consumption of alcohol after their pregnancy had been confirmed. If so, this would bias positive responses downward. However, the patterns of consumption found would militate against this assumption. To facilitate comparisons to results from the Millennium Cohort Study, light consumption was defined as 1-2 units per week, moderate as 3-6 units per week and heavy consumption as 7 or more units per week.
3.2 HOW MANY MOTHERS DRANK ALCOHOL DURING PREGNANCY?
Results from the Infant Cohort of Growing Up in Ireland showed that 19.4 per cent of mothers drank at least one alcoholic drink during their pregnancy. Figure 3.1 shows that the pattern of consumption was not even across trimesters of pregnancy: 9.7 per cent of women reporting drinking alcohol in the first trimester, rising to 13.6 per cent and 13.3 per cent in the second and third trimesters respectively. This pattern of a lower proportion of women drinking in the first relative to later trimesters may reflect the fact that many women are often both physically tired and nauseous in the first trimester of their pregnancy. It is also possible that women perceive the risks to the child to be greater in the first trimester.

Growing Up in Ireland • MATERNAL HEALTH BEHAVIOURS AND CHILD GROWTH IN INFANCY
29
Chapter 3 • MATERNAL CONSUMPTION OF ALCOHOL DURING PREGNANCY
The overall prevalence of consumption among mothers in the Infant Cohort was significantly lower than
found for mothers in the Millennium Cohort Study in the UK, which found that 37 per cent of mothers reported consuming alcohol during pregnancy when interviewed nine months after the birth (Kelly et al, 2009).
Figure 3.1: Distribution of level of alcohol consumption among mothers by trimester
Note: Given the small proportion of ‘heavy’ consumption, the vertical scale has been truncated to make results more visible.
Figure 3.1 also shows that the composition of light, moderate and heavy drinking in the sample varied over the three trimesters. In the first trimester, light drinkers composed 6 per cent of the sample but increased to just over 10 per cent in the second and third, averaging 15 per cent overall. Once again, this pattern was significantly different from the Millennium Cohort Study where 21 per cent were light drinkers (as reported when the child was nine months of age) (Kelly et al, 2009). Thus, while mothers in Growing Up in Ireland were more likely to report abstaining than their UK counterparts, if they drank, they drank more on average. Figure 3.2: Average weekly units of alcohol consumption among mothers by trimester for those consuming 1+ in each trimester
Note: Black vertical bars represent the 95 per cent confidence interval of the estimate.
90.3
86.4 86.7
81.6
6.0
10.1 10.1
15.0
2.5 2.7 2.6 2.8
1.2 0.9 0.7 0.7
80%
82%
84%
86%
88%
90%
92%
94%
96%
98%
100%
First Second Third All
Pro
po
rtio
n
Trimester
Heavy
Moderate
Light
None
2.00
2.20
2.40
2.60
2.80
3.00
3.20
3.40
3.60
3.80
First Second Third
Mea
n U
nit
s o
f A
lco
ho
l
Trimester

30
Growing Up in Ireland • MATERNAL HEALTH BEHAVIOURS AND CHILD GROWTH IN INFANCY
Using a simple mean for those drinking one or more units in each trimester, rather than the categories used in Figure 3.1, Figure 3.2 shows that the number of units of alcohol consumed on average was higher in the first trimester compared to later trimesters. Women who reported any consumption in the first trimester reported 3.3 units of alcohol on average, falling to 2.6 and then 2.4 in the second and third trimesters. This pattern would seem to militate against the interpretation above, that reduced consumption is influenced by tiredness and nausea; it may instead reflect two different processes. As shown by Figure 3.1, fewer women reported consuming any alcohol in the first trimester than in the second or third, but Figure 3.2 shows that those who did consume alcohol drank more. This pattern may reflect the date at which the pregnancy was confirmed. Signs of pregnancy are often unclear to women and this can mean that their pre-pregnancy behaviours continue some way into pregnancy (Floyd, Decoufle & Hungerford, 1999). Although 84 per cent of women had had their pregnancy confirmed by the 12th week of their pregnancy, only a third had done so by the 6th week (35 per cent). This means that two-thirds of women may not have recognised the signs of their pregnancy before this and maintained their pre-pregnancy pattern of alcohol consumption. Some evidence of this is given in Figure 3.3, which gives the odds of consuming alcohol in the first trimester by the date of the first antenatal appointment. This shows that women who had their initial antenatal appointment in the second trimester were 37 per cent more likely to drink alcohol in the first trimester than women who had their first appointment in the first trimester. Those who did not have the pregnancy confirmed until the third trimester were 240 per cent more likely to consume alcohol in the first trimester than women who had their first antenatal appointment in the first trimester.
Growing Up in Ireland data shows that women from low income groups were more likely to have their first antenatal visits later, but, even after adjusting for income, social class, education and other factors, women who had their initial antenatal visit in the second and third trimesters had significantly higher alcohol consumption. The wide error bars in Figure 3.3 reflect the relatively small numbers of women who did not have an antenatal visit until the third trimester.
Figure 3.3: Adjusted odds ratio of consuming alcohol in first trimester by trimester of first antenatal visit (adjusted for variables in Table 3.1)
Note: Black bars represent the 95 per cent confidence interval.
This evidence would suggest that later recognition of the pregnancy significantly contributed to the probability of drinking during pregnancy. Once the pregnancy had been confirmed, the probability of consuming alcohol fell significantly, as did the level of consumption.
0
0.5
1
1.5
2
2.5
3
3.5
4
4.5
5
1st Trimester 2nd Trimester 3rd Trimester
Od
ds
of
Co
nsu
min
g A
lco
ho
l
Trimester Pregnancy Confirmed

Growing Up in Ireland • MATERNAL HEALTH BEHAVIOURS AND CHILD GROWTH IN INFANCY
1 The model adopted is a logistic regression which estimates the (log) probability of drinking during pregnancy as a function of a set of predictor variables. 31
Chapter 3 • MATERNAL CONSUMPTION OF ALCOHOL DURING PREGNANCY
3.3 WHAT ARE THE INDEPENDENT EFFECTS OF DIFFERENT FACTORS ON THE PROBABILITY OF CONSUMING ALCOHOL DURING PREGNANCY?
In this section, a multivariate approach is used to model the probability of consuming alcohol at some point during pregnancy. Note that this section does not analyse the quantity of alcohol consumed, which as already shown may follow a different pattern.1 The predictor variables included are almost identical to those used in the analysis of cigarette consumption in the previous chapter:
• Citizenship• Age• Numberofpreviousbirths• Highesteducationallevel• Householdsocialclass• Householdincomequintile• Experienceofpsychologicalstress• Cigaretteconsumption• Othersmokersinthehousehold• Pregnancyintentions• Beingtreatedfordepressionoranxiety• Experiencingpersistentnauseaandvomiting
As discussed in the last chapter, consumption of alcohol and cigarettes were closely associated. This analysis includes the number of cigarettes smoked in the first trimester to assess its association with the probability of alcohol consumption. It is likely that the experience of persistent nausea and vomiting during pregnancy will reduce the probability of drinking, and so an indicator of this was also entered into the model.
Table 3.1: Unadjusted and adjusted odds of predictors of consuming any alcohol during pregnancy
F Sig.Unadj. Odds
Sig.Adj.Odds
Sig.
Maternal Citizenship 17.54 *
Irish Ref. Ref.
UK 0.98 n.s 0.93 n.s
EU12 0.24 *** 0.34 ***
EU14 0.49 * 0.45 *
African 0.52 n.s 0.60 n.s
Far East 0.23 *** 0.24 **
Other 0.29 *** 0.31 ***
Maternal Age 25.63 ***
<25 0.53 *** 0.69 *
25-29 0.73 *** 0.94 n.s
30-34 Ref. Ref.
35-39 1.42 *** 1.33 ***
40+ 1.14 n.s 1.15 n.s
Number of Previous Children 6.32 ***
First Child Ref. Ref.
Second Child 1.25 *** 1.24 **
Third Child 1.36 *** 1.36 ***
Fourth+ Child 1.14 n.s 1.26 n.s

32
Growing Up in Ireland • MATERNAL HEALTH BEHAVIOURS AND CHILD GROWTH IN INFANCY
Maternal Highest Education 40.24 ***
Lower 2nd 0.43 *** 0.46 ***
Higher 2nd 0.49 *** 0.61 ***
Post Secondary 0.68 *** 0.78 ***
Degree or Professional Qualification Ref. Ref.
Household Social Class 28.82 ***
Professional Workers Ref. Ref.
Managerial and Technical 0.74 *** 0.85 *
Non-Manual 0.51 *** 0.77 *
Skilled Manual 0.37 *** 0.64 ***
Semi & Unskilled 0.40 *** 0.75 n.s
Unclassified 0.45 *** 0.93 n.s
Household Income Quintile 28.39 ***
Lowest 0.36 *** 0.55 ***
2nd 0.44 *** 0.63 ***
3rd 0.59 *** 0.75 **
4th 0.65 *** 0.76 ***
Highest Ref. Ref.
Missing 0.47 *** 0.64 ***
Psychological Stress This Trimester 20.48 ***
A Great Deal 1.77 *** 1.60 ***
Some 1.86 *** 1.61 ***
Not Much 1.64 *** 1.49 ***
None at All Ref. Ref.
Consumption of Cigarettes 13.47 ***
Average No. of Cigarettes This Trimester 1.03 *** 1.05 ***
Other Smokers in Household 3.51 *
None Ref. Ref.
1 0.83 * 0.93 n.s
2+ 0.83 n.s 1.46 n.s
Pregnancy Intentions 1.77 n.s
At that Time Ref. Ref.
Much Later 1.06 n.s 1.42 **
Somewhat Later 1.19 n.s 1.32 **
Earlier 1.09 n.s 0.98 n.s
Never any Intention to Become Pregnant 0.86 n.s 1.18 n.s
Other 0.72 n.s 0.92 n.sTreated for Depression, Anxiety or Nerves
13.29 ***
No Ref. Ref.
Yes 1.40 *** 1.32 **
Experienced Persistent Nausea and Vomiting 13.43 ***
No Ref. Ref.
Yes 0.74 *** 0.73 ***
Constant 0.31 ***
Significance Key: *** p<0.001 **p<0.01 *p<0.05 ns = not statistically significant
N Cases: 10,533
Pseudo R2: 0.068

Growing Up in Ireland • MATERNAL HEALTH BEHAVIOURS AND CHILD GROWTH IN INFANCY
33
Chapter 3 • MATERNAL CONSUMPTION OF ALCOHOL DURING PREGNANCY
Table 3.1 gives the results of this analysis. Almost all of the variables in the table had a significant relationship with the probability of consuming alcohol during pregnancy before adjustment, except for the woman’s pregnancy intentions (i.e. whether she intended to have this child now, later or not at all) and the presence of others smoking in the household. All non-Irish citizenship groups had odds ratios of less than one, suggesting that they had a lower probability of drinking alcohol during pregnancy than women with Irish citizenship, although only the odds for EU12, EU14, Far East and other groups were statistically significant after adjustment. Women from the Far East had the lowest odds of consuming, with a 76 per cent reduction. Higher maternal age was associated with a higher level of consumption. Women aged under 25 were 31 per cent less likely to report having an alcoholic drink compared to women aged 30 to 34, whereas women aged 35 to 39 were 33 per cent more likely.
The higher the number of previous births that the woman had experienced, the higher the odds of consuming alcohol, although the difference was not significant for women where the Study Child was their fourth or higher birth.
The results for maternal education, income and social class confirmed the international pattern that higher levels of advantage are associated with a higher probability of drinking alcohol. After adjustment, women with lower secondary qualifications were 57 per cent less likely to consume alcohol than women with a degree, and women in the lowest income group were 64 per cent less likely to do so than women in the highest income quintile.
The last chapter showed that psychological stress contributed to the probability of smoking; this appears to be the case for alcohol as well. Women reporting ‘a great deal’ of stress were 60 per cent more likely to consume alcohol. Similarly, women who had been diagnosed as depressed or anxious were 32 per cent more likely to consume compared to women who had not, adjusting for other factors. Each cigarette smoked was associated with a 5 per cent increase in the odds of drinking alcohol. Lastly, experiencing persistent nausea and vomiting reduces the odds of drinking by 27 per cent. However, it is important to note that, although this analysis found a number of significant associations between different factors and consumption of alcohol, the model explained only around 7 per cent of variation overall. As suggested in this last chapter, the proportion of variance explained could be increased by examining whether the effect of one variable varied by the value of another (e.g. the effect of increasing maternal age may vary by level of maternal education), but is also likely to reflect the absence of other important factors from our analysis.
3.4 WHAT ARE THE INDEPENDENT EFFECTS OF DIFFERENT FACTORS ON THE NUMBER OF UNITS OF ALCOHOL CONSUMED?
Whereas the pattern of cigarette smoking was of decreasing prevalence over the course of the pregnancy, the opposite was true for the consumption of alcohol; a higher proportion of women consumed in the second and third trimesters of pregnancy than in the first. Only 3.7 per cent of women stopped drinking alcohol during their pregnancy. On the other hand, the average consumption of alcohol in the first trimester for those women who were drinking was higher than in the second and third trimesters. Previous analyses have shown that social advantage was correlated with lower levels of abstinence, but is the same true for the amount consumed once adjustment is made for the woman’s sociodemographic characteristics and other factors that might influence this pattern? This section estimates a mixed latent growth model of the number of units of alcohol consumed by mothers who consumed one or more units during their pregnancy, using maximum likelihood estimation. As in the last chapter, this model examines the effects of different characteristics on the average across all three trimesters, plus change in these effects over the course of the pregnancy. The results for this model are shown in Table 3.2.

34
Growing Up in Ireland • MATERNAL HEALTH BEHAVIOURS AND CHILD GROWTH IN INFANCY
Table 3.2: Unadjusted and adjusted predictors of the number of units of alcohol consumed on average per week during pregnancy (for those drinking 1+ units during pregnancy)
Wald Sig.Unadj. Odds
Sig.Adj.Odds
Sig.
Fixed Model Components
Trimester 2.66 n.s
First REF. REF.
Second 0.07 n.s -0.01 n.s
Third -0.03 n.s -0.14 n.s
Maternal Citizenship 5.36 n.s
Irish REF. REF.
UK -0.55 n.s -0.46 n.s
EU12 -0.47 n.s -0.82 *
EU14 -0.81 n.s -0.67 n.s
African 0.21 n.s 0.15 n.s
Far East 0.41 n.s 0.70 n.s
Other -0.10 n.s -0.20 n.s
Maternal Age 79.94 ***
<25 2.01 *** 0.25 n.s
25-29 0.40 * -0.06 n.s
30-34 REF. REF.
35-39 0.03 n.s 0.08 n.s
40+ 0.16 n.s 0.02 n.s
Number of Previous Children 22.63 ***
First Child REF. REF.
Second Child 0.03 n.s 0.07 n.s
Third Child 0.05 n.s -0.08 n.s
Fourth+ Child 0.89 *** 0.09 n.s
Maternal Highest Education 198.43 ***
Lower 2nd 2.80 *** 0.97 ***
Higher 2nd 0.96 *** 0.10 n.s
Post Secondary 0.39 ** 0.04 n.s
Degree or Professional Qualification REF. REF.
Household Social Class 215.52 ***
Professional Workers REF. REF.
Managerial and Technical 0.08 n.s 0.05 n.s
Non-Manual 0.45 * 0.13 n.s
Skilled Manual 1.25 *** 0.50 *
Semi & Unskilled 1.32 *** 0.39 n.s
Unclassified 2.76 *** 0.92 ***
Household Income Quintile 139.3 ***
Lowest 1.98 *** 0.37 n.s
2nd 1.08 *** 0.22 n.s
3rd 0.30 n.s -0.01 n.s
4th 0.15 n.s 0.02 n.s
Highest REF. REF.
Missing 0.60 * 0.20 ***

Growing Up in Ireland • MATERNAL HEALTH BEHAVIOURS AND CHILD GROWTH IN INFANCY
35
Chapter 3 • MATERNAL CONSUMPTION OF ALCOHOL DURING PREGNANCY
Table 3.2 shows that maternal citizenship appeared to play a minor role in the consumption of alcohol; only EU12 women (that is, women from states that joined the EU after May 2003 such as Poland and the Baltic States) are statistically different from the Irish population in drinking less alcohol, on average, over pregnancy.
The model confirmed the pattern for maternal highest education described earlier in the chapter. More-educated mothers drank fewer units overall during pregnancy (although they were less likely to abstain completely). However, only the lowest educational level (lower secondary) remained significantly different from women with third-level qualifications after adjustment for other factors. This overall pattern obscured
Psychological Stress This Trimester 3.0 n.s
No REF. REF.
Yes 0.14 n.s 0.07 n.s
Had Antenatal Visit 0.06 n.s
No REF. REF.
Yes 0.01 n.s 0.16 n.s
Cigarette Consumption 315.91 ***Average Number Cigarettes this
Trimester 0.19 *** 0.13 ***
Other Smokers in Household 27.4 ***
None REF. REF.
1 0.31 * -0.24 n.s
2+ 1.77 *** 0.00 n.s
Pregnancy Intentions 125.56 ***
At that Time REF. REF.
Much Later 0.76 *** 0.25 n.s
Somewhat Later -0.17 n.s -0.18 n.s
Earlier -0.12 n.s 0.02 n.s
Never any Intention to Become Pregnant 2.11 *** 1.06 ***
Other 1.29 ** 0.57 n.sTreated for Depression, Anxiety or Nerves
9.17 **
No REF. REF.
Yes 0.48 ** 0.45 **
Experienced Persistent Nausea and Vomiting 1.41 n.s
No REF. REF.
Yes -0.19 n.s -0.30 *
Constant 1.02 ***
Random Model Components
Slope Trimester 0.32 ***
Intercept Trimester 1.88 ***
N Cases: 5,943
N Individuals: 1,981
Significance Key: *** p<0.001 **p<0.01 *p<0.05 ns = not statistically significant
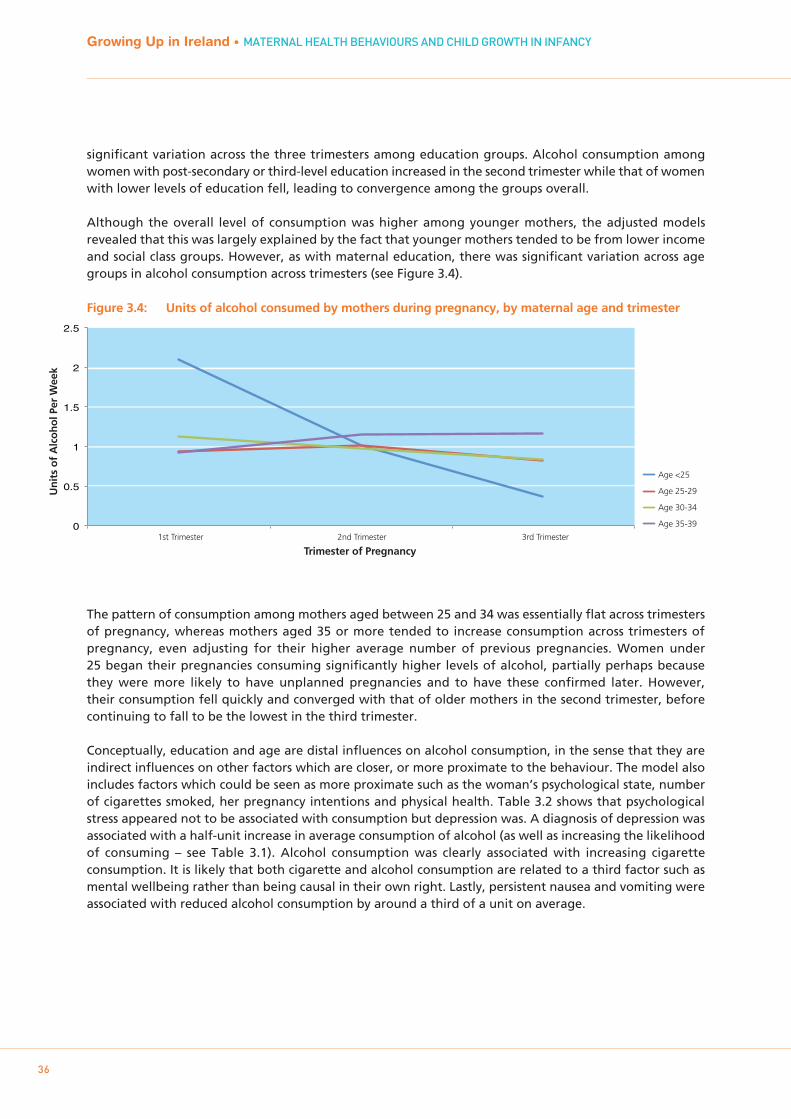
significant variation across the three trimesters among education groups. Alcohol consumption among women with post-secondary or third-level education increased in the second trimester while that of women with lower levels of education fell, leading to convergence among the groups overall.
Although the overall level of consumption was higher among younger mothers, the adjusted models revealed that this was largely explained by the fact that younger mothers tended to be from lower income and social class groups. However, as with maternal education, there was significant variation across age groups in alcohol consumption across trimesters (see Figure 3.4). Figure 3.4: Units of alcohol consumed by mothers during pregnancy, by maternal age and trimester
The pattern of consumption among mothers aged between 25 and 34 was essentially flat across trimesters of pregnancy, whereas mothers aged 35 or more tended to increase consumption across trimesters of pregnancy, even adjusting for their higher average number of previous pregnancies. Women under 25 began their pregnancies consuming significantly higher levels of alcohol, partially perhaps because they were more likely to have unplanned pregnancies and to have these confirmed later. However, their consumption fell quickly and converged with that of older mothers in the second trimester, before continuing to fall to be the lowest in the third trimester.
Conceptually, education and age are distal influences on alcohol consumption, in the sense that they are indirect influences on other factors which are closer, or more proximate to the behaviour. The model also includes factors which could be seen as more proximate such as the woman’s psychological state, number of cigarettes smoked, her pregnancy intentions and physical health. Table 3.2 shows that psychological stress appeared not to be associated with consumption but depression was. A diagnosis of depression was associated with a half-unit increase in average consumption of alcohol (as well as increasing the likelihood of consuming – see Table 3.1). Alcohol consumption was clearly associated with increasing cigarette consumption. It is likely that both cigarette and alcohol consumption are related to a third factor such as mental wellbeing rather than being causal in their own right. Lastly, persistent nausea and vomiting were associated with reduced alcohol consumption by around a third of a unit on average.
Growing Up in Ireland • MATERNAL HEALTH BEHAVIOURS AND CHILD GROWTH IN INFANCY
36
0
0.5
1
1.5
2
2.5
1st Trimester 2nd Trimester 3rd Trimester
Un
its
of
Alc
oh
ol P
er W
eek
Trimester of Pregnancy
Age <25
Age 25-29
Age 30-34
Age 35-39

Growing Up in Ireland • MATERNAL HEALTH BEHAVIOURS AND CHILD GROWTH IN INFANCY
3.5 SUMMARY
The analyses in this chapter confirmed that the pattern of prenatal alcohol consumption in Ireland is very similar to that found in the UK and US. While abstinence from drinking was less likely among older women with higher levels of education, social class and income, their pattern of consumption tended to be more moderate than that of younger women with lower levels of income and education. Compared to the UK, Irish women were significantly less likely to report drinking during pregnancy, but, if they did consume, they were likely to drink more heavily than their UK counterparts.
However, models of the development of consumption over the trimesters of pregnancy showed significant differences in behaviour between groups of women. Whereas younger and less educated women tended to drink more in early pregnancy, their consumption fell quickly in the second or third trimesters, whereas consumption among more advantaged women often increased over the pregnancy. Evidence suggests that this pattern may partially reflect the later date of first antenatal visit among younger and less educated women (suggesting later confirmation of pregnancy). Having had children previously was also associated with a higher prevalence of drinking, suggesting that the perception of risk falls with experience.Although light drinking was associated with social advantage, these results show that women who are stressed, depressed and smoking were more likely to consume alcohol and to consume higher quantities during pregnancy. The implications of these findings for policy development are discussed in the final chapter.
37
Chapter 3 • MATERNAL CONSUMPTION OF ALCOHOL DURING PREGNANCY

Growing Up in Ireland • MATERNAL HEALTH BEHAVIOURS AND CHILD GROWTH IN INFANCY
38

Growing Up in Ireland • MATERNAL HEALTH BEHAVIOURS AND CHILD GROWTH IN INFANCY
39
BREASTFEEDING BEHAVIOURS OF MOTHERS
Chapter 4
4.1 INTRODUCTION
Ireland has one of the lowest breastfeeding rates in the world and easily the lowest rate in Europe (EURO-PERISTAT, 2004), in spite of the fact that Ireland has had a Breastfeeding Strategy since 2005 and has collaborated in the WHO Baby-Friendly Hospital Initiative since 1998 (Department of Health and Children, 2005). The most recent figures from the National Perinatal Reporting System (NPRS), representing births that took place in 2011, show that only 55.3 per cent of women leaving Irish hospitals following birth were breastfeeding their child, and 47 per cent exclusively (Health Information and Research Division, ESRI, 2011). This proportion has increased over time (see below) but Irish breastfeeding rates are still much lower than the UK (76 per cent) and Sweden (over 90 per cent) (EURO-PERISTAT, 2004). The absence of a system to monitor breastfeeding in Ireland means that there are no national figures on the pattern of breastfeeding after discharge from hospital.2 Growing Up in Ireland data include detailed information on patterns of breastfeeding, including data on the duration of breastfeeding. These data represent a landmark in the study of breastfeeding in Ireland and should contribute to the development of policies in the area.
Policy development depends, in large part, on improving understanding of the factors that influence patterns of breastfeeding in Ireland and finding those that are amenable to policy intervention. Studies from Ireland have consistently shown that older mothers (Fitzpatrick, Fitzpatrick & Darling, 1994) and those from more advantaged socio-economic groups are more likely to initiate breastfeeding (McCrory & Layte, 2011). Some regional research from Ireland suggests that mothers who worked prior to their pregnancy are more likely to initiate breastfeeding, although this may simply reflect the higher probability of being in employment among women with higher levels of education and from higher social class groups (Sayers et al, 1995).
Child and birth characteristics may also be important; some research based on Irish data (Tarrant et al, 2010) shows that the higher the number of previous children, the lower the likelihood of breastfeeding. Studies suggest that children born by caesarean section are significantly less likely to be breastfed than children born vaginally (Perez-Escamilla, Maulen-Radovan & Dewey, 1996; Rowe-Murray & Fisher, 2002). Although research has identified the correlation between caesarean section and lower rates of breastfeeding, the underlying mechanism is opaque. The effect may stem from the longer separation of mother and infant shortly after birth or the limiting effects on the mother’s ability to nurse following her surgery, although inadequate adjustment for confounding factors may also explain the relationship.
Several studies based on Irish data have provided evidence that intention to breastfeed is influenced by attitudes and beliefs around its social acceptability. As long ago as 1954, Curtain (Curtain, 1954) presented evidence that negative maternal attitudes toward breastfeeding were the main impediment to initiation. More recent Irish research has shown that 31 per cent of mothers choosing not to breastfeed stated that this was for reasons of embarrassment (Loh et al, 1997). Tarrant et al (2010) presented evidence that 50 per cent of the mothers in their study expressed embarrassment around breastfeeding and that those not embarrassed were 2.3 times more likely to initiate breastfeeding. Tarrant and Kearney (Tarrant & Kearney, 2008) have argued that these cultural barriers to breastfeeding in Ireland are likely to be compounded by low exposure to breastfeeding among the younger generation. They show evidence that, where the maternal grandmother was encouraging of breastfeeding, this increased the probability of initiation by 340 per cent in fully adjusted models (Tarrant et al, 2010).
Maternal mental health may also play a role. Some mothers experience postpartum depression, and research consistently shows a negative relationship between maternal depression after birth and both the probability of and duration of breastfeeding (Henderson et al, 2003). However, research is unclear as to the causal direction; some indicates that breastfeeding may have a protective effect against depression (Jones, McFall & Diego, 2004).
Growing Up in Ireland • MATERNAL HEALTH BEHAVIOURS AND CHILD GROWTH IN INFANCY
402 There have been two previous national breastfeeding studies, in 1982 and 1986 (McSweeney & Kevany, 1982; McSweeney, 1986) but
none in recent years.

Evidence suggests that breastfeeding initiation may also be influenced by the institutional environment experienced by the woman. Research using the Millennium Cohort Study (MCS) from the UK, for instance, showed that children born in hospitals accredited under the WHO’s Baby-Friendly Hospital Initiative were more likely to initiate breastfeeding and to be breastfeeding at discharge from hospital following the birth (Bartington et al, 2006). However, the research also showed that there was no difference in breastfeeding rates a month after discharge, suggesting that the advantage gained in this earlier period was not sustained.
This chapter examines the overall patterning of breastfeeding in Ireland before analysing the association of different factors with both the prevalence and duration of breastfeeding, while adjusting for other factors.
4.2 BREASTFEEDING TRENDS IN IRELAND
Current understanding of breastfeeding trends in Ireland is based on data from the National Perinatal Reporting System (NPRS) which collects and processes data generated at the birth of a child. Births are registered and notified on a standard birth notification form (BNF), completed by the hospital or the attending mid-wife. The NPRS system records whether the child was being breastfed at discharge from hospital and whether this was exclusive or complementary. Figure 4.1 gives the proportion of children experiencing any breastfeeding at discharge from 2000 to 2009; it shows a general upward trend, with ‘any breastfeeding’ increasing from 38 to 46 per cent over that decade.
Figure 4.1: Proportion of children being breastfed (any breastfeeding) at discharge from hospital 2000-2009
Source: Health Information and Research Division, ESRI, 2011: Table 2.1, p10
Given the evidence on the benefits of breastfeeding discussed above, the increase in breastfeeding over the period is a welcome development. However, there is evidence that some of this increase may be due to migration into Ireland. The accession of new member states into the EU from 2003 led to an increase in the proportion of births to non-Irish mothers, from 16.5 per cent in 2005 (when collection of information on maternal nationality began) to 23.8 per cent in 2009. NPRS figures have shown that non-Irish mothers were significantly more likely to breastfeed than their Irish counterparts; thus the increase in migration from 2003 could affect trends in overall rates of breastfeeding. However, as shown by Figure 4.2, even when the children of non-Irish mothers are separated out, there has been a modest increase in the prevalence of breastfeeding among Irish mothers since 2004.
Chapter 4 • BREASTFEEDING BEHAVIOURS OF MOTHERS
41
Growing Up in Ireland • MATERNAL HEALTH BEHAVIOURS AND CHILD GROWTH IN INFANCY
34.0%
36.0%
38.0%
40.0%
42.0%
44.0%
46.0%
48.0%
2000 2001 2002 2003 2004 2005 2006 2007 2008 2009
Pro
po
rtio
n B
reas
tfee
din
g a
t D
isch
arg
e fr
om
Ho
spit
al
Year

Figure 4.2: Proportion of children being breastfed (any breastfeeding) at discharge from hospital, by maternal nationality, 2004-2010
Source: Nolan & Brick 2012
4.3 THE MEASUREMENT OF BREASTFEEDING IN GROWING UP IN IRELAND
The Primary Caregiver questionnaire for the Infant Cohort included detailed questions about breastfeeding. Respondents were first asked whether the Study Child had ever been breastfed. If the response was no, the respondent was asked why they had not breastfed. If the answer was yes, respondents were asked whether the child was exclusively breastfed, partially breastfed (breastfeeding alongside formula feeding), and for how long. In total, 11,116 respondents (99.8 per cent of the total sample) answered these questions. The responses were used to produce three measures: exclusive breastfeeding duration; complementary breastfeeding duration; and total breastfeeding duration.
4.4 HOW WERE CHILDREN BREASTFED?
Some respondents (1,236 or 11 per cent) were still breastfeeding at the time of interview (when the child was nine months of age). Those who had breastfed but subsequently stopped were asked a question about why they had stopped. This chapter uses the term ‘exclusive breastfeeding’ to denote the child being fed only breast milk (either expressed or from the breast). ‘Complementary feeding’ denotes the combination of breastfeeding and use of formula, while ‘artificial feeding’ denotes the child being fed only formula. Children often experience a combination of all three feeding types over their first year, with exclusive breastfeeding giving way to complementary breastfeeding, followed by formula milk or being weaned onto solids. Overall, 56 per cent of mothers reported that their child was ever breastfed, and this fell to 48 per cent on discharge from hospital. Just over 44 per cent reported a period of exclusive breastfeeding at some point in the child’s first nine months of life. Almost 97 per cent of children in the Infant Cohort were fed formula at some point in their first nine months. The term ‘all breastfeeding’ is used below to refer to both exclusive and complementary breastfeeding.
Growing Up in Ireland • MATERNAL HEALTH BEHAVIOURS AND CHILD GROWTH IN INFANCY
42
40
50
60
70
80
90
100
2004 2005 2006 2007 2008 2009 2010
Pro
po
rtio
n B
reas
tfee
din
g
Year
Ireland
UK
EU15
EU12
Africa
Asia
Other

Table 4.1: Prevalence of breastfeeding by maternal citizenship
Note: EU12 countries are those that joined the EU after May 2003, EU14 countries those that were members before this date.
Table 4.1 shows the prevalence of breastfeeding in the Infant Cohort by maternal nationality. It confirms the pattern by nationality shown in Figure 4.2; Irish women are less likely to breastfeed compared to all other nationalities. The difference between Irish and non-Irish mothers falls after leaving hospital but nonetheless remains large (all differences between Irish mothers and other groups in Table 4.1 were statistically significant at a 95 per cent probability level).
4.5 WHAT REASONS WERE GIVEN FOR NOT BREASTFEEDING?
Mothers who reported that they did not breastfeed were asked to choose among a set of 15 reasons as to why. These are given in Table 4.2, ranked from most to least commonly chosen. This shows that almost half (49 per cent) stated that formula feeding was ‘preferable’, while 17 per cent chose ‘inconvenience/fatigue’ and 8 per cent ‘difficulty with breastfeeding techniques’. Of the 4,417 women who answered this question, 84 per cent chose just one explanation while 10.4 per cent chose two and 2.5 per cent chose three or more.
Chapter 4 • BREASTFEEDING BEHAVIOURS OF MOTHERS
43
Growing Up in Ireland • MATERNAL HEALTH BEHAVIOURS AND CHILD GROWTH IN INFANCY
per cent Ever
Breastfed
per centBreastfeeding
Leaving Hospital
per centExclusively Breastfed
Irish 50.1 42.5 40.0
UK 73.6 67.2 61.8
EU12 89.0 77.3 72.7
EU14 97.0 89.6 81.0
African 88.1 85.0 56.7
Asian 93.2 84.8 60.5
Other 92.2 89.6 69.5
All 56.1 48.4 44.4

44
Growing Up in Ireland • MATERNAL HEALTH BEHAVIOURS AND CHILD GROWTH IN INFANCY
Table 4.2: Reasons for not breastfeeding (ranked by frequency) given by mothers who did not initiate breastfeeding
The choice by half the non-breastfeeding mothers of formula feeding being ‘preferable’ did not shed light on the underlying reasons for this preference. Although the proportions selecting the other reasons were quite small, their choices varied by maternal age. For example, older women (35 or more) were significantly more likely to choose difficulty with breastfeeding techniques as the reason compared to women under 30 (10.8 per cent v 6.3 per cent). On the other hand, younger women (less than 25 years) were more likely to report embarrassment and stigma as the reason for not breastfeeding (9.7 per cent compared with 3.4 per cent among women aged 35 or more). Growing Up in Ireland found that a smaller proportion of women stated that they did not breastfeed due to embarrassment compared to previous studies. This may be due to women opting for the ‘formula feeding preferable’ option even when embarrassment was a primary reason (leading to misclassification to this category), and/or the difference may reflect differences in the sample designs between Growing Up in Ireland and previous research.
4.6 HOW LONG DID MOTHERS BREASTFEED THEIR BABIES?
As well as making decisions as to whether to breastfeed and to exclusively breastfeed, women also choose how long they will breastfeed. Figure 4.3 shows the proportion of women who had initiated breastfeeding who were still breastfeeding as the number of days following birth increased, for both total breastfeeding (combining exclusive and non-exclusive) and exclusive breastfeeding on its own.
Reason per cent
Formula feeding preferable 48.8
Inconvenience/fatigue 17.1
Difficulty with breastfeeding techniques 8.3
Did not want to breastfeed 5.6
Embarrassment/social stigma 5.6
Not enough milk 5.3
Mother’s illness 5.2
Sore nipples/engorged breast 3.0
Physician advised me not to 2.1
Problems breastfeeding previous baby 2.0
Other children at home 1.6
Babies’ illness 0.9
Wanted to drink alcohol 0.9
Partner/father did not want me to breastfeed 0.7
Baby did not want to breastfeed 0.6
Twin birth 0.6
Mother smokes 0.5
Wanted to share feeding with father 0.5
On medication 0.5
Caesarean section birth 0.4
No support from nurses 0.3
Wanted to return to work 0.2
Other children not breastfed 0.2
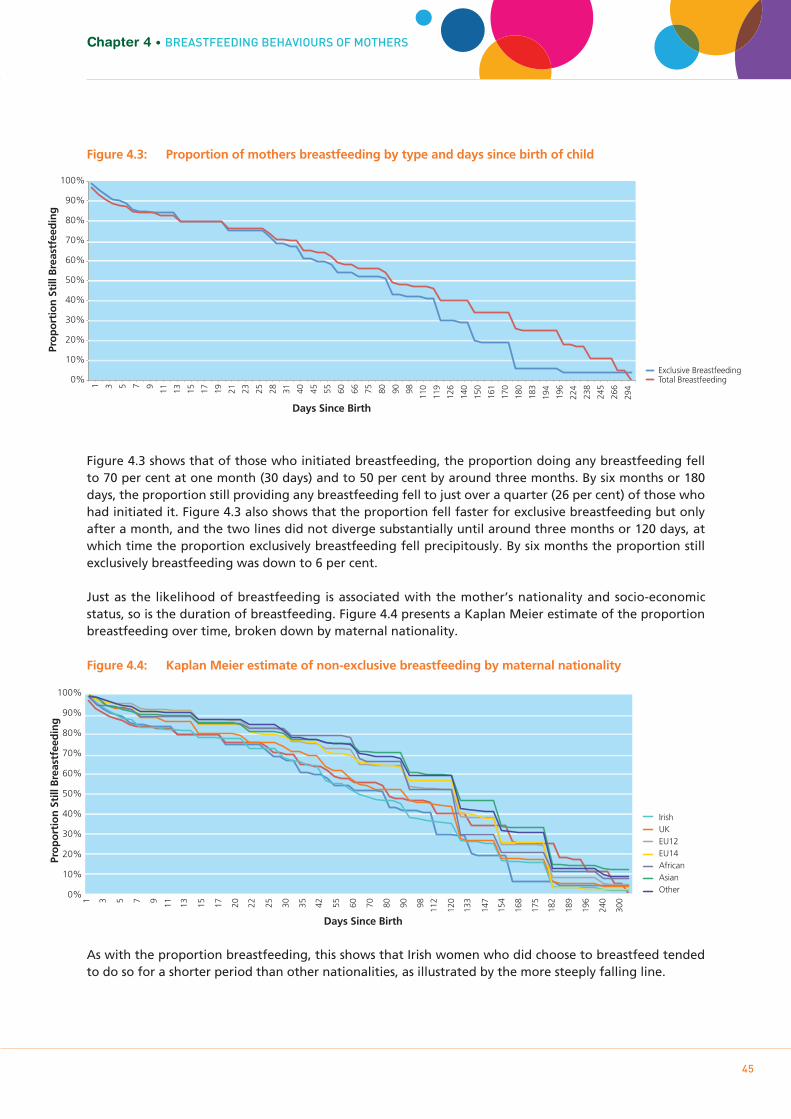
Growing Up in Ireland • MATERNAL HEALTH BEHAVIOURS AND CHILD GROWTH IN INFANCY
45
Chapter 4 • BREASTFEEDING BEHAVIOURS OF MOTHERS
Figure 4.3: Proportion of mothers breastfeeding by type and days since birth of child
Figure 4.3 shows that of those who initiated breastfeeding, the proportion doing any breastfeeding fell to 70 per cent at one month (30 days) and to 50 per cent by around three months. By six months or 180 days, the proportion still providing any breastfeeding fell to just over a quarter (26 per cent) of those who had initiated it. Figure 4.3 also shows that the proportion fell faster for exclusive breastfeeding but only after a month, and the two lines did not diverge substantially until around three months or 120 days, at which time the proportion exclusively breastfeeding fell precipitously. By six months the proportion still exclusively breastfeeding was down to 6 per cent.
Just as the likelihood of breastfeeding is associated with the mother’s nationality and socio-economic status, so is the duration of breastfeeding. Figure 4.4 presents a Kaplan Meier estimate of the proportion breastfeeding over time, broken down by maternal nationality.
Figure 4.4: Kaplan Meier estimate of non-exclusive breastfeeding by maternal nationality
As with the proportion breastfeeding, this shows that Irish women who did choose to breastfeed tended to do so for a shorter period than other nationalities, as illustrated by the more steeply falling line.
0%
10%
20%
30%
40%
50%
60%
70%
80%
90%
100%
1 3 5 7 9 11
13
15
17
19
21
23
25
28
31
40
45
55
60
66
75
80
90
98
110
119
126
140
150
161
170
180
183
194
196
224
238
245
266
294
Pro
po
rtio
n S
till
Bre
astf
eed
ing
Days Since Birth
Exclusive Breastfeeding Total Breastfeeding
Pro
po
rtio
n S
till
Bre
astf
eed
ing
Days Since Birth
0%
10%
20%
30%
40%
50%
60%
70%
80%
90%
100%
1 3 5 7 9 11
13
15
17
20
22
25
30
35
42
55
60
70
80
90
98
112
120
133
147
154
168
175
182
189
196
240
300
Irish UK EU12 EU14 African Asian Other

46
Growing Up in Ireland • MATERNAL HEALTH BEHAVIOURS AND CHILD GROWTH IN INFANCY
4.7 WHAT REASONS WERE GIVEN FOR STOPPING BREASTFEEDING?
Table 4.3 shows the reasons given for stopping breastfeeding for those who had initiated it, ordered from most to least reported. This shows that the most common reason given for stopping was that the child’s mother was not producing enough milk or that the baby was too hungry to be breastfed (36 per cent). The second most common reason was that the mother planned to stop at this point (22 per cent), followed by inconvenience/fatigue (17 per cent). A substantial 25 per cent reported either difficulty with breastfeeding techniques or soreness and engorged breasts as reasons for stopping.
Table 4.3: Reasons for stopping breastfeeding (ranked by frequency) given by mothers who had initiated breastfeeding
4.8 WHAT FACTORS WERE INDEPENDENTLY ASSOCIATED WITH THE PROBABILITY OF BREASTFEEDING?
As noted, a number of factors in the Irish and international literature have been shown to be associated with the probability of initiating breastfeeding. This section analyses the probability of breastfeeding, adjusting for:
• Maternalandpaternalcitizenship• Maternalage• Numberofpreviouschildren• Maternalhighestlevelofeducation• Householdsocialclass
Reason per cent
Not enough milk/hungry baby 36.2
Planned to stop at this time 22.2
Inconvenience/fatigue 16.9
Difficulty with breastfeeding techniques 12.7
Sore nipples/engorged breast 12.1
Formula feeding preferable 8.5
Baby weaned himself/herself 7.2
Mother’s illness 6.7
Returned to work 6.4
Physician told me to stop 2.8
Baby's illness 1.7
Embarrassment/social stigma 1.6
Wanted to drink alcohol 1.2
Other children at home 1.0
Partner/father wanted me to stop 0.5
Lactose intolerance 0.4
Baby got teeth 0.4
On medication 0.4
Going on holidays 0.4
Mother became pregnant 0.3
No support from nurses 0.3
Twin birth 0.2
Other children not breastfed 0.2

Growing Up in Ireland • MATERNAL HEALTH BEHAVIOURS AND CHILD GROWTH IN INFANCY
47
Chapter 4 • BREASTFEEDING BEHAVIOURS OF MOTHERS
• Householdincomequintile• Maternalemploymentstatuspre-pregnancy• Beingtreatedfordepression,anxietyornervesafterbirthofchild• Methodofdelivery• Child’slengthofstayinhospitalpost-birth• WhetherornothospitalaccreditedunderBaby-FriendlyHospitalInitiative
Table 4.4 gives the odds ratios of breastfeeding associated with the factors listed above, both before (lefthand column) and after adjustment (righthand column) for all other factors in the table.
Table 4.4: Unadjusted and adjusted odds of predictors of breastfeeding at discharge from hospital
F Sig.Unadj. Odds
Sig.Adj.Odds
Sig.
Child Sex 6.86 **
Boy Ref. Ref.Girl 1.14 ** 1.20 ***
Maternal Citizenship 73.11 ***
Irish Ref. Ref.
UK 2.63 *** 2.07 ***
EU12 6.36 *** 4.06 ***
EU14 13.89 *** 3.77 ***
African 5.73 *** 8.66 ***
Far East 6.29 *** 3.28 ***
Other 9.57 *** 7.58 ***
Maternal Age 37.63 ***
<25 0.35 *** 0.55 ***
25-29 0.75 *** 0.76 ***
30-34 Ref. Ref.
35-39 0.98 n.s 1.13 *
40+ 1.02 n.s 1.23 *
Number of Previous Children 19.25 ***
First Child Ref. Ref.
Second Child 0.75 *** 0.76 ***
Third Child 0.65 *** 0.79 **
Fourth+ Child 0.62 *** 0.91 n.s
Maternal Highest Education 260.48 ***
Lower 2nd 0.09 *** 0.19 ***
Higher 2nd 0.23 *** 0.37 ***
Post Secondary 0.39 *** 0.54 ***
Degree or Professional Qualification Ref. Ref.
Household Social Class 108.1 ***
Professional Workers Ref. Ref.
Managerial and Technical 0.56 *** 0.75 ***
Non-Manual 0.28 *** 0.53 ***
Skilled Manual 0.31 *** 0.60 ***
Semi & Unskilled 0.29 *** 0.62 ***
Unclassified 0.12 *** 0.53 ***

48
Growing Up in Ireland • MATERNAL HEALTH BEHAVIOURS AND CHILD GROWTH IN INFANCY
Table 4.4 shows that, as expected, Irish mothers were significantly less likely to breastfeed relative to all other nationalities (as shown by the odds ratios greater than one) both before and after adjustment for other variables in the table. Women from EU12 and African countries are four and 10 times more likely, respectively, to be breastfeeding at discharge from hospital compared to an Irish woman. Maternal age also appears to be a significant predictor; the breastfeeding rate increases steadily with age.
Both before and after adjustment, a lower number of previous births was associated with a higher likelihood of breastfeeding. Similarly, women with higher levels of education and those living in higher income or social class
Household Income Quintile 62.46 ***
Lowest 0.25 *** 0.68 ***
2nd 0.34 *** 0.73 ***
3rd 0.46 *** 0.78 **
4th 0.56 *** 0.78 ***
Highest Ref. Ref.
Missing 0.56 *** 0.94 n.s
Maternal Employment Status Pre-pregnancy 61.69 ***
Full-time 1.91 *** 1.04 n.s
Part-time 1.24 ** 1.01 n.s
Not At All Ref. Ref.Treated for Depression, Anxiety or Nerves Post Birth
48.58 ***
No Ref. Ref.
Yes 0.46 *** 0.78 *
Method of Delivery 15.54 ***
Normal Vaginal Ref. Ref.
Suction or Forceps 1.11 n.s 0.87 *
Elective Caesarean 0.64 *** 0.54 ***
Emergency Caesarean 0.82 ** 0.62 ***Child’s Length of Stay in Hospital Post-Birth
6.58 ***
0-1 Ref. Ref.
2 1.12 n.s 0.88 n.s
3-4 1.26 *** 1.03 n.s
5-10 1.05 n.s 1.07 n.s
11+ 0.71 * 0.87 n.sBaby-Friendly Hospital Initiative Ireland Hospital
0.2 n.s
No Ref. Ref.
Yes 1.02 n.s 1.11 *
Origin of Mother and Father
Father Not Irish 1.56 *** 1.42 ***
Mother Not Irish 2.82 *** 1.65 ***
Both Not Irish 5.63 *** 2.48 ***
No Father in Household 0.68 *** 1.10 n.s
Constant 3.08 ***
Key to Significance: n.s – Not Significant; * - P<0.05; ** - P<0.01; *** - P<0.001N – 10,685Pseudo R2: 0.184

Growing Up in Ireland • MATERNAL HEALTH BEHAVIOURS AND CHILD GROWTH IN INFANCY
49
Chapter 4 • BREASTFEEDING BEHAVIOURS OF MOTHERS
households were significantly more likely to breastfeed. The patterns by maternal educational level are particularly stark. Adjusting for age and other factors, women with a third-level qualification were 81 per cent more likely to breastfeed than women with lower secondary qualifications alone.
Mothers’ mental state also appeared to be associated with the odds of breastfeeding. Mothers who experienced diagnosed depression or anxiety following the birth were 22 per cent less likely to breastfeed their child. The causal direction was not clear since it has been suggested that breastfeeding is a protective factor against post-partum depression and anxiety.
Children born via a method other than normal vaginal delivery were significantly less likely to be breastfed at discharge from hospital. Previous research has suggested that this effect may come from the delay in close contact between mother and child caused by the surgery of caesarean section, but these results from Growing Up in Ireland also suggest that a suction or forceps birth may also have a negative effect. Given that a large number of other factors were controlled for, it is difficult to put this result down to confounding.
Table 4.4 shows that children born in Baby-Friendly Hospital Initiative-accredited hospitals were 11 per cent more likely to be breastfed than children born in a non-accredited hospital, but only once adjustment was made for a large number of factors. Further analysis of the effect of hospital of birth (not shown) showed that the effect of accreditation weakens over time, such that women giving birth in accredited hospitals were no more likely to breastfeed two months post-birth than their peers from non-accredited hospitals.
Lastly, Table 4.4 shows that the male partner’s nationality was related to the decision to breastfeed. Where the male partner was not Irish, the odds of breastfeeding increase by 42 per cent, rising to 148 per cent if both mother and father were not from Ireland. The relatively low proportion of variation in breastfeeding explained by the variables in Table 4.4 (18 per cent) suggests that there may be a number of other factors not included which may be important. As discussed above, maternal attitudes towards breastfeeding as well as those of her family and friends have been shown to be influential. Unfortunately, Growing Up in Ireland did not include questions on this issue.
4.9 WHICH CHARACTERISTICS WERE ASSOCIATED WITH LONGER BREASTFEEDING DURATIONS?
The last section confirmed a number of expectations about the factors associated with the probability of breastfeeding. Do these factors also predict the duration of breastfeeding? This section estimates a model of breastfeeding duration which examined the independent effects of different factors on the probability that a woman who has initiated breastfeeding will stop doing so at a particular timepoint.
The predictor variables used in this model are almost identical to those listed in Table 4.4 except here the effect of the woman returning to employment (full-time, part-time, or not returning to employment) was estimated at all timepoints. The effect of the woman’s level of stress around parenting as measured by the Parental Stress Total Scale was also estimated (Berry & Jones, 1995).
The first 10 rows of Table 4.5 provide evidence of positive ‘duration dependency’ in breastfeeding, with women less likely to stop if they make it through the first month. After this point, the likelihood of stopping falls by around 50 per cent and remains at this level. However, at six months the likelihood increases considerably, to 80 per cent higher than in the first month of breastfeeding. This change at six months could represent the combined effect of reaching the guideline duration of breastfeeding and the end of the standard period of maternity leave.
As found for the overall probability of breastfeeding, duration was longer (expressed as an odds ratio of less than one) for non-Irish/UK women, older women and those with higher levels of education and living in higher social-class households. Unlike the probability of breastfeeding, duration did not appear to be associated with household income

Growing Up in Ireland • MATERNAL HEALTH BEHAVIOURS AND CHILD GROWTH IN INFANCY
50
either in the unadjusted or adjusted models, although both higher maternal education and social-class position were associated with longer durations. Further analysis showed that the lack of effect for income was explained by the presence in the model of maternal education, which is strongly correlated with household income. As well as leading to a higher probability of breastfeeding overall, a lower number of previous children was also associated with a longer duration of breastfeeding, adjusting for other factors. Here, however, the effect of number of previous children was confined only to those with three or more previous births.
Table 4.5 shows that the woman’s return to work was crucial to breastfeeding duration. Women returning part-time were 30 per cent more likely to quit breastfeeding within any period. This effect increased for women returning full-time where the risk increased by 113 per cent over those not returning to work. The experience of depression and anxiety also appeared to be related to quitting breastfeeding. A diagnosis was associated with a 36 per cent increase in the probability of quitting. The interpretation of this association was not straightforward as diagnosis was measured at any point in the first nine months of the child’s life. Given this, it could be that depression shortened duration or that the act of breastfeeding reduced the odds of experiencing depression and anxiety. On a related issue, the woman’s level of parental stress was a significant predictor of quitting; each unit increase in stress increased the odds of quitting by 1 per cent.
Table 4.5: Unadjusted and adjusted odds of predictors of stopping (any) breastfeeding, conditional on initiation of breastfeeding
F Sig.Unadj. Odds
Sig. Adj.Odds Sig.
Days Since Birth 154.58 ***
1 to 29 Ref. Ref.30 to 59 0.52 *** 0.54 ***60 to 89 0.36 *** 0.39 ***
90 to 119 0.52 *** 0.57 ***
120 to 149 0.50 *** 0.55 ***
150 to 179 0.54 *** 0.60 ***
180 to 340 1.66 *** 1.81 ***
Child Sex 1.59 n.s
Boy Ref. Ref.
Girl 0.96 n.s 0.96 n.s
Maternal Citizenship 42.75 ***
Irish Ref. Ref.
UK 0.77 * 1.01 n.s
EU12 0.67 *** 0.62 ***
EU14 0.61 *** 0.79 n.s
African 0.56 *** 0.56 ***
Far East 0.55 *** 0.50 ***
Other 0.48 *** 0.51 ***
Maternal Age 20.35 ***
<25 1.59 *** 1.37 ***
25-29 1.16 *** 1.20 ***
30-34 Ref. Ref.
35-39 0.94 n.s 0.92 n.s
40+ 0.82 *** 0.81 **
Number of Previous Children 21.84 ***
First Child Ref. Ref.
Second Child 0.90 ** 0.92 n.s
Third Child 0.81 *** 0.83 **
Fourth+ Child 0.64 *** 0.65 ***
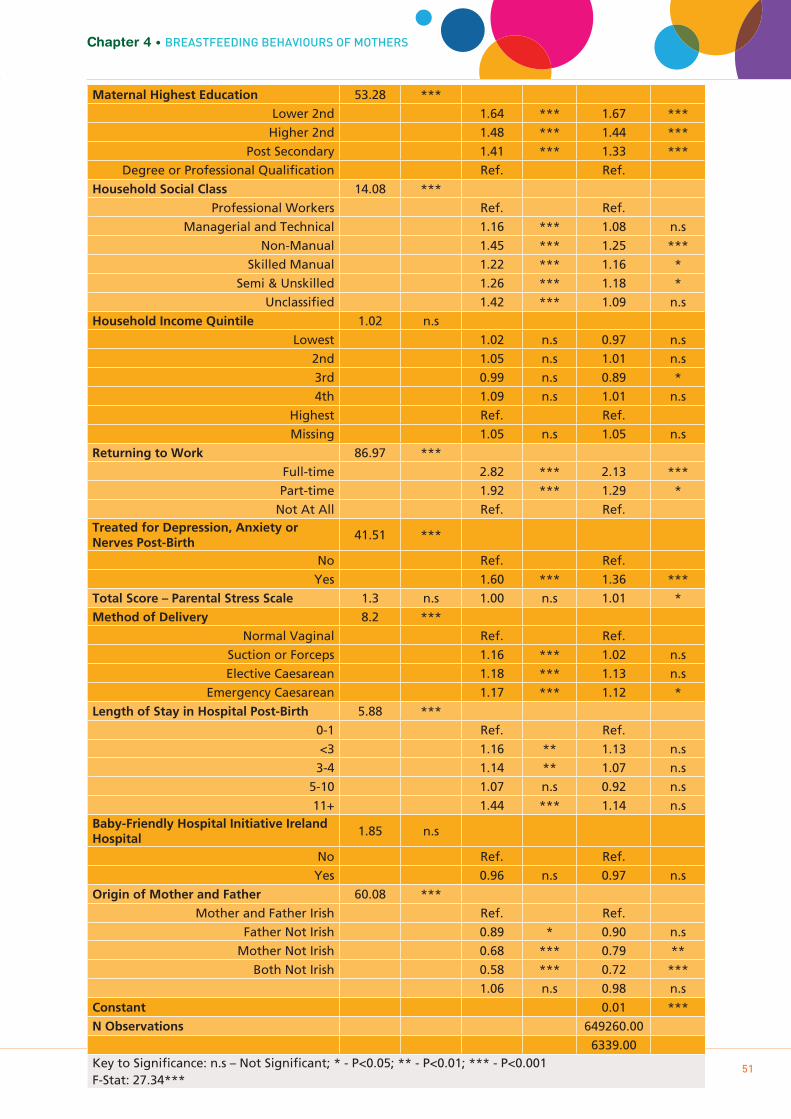
Growing Up in Ireland • MATERNAL HEALTH BEHAVIOURS AND CHILD GROWTH IN INFANCY
51
Chapter 4 • BREASTFEEDING BEHAVIOURS OF MOTHERS
Maternal Highest Education 53.28 ***
Lower 2nd 1.64 *** 1.67 ***
Higher 2nd 1.48 *** 1.44 ***
Post Secondary 1.41 *** 1.33 ***
Degree or Professional Qualification Ref. Ref.
Household Social Class 14.08 ***
Professional Workers Ref. Ref.
Managerial and Technical 1.16 *** 1.08 n.s
Non-Manual 1.45 *** 1.25 ***
Skilled Manual 1.22 *** 1.16 *
Semi & Unskilled 1.26 *** 1.18 *
Unclassified 1.42 *** 1.09 n.s
Household Income Quintile 1.02 n.s
Lowest 1.02 n.s 0.97 n.s
2nd 1.05 n.s 1.01 n.s
3rd 0.99 n.s 0.89 *
4th 1.09 n.s 1.01 n.s
Highest Ref. Ref.
Missing 1.05 n.s 1.05 n.s
Returning to Work 86.97 ***
Full-time 2.82 *** 2.13 ***
Part-time 1.92 *** 1.29 *
Not At All Ref. Ref.Treated for Depression, Anxiety or Nerves Post-Birth
41.51 ***
No Ref. Ref.
Yes 1.60 *** 1.36 ***
Total Score – Parental Stress Scale 1.3 n.s 1.00 n.s 1.01 *
Method of Delivery 8.2 ***
Normal Vaginal Ref. Ref.
Suction or Forceps 1.16 *** 1.02 n.s
Elective Caesarean 1.18 *** 1.13 n.s
Emergency Caesarean 1.17 *** 1.12 *
Length of Stay in Hospital Post-Birth 5.88 ***
0-1 Ref. Ref.
<3 1.16 ** 1.13 n.s
3-4 1.14 ** 1.07 n.s
5-10 1.07 n.s 0.92 n.s
11+ 1.44 *** 1.14 n.sBaby-Friendly Hospital Initiative Ireland Hospital
1.85 n.s
No Ref. Ref.
Yes 0.96 n.s 0.97 n.s
Origin of Mother and Father 60.08 ***
Mother and Father Irish Ref. Ref.
Father Not Irish 0.89 * 0.90 n.s
Mother Not Irish 0.68 *** 0.79 **
Both Not Irish 0.58 *** 0.72 ***
1.06 n.s 0.98 n.s
Constant 0.01 ***
N Observations 649260.00
6339.00Key to Significance: n.s – Not Significant; * - P<0.05; ** - P<0.01; *** - P<0.001F-Stat: 27.34***

Growing Up in Ireland • MATERNAL HEALTH BEHAVIOURS AND CHILD GROWTH IN INFANCY
52
As found for the overall probability of breastfeeding, birth by emergency caesarean section was associated with a shorter duration of breastfeeding.
4.10 SUMMARY
There is now compelling evidence that breastfeeding contributes to better child health and wellbeing in both the short and long term, possibly even into adulthood. This chapter has shown that just over half of Growing Up in Ireland mothers reported breastfeeding their child at any stage and that the proportion falls to 48 per cent at discharge from hospital. One of the starkest patterns to emerge from this chapter is the variation in breastfeeding rates by the nationality of the mother. Adjusting for many factors, analyses showed that women from other countries are much more likely to breastfeed than women from Ireland. Analyses also showed that there is wide variation in the propensity to breastfed by maternal socio-economic status. Women with higher levels of income, education and social class are much more likely to breastfeed, and breastfeed for a longer duration. Similarly, maternal age is important; older mothers are more likely to breastfeed and to breastfeed for longer. To some extent this age difference may reflect unmeasured socio-economic variation (older mothers tend to have higher levels of education and income) but it is more likely to reflect differences in beliefs and attitudes, as found in other research from Ireland.
The Growing Up in Ireland data show that Baby-Friendly Hospital Initiative-accredited hospitals are more effective at promoting breastfeeding initiation than non-accredited, although this advantage is not sustained once women leave hospital. Similarly, within hospitals, women who experience caesarean section are 50 per cent less likely to breastfeed, adjusting for other factors. Given that over a quarter of births are now delivered by section and that this proportion is increasing, this is an important issue that deserves policy attention at both government and hospital levels. Similarly, a woman’s return to work is a key influence on duration of breastfeeding. The policy implications of these findings will be examined in Chapter 6.
Future waves of the Growing Up in Ireland study will provide data on child outcomes that can be related to the pattern of breastfeeding that the child experienced. Some work on breastfeeding and child outcomes has already been carried out using data from the Child Cohort (McCrory & Layte 2012a; McCrory & Layte, 2011) but the evidence from the Infant Cohort will allow us to make far more precise measures in the future.
53
Chapter 5CHILD BIRTH-WEIGHT AND
GROWTH IN EARLY INFANCY
Growing Up in Ireland • MATERNAL HEALTH BEHAVIOURS AND CHILD GROWTH IN INFANCY

5.1 INTRODUCTION
Child birth-weight and subsequent growth have long served as indicators of child health and wellbeing. Low birth-weight has always carried with it a substantially higher risk of neonatal mortality and poorer child health; perhaps because of this, being larger at birth and growing quickly are core parts of lay understandings of the ‘thriving’ child (Lucas et al, 2007). Recent decades have witnessed dramatic improvements in the likelihood of survival for low birth-weight children, but low birth-weight is still associated with a higher risk of infant mortality, worse child health and poorer developmental outcomes. The risks associated with low birth-weight are shown starkly by the perinatal mortality rate (the combination of still births and early neonatal deaths) by birth-weight. For singleton children born around the mean birth-weight of 3,500g, the perinatal mortality rate in Ireland in 2008 was 1.4 deaths per 1,000 births. Among children born under 2,500g this increased to 109 deaths per 1,000 births. Among children born under 1,500g, very low birth-weight children, the rate increased to 339 per 1,000 births. In Ireland the proportion of children born under 2,500g has fluctuated between 4.9 and 5.3 per cent since 1999, with the proportion of very low-weight children relatively stable at around 1.5 per cent (Health Information and Research Division, ESRI, 2011).
Such figures suggest that higher birth-weight is preferable and that rapid increases in weight will be beneficial for child health and development. A child’s birth-weight is determined by a large number of factors, including the genetic and constitutional make-up of the parents, the length of gestation and the prenatal environment of the child. Physically larger parents will, on average, have larger children but larger size at birth (macrosomia) may also result from poorly controlled maternal diabetes and excessive maternal weight gain prior to and during pregnancy (Kramer, 1987). Research now suggests that very large size at birth may be associated with a higher risk of overweight and obesity in childhood and adulthood (Baird et al, 2005; Danielzik et al, 2004).
Similarly, rapid weight gain in infancy and childhood is not unequivocally positive. Evidence from a number of studies outside Ireland has shown that faster growth in infancy is associated with an increased risk of overweight and obesity both in childhood and in later life (Baird et al, 2005; Monteiro & Victoria, 2005; Ong & Loos, 2006; Parsons, Power & Manor, 2001). Rapid weight gain is also associated with worse metabolic health and a higher likelihood of type 2 diabetes (Daphne et al, 2009).
This chapter explores the pattern of child birth-weight in the Infant Cohort and the child’s subsequent growth from birth to nine months of age. Ideally this would include both child weight and length. Unfortunately, while the vast majority of parents could accurately recall the birth-weight of their child, only 43 per cent could recall their child’s length at birth. Given concerns about the representativeness and accuracy of parental reports of child length, these analyses are confined to child weight only. The results in this chapter are the first nationally representative data on patterns of growth among infants in Ireland to be published and represent a significant improvement in understanding.
5.2 THE FACTORS ASSOCIATED WITH CHILD BIRTH-WEIGHT
Although other factors are important (as discussed below), birth-weight is dominated by two broad predictors: the length of the period of gestation and the intrauterine growth rate, that is, the rate at which the child grew during the period in which it was in the womb. Low birth-weight (defined by the World Health Organisation as weight of less than 2500 grams at birth) is therefore the result either of premature birth (usually defined as gestation of less than 37 weeks) or intrauterine growth retardation (IUGR) during gestation. There is no generally accepted definition of the latter but birth-weight below the 5th per centile or less than 2,500 grams at 37 weeks or more are commonly used. Birth-weight and prematurity are linked since prematurely born children are often of low birth-weight, but they are associated with different health and developmental consequences for the child. Premature children, particularly those weighing
Growing Up in Ireland • MATERNAL HEALTH BEHAVIOURS AND CHILD GROWTH IN INFANCY
54

Growing Up in Ireland • MATERNAL HEALTH BEHAVIOURS AND CHILD GROWTH IN INFANCY
55
less than 1500g (very low birth-weight infants), have a much greater risk of developing conditions such as sepsis, apnoea or intracranial haemorrhage, and later cognitive deficit and psychological/behavioural conditions. IUGR infants are less likely to exhibit these problems but outcomes depend on whether the child experiences ‘proportional stunting’ or disproportionate ‘wasting’ (Villar & Belizan, 1982). In the former, the child has proportional reductions in weight, length and head circumference at birth; this is associated with persistent growth deficits (short stature) and cognitive impairment. ‘Disproportionate wasting’ is more common and describes the child who is born with relatively normal length and head circumference but who is ‘thin’, with low weight for length (i.e. low ponderal or body mass index) (Miller & Merritt, 1979). This pattern is associated with unusually fast catch-up growth which has been associated with later metabolic syndrome, and child and adult obesity (Barker et al, 1989; Ong et al, 2002).
5.3 WHICH ARE THE KEY FACTORS ASSOCIATED WITH BIRTH-WEIGHT?
Previous research has shown that the following broad grouping of factors are important for birth-weight (Kramer, 1987):
• Geneticandconstitutional• Demographicandeconomic• Obstetric• Nutritional• Maternalmorbidity• Toxicexposures
The Infant Cohort data contained a number of variables that can be used as measures of these factors, as shown in Table 5.1.
Table 5.1: Areas and factors influencing intrauterine growth and birth-weight
Chapter 5 • CHILD BIRTH-WEIGHT AND GROWTH IN EARLY INFANCY
Area Variable
Genetic and constitutional Infant sex
Racial/ethnic origin
Maternal height
Maternal age
Demographic and socio-economic Socio-economic conditions (education, social class, income)
Obstetric Number of previous births
Gestation
Nutritional Gestational weight gain
Maternal morbidity Chronic illness
Hypertensive
Pre-Eclampsia
Urinary or kidney Infection
Persistent vomiting
Gestational diabetes (diet-treated)
Gestational diabetes (insulin-treated)
Vaginal infection
Toxic exposures Cigarette smoking by trimester
Alcohol consumption by trimester
Number of other smokers in household
Environmental stress

56
Growing Up in Ireland • MATERNAL HEALTH BEHAVIOURS AND CHILD GROWTH IN INFANCY
It is possible to analyse both the determinants of low birth-weight (less than 2500g) or birth-weight overall. Actual birth-weight was used as interest focused on the effect of each variable across the weight distribution, not just on the probability of being low-weight. Analyses were also confined to singleton births as multiple births would introduce added complexity into the analyses.
5.4 THE RELIABILITY OF BIRTH-WEIGHT DATA
The information on birth-weight for the Infant Cohort was collected by interview with the Primary Caregiver when the child was nine months of age. This means that the information was retrospectively recalled, which could raise issues with its accuracy. The Millennium Cohort Study also asked parents to remember their child’s birth-weight at nine months of age, but compared this to birth registration data; comparison of recall and administrative data showed that 82 per cent of mothers recalled their child’s weight to within 30g and 92 per cent to within 100g. This figure was lower among Bangladeshi, black African and Eastern European mothers (Tate et al, 2005). In the Growing Up in Ireland sample 10,992 Primary Caregivers reported a weight for their child (98.7 per cent). Although it is not possible at present to compare Growing Up in Ireland birth weights to official data, Table 5.2 shows the distribution of birth-weights in the Growing Up in Ireland Infant Cohort relative to that in the National Perinatal Birth Register for 2007, the year the Infant Cohort were born. This shows very close correspondence between the two distributions, creating more confidence in the reliability of the parental recall data.
Table 5.2: Comparison of Growing Up in Ireland and National Perinatal Reporting System birth-weight data (2007)
5.5 WHAT IS THE INDEPENDENT EFFECT OF DIFFERENT FACTORS IN BIRTH- WEIGHT?
The unadjusted effect (and significance in the form of the P value) of each predictor variable is reported in the lefthand column of Table 5.3. The final two columns give the effect and significance for each variable, adjusted for all other variables in the table.
Table 5.3 confirms the central importance of the length of gestation for birth-weight. Children born very early were nearly 1800g lighter than children born ‘on time’ (37-41 weeks). Children born between 33 and 36 weeks were 861g lighter. These results only marginally change once adjusted for all other variables. Among the variables representing genetic and constitutional factors, girls were 120g lighter than boys on average; children of taller mothers were significantly heavier, and first-born children were lighter than second or later children (but only after adjusting for other factors). First-born children were significantly
Birth-weight GUI
(N=10,992)NPRS
(N=69,318)<750g 0.1 0.1
750-99g 0.1 0.1
1000-1249g 0.3 0.2
1250-1499g 0.3 0.2
1500-1999g 1.2 0.7
2000-2499g 3.7 2.4
2500-2999g 11.6 10.8
3000-3499g 32.9 33.4
3500-3999g 34.4 35.3
4000-4499g 12.5 13.9
4500g+ 2.9 2.8
100% 100%

Growing Up in Ireland • MATERNAL HEALTH BEHAVIOURS AND CHILD GROWTH IN INFANCY
57
Chapter 5 • CHILD BIRTH-WEIGHT AND GROWTH IN EARLY INFANCY
lighter on average across studies because women’s bodies improve in their ability to supply nutrients to the unborn child after the first pregnancy (on average). Child birth-weight increases as mother’s age increases, but only when unadjusted. Tests showed that higher levels of smoking among younger mothers completely accounted for the increase in average child-birth weight as mother’s age increased. Table 5.3: Unadjusted and adjusted predictors of birth-weight
FP
valueUnadj. Coeff.
P valueAdj.
Coeff.P value
Gestation
Very Early (<33) 443.93 *** -1797.4 *** -1734.5 ***Somewhat Early (<36) -860.7 *** -795.4 ***
On Time (37-41) REF.
Late Birth (42+) 224.0 *** 218.5 ***
Child Sex
Male REF.
Female 80.77 *** -119.6 *** -123.4 ***
Maternal Age
<25 11.97 *** REF.
25-29 75.2 ** -16.8 n.s
30-34 128.0 *** -8.5 n.s
35-39 148.8 *** -9.9 n.s
40+ 81.2 * -38.0 n.s
Maternal Citizenship
Irish 4.78 *** REF.
UK 82.3 n.s 27.7 n.s
EU12 -6.4 n.s -55.8 *
EU14 -88.9 n.s -176.6 ***
African -76.3 n.s -103.3 *
Far East -206.6 ** -39.3 n.s
Indian Subcontinent -330.9 *** -262.9 **
Other 25.7 n.s -30.7 n.s
Maternal Height in cm 280.01 *** 18.1 *** 14.5 ***
Number of Previous Children
First Child 88.01 *** -128.8 *** -141.9 ***
Second or Higher Child REF.
Maternal Weight Gain in kg 181.29 *** 16.7 *** 13.5 ***
Cigarette Smoking
Smoked 1st Trimester 161.04 *** -234.7 *** -75.5 *
Didn’t Smoke 1st Trimester REF.
Smoking 3rd Trimester Never 56.1 *** REF.
1-5 Daily -196.2 *** -99.6 *
6-10 Daily -273.3 *** -112.0 *
11+ Daily -310.8 *** -159.2 **
Other Smokers in HH No Smokers REF.
1 Smoker -89.1 *** -8.7 n.s
2 smokers -212.1 *** -35.9 n.s
3+ Smokers -278.3 *** -50.6 n.s

58
Growing Up in Ireland • MATERNAL HEALTH BEHAVIOURS AND CHILD GROWTH IN INFANCY
Consumption of Alcohol
None 2rd Trimester 7.15 *** REF.
Light 2rd Trimester 85.4 *** -27.7 n.s
Moderate 2rd Trimester 76.7 * 32.3 n.s
Heavy 2rd Trimester -73.6 n.s 16.2 n.s
None 3rd Trimester 10.5 *** REF.
Light 3rd Trimester 118.1 *** 49.6 n.s
Moderate 3rd Trimester 55.8 n.s -24.6 n.s
Heavy 3rd Trimester 31.42 *** -62.4 n.s -11.1 n.s
Maternal Chronic Illness
No Chronic Illness REF.
Chronic 16.07 *** -85.3 *** -50.4 **
Pregnancy Complications
Hypertensive 8.92 ** -69.1 ** -35.5 n.s
Pre-Eclampsia 27.41 *** -170.1 *** -54.3 *
Urinary or Kidney Infection 8.87 *** -61.0 ** -18.9 n.s
Persistent Vomiting 5.26 * -40.5 * -13.7 n.s
Gestational Diabetes (Diet-Treated) 0.43 n.s -31.7 n.s 24.8 n.s
Gestational Diabetes (Insulin-Treated) 1.48 n.s -103.4 n.s 130.2 *
Vaginal Infection 0.63 n.s 25.7 n.s 11.1 n.s
Stress during Pregnancy (not due to illness)
A great deal 2.41 n.s -61.8 * 0.3 n.s
Some 8.3 n.s -16.3 n.s
Not much 10.1 n.s -9.1 n.s
None at all REF.
Household Income Quintile
Lowest 7.98 *** -107.4 *** 13.3 n.s
2nd -46.0 * 17.7 n.s
3rd -3.0 n.s 32.0 n.s
4th 19.0 n.s 68.6 ***
Highest REF.
Missing -59.7 * 9.3 n.s
Maternal Highest Education
Lower 2nd 12.69 *** -132.6 *** -12.9 n.s
Higher 2nd -67.6 ** -10.6 n.s
Post Secondary -28.1 n.s 0.1 n.s
Degree or Professional Qualification REF.
Post-Grad 31.4 n.s 24.4 n.s
Household Social Class
Professional Workers 13.5 ***
Managerial and Technical -43.9 * -22.1 n.s
Non-Manual -69.1 ** 2.5 n.s
Skilled Manual -75.8 ** -5.2 n.s
Semi & Unskilled -131.4 *** 11.2 n.s
Unclassified -201.3 *** -25.0 n.s
Constant 1147.7 ***
N=9735 R2=0.33Key to Significance: n.s – Not Significant; * - P<0.05; ** - P<0.01; *** - P***

Growing Up in Ireland • MATERNAL HEALTH BEHAVIOURS AND CHILD GROWTH IN INFANCY
59
Unadjusted, children of mothers from the countries in East Asia (China, Japan, Korea, etc) and the Indian subcontinent were lighter at birth (207g and 331g respectively). However, adjusting for other factors children from all other citizenships apart from the UK and East Asia were significantly lighter.
Larger maternal weight gain would suggest a positive energy balance (higher calorific intake or lower physical activity). On average, mothers in the study gained 13.5kg during pregnancy. Table 5.3 shows that each extra kilogram was associated with an increase in birth-weight of 14g in the adjusted model.
Toxic exposure was measured in terms of reported cigarette and alcohol consumption during different trimesters of pregnancy. Smoking in the first trimester was associated with a decrease in birth-weight of 76g controlling for all other factors, including smoking in the third trimester. The latter was itself very strongly related to birth-weight. There was a clear, linear effect with reported quantity of cigarettes smoked: in the adjusted model, 1-5 cigarettes daily reduced weight by 100g, 6-10 by 112g and 11+ by 159g compared to not smoking. It is likely that there was some under-reporting of smoking so this is a conservative estimate of the effect. Having other smokers in the household was significantly and negatively associated with birth-weight, but only in the unadjusted models.
Before adjustment, alcohol had a complex relationship with birth-weight; light and moderate consumption had a positive effect and heavy consumption a negative effect. However, once adjustment was made for other factors, these associations become non-significant. Experiencing ‘a great deal of stress’ had a significant negative association with birth weight in the unadjusted models but the effect becomes non-significant in the fully adjusted analyses.
In the unadjusted models, household income, social class and maternal education were all positively associated with birth-weight; i.e. as socio-economic position increases so does birth-weight. However, these effects were all completely attenuated in the adjusted models, suggesting that the association of the socio-economic measures to birth-weight was mediated by higher rates of smoking and birth complications among women in lower socio-economic positions. The final model accounted for a third of the total variation in birth-weight. It is possible that more variation would be explained by examining the manner in which the effect of one variable changed with the value of another (e.g. smoking during pregnancy may have a bigger effect among older mothers). However, it is also likely that important factors such as the mother’s diet and nutrition during pregnancy (which were not measured in the study) may have an important bearing on child weight.
5.6 WHAT WERE THE PATTERNS OF GROWTH FROM BIRTH TO NINE MONTHS?
Results from Growing Up in Ireland indicate that a quarter of both nine-year-olds and three-year-olds in Ireland were overweight, and 6 to 7 per cent obese (Department of Children and Youth Affairs, 2011; Layte & McCrory, 2011). Evidence (Layte & McCrory, 2011) shows that the prevalence of overweight and obesity in Ireland is increasing, so it is important to identify the risk factors for obesity, particularly those which were modifiable and thus amenable to policy interventions.
Evidence from studies outside Ireland have shown that faster growth in infancy is associated with an increased risk of overweight and obesity both in childhood and in later life (Baird et al, 2005; Monteiro & Victoria, 2005; Ong & Loos, 2006; Parsons, Power & Manor, 2001). Children born with relatively small or large birth-weight will demonstrate ‘catch-up’ or ‘catch-down’ growth, respectively, where they grow more rapidly or more slowly than other children of their age of more average weight. This results in convergence towards the mean among children after birth, where variation in child weight decreases over the first few months of life. Yet some children demonstrate ‘unexpectedly rapid growth’ (Cameron et al, 2003) in weight relative to length, which can mean that their weight overshoots the healthy target, leading to an
Chapter 5 • CHILD BIRTH-WEIGHT AND GROWTH IN EARLY INFANCY

increased risk of childhood obesity. Research internationally is still striving to understand the factors that predict unexpectedly rapid growth.
The pattern of children’s growth from birth to nine months and its relationship to both prenatal and postnatal factors is examined below. As discussed, it is important to examine whether the pronounced effect which maternal smoking had on birth-weight continues to influence child growth postnatally, controlling for birth-weight. Research has suggested that formula-fed children are more likely to grow rapidly (Ong et al, 2002). Thus this section examines the role of breastfeeding in growth patterns. There are conflicting findings about the role of early weaning onto solid foods. This has been found to be associated with greater infant weight gain up to 14 months (Baker et al, 2004; Sloan et al, 2008) but other studies have found less differentiation in growth patterns by weaning status at earlier stages (Baird et al, 2008; Currie et al, 2004; Morgan, Lucas & Fretwell, 2004).
One of the most striking patterns to emerge from the analysis of data on the nine-year-old children in Growing Up in Ireland was the uneven distribution of overweight and obesity by social class (Layte & McCrory, 2011). Children from manual working-class groups were significantly more likely to be obese. Given this, the extent to which rapid weight gain was more likely among children from working-class backgrounds and the factors that account for this relationship are examined below.
5.7 BIRTH-WEIGHT AND SUBSEQUENT GROWTH
Standard growth charts for children, such as those provided for the British population by the World Health Organisation,3 provide the reference pattern for what is regarded as healthy growth. These show children growing quickest during the first three months of life, with growth rates moderating thereafter. However, these average growth rates belie greater diversity across children. If child birth-weights are ranked, a child’s movement across weight centiles between two points in time (i.e. the child’s weight relative to other children of the same age) provides a measure of the rate of growth. For example, if a child is at the 50th centile at birth (i.e. has the median birth-weight) but is at the 60th centile at nine months, this would suggest that they have grown more rapidly than their peers. Where the difference in centiles between birth and nine months is greater than 0.67, this can be defined as ‘rapid’ weight gain (Ong et al, 2002).4
Table 5.4 shows that, overall, 49 per cent of the children in the Growing Up in Ireland Infant Cohort sample gained weight at an average rate while 25 per cent experienced rapid and 11 per cent very rapid weight gain. Almost the same proportions moved down the weight distribution in terms of growth lines. As expected, the lower the child’s birth-weight, the larger the subsequent weight gain. Table 5.4 shows that 82 per cent of low birth-weight children (under 2,500g) experienced rapid or very rapid growth between birth and nine months. Over 55 per cent experienced very rapid growth. At the other end of the birth-weight distribution, only 4 per cent of children weighing more than 4.5kg at birth grew rapidly before nine months of age.
Table 5.4: Growth deciles crossed between birth and nine months of age, by birth-weight (N=10,800)
Note: ‘Very’ slow or rapid growth is defined as child weight crossing two centile growth lines between birth and nine months of age, either negatively or positively
Growing Up in Ireland • MATERNAL HEALTH BEHAVIOURS AND CHILD GROWTH IN INFANCY
603 See http://www.rcpch.ac.uk/child-health/research-projects/uk-who-growth-charts-early-years/uk-who-0-4-years-growth-charts-initi4 The use of 0.67 is significant as this is equivalent to the distance between adjacent centile lines drawn on standard growth curves (i.e.
2nd, 9th 25th, 50th, 75th, 91st and 98th centiles).
Very Slow Growth
Slow Growth
Average Growth
Rapid Growth
Very Rapid Growth
Total
<2.5kg 0.2 0.8 17.3 26.5 55.3 100
2.5-3kg 0.8 3.7 51.3 23.5 20.7 100
3-3.5kg 3.0 14.4 55.9 16.1 10.6 100
3.5-4kg 10.9 22.3 52.1 10.2 4.4 100
4-4.5kg 25.6 27.2 39.2 6.0 2.0 100
>4.5kg 48.2 24.0 24.0 2.5 1.4 100
All 9.4 17.0 48.8 13.9 10.9 100
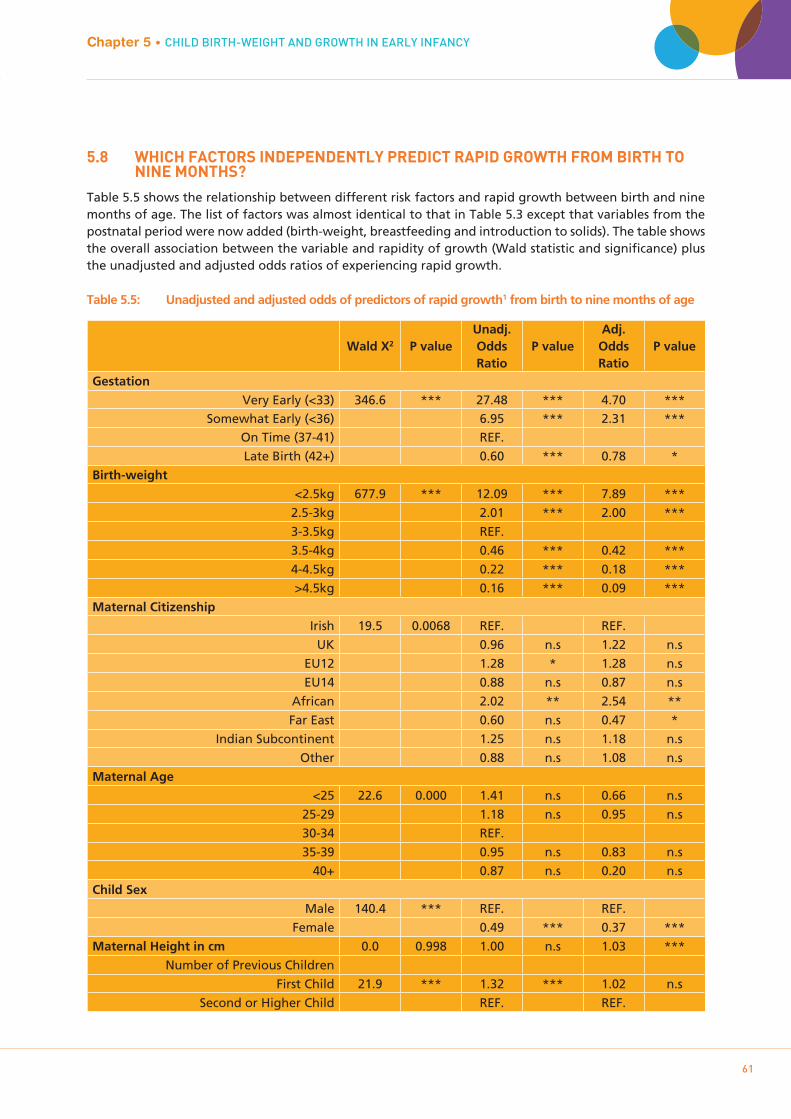
5.8 WHICH FACTORS INDEPENDENTLY PREDICT RAPID GROWTH FROM BIRTH TO NINE MONTHS?
Table 5.5 shows the relationship between different risk factors and rapid growth between birth and nine months of age. The list of factors was almost identical to that in Table 5.3 except that variables from the postnatal period were now added (birth-weight, breastfeeding and introduction to solids). The table shows the overall association between the variable and rapidity of growth (Wald statistic and significance) plus the unadjusted and adjusted odds ratios of experiencing rapid growth.
Table 5.5: Unadjusted and adjusted odds of predictors of rapid growth1 from birth to nine months of age
Chapter 5 • CHILD BIRTH-WEIGHT AND GROWTH IN EARLY INFANCY
61
Growing Up in Ireland • MATERNAL HEALTH BEHAVIOURS AND CHILD GROWTH IN INFANCY
Wald X2 P valueUnadj. Odds Ratio
P valueAdj. Odds Ratio
P value
Gestation
Very Early (<33) 346.6 *** 27.48 *** 4.70 ***Somewhat Early (<36) 6.95 *** 2.31 ***
On Time (37-41) REF.
Late Birth (42+) 0.60 *** 0.78 *
Birth-weight
<2.5kg 677.9 *** 12.09 *** 7.89 ***
2.5-3kg 2.01 *** 2.00 ***
3-3.5kg REF.
3.5-4kg 0.46 *** 0.42 ***
4-4.5kg 0.22 *** 0.18 ***
>4.5kg 0.16 *** 0.09 ***
Maternal Citizenship
Irish 19.5 0.0068 REF. REF.
UK 0.96 n.s 1.22 n.s
EU12 1.28 * 1.28 n.s
EU14 0.88 n.s 0.87 n.s
African 2.02 ** 2.54 **
Far East 0.60 n.s 0.47 *
Indian Subcontinent 1.25 n.s 1.18 n.s
Other 0.88 n.s 1.08 n.s
Maternal Age
<25 22.6 0.000 1.41 n.s 0.66 n.s
25-29 1.18 n.s 0.95 n.s
30-34 REF.
35-39 0.95 n.s 0.83 n.s
40+ 0.87 n.s 0.20 n.s
Child Sex
Male 140.4 *** REF. REF.
Female 0.49 *** 0.37 ***
Maternal Height in cm 0.0 0.998 1.00 n.s 1.03 ***
Number of Previous Children
First Child 21.9 *** 1.32 *** 1.02 n.s
Second or Higher Child REF. REF.

Growing Up in Ireland • MATERNAL HEALTH BEHAVIOURS AND CHILD GROWTH IN INFANCY
62
Maternal Weight Gain during pregnancy 4.2 0.0407 0.99 * 1.01 n.s
Maternal Chronic Illness
No Chronic Illness 1.8 0.184 REF. REF.
Chronic 1.12 n.s 0.91 n.s
Pregnancy Complications
Hypertensive 7.6 0.006 1.28 ** 1.08 n.s
Pre-Eclampsia 20.2 *** 1.61 *** 1.13 n.s
Urinary or Kidney Infection 2.3 *** 1.13 n.s 0.94 n.s
Persistent Vomiting 0.0 0.841 0.98 n.s 1.00 n.s
Gestational Diabetes (Diet-Treated) 0.1 0.803 1.05 n.s 1.04 n.s
Gestational Diabetes (Insulin-Treated) 0.1 0.734 1.10 n.s 0.69 n.s
Vaginal Infection 0.3 0.6 0.91 n.s 1.04 n.s
Breastfeeding
None 55.1 *** 1.61 *** 1.26 n.s
<week 1.26 n.s 1.14 n.s
<month 1.58 *** 1.30 n.s
<3 months 1.79 *** 1.43 n.s
<6months 1.45 *** 1.21 n.s
<9 months REF. REF.
9+months 0.83 n.s 0.72 ***
Introduction of Solids
<3months 20.6 *** 1.59 ** 1.59 **
<4months 1.38 ** 1.47 **
<5months 1.29 ** 1.27 **
<6months 1.21 * 1.28 **
6months+ REF. REF.
Early Pregnancy Smoking
Smoked 1st Trimester 77.2 *** 1.91 *** 0.98 n.s
Didn't Smoke 1st Trimester
Later Pregnancy Smoking
Never 87.3 *** REF. REF.
1-5 Daily 1.87 *** 1.39 n.s
6-10 Daily 1.75 *** 1.09 n.s
11+ Daily 2.87 *** 1.73 *
Passive Smoking
No Smokers 66.8 ***
1 Smoker 1.38 *** 1.11 n.s
2 smokers 2.02 *** 1.21 n.s
3+ Smokers 2.10 ** 1.15 n.s
Consumption of Alcohol
None 2rd Trimester 32.5 *** REF. REF.
Light 2rd Trimester 0.50 *** 0.42 ***
Moderate 2rd Trimester 0.73 n.s 0.68 n.s
Heavy 2rd Trimester 1.04 n.s 0.85 n.s
None 3rd Trimester 16.4 0.0009 REF. REF.

Chapter 5 • CHILD BIRTH-WEIGHT AND GROWTH IN EARLY INFANCY
63
Growing Up in Ireland • MATERNAL HEALTH BEHAVIOURS AND CHILD GROWTH IN INFANCY
Light 3rd Trimester 0.61 *** 1.47 n.s
Moderate 3rd Trimester 0.80 n.s 1.20 n.s
Heavy 3rd Trimester 0.99 n.s 0.82 n.s
Stress during Pregnancy (not due to illness)
A great deal 4.6 0.203 1.14 n.s 0.90 n.s
Some 0.92 n.s 0.92 n.s
Not much 0.94 n.s 0.97 n.s
None at all REF. REF.
Household Social Class
Professional Workers 43.9 *** REF. REF.
Managerial and Technical 1.25 ** 1.10 n.s
Non-Manual 1.30 ** 1.03 n.s
Skilled Manual 1.25 * 0.87 n.s
Semi & Unskilled 1.74 *** 1.09 n.s
Unclassified 1.91 *** 1.05 n.s
Maternal Highest Education
Lower 2nd 27.6 *** 1.51 *** 1.04 n.s
Higher 2nd 1.29 ** 1.01 n.s
Post Secondary 1.21 * 1.06 n.s
Degree or Professional Qualification REF. REF.
Post-Grad 0.93 n.s 1.03 n.s
Household Income Quintile
Lowest 33.8 *** 1.45 *** 1.09 n.s
2nd 1.19 n.s 1.06 n.s
3rd 0.98 n.s 0.99 n.s
4th 0.89 n.s 0.91 n.s
Highest REF. REF.
Missing 1.08 n.s 1.05 n.s
Constant 0.00 ***
Pseudo R2=0.187
Key to Significance: n.s – Not Significant; * - P<0.05; ** - P<0.01; *** - P<0.001;***
Note: 1 ‘Rapid growth’ is defined as a positive difference of 0.67 or more between weight z-scores taken at nine months of age and birth.
Table 5.5 confirms the effects of length of gestation and birth-weight on subsequent growth. Even adjusting for birth-weight and other factors, children born very early were almost five times more likely to grow rapidly. Similarly, children born under 2,500g were almost eight times more likely to grow rapidly, adjusting for length of gestation and other factors. Other child and maternal constitutional factors were also important. Male children, those of taller mothers and those whose mothers have citizenship of an African country were more likely to grow rapidly. The odds ratio for African citizenship was twice that for children of Irish mothers, even adjusting for all the factors in the table, while children of East Asian nationality had only 60 per cent of the likelihood of an Irish child of rapid growth, controlling for other factors.
Table 5.5 shows that lower levels of breastfeeding (higher levels of formula feeding) and earlier weaning onto solid foods were both strongly associated with more rapid growth, even adjusting for other factors. However, there did not appear to be a dose-response relationship; i.e. more breastfeeding was not

associated with a lower odds of rapid weight gain. This could suggest that breastfeeding was a proxy for another, unmeasured factor which should be included in the model or may be the result of a complex relationship with other factors in the model. The relationship with early introduction of solids had a dose-response relationship. Children introduced to solids before three months of age were almost 60 per cent more likely to grow rapidly compared to those weaned after six months, with the effect reducing as the age of introduction increased. The model explained 19 per cent of the variance in rapid growth, which suggests that there were a number of unmeasured factors that if included would improve the predictive capacity of the model.
Earlier analyses showed that maternal exposure to cigarette smoke during pregnancy was strongly related to birth-weight, but Table 5.5 suggests that it had little influence on subsequent growth except where the mother smoked heavily in late pregnancy. In this case, the child was 73 per cent more likely to grow rapidly, even adjusting for their lower birth-weight and shorter gestation. Light consumption of alcohol appears to be associated with lower growth velocity. Socio-economically advantaged mothers were more likely to report regular, low levels of alcohol consumption during pregnancy; thus it may be that this effect was due more to unmeasured advantage for these children rather than the direct effect of exposure to alcohol in utero. The figures at the bottom of Table 5.5 show that the model explained only 19 per cent of the variance in the probability of rapid growth, which suggests that a number of important factors were missing from the model.
5.9 SUMMARY
Child birth-weight and subsequent growth are important indicators of overall health and development. The main determinants of birth-weight have been known for some time, although prior to this study there was no published evidence of the role of different factors for the population in Ireland. Recent decades have witnessed a substantial increase in research internationally on the pattern of child growth from birth, primarily because of interest in the role of growth, and rapid growth in particular, on later body composition and health.
The analyses of singleton births in this chapter produced evidence that the determinants of birth-weight for the population in Ireland were similar to those in other developed nations. Genetic and constitutional factors were important; child sex, the mother’s number of previous births, maternal citizenship (which is a proxy measure of maternal race and thus genetic inheritance) and maternal height were all significant predictors of birth-weight, adjusting for other factors.
More important from a policy perspective was the strong influence of maternal smoking during pregnancy on birth-weight. Prenatal smoking was second only to length of gestation in terms of the degree of variation in the data for which it accounts. Smoking in the first trimester is associated with a 235g reduction in birth-weight, adjusting for other factors, and there was a linear, dose-responsive relationship between the number of cigarettes smoked in the third trimester and birth-weight: heavy smoking (11+ daily) reduces birth weight by 311g on average.
Growing Up in Ireland • MATERNAL HEALTH BEHAVIOURS AND CHILD GROWTH IN INFANCY
64

Growing Up in Ireland • MATERNAL HEALTH BEHAVIOURS AND CHILD GROWTH IN INFANCY
65
Chapter 6POLICY IMPLICATIONS

The prenatal and early life environment has a profound influence on a child’s health in infancy and subsequent pattern of physical and mental development. Moreover, evidence from Ireland and internationally now suggests that the prenatal and early life environment may have consequences for the individual’s health and wellbeing into adulthood and later life. This concern with the effect of early life environment and experiences on later life outcomes has been reflected in the current national health policy framework ‘Healthy Ireland’ as well as the National Policy Framework for Children & Young People 2014-2020, titled ‘Better Outcomes, Brighter Futures’ (published in 2014).
This report has presented the findings of the first nationally representative study of maternal health behaviours and child growth patterns. It has provided evidence of cigarette and alcohol consumption in pregnancy and the factors associated with this, as well as the complex determinants of breastfeeding behaviours. The report has also provided detailed evidence of the relationship of maternal health behaviours, circumstances and characteristics to child birth-weight and subsequent growth.
The results in Chapter 2 of this report showed that the proportion of mothers smoking all the way through pregnancy had fallen greatly from over 28 per cent in 1997-98 to 13 per cent in 2007-08. Smoking during pregnancy is the primary cause of low birth-weight, and low birth-weight babies are more likely to experience acute illness in infancy and more chronic ill health and neurological problems. These longer-term issues can sometimes reach into old age, with obvious implications for healthcare costs. Children exposed to prenatal smoking are also more likely to develop emotional and behavioural problems, which are an important cause of educational failure and social problems.
Analyses here suggest that a number of interventions and policy changes could reduce levels of smoking. One striking pattern which reoccurred across the chapters of this report was the higher level of smoking among parents in lower socio-economic positions. This pattern undoubtedly contributes to the inequalities in health and life expectancy that have been repeatedly found in the general population (Barry et al, 2001; Institute of Public Health in Ireland, 2001; Institute of Public Health in Ireland, 2010). As already suggested, evidence from Growing Up in Ireland shows that levels of smoking during pregnancy have fallen over time but the fall in smoking during pregnancy has been far less pronounced among women from lower socio-economic groups. The reasons for this patterning by socio-economic status are complex and beyond the bounds of this report, but there is increasing evidence that it reflects the level of social deprivation among lower socio-economic women and its effect on their mental health as well as use of smoking as a coping mechanism (Graham, 1994; Lawlor et al, 2003; Layte & Whelan, 2009; Wakefield et al, 1993). The policy implication of this is that reducing the number of risk factors among lower socio-economic groups will be dependent on improvement in their general living conditions. This would require substantial changes in policy over the long term across a number of departments of government. Detailed studies of the required changes are available (Acheson et al, 1998; Marmot & Wadsworth, 1997). In the meantime, are there more immediate policy levers available? Results here suggest there are.
Smoking cessation during pregnancy is made more difficult when a woman lives with other smokers. Lower-income women who are pregnant are more likely to live with a smoker than their more affluent peers. There needs to be a more coherent smoking cessation effort among pregnant women in Ireland, coordinated at national level, and this needs to include cessation counselling directed at husbands and partners. No women in the Growing Up in Ireland study were found to begin smoking during pregnancy, which suggests that policies to reduce smoking initiation and increase cessation of young women before they become pregnant could be effective in reducing rates of smoking during pregnancy. Recent evidence from the Irish Survey of Lifestyle and Nutrition (Morgan et al, 2008) suggests that smoking among women overall has been stable since the early 2000s, but may well have increased among young women (Brugha et al, 2009). Results here also show that the probability of smoking during pregnancy is associated with experience of stress, anxiety and depression. While the issue is currently under-researched, this association
Growing Up in Ireland • MATERNAL HEALTH BEHAVIOURS AND CHILD GROWTH IN INFANCY
66

suggests that the mental wellbeing of pregnant women should be assessed at first booking appointment and counselling or other interventions provided.
This report also presented evidence from the Growing Up in Ireland study on alcohol consumption by mothers during pregnancy. Our results showed little support for the hypothesis that light alcohol consumption during pregnancy was associated with worse child health and development, but this is not true of heavy consumption. Relatively few women in Ireland continue to drink heavily during pregnancy (less than 3 per cent), but those who do experience a constellation of other problems and tend also to smoke. In this respect, the policy response to heavy maternal alcohol consumption in pregnancy will be similar to that in response to smoking. Identification of women who are heavy consumers of alcohol would permit multidimensional interventions to be targeted at this group. However, the generally high consumption of alcohol in Irish society among young women means that many children are exposed to high levels of alcohol before the pregnancy is confirmed. Reducing overall levels of alcohol consumption among young women would be beneficial. Interpretation of the lack of association of light to moderate consumption of alcohol with poor child outcomes does not rule out an association. Although analyses here adjusted for maternal and family factors, it is possible that residual confounding leads to lower or insignificant effects. Ireland has the lowest national rate of breastfeeding in the world. This has important consequences for population health and wellbeing. Low rates of breastfeeding also have implications for healthcare costs both in the short and long term. Given this, breastfeeding should be a priority issue for Government and policymakers. Ireland has a national breastfeeding strategy (Department of Health and Children, 2005) and Chapter 4 showed that rates of breastfeeding (at discharge from maternity hospital) have increased from 38 per cent in 2000 to 46 per cent in 2009. However, research suggests that as much as 60 per cent of this increase is due to changes in the characteristics of mothers who are older and more likely to be in non-manual or professional occupations. Measures to increase rates of breastfeeding should be a priority. This is the subject of the HSE Review and Evaluation of Breastfeeding in Ireland - A 5 year Strategic Action Plan 2005 – 2010 (HSE, 2014), due to be completed in 2014.
This report has shown large differences in the probability of breastfeeding between women from Ireland and those from other countries, even adjusting for other maternal characteristics. Growing Up in Ireland did not include questions on attitudes to breastfeeding but previous research has suggested that maternal embarrassment is an important issue. Given this, the large effect of maternal nationality may actually reflect differences in attitudes and beliefs. The fact that other Irish research has shown that the probability of breastfeeding among non-Irish women fell as their time in Ireland increased further supports this inference (Dominguez et al, 2014). If so, knowledge, attitudes and beliefs around breastfeeding among the Irish population are a serious impediment to increasing breastfeeding rates. Social taboos evoke an emotional response and are difficult for public education campaigns to change, but a well-structured programme, similar to those used for drinking and driving, could have an effect. Particular emphasis needs to be placed on changing attitudes which portray breastfeeding as embarrassing and ‘unnatural’. At the very least, resources should be used to improve public understanding of the short- and long-term benefits of breastfeeding. Even if many mothers are uncomfortable with the task of breastfeeding, such information may increase acceptance of it as well as recognition of its benefits.
This report and the work of other Irish researchers also suggests that some parents mistake frequent child breastfeeding and child demand for breastfeeding as evidence that the child is not getting enough breast milk. Chapter 4 showed that the reason given for stopping breastfeeding in 36 per cent of cases was the perception that the baby was hungry and that the mother could not satisfy this demand. Low production of breast milk can occur but production almost always increases with the child’s requirements. Thus our results suggest that parents may be misinformed about the signals that their child is giving them. If so, improving communication on this issue between parents and health professionals in the antenatal and immediate
Chapter 6 • POLICY IMPLICATIONS
67
Growing Up in Ireland • MATERNAL HEALTH BEHAVIOURS AND CHILD GROWTH IN INFANCY

Growing Up in Ireland • MATERNAL HEALTH BEHAVIOURS AND CHILD GROWTH IN INFANCY
68
post-birth period may increase the duration of feeding of a significant proportion of mothers.
A change in hospital practices could also help increase breastfeeding rates. Baby-Friendly Hospital Initiative-accredited hospitals are more effective at promoting breastfeeding initiation than those which are non-accredited. Although this advantage is not sustained for more than a month after leaving the hospital, increasing the number of accredited hospitals would increase the proportion of women who initiate breastfeeding and this would be beneficial for infants. Similarly, within hospitals, women who experience caesarean section are 50 per cent less likely to breastfeed, adjusting for other factors. Given that a quarter of births are delivered by section and that this proportion is increasing, this is an important issue that deserves policy attention at both government and hospital levels. Similarly, a women’s return to work is a key influence on her duration of breastfeeding. To encourage women to breastfeed for longer, actions should be targeted at making breastfeeding and paid employment more compatible.
As shown in the last chapter, the prevalence of early weaning in Ireland suggests that parents in Ireland are not aware of the health consequences for their child. As shown in this report, weaning onto solid foods before six months of age is associated with a greater likelihood of rapid growth in weight that is not matched by a parallel increase in child height. This pattern of growth is a significant contributor to childhood obesity as early as age three and has been linked to an increased risk of metabolic syndrome in later childhood and adult life. Metabolic syndrome refers to a group of symptoms including high levels of triglycerides (a ‘bad’ type of fat) in the blood, low levels of the ‘good’ cholesterol HDL, high blood pressure and insulin resistance. There is certainly anecdotal evidence for Ireland that many parents see early weight gain as a positive sign and early weaning as beneficial in providing better nutrition for their child compared to breast milk or formula; this needs to be countered through parental education and information. There is no policy strategy around weaning behaviours at a national level at present but the patterns in the Growing Up in Ireland data suggest that the extent of early weaning onto solid foods would also benefit from health promotion activity.
This report has presented the findings of the first nationally representative study of maternal health behaviours and child growth patterns. It has provided evidence of structured patterns of cigarette and alcohol consumption during pregnancy and the factors associated with these, as well the complex determinants of breastfeeding behaviours. It has also provided detailed evidence of the relationships of child birth-weight and subsequent growth to maternal health behaviours, circumstances and characteristics. Other research using Growing Up in Ireland data is also examining a range of other processes and child outcomes, including child growth, psychological development and achievement of developmental milestones and their relationships to child and family characteristics, processes and contexts. The availability of longitudinal data provides a crucial resource for detailed, policy-relevant research on the factors that promote healthy, happy development among children in Ireland.
REFERENCES
Acheson, D., Barker, D., Chambers, J., Graham, H., Marmot, M.G. and Whitehead, M. 1998. Independent Inquiry into Inequalities in Health. London, The Stationery Office.
Agrawal, A., Knopic, V.S., Pergadia, M.L., Waldron, M., Bucholz, K.K., Heath, A.C., Madden, P.A.F. and Martin, N.G. 2008. Correlates of Cigarette Smoking During Pregnancy and its Genetic and Environmental Overlap with Nicotine Dependence. Nicotine and Tobacco Research 10(4):567-578.
Aniansson, G., Alm, B, Andersson, B., Hakkansson, A., Larsson, P., Nylen, O., Peterson, H., Rigner, P., Svanborg, M. and Sabharwal, H. 1994. A prospective cohort study on breastfeeding and otitis media in Swedish infants. The Pediatric Infectious Disease Journal 13(3):183-188.
Appleton, P.L. and Pharoah, P.O.D. 1998. Partner Smoking Behaviour Change is Associated with Women’s Smoking Reduction and Cessation During Pregnancy. British Journal of Health Psychology 3(361):374.
Baird, J., Fisher, D., Lucas, P., Kleijnen, J., Roberts, H. and Law, C. 2005. Being big or growing fast: systematic review of size and growth in infancy and later obesity. British Medical Journal 331(929):931.
Baird, J., Poole, J., Robinson, S., Marriot, L., Godfrey, K., Cooper, C., Inskip, H. and Law, C. 2008. Milk feeding and dietary patterns predict weight and fat gains in infancy. Paediatric and Perinatal Epidemiology 22:575-586.
Baker, J.L., Michaelsen, K.F., Rasmussen, K.M. and Sorenson, T.I.A. 2004. Maternal prepregnant body mass index, duration of breastfeeding and timing of complementary food introduction are associated with infant weight gain. American Journal of Clinical Nutrition 80:1579-1588.
Barker, D.J.P., Winter, P.D., Osmond, C., Margetts, B. and Simmonds, S.J. 1989. Weight in Infancy and Death from Ischaemic Heart Disease. Lancet ii:577-580.
Barry, J., Sinclair, H., Kelly, A., O’Loughlin, R., Handy, D. and O’Dowd, T. 2001. Inequalities in Health in Ireland – Hard Facts. Dublin, Department of Community Health and General Practice, Trinity College.
Bartington, S., Griffiths, L.J., Tate, A.R. and Dezateux, C. 2006. Are breastfeeding rates higher among mothers delivering in Baby Friendly accredited maternity units in the UK? International Journal of Epidemiology 35(1):1178-1186.
Berry, J.O. and Jones, W.H. 1995. The Parental Stress Scale: Initial Psychometric evidence. Journal of Social and Personal Relationships 12(3):463-472.
Bronfenbrenner, U. 1979. The Ecology of Human Development: Experiment By Nature and Design. Harvard University Press.
Brugha, R., Tully, N., Dicker, P., Shelley, E., Ward, M. and McGee, H. 2009. Smoking Patterns in Ireland: Implications for policy and services. Dublin, Stationery Office.
Cameron, N., Pettifer, J., De Wet, T. and Norris, S. 2003. The Relationship of Rapid Weight Gain in Infancy to Obesity and Skeletal Maturity in Childhood. Obesity Research 1:457-460.
Currie, C., Roberts, C., Morgan, A., Smith, R., Settertobulte, W., Samdal, O. and Barnekow Rasmussen, V. 2004. Young People’s Health in Context – Health Behaviour in School Age Children (HBSC) Study: International Report from the 2001/2002 Survey. World Health Organisation.
Curtain, M. 1954. Failure to Breastfeed: A Review of the Feeding History of 1007 Infants. Irish Journal of Medical Science 6:447-451.
REFERENCES
69
Growing Up in Ireland • MATERNAL HEALTH BEHAVIOURS AND CHILD GROWTH IN INFANCY
Danielzik, S., Czerwinski-Mast, M., Langnase, K., Dilda, B. and Muller, M.J. 2004. Parental overweight, socio-economic status and high birth weight are major determinants of overweight and obesity in 5-7 y-old children: baseline data of the Kiel Obesity Prevention Study (KOPS). International Journal of Obesity 28:1494-1502.
Daphne, S.L., Gardner, J.H., Metcalf, B.S., Jeffrey, A.N., Voss, L.B. and Wilkin, T.J. 2009. Contribution of Early Weight Gain to Childhood Overweight and Metabolic Health: A Longitudinal Study (Earlybird 36). Pediatrics 123(1):67-72.
Dejin-Karlsson, E., Hanson, B.S., Ostergren, P.O., Ranstam, J., Isacsson, S.O. and Sjoberg, N.O. 1996. Psychosocial Resources and Persistent Smoking in Early Pregnancy: A Population Study of Women in Their First Pregnancy in Sweden. Journal of Epidemiology and Community Health 50(1):33-39.
Department of Children and Youth Affairs. 2011. Growing Up in Ireland Key Findings: Infant Cohort at 3 Years. Dublin, Department of Children and Youth Affairs.
Department of Children and Youth Affairs. 2014. Better Outcomes, Brighter Futures: the National Policy Framework for Children & Young People 2014-2020. Dublin, Department of Health and Children.
Department of Children and Youth Affairs. Review of the Implementation of the National Breastfeeding Strategy 2005 (forthcoming). Dublin, Department of Health and Children.
Department of Health and Children. 2005. Breastfeeding in Ireland: A Five-Year Strategic Action Plan. Dublin, Department of Health and Children.
Department of Health. 2013. Healthy Ireland: A Framework for Improved Health and Wellbeing. Dublin, Department of Health.
Dominguez Castro, P., Layte, R. and Kearney, J. (2014) Ethnic Variation in Breastfeeding and Complimentary Feeding in the Republic of Ireland, Nutrients, 6, 1832-1849.
EURO-PERISTAT. 2004. European Perinatal Health Report. Brussels, European Commission.
Fitzpatrick, C.C., Fitzpatrick, P.E. and Darling, M.R. 1994. Factors associated with the decision to breastfeed among Irish women. Irish Medical Journal 87:145-146.
Floyd, R.L., Decoufle, P. and Hungerford, D. 1999. Alcohol Use Prior to Pregnancy Recognition. American Journal of Preventative Medicine 17(2):101-107.
Fried PA, O’Connell CM, Watkinson MA. 60- and 72-month follow-up of children prenatally exposed to marijuana, cigarettes, and alcohol: cognitive and language assessment. Journal of Developmental and Behavioral Pediatrics 1992;13:383-91.
Fried, P.A., Watkinson, B., Dillon, R.F. and Dulberg, C.S. 1987. Neonatal neurological status in a low-risk population after prenatal exposure to cigarettes, marijuana, and alcohol. Journal of Developmental and Behavioural Pediatrics 8(6):318-326.
Gilman, S.E., Breslau, J., Subramanian, S.V., Hitsman, B. and Koenen, K.C. 2008. Social Factors, Psychopathology and Maternal Smoking During Pregnancy. American Journal of Public Health 98(3):448-453.
Golding, J., Emmet, P. and Rogers, I. 1997. Gastroenteritis, diarrhoea and breastfeeding. Early Human Development 49:83-103.
Graham, H. 1994. Gender and Class as Dimensions of Smoking-Behaviour in Britain: Insights from a Survey of Mothers. Social Science and Medicine 38:691-698.
Growing Up in Ireland • MATERNAL HEALTH BEHAVIOURS AND CHILD GROWTH IN INFANCY
70
REFERENCES
71
Growing Up in Ireland • MATERNAL HEALTH BEHAVIOURS AND CHILD GROWTH IN INFANCY
Graham, H. and Der, G. 1999. Patterns and Predictors of Smoking Cessation Among British Women. Health Promotion International 14:231-239.
Health Information and Research Division ESRI. 2011. Perinatal Statistics Report 2011. Dublin, Economic and Social Research Institute.
Henderson, J.J., Evans, S.F., Straton, J.A.Y., Priest, S.R. and Hagan, R. 2003. Impact of Postnatal Depression on Breastfeeding Duration. Birth 30(3):175-180.
Hope, A. 2009. A Standard Drink in Ireland: What strength? Dublin, Health Service Executive, Alcohol Implementation Group.
Institute of Public Health in Ireland. 2001. Inequalities in Mortality 1989-1998. Dublin, Institute of Public Health in Ireland.
Institute of Public Health in Ireland. 2010. Making Chronic Conditions Count: Hypertension, Stroke, Coronary Heart Disease, Diabetes. Dublin, Institute of Public Health in Ireland.
Institute of Public Health in Ireland. 2014. Review and Evaluation of Breastfeeding in Ireland - A 5 year Strategic Action Plan 2005 – 2010. Dublin, Institute of Public Health in Ireland.
Jones, K.L. and Smith, D.W. 1973. Recognition of the Fetal Alcohol Syndrome in Early Infancy. Lancet ii:999-1001.
Jones, N.A., McFall, B.A. and Diego, M.A. 2004. Patterns of brain electrical activity in infants of depressed mothers who breastfeed and bottle feed: The mediating role of infant temperament. Biological Psychology 67:103-124.
Kelly, Y., Sacker, A., Gray, R., Kelly, J., Wolke, D. and Quigley, M.A. 2009. Light Drinking in Pregnancy, a Risk for Behavioural Problems and Cognitive Deficits at 3 Years of Age? International Journal of Epidemiology 38:129-140.
Kiernan, K. and Pickett, K.E. 2006. Marital Status Disparities in Maternal Smoking During Pregnancy, Breastfeeding and Maternal Depression. Social Science and Medicine 63(335):346.
Kramer, F.M., Stunkard, A.J., Marshall, K.A., McKinney, S. and Liebschutz, J. 1993. Breast-feeding reduces maternal lower-body fat? Journal of the American Dietetics Association 93(4):429-433.
Kramer, M.S. 1987. Determinants of Low Birth Weight: Methodological Assessment and Meta-Analysis. Review Analyses 65(5):663-737.
Lanting, C.I., Buitendijk, S.E., Crone, M.R., Segaar, D., Gravenhorst, J.B. and van Wouwe , J.P. 2009. Clustering of Socioeconomic, Behavioural, and Neonatal Risk Factors for Infant Health in Pregnant Smokers. PloS One 4(12):e8363.
Lawlor, D.A., Frankel, S., Shaw, M., Ebrahim, S. and Davey-Smith, G. 2003. Smoking and Ill Health: Does Lay Epidemiology Explain the Failure of Smoking Cessation Programs Among Deprived Populations? American Journal of Public Health 93(2):266-270.
Layte, R. and McCrory, C. 2011. Overweight and Obesity Among Nine Year Old Children in Ireland. Dublin, The Stationery Office.
Layte, R. and Whelan, C.T. 2009. Explaining Social Class Inequalities in Smoking: The Role of Education, Self-Efficacy and Deprivation. European Sociological Review 25:399-410.

72
Growing Up in Ireland • MATERNAL HEALTH BEHAVIOURS AND CHILD GROWTH IN INFANCY
Loh, N.R., Kelleher, C.C, Long, S. and Loftus, B.G. 1997. Can We Increase Breastfeeding Rates? Irish Medical Journal 90:100-101.
Lucas, P.J., Roberts, H.M., Kleijnens, J. and Law, C.M. 2007. The importance of size and growth in infancy: integrated findings from systematic reviews of scientific evidence and lay perspectives. Child: Care, Health and Development 33(5):635-640.
Marmot, M.G. and Wadsworth, M.E.J. 1997. Fetal and Early Childhood Environment: Long Term Implications. Churchill Livingstone.
McCrory, C. and Layte, R. 2012a. Breastfeeding and risk of overweight and obesity at nine years of age. Social Science and Medicine 75:323-330.
McCrory, C. and Layte, R. 2012b. Prenatal Exposure to Maternal Smoking and Childhood Behavioural Problems: A Quasi-experimental Approach. Journal of Abnormal Child Psychology 40(8):1277-1288.
McCrory, C. and Layte, R. 2011. The effect of breastfeeding on children’s educational test scores at nine years of age: Results of an Irish cohort study. Social Science and Medicine 72:1515-1521.
Miller, H.C. and Merritt, T.A. 1979. Fetal Growth in Humans. Year Book Medical Publishers.
Mondon, C.W.S., van Lenthe, F., de Graaf, N.D. and Kraaykamp, G. 2003. Partner’s and own education: does who you live with matter for self-assessed health, smoking and excessive alcohol consumption? Social Science and Medicine 57:1901-1912.
Monteiro, P.O. and Victoria, C.G. 2005. Rapid Growth in Infancy and Childhood and Obesity in Later Life: a systematic review. Obesity Reviews 6:134-154.
Morgan, J.B., Lucas, A. and Fretwell, M.S. 2004. Does Weaning Influence Growth and Health up to 18 Months? Archive of Diseases in Childhood 89:728-733.
Oddy, W.H., Sly, P.D., de Klerk, N.H., Landau, L.I., Kendell, G.I., Holt, P.G. and Stanley, F.J. 2003. Breastfeeding and respiratory morbidity in infancy: a birth cohort study. Archive of Diseases in Childhood 88:224-228.
Ong, K.K. and Loos, R.J.F. 2006. Rapid infancy weight gain and subsequent obesity: systematic reviews and hopeful suggestions. Acta Paediatrica 95:904-908.
Ong, K.K., Preece, M.A., Emmett, P.M., Ahmed, M.L. and Dunger, D.B. 2002. Size at Birth and Early Childhood Growth in Relation to Maternal Smoking, Parity and Infant Breast-Feeding: Longitudinal Birth Cohort Study and Analysis. Pediatric Research 52(6):863-867.
Paarlberg, K.M., Vingerhoets, A.J.J.M., Passchier, J., Heinen, A.G.J.J., Dekker, G.A. and van Geijn, H.P. 1999. Smoking Status in Pregnancy is Associated with Daily Stressors and Low Well-Being. Psychology and Health (14):1-87.
Parsons, T.J., Power, C. and Manor, O. 2001. Fetal and early life growth and body mass index from birth to early adulthood in the 1958 British Cohort Longitudinal Study. British Medical Journal 323:1331-1335.
Perez-Escamilla, R., Maulen-Radovan, I. and Dewey, K.G. 1996. The association between caesarean delivery and breastfeeding outcomes among Mexican women. American Journal of Public Health 86(6):832-836.
Pickett, K.E., Wakschlag, L.S., Rathouz, P.J., Leventhal, B.L. and Abrams, B. 2002. The Working Class Context of Pregnancy Smoking. Health and Place 8(3):167-175.
Pickett, K.E., Wilkinson, R.G. and Wakschlag, L.S. 2009. The Psychosocial Context of Pregnancy Smoking
Growing Up in Ireland • MATERNAL HEALTH BEHAVIOURS AND CHILD GROWTH IN INFANCY
73
and Quitting in the Millennium Cohort Study. Journal of Epidemiology and Community Health 63:474-480.
Pritchard, C.W. 1994. Depression and Smoking in Pregnancy in Scotland. Journal of Epidemiology and Community Health 48:377-382.
Rowe-Murray, H.J. and Fisher, J. 2002. Baby Friendly Hospital Practices: Caesarean section is a persistent barrier to early initiation of breastfeeding. Birth 29(2):124-131.
Sayers, G., Thornton, L., Corcoran, R. and Burke, M. 1995. Influences on breastfeeding initiation and duration. Irish Journal of Medical Science 164:281-284.
Schwarz, E.B., McClure, C.K., Tepper, P.G., Thurston, R., Janssen, I., Mathews, K.A. and Sutton-Tyrrell, K. 2010. Lactation and maternal measures of subclinical cardiovascular disease. Obstetrical and Gynecological Surveys 115(1):41-48.
Sloan, S., Gildea, A., Stewart, M., Sneddon, H. and Iwaniec, D. 2008. Early weaning is related to weight and rate of weight gain in infancy. Child Care Health and Development 34:59-64.
Stettler, N. 2007. Nature and strength of epidemiological evidence for origins of childhood and adulthood obesity in the first year of life. International Journal of Obesity 31:1035-1043.
Stroud, L.R., Paster, R.L., Papanandonatos, G.D., Niaura, R., Salisbury, A.L., Battle, C., Lagasse, L.L. and Lester, B. 2009. Journal of Pediatrics 154(1):10-16.
Tarrant, R.C. and Kearney, J.M. 2008. Breastfeeding Practices in Ireland: A Review. Proceedings of the Nutrition Society 4:371-380.
Tarrant, R.C., Younger, K.M., Sheridan-Pereira, M. and Kearney, J.M. 2011. Maternal Health Behaviours During Pregnancy in an Obstetric Population and Their Associations with Socio-Demographic and Infant Characteristics. European Journal of Clinical Nutrition 65(4):470-479.
Tarrant, R.C., Younger, K.M., White, M. and Kearney, J.M. 2010. The Prevalence and Determinants of Breastfeeding Initiation and Duration in a Sample of Women in Ireland. Public Health Nutrition 13(6):760-770.
Tate, A.R., Dezateaux, C., Cole, T.J. and Davidson, L. 2005. Factors affecting a mother’s recall of her baby’s birth weight. International Journal of Epidemiology 34:688-695.
Thue, E., Schei, B. and Jacobson, G. 1995. Psychosocial Factors and Heavy Smoking During Pregnancy Among Parous Scandinavian Women. Scandinavian Journal of Primary Health Care 13:182-187.
Villar, J. and Belizan, J.M. 1982. The Timing Factor in the Pathophysiology of the Intrauterine Growth Retardation Syndrome. Obstetrical and Gynecological Surveys 37:499-506.
Wakefield, M., Gillies, P., Graham, H., Madeley, R. and Symonds, M. 1993. Characteristics Associated with Smoking Cessation During Pregnancy Among Working Class Women. Addiction 88(10):1423-1430.
Wakschlag, L.S., Pickett, K., Middlecamp, M.K., Walton, L.L. and Leventhal, B.L. 2003. Pregnant Smokers Who Quit, Pregnant Smokers Who Don’t: Does History of Problem Behaviour Make a Difference? Social Science and Medicine 56(12):2449-2460.
Wilson, A.C., Forsyth, J.S., Greene, S.A., Irvine, L., Hau, C. and Howie, P.W. 1998. Relation of infant diet to childhood health: seven year follow up of cohort of children in Dundee infant feeding study. British Medical Journal 316:21-25.
REFERENCES

If you would like further information aboutGrowing Up in Ireland, please visit
www.growingup.ie
e-mail [email protected]
or freephone 1800 200 434
BAILE ÁTHA CLIATHARNA FHOILSIÚ AG OIFIG AN tSOLÁTHAIR
Le ceannach díreach óFOILSEACHÁIN RIALTAIS,
52 FAICHE STIABHNA, BAILE ÁTHA CLIATH 2(Teil: 01 – 6476834 nó 1890 213434; Fax 01 – 6476843)
nó trí aon díoltóir leabhar.
DUBLINPUBLISHED BY THE STATIONERY OFFICE
To be purchased from GOVERNMENT PUBLICATIONS,
52 ST. STEPHEN'S GREEN, DUBLIN 2.(Tel: 01 – 6476834 or 1890 213434; Fax: 01 – 6476843)
or through any bookseller.