growth and disorder of macromolecular crystals: … · growth and disorder of macromolecular...
TRANSCRIPT

Methods 34 (2004) 273–299
www.elsevier.com/locate/ymeth
Growth and disorder of macromolecular crystals: insights from atomic force microscopy and X-ray diVraction studies
Alexander J. Malkina,¤ and Robert E. Thorneb,¤
a BioSecurity and NanoSciences Laboratory, Department of Chemistry and Materials Science, Lawrence Livermore National Laboratory, Livermore, CA 94551, USA
b Physics Department, Cornell University, Ithaca, NY14853, USA
Received 24 March 2004
Abstract
The growth processes and defect structures of protein and virus crystals have been studied in situ by atomic force microscopy(AFM), X-ray diVraction topography, and high-resolution reciprocal space scanning. Molecular mechanisms of macromolecularcrystallization were visualized and fundamental kinetic and thermodynamic parameters, which govern the crystallization process ofa number of macromolecular crystals, have been determined. High-resolution AFM imaging of crystal surfaces provides informationon the packing of macromolecules within the unit cell and on the structure of large macromolecular assemblies. X-ray diVractiontechniques provide a bulk probe with poorer spatial resolution but excellent sensitivity to mosaicity and strain. Defect structures anddisorder created in macromolecular crystals during growth, seeding, and post-growth treatments including Xash cooling were charac-terized and their impacts on the diVraction properties of macromolecular crystals have been analyzed. The diverse and dramaticeVects of impurities on growth and defect formation have also been studied. Practical implications of these fundamental insights intothe improvement of macromolecular crystallization protocols are discussed.Published by Elsevier Inc.
Keywords: Macromolecular crystals; Protein crystals; Virus crystals; Structural genomics; Crystallography; Crystal growth; Growth mechanisms;Defect structure; Disorder; Two-dimensional nucleation; Atomic force microscopy; X-ray diVraction topography; High-resolution reciprocal spacescanning
1. Introduction
A detailed understanding of the function of proteins,complexes, and viruses requires knowledge of theirthree-dimensional structure. Despite enormous progressover the last decade in macromolecular production, inautomated screening, and in X-ray data collection andanalysis, the rate at which new structures are obtainedby X-ray crystallography is still largely limited by thediYculty of obtaining high-quality crystals and of main-taining their quality throughout the data collection pro-cess [1–3]. In a perfect crystal, molecules would be
¤ Corresponding authors. Fax: 1-925-422-2041 (A.J. Malkin), 1-607-255-6428 (R.E. Thorne).
E-mail addresses: [email protected] (A.J. Malkin), [email protected] (R.E. Thorne).
1046-2023/$ - see front matter. Published by Elsevier Inc.doi:10.1016/j.ymeth.2004.03.020
packed in a perfectly periodic arrangement and eachmolecule would be identical. Macromolecular crystalscan exhibit a variety of imperfections or disorder thatlimit the accuracy of molecular structure determinationsand often make structure determination impossible.Consequently, the most important objective of funda-mental studies of macromolecular crystals and theirgrowth is to identify and reduce this disorder [1–6].
To achieve this objective, we must address basic ques-tions such as: (1) How do macromolecular crystals nucle-ate and grow? (2) How do particular kinds of disorderaVect the X-ray diVraction properties? (3) What kinds ofdisorder do macromolecular crystals exhibit? (4) Whatproperties of the molecules and their interactions are mostrelevant in producing disorder? (5) What role do impuri-ties and other kinds of molecular heterogeneity present ingrowth solutions play? (6) How does disorder arise during

274 A.J. Malkin, R.E. Thorne / Methods 34 (2004) 273–299
growth, and during post-growth handling including soaks,Xash cooling, and irradiation? and (7) How can this disor-der be reduced or eliminated by proper choice of expres-sion, puriWcation, growth, and handling methods? Thesequestions parallel those that materials scientists havegrappled with for more than a half-century in their questto develop high-quality inorganic single crystals for theelectronics and optical communications industries [7].
Over the last 15 years, a number of powerful experi-mental techniques have been applied to study macromo-lecular crystals and their disorder. In this chapter, wefocus on atomic force microscopy (AFM) and on X-raydiVraction and imaging techniques. These techniques canbe applied in situ and are highly complementary. Atomicforce microscopy provides spectacular real-space resolu-tion and can directly image growth processes, individualmolecules, and defects at crystal surfaces. X-ray imagingand diVraction provide excellent reciprocal space resolu-tion and can probe mosaicity, strain, and bulk crystaldefects over the full temperature range of interest in crys-tallography. These techniques have allowed us to makesubstantial headway in addressing the above questions,with important implications for the general practice ofmacromolecular crystal growth and crystallography.
We begin in Section 2.1 with a discussion of atomicforce microscopy, emphasizing factors important tohigh-resolution in situ studies of macromolecular crys-tals. Section 2.2 describes X-ray imaging and high-reso-lution diVraction techniques. Section 3 shows how AFMhas been used to obtain a very detailed and quantitativeunderstanding of how macromolecule and virus crystalsgrow. In the remainder of the article, we focus on imper-fections or disorder in macromolecular crystals. Section4 gives a review of X-ray diVraction measures of macro-molecular crystal quality of relevance to structure deter-minations and discusses the kinds of disorder that maycontribute to each. Section 5 describes applications ofAFM and X-ray diVraction techniques to disorder cre-ated during growth, by seeding, by impurities, by post-growth treatments, and by Xash cooling. Throughoutthis article we will attempt to relate fundamental insightsto practical implications and, where possible, to methodsfor obtaining higher quality crystals. With a little experi-ence AFM and X-ray imaging can quickly provide infor-mation not readily obtained using standard biochemicaland crystallographic methods. Consequently, we antici-pate that they will become an integral part of the toolkitused to address challenging crystals and structures.
2. Description of methods
2.1. Atomic force microscopy
Because of the large diameters of macromoleculesand viruses, atomic force microscopy (AFM) allows
surfaces of growing macromolecular crystals to beimaged in situ with molecular resolution. It providesinformation about growth and perfection of macromo-lecular crystals that cannot be obtained by other physi-cal and analytical techniques. In addition to thevisualization of crystal surface morphologies, growthmechanisms, impurity eVects, and defect formation,high-resolution AFM images can provide low-resolutionphase information, which could enhance X-ray diVrac-tion analyses. For large macromolecular assemblies,AFM can provide structural information using individ-ual assemblies, without the need for crystals. When com-bined with X-ray diVraction techniques, AFM allowsdirect correlations between the growth processes, defectstructure, and diVraction properties of macromolecularcrystals to be established.
2.1.1. Principles of operationIn all atomic force microscopy instruments [8]
(Fig. 1), the sample surface is scanned with an ultra-sharp microfabricated tip mounted on the end of a Xexi-ble cantilever. Lateral and vertical movements of eitherthe tip or the sample are controlled by piezoelectric posi-tioners with sub-Ångstrom precision [8]. For studies ofbiological macromolecules and assemblies, AFMs areusually operated in either contact or tapping mode [9]. Incontact mode, the AFM tip remains in contact with thesample during the scanning, while in the tapping modethe tip oscillates a few Ångstroms above the sample sur-face, tapping it only during a short interval in its oscilla-tion cycle. In both tapping and contact modes, afeedback mechanism adjusts the vertical height of thesample (or AFM tip) using the piezoelectric positionerso as to maintain a constant tip oscillation amplitude(tapping mode) or a constant cantilever deXection (con-tact mode).
Tapping mode minimizes tip–sample interactions andgreatly reduces lateral forces. Both contact and tappingmodes have been successfully utilized to image macro-molecular crystals. Some very soft or fragile crystals,such as crystals of T D 3 icosahedral viruses, are mechan-ically damaged in contact mode and have only been suc-cessfully imaged using tapping mode. For more robustcrystals, the stronger tip–sample interactions in contactmode can cause detachment of macromolecules fromcrystalline surfaces, so that tapping mode is better suitedfor high-resolution imaging of macromolecular crystalgrowth processes.
A key parameter in tapping mode is the amplitude setpoint, which deWnes the tip oscillation amplitude to bemaintained by the feedback loop. The oscillating tip andcantilever can produce local concentration Xuctuationswhen imaging in supersaturated solutions, so the setpoint should be constantly adjusted to minimize pertur-bation of the surface structure and processes beingimaged. For tapping-mode imaging in liquid, the

A.J. Malkin, R.E. Thorne / Methods 34 (2004) 273–299 275
amplitude set point is usually gradually decreased undermanual control from an out-of-contact value that yieldsno image until a good tracing of the sample is reached.Another important parameter in tapping mode imagingis the oscillating cantilever's drive amplitude, whichshould be kept in the range of 0.3–0.5 V to avoid damag-ing the sample.
Tapping mode AFM images are typically collectedfrom height data. Height data show the change in the(sample or cantilever) piezo height needed to keep thecantilever's oscillation amplitude constant. Simulta-neous images can be collected from amplitude data,which show the changes in the cantilever's oscillationamplitude and often display the greatest contrast.
2.1.2. AFM probes, resolution, and artifactsThe sharpness and end shape of the probe tip deter-
mines the lateral structural resolution of AFM. Com-mercial AFM probes fabricated from silicon nitride(Si3N4) with spring constants of less than 1 N/m are bestsuited for imaging of macromolecular crystals. As-fabri-cated tips have radii of curvature of 20–60 nm, but oxidesharpening improves their aspect ratios and producessmaller tip radii of »5–10 nm. These sharpened AFMprobes are available from various manufacturers (Digi-tal Instruments, Asylum Research, Molecular Imaging,etc.). While probes fabricated from silicon are sharperthan silicon nitride probes, they are also much stiVer andtend to damage the relatively soft surfaces of macromo-lecular crystals.
A major technical problem that an experimentalistperforming high-resolution AFM imaging of macromo-lecular crystals faces is variation in tip properties. Thesharpness of AFM probes within the same wafer andmicrofabricated under the same conditions can vary sig-niWcantly. AFM probes can become contaminated dur-ing imaging by impurities, microcrystals, and debrisoften present in supersaturated macromolecular solu-tions. This results in poor quality or erroneous images,with features that reXect the shape of the tip or thedebris attached to it rather than the shape of the objectof interest. Double or multiple tip images of the samefeature can be formed with AFM tips having two ormore endpoints that contact the surface simultaneously.
AFM can be applied to scan crystalline surfaces rang-ing in size from less than 20 nm up to about 120�m, andwith lateral and height resolutions of about 2 and 0.1 nm,respectively. Since the size of most macromolecules (3–10 nm) and viruses (10's of nm) is comparable to orlarger than the lateral AFM resolution, AFM can beused to visualize crystallization processes in situ at themolecular level. Recent developments in fabrication ofcarbon nanotube AFM probes [10,11], which have radiiof curvature as small as »1 nm for a single walled nano-tube, and Si tip/Si3N4 cantilever AFM probes promise toimprove AFM's high-resolution imaging capabilities.
2.1.3. Sample preparationFor in situ AFM experiments, a seed crystal must be
immobilized on a substrate which is then attached to the
Fig. 1. Schematic diagram of an atomic force microscope. A laser beam is reXected from the upper surface of the cantilever and detected with a four-quadrant photodetector. Scanning takes place in a Xuid Wlled cell of about 50–75 �l volume. The sample is rastered relative to the tip by a piezoelec-tric positioner upon which the Xuid cell is mounted. The inset shows an STEM image of a cantilever tip.

276 A.J. Malkin, R.E. Thorne / Methods 34 (2004) 273–299
AFM sample base. One method is to grow seed crystalson a rough surface (e.g., frosted glass). Several crystalsoften nucleate and grow on the substrate, which makesaccurate estimates of the supersaturation during AFMobservations of subsequent growth diYcult. A bettermethod is to grow a seed crystal using either the vapordiVusion or batch techniques in a crystallization box.The seed crystal in a droplet of mother liquor is thentransferred to a substrate and can be clamped in placebeneath Xexible carbon Wbers attached to the substrate.The substrate with seed crystal should then immediatelybe mounted on the AFM base and the AFM Xuid cellsealed to prevent crystal dehydration.
Crystallization processes of a single crystal underdiVerent supersaturation conditions can be examinedby repeatedly changing the solution in the Xuid cell.Typically, the supersaturation is controlled by the mac-romolecule or the precipitant concentration. If themacromolecule's solubility is suYciently temperaturedependent, supersaturation can be varied using tempera-ture. Suitable temperature control devices are easy tobuild and commercial devices (e.g., the “environmentalhood” from Digital Instruments) are available fromAFM manufacturers.
AFM was Wrst applied to study macromolecular crys-tallization by Durbin in 1992 using crystals of lysozyme[12,13]. In the last 9 years, we have applied AFM to stud-ies of more than a dozen macromolecular systems,including crystals of soluble proteins, membrane pro-teins, nucleic acids, antibodies, ribosomes, and viruses[14–33]. Several other laboratories have also reportedAFM studies of macromolecular crystal growth [34–49].
2.2. X-ray characterization methods
An enormous variety of X-ray based techniques havebeen developed and applied to characterize disorder incrystalline materials. We focus here on two techniques—X-ray diVraction topography [50] and high-resolutionreciprocal space scanning—that have proven to be par-ticularly useful diagnostics for macromolecular crystals.
2.2.1. X-ray diVraction topographyIn standard X-ray crystallography as practiced by
macromolecular crystallographers, a crystal is illumi-nated using a focused X-ray beam to maximize the Xuxincident on the crystal, and the resulting diVraction pat-tern is recorded on a detector (CCD or image plate)placed a signiWcant distance (typically 15–35 cm) fromthe crystal. Under these illumination and detection con-ditions, the diVraction spots recorded by the detector areroughly circular, as shown in Fig. 2A. If the crystal isinstead illuminated using a highly parallel, monochro-matic X-ray beam and the diVraction pattern recordedusing a detector placed very close to the sample(Fig. 2B), then the diVracted rays from diVerent parts of
the sample will be resolved at the detector. Crudely, par-allel rays incident on the bottom and top of the samplewill diVract to nearly parallel rays that strike the top andbottom, respectively, of the diVraction spot recorded bythe detector. Under these illumination conditions, eachdiVracted spot is an image of the crystal—a two-dimen-sional projection as viewed from the spot's position onthe detector. The images thus formed are monochro-matic X-ray topographs [50].
X-ray topography resembles conventional radiogra-phy, in which the X-ray “shadow” caused by attenuationand scattering as the rays propagate through an object isrecorded by a detector placed directly behind the object.However, in topography the image is formed usingdiVracted, not transmitted, X-rays, as in dark-Weld elec-tron microscopy. Image contrast results from variationsin diVracted intensity from point to point in the crystaldue to variations in lattice plane orientation (mosaicity),spacing (strain), and X-ray absorption. X-ray topogra-phy probes bulk crystal perfection; the “topography” inthis case is of the diVracting planes within the crystal,and not of the crystal surface. It has been widely used tocharacterize small-molecule crystals, revealing disloca-tions, twins, grain boundaries, growth bands and ghosts,inclusions, and other disorder [50].
Fig. 2. (A) In conventional crystallographic diVraction, the diVractedbeam produces nearly featureless spots on the detector. (B) In X-raytopography, the incident beam is highly parallel and the diVractionpattern is recorded with a high-spatial resolution detector placed closeto the crystal. (C) Under the conditions of (B), the individual diVrac-tion spots provide images of the crystal.

A.J. Malkin, R.E. Thorne / Methods 34 (2004) 273–299 277
What are the important image contrast mechanismsin macromolecular crystals? Because macromolecularcrystals are small and weakly diVracting (i.e., they aretypically smaller than their X-ray extinction length),absorption contrast and dynamical eVects1 are generallysmall. If lattice planes in a region of the crystal arerotated, for a monochromatic incident beam they willdiVract strongly at a diVerent sample orientation angle �than the rest of the crystal, but at the same angle 2� rela-tive to the incident beam (which is set only by the latticeplane spacing). Depending on the crystal orientation �,this region will appear as a high intensity or low inten-sity region in the image. If the lattice planes in a crystalregion have a slightly diVerent spacing, they will diVractstrongly at a diVerent 2� and �. The diVracted rays fromthis strained region will not be parallel to those from therest of the crystal, and so its image will be shifted slightlywith respect to that of the rest of the crystal. The amountof the strain-related image shift �xs depends on the crys-tal to detector distance d as �xs t d�(2�). We will seethat lattice strains are small in most as-grown, untreatedmacromolecular crystals, so that mosaicity usually dom-inates image contrast.
Image sensitivity to lattice orientation variations(mosaicity) is determined by the angular divergence ��of the beam incident on the crystal (limited by the X-raysource size and the source-to-crystal distance) and by theDarwin width of the crystal. The minimum spatial reso-lution �xi of the image is determined (using ray optics)by the angular divergence �� and the detector-to-sam-ple distance d as �x� t d��, and also by the spatial res-olution of the detector �xd. On CHESS2 bend magnetstation B-2 using a double bounce Si(1 1 1) monochro-mator to select »1 Å X-rays, the beam divergence andsensitivity to mosaicity is ��» 0.003° (7� or3.5 £ 10¡5 rad). Single-coated X-ray Wlm (e.g., KodakIndustrex XR) or emulsion plates (Ilford) give�xd » 0.5–1 �m. With a typical crystal-to-Wlm distanced » 4 cm, �x� » 1.4 �m.
X-ray topography thus provides images with out-standing sensitivity to mosaicity and micrometer spatialresolution. The experimental set-up is straightforward,requiring only an unfocused synchrotron beam largerthan the crystal, a sample rotation stage, and a Wlmholder. Images can be acquired in minutes on a bendmagnet station like CHESS B-2, and in seconds on awiggler or undulator station, at any sample temperature.X-ray topography gives a quick, simple and sensitivediagnostic of bulk macromolecular crystal perfection.
1 In inorganic materials like metals and semiconductors, extinctionlengths are short and complex dynamical (multiple scattering) eVectsdominate in determining image contrast. In protein crystals, scatteringis essentially kinematic and formation of image contrast by crystal im-perfections is much more straightforward.
2 The Cornell High-Energy Synchrotron Source.
One shortcoming of the method outlined above isthat the images are 2D projections of the 3D crystal andthus lack depth information, although some depth infor-mation can be obtained by examining images formedusing diVerent reXections or crystal orientations. Betterdepth resolution can be obtained using stereo topogra-phy [50], in which a stereo image is formed using a pairof diVracted images. Even better depth resolution can beobtained using section topography [50], in which a “razorblade”-like beam is used to illuminate and thus generatean image of a thin layer of the crystal. Images of succes-sive layers can be acquired by stepping the crystalthrough the beam. Another extension of the basicmethod is phase contrast topography [51,52], in whichhigh-brilliance illumination from a third-generation syn-chrotron source is used to enhance contrast of defectssuch as dislocations. These more sophisticated methodsare all much more time consuming, and in our experi-ence more information is gained through quick examina-tion of many crystals than through detailed examinationof one. The simplest version of topography outlinedabove is the most practical diagnostic tool.
2.2.2. High resolution reciprocal space scansThe diVraction pattern is determined by the Fourier
transform of the electron density within the crystal. Ifthe crystal were perfect, the peaks in the Fourier trans-form—corresponding to the diVraction spots—would beperfectly sharp in reciprocal space and so would havesigniWcant intensity only at very well-deWned � and 2�values. Crystal imperfections and disorder broaden thesepeaks so that they are spread out in � and 2�. By mea-suring their shape in reciprocal space we can character-ize the disorder.
One way to measure the diVraction peak shape is toscan through the peak in diVerent directions. In a mosaicscan, we scan through the center of the peak along adirection perpendicular to the scattering wave vectorq D qf ¡ qi (the diVerence between the diVracted and inci-dent X-ray wave vectors). The magnitude of q is q D 2�/a, corresponding to diVraction from a set of crystalplanes with spacing a. This scan measures the distribu-tion of lattice plane orientations (variations in q's direc-tion) within the crystal. A mosaic scan is performed byrotating the crystal about the � axis while recording thediVracted intensity at Wxed 2� with an analyzer crystal orvery narrow slits placed in front of a point detector (e.g.,a scintillator/photomultiplier.
In a q scan, we scan through the center of the peakalong the scattering wave vector. This measures the dis-tribution of lattice plane spacings (variations in q's mag-nitude) within the crystal, and thus probes crystal strains.A q scan is performed by rotating both the crystal andthe detector by �� and �(2�) D 2��, respectively, andrecording the diVracted intensity with an analyzer crystalor very narrow slits placed in front of the detector. One

278 A.J. Malkin, R.E. Thorne / Methods 34 (2004) 273–299
can also raster scan across the peak, creating a full recip-rocal space map.
The resolution in mosaic and q scans is limited bythe angular divergence and energy spread of the incidentX-ray beam and by the angular acceptance of the ana-lyzer crystal. On CHESS bend magnet station C-2, usinga Si(1 1 1) double-bounce monochromator, a Si(1 1 1)analyzer crystal, and 1 Å X-rays gives a mosaic resolu-tion �� t 0.003° and a q-scan resolution �(2�) t 0.003°at 2� D 23°. The q-scan value corresponds to a strain res-olution of �q/q t �a/a t 1.4 £ 10¡4 or »0.01%.
High-resolution reciprocal space scans thus provideoutstanding resolution to mosaicity and strain. By scan-ning a small (say, 20 �m) X-ray beam across a sample, aspatial map of these two quantities (averaged over thecrystal dimension in the incident beam direction) can beproduced. However, both real space and reciprocal spacemapping are very time consuming and as argued aboveit is usually more useful to do a simple characterizationof many crystals than a detailed characterization of one.The experimental set-up required for these scans—including a six circle diVractometer—is more compli-cated than for X-ray topography, and so high resolutionreciprocal space mapping is likely to remain as aresearch tool. Fortunately, some information aboutmosaicity and strain can be obtained from standardcrystallographic diVraction analysis packages.
3. AFM studies of macromolecular crystal growthmechanisms
3.1. Growth mechanisms
AFM studies of macromolecular crystallization [12–49] show that the surfaces of macromolecular crystalsare smooth and growth proceeds layer-by-layer, with thesources of the growth layers being either two-dimen-sional (2D) nuclei or screw dislocations. In 2D nucle-ation, islands one growth layer thick nucleate on thegrowing crystal's surfaces and then grow laterally, even-tually coalescing with other 2D islands to form a com-plete growth layer. Two-dimensional nucleation (Figs.3A–C) is the dominant growth mechanism for mostmacromolecular crystals [16,18,20,25,27,33,37,48] includ-ing those of the membrane protein bacteriorhodopsin[33]. 2D nucleation is the exclusive growth mechanismfor virus crystals [14,16,23,25,27,29,33]. For other macro-molecular crystals [12,13,15,16,21,24–26,28,33–37,48], atlower supersaturations growth proceeds by molecularattachment to screw dislocations (Figs. 3D–F), with lay-ers growing as a spiral staircase around the dislocation.For a majority of these crystals, 2D nucleation typicallytakes over at relatively high supersaturations.
For most macromolecular crystals studied growth stepheights are equal to the unit cell parameter perpendicular
Fig. 3. In situ AFM images showing (A)–(C) dislocation nucleation growth and (D)–(F) dislocation growth on the surfaces of various macromolecu-lar crystals. (A) Cucumber mosaic virus (scan area: 16 £ 16 �m). (B) Glucose isomerase (11 £ 11 �m). (C) Membrane protein bacteriorhodopsin(500 £ 500 nm). (D) A combination of a stacking fault (indicated with an arrow) and two screw dislocations on the surface of a glucose isomerasecrystal (11 £ 11 �m). (E) Various single and double screw dislocations generate vicinal hillocks on the surface of canavalin crystal. Several stackingfaults are indicated with arrows (10 £ 10 �m). (F) Double screw dislocation source generates a vicinal hillock on the surface of a ribosomal 50 s sub-unit crystal (60 £ 60 �m).

A.J. Malkin, R.E. Thorne / Methods 34 (2004) 273–299 279
to the crystal face. AFM studies of crystallization oforthorhombic catalase [20], trigonal trypsin [28], andtetragonal Bence-Jones protein (BJP) [31] demonstratedthat the existence of an n-fold screw axis in a crystal'sstructure leads to the formation of growth layers of thick-ness dhkl/n on the face (h k l) perpendicular to that axis.This screw axis divides the unit cell into n symmetryequivalent layers rotated by 360°/n. For catalase crystals(with a 21 screw axis parallel to c), the step heights of the2D nuclei are 11.5§0.2 nm, which corresponds to half ofthe unit cell dimension along c. As shown in Fig. 4A, eachsuccessive layer derived from a 2D island is related by a180°, 2-fold rotation to the preceding layer. For trypsincrystals (with a 31 screw axis parallel to c), 2D nuclei form-ing successive growth layers are related by a counterclock-wise rotation of 120° with respect to the initiating nuclei ofthe preceding layer (Fig. 4B). The step heights are equal to3.2§0.5nm, which corresponds to one-third of the unitcell dimension along c. For BJP crystals (with a 43 screwaxis parallel to c), 2D nuclei are related by a rotation of90° counterclockwise with respect to the preceding layer(Fig. 4C), and the growth layer thickness of 4.6§0.2 nmcorresponds to one-third of the unit cell dimension.
Growth by symmetry related sub-layers for structureshaving screw axes perpendicular to the growing face waspredicted more than 30 years ago using the Bravais–Fri-edel–Donnay–Harker (BFDH) criterion [53]. The resultsdescribed above for crystallization of catalase, trypsin,and Bence-Jones protein together with earlier results forbarite crystals [54] are the only reported examples in thecrystallization of inorganic, organic, and biological mole-cules that demonstrate the validity of the BFDH criterion.
3.1.1. ImplicationsAFM experiments show that macromolecules, com-
plexes, and viruses with molecular weights ranging from»10 kDa to more than 103 kDa (for T D 1 and T D 3 ico-sahedral viruses) utilize all of the growth mechanismsfound in the crystallization of small inorganic andorganic molecules [7]. Consequently, fundamental andapplied concepts developed for the growth of inorganic
crystals can be successfully applied to guide optimiza-tion of macromolecular crystallization protocols.
3.2. Molecule-scale growth processes and fundamentalcrystallization parameters
Because of the large sizes of biological macromole-cules, AFM has allowed—for the Wrst time in solutioncrystallization—direct observation of the structures ofgrowth steps and the incorporation of individual macro-molecules into step edges. During crystal growth oflipase [22], thaumatin [22], lysozyme [43], turnip yellowmosaic virus (TYMV) [23], and cucumber mosaic(CMV) virus [29], advancement of growth steps proceedsby one-dimensional (1D) nucleation of kinks formed byattachment of single or multiple macromolecules to thestep edge. Subsequent lateral extension of molecularrows occurs by addition of macromolecules at the kinks.This can be seen for growth on a CMV crystal in Fig. 5,where 1D nucleation of kinks and lateral extensioninvolves individual or multiple virions. The experimen-tally determined frequencies for virion attachment andincorporation into the growth step are »2.3 £ 10¡2 s¡1.The attachment probability is »10¡2 [29], so approxi-mately one out of every 100 CMV virions that approachthe step edge incorporates into the step.
This low attachment probability is in large part dueto the low probability of a molecule/virion having thecorrect orientation for incorporation at a kink into thegrowth step. This sharply contrasts with solution-growninorganic crystals, where attachment probabilities areclose to unity [7]. T D 3 icosahedral virions such as CMVhave a high symmetry. They are connected in the surfacelayer through hexameric capsomers [55], and hence thereare 60 identical orientations for correct incorporation.This is far more than for most macromolecules, whichare then expected to have very small attachment proba-bilities. The attachment probability of thaumatin mole-cules [22], which have only one correct molecularorientation for incorporation into the tetragonal crystal,has been estimated to be »5 £ 10¡4 [29].
Fig. 4. In situ AFM images showing growth of symmetry-related 2D nuclei. (A) (0 0 1) face of an orthorhombic catalase crystal (32.5 £ 32.5 �m). (B)Symmetry-related 2D nuclei (indicated by diVerently colored ellipses) on the (0 0 1) faces of a trigonal trypsin crystal (5 £ 5 �m). (C) Symmetry-related 2D nuclei (one indicated by a half-ellipse) on the (0 0 1) face of a tetragonal Bence-Jones protein (2 £ 2 �m).

280 A.J. Malkin, R.E. Thorne / Methods 34 (2004) 273–299
For macromolecular crystal surfaces, AFM allowsdirect measurement of the supersaturation dependenciesof two-dimensional nucleation rates, tangential stepvelocities, slopes of dislocation hillocks, and critical steplengths [18,24,27,28,33,35,36]. From these data importantparameters that govern the crystallization process suchas the kinetic coeYcient of steps � and the surface energyof the step edge � can be deduced. The kinetic coeYcientis the aggregate measure of the kinetics of diVusion,adsorption, and incorporation of macromolecules, domi-nated by the rate-limiting step. Kinetic coeYcient � val-ues obtained by AFM for several macromolecules rangefrom 3.2 £ 10¡5 cm/sec for catalase [24] to 1.6 £ 10¡3 cm/sec for canavalin [36]. For solution-grown inorganic crys-tals, typical values of � are 2–4 orders of magnitudelarger [7]. This large diVerence most likely arises due tothe lower diVusivity, larger barriers for adsorption and,most important, the much smaller attachment probabili-ties for macromolecules. The value of � appears to scalewith the size of the macromolecule [36], with larger mole-cules having slower kinetics, consistent with these ideas.
Surface free energies � of the step edge measured forseveral macromolecular crystals vary from 0.3 to 0.5erg/cm2 for catalase [24], thaumatin [18], and glucose isomerase[27] to 2erg/cm2 for canavalin [36] and 5erg/cm2 for trypsin[28]. Macromolecular crystals with low surface free-ener-gies grow strictly by 2D nucleation, even at relatively lowsupersaturations. Crystals with high values of � grow viascrew dislocations, and 2D nucleation has not been
Fig. 5. AFM images of an advancing growth step on the (0 0 1) face ofa CMV crystal. Newly incorporated virions are indicated with a “+.”Images size are: (A) – (C) 670 £ 670 nm and (D) 560 £ 560 nm. Adaptedfrom [29].
observed even at the highest supersaturation values utilizedin AFM experiments. While the “raw” values of � for mac-romolecular crystals are much lower than estimated valuesfor solution-grown inorganic crystals, scaling by the molec-ular size yields comparable values, so that the surfaceenergy per molecule at the surface is comparable [5,7].
3.2.1. ImplicationsVisualization and quantitative analyses of molecular
mobility on the surfaces of macromolecular crystals areessential for quantitative understanding of molecular-scale mechanisms of crystallization and defect forma-tion. Measurements of the thermodynamic and kineticparameters governing the crystallization process allowvirtually all aspects of macromolecular crystal growth tobe quantitatively analyzed. The relative importance ofsolution transport of molecules and interfacial kineticsin diVerent crystallization geometries and set-ups can beevaluated, and the optimal crystallization regimes fornucleation and growth—which vary substantially frommacromolecule to macromolecule—can be estimated.
3.3. High-resolution imaging
As illustrated in Fig. 6A, AFM can provide molecularresolution images of the surface layers of macromolecular
Fig. 6. (A) A 200 £ 200 nm lattice resolution image of a thaumatincrystal. (B) The Fourier transform of (A), which contains high-orderreXections that extend beyond 10 Å resolution. (C)–(D) In situ AFMimages of TYMV particles immobilized in the crystalline lattice clearlydisplay capsomers on the surface of the T D 3 icosahedral virions. Thecapsomers, from both X-ray diVraction and AFM, are roughly 60 Åacross and protrude above the viral surface by about 45 Å. The scanareas are (C) 140 £ 140 nm and (D) 38 £ 38 nm.

A.J. Malkin, R.E. Thorne / Methods 34 (2004) 273–299 281
crystals [19,25,26]. In the best cases, Bragg reXectionsobtained from Fourier transforms (Fig. 6B) of raw AFMimages extend beyond 10 Å resolution. In the case oflarge viruses, AFM can resolve the gross structural fea-tures of the virions themselves. For example, Figs. 6C andD show that for turnip yellow mosaic virus (TYMV), thesurfaces of individual virions are seen with capsomers ofthe T D 3 capsids being clearly resolved [23].
3.3.1. ImplicationsInformation obtained from high-resolution AFM
images can facilitate structural studies of macromolecu-lar crystals. Such images may yield cell dimensions andthe packing of molecules within the unit cell. Molecularresolution images can be obtained from crystals withsurfaces as small as 10 �m, which often are unsuitable forX-ray diVraction studies.
For crystals with large asymmetric units, AFMimages may prove useful for deducing initial phase infor-mation for X-ray diVraction. For human viruses, whichare often refractory to X-ray crystallographic analysis,AFM can provide structural information about the viri-ons themselves as demonstrated in recent studies of her-pes simplex virus [56] and vaccinia virus [57,58].
4. X-ray diVraction measures of macromolecular crystaldisorder
We now turn to discuss imperfections or disorder inmacromolecular crystals. Macromolecular crystallogra-phers use three primary measures to characterize crystalquality: the diVraction resolution, the B or temperaturefactor, and the mosaicity [2,59]. We begin by addressingthe question: How are these parameters related to crystaldisorder?
4.1. DiVraction resolution
Compared with small molecule crystals, the diVractedintensity of macromolecular crystals fades out rapidlywith scattering angle 2� from the incident beam. For X-ray wavelengths around 1 Å, diVraction typically disap-pears beyond 2�» 15°–30°. The maximum scatteringangle (2�)max at which diVraction peak intensities can bereliably measured determines the diVraction resolutiondmin D�/2 sin[(2�)max/2]. The diVraction pattern gives themagnitudes of the Fourier coeYcients of the electrondensity within the unit cell, and the resolution corre-sponds to the highest spatial frequency (shortest wave-length) Fourier components present in the data. A small(2�)max and large dmin blurs the resulting electron densitymap, making assignment of atomic positions less accu-rate or even impossible.
The diVraction resolution depends upon several fac-tors including the overall intensity scale of the diVraction
pattern (i.e., the strength of low-angle diVraction spots);how rapidly the diVracted intensity falls oV with scatteringangle; the background diVuse or structured scatteredintensity; and the instrumental noise of the detector sys-tem. These depend in turn on crystal properties such asthe crystal volume, unit cell size, solvent content, andcharacter and extent of internal disorder; on diVractionfrom external solvent and the sample holder; on X-raybeam characteristics including the Xux and source size/divergence (combined in the brilliance), illumination spotsize and focusing; on detection optics and detectors; andon data collection parameters such as the oscillation stepsize and integration time per step. The diVraction resolu-tion also depends on the deWnition (e.g., the I/� and/orcompleteness values) used to extract it. Because so manyfactors are involved, the diVraction resolution provides apoorly deWned measure of crystal disorder, even though itis the most important parameter for crystallographers.
4.2. B factor
The B or “temperature” factor is used to characterizethe fall oV of diVracted intensity I with scattering angleusing a Wt I / exp[ ¡ 2B sin2�/�2], which appears as astraight-line on a plot of log(I) versus sin2�/�2 [59].Unlike the diVraction resolution, the overall B factor,obtained from a Wilson analysis conWned to data wellinside the resolution limit, is determined primarily by theproperties of the crystal, and can be more reliably usedto compare crystals measured in diVerent laboratories.Typical macromolecular crystal B factors range from 5 to100Å2 compared with 01 Å2 for small molecule crystals.These correspond (in a simple Debye–Waller analysis) torms atomic displacements of the order of »0.1–1 Å. Therms displacement expressed as a percent of the molecu-lar radius of gyration is »B1/2/MW1/3 (in %), where B isin Å2 and the molecular weight MW is in kDa. For MWvalues of 10, 100, and 1000 kDa and B D 20 Å2, the corre-sponding displacements are »2, 1, and 0.4% of themolecular radius. For a Wxed fractional rms displace-ment, B values should increase with MW.
Random thermal motion usually limits the B values ofsmall-molecule crystals, but is usually unimportant in mac-romolecular crystals. Instead, static or quasi-static disorderdominates, although collective conformational Xuctua-tions can increase local or anisotropic B values (obtainedfrom a full reWnement) in parts of a molecule. Improve-ments in B factors sometimes attributed to Xash coolingthe crystals are usually due to reduced radiation damage.
The B factor is essentially a measure of short-rangelattice order [60]. Crudely, it measures how far the posi-tions of each atom or molecule in a lattice deviate fromthe locally deWned average lattice orientation and spac-ing; if you know the position of an atom in a particularunit cell, it tells you how accurately you can predict itsposition in neighboring cells. It is sensitive to lattice

282 A.J. Malkin, R.E. Thorne / Methods 34 (2004) 273–299
disorder on the scale of several unit cells, and not tolong-range disorder produced by, e.g., grain boundaries,dislocations or cracks. For example, grinding a metalsingle crystal into a powder with 1000 Å grains [60,61]has almost no eVect on B; the long-range lattice order isdestroyed, but the local order within each grain is pre-served. Creating enormous dislocation densities of theorder of 1013 cm¡2 in a metal increases B to only t0.1 Å2
[61]. Similarly, in inorganic crystals such as NbC,vacancy densities of several atomic percent (roughly3 £ 1013 cm¡2) produce B factors of only 0.1 Å2 [60,62].Defects such as vacancies, interstitials, impurities, dislo-cations, grain boundaries, twins, cracks, and inclusionsproduce appreciable atomic and molecular displace-ments from the locally deWned lattice grid only in theirimmediate vicinity. For point defects like vacancies,nearly all of their eVect on B is due to displacements oftheir Wrst-nearest-neighbor molecules [60,62]. Conse-quently, the B factor is insensitive to these “conven-tional” lattice defects except when they are present atextremely high concentrations. On the other hand, subtlebut pervasive kinds of disorder common in macromolec-ular crystals such as small conformation variations (e.g.,due to Xexible loops), chemical modiWcations, and dis-placements and rotations from molecule to moleculewithin the crystal may have large eVects on B. Thesekinds of disorder cannot be identiWed in electron densitymaps because they usually do not repeat periodicallyfrom unit cell to unit cell. For example, while crystallog-raphy papers usually analyze crystal contacts, a substan-tial surface area where weak contacts must occur isusually not resolved. These disordered contact regionsmay contribute to random molecular displacements androtations.
4.3. Mosaicity
If a crystal oriented so that it diVracts strongly in aparticular reXection (direction) is rotated about an axisperpendicular to the scattering plane deWned by the inci-dent and diVracted beam, it will in general continue todiVract strongly over a Wnite range of angles ��. Themosaic width is the range of angles �� over whichthe diVracted intensity measured at a Wxed, narrowlydeWned diVracted angle 2� is within 1/2 of its maximumvalue.3 The measured mosaic width �� is a convolutionof the intrinsic width (��)i of the crystal and an instru-mental resolution (��)r. This width diVers from themosaicity parameter generated by standard analysis
3 The diVracted angle 2� is deWned using either narrow slits or ananalyzer crystal inserted between the sample and detector. A relatedquantity, the rocking width, is the range �� of strong diVracted intensi-ty measured with a broad 2� resolution (e.g., with detector slits open).Unlike the mosaic width, the rocking width has contributions fromboth mosaicity and strain.
programs like Scalepack, which includes eVects of X-raybeam crossWre and energy spread, uses a diVerent deWni-tion of peak width, and determines the intensity not at aparticular 2� but instead integrates over the whole 2�range of the reXection. As a result, the mosaicity parame-ter can be much larger than �� and (��)i when the lat-ter are small.
The mosaic width is a measure of lattice orientationalorder, i.e., of variations in the orientation of latticeplanes within the crystal. It is sensitive to disorder on abroad range of length scales. We distinguish between“macroscopic” mosaicity, in which lattice orientationvariations occur on a length scale smaller than but com-parable to the crystal size, and “microscopic” mosaicity,in which orientation variations occur on a scale ofmicrometers or smaller. Macroscopic mosaicity mayarise due to twinning, grain boundaries, sectoriality, andcracks. A single crack can produce a large mosaic width.Elastic crystal bending due to capillary forces exerted bysurrounding liquid also contributes to macroscopicmosaicity, and for Xat or needle-like crystals can be thelargest contribution to the measured ��. Microscopicmosaicity may arise from dislocations, inclusions, vacan-cies, and other microscopic disorder. Since mosaicityspreads the diVracted intensity of each reXection over arange of sample orientations ��, the intensity-to-back-ground ratio at a given orientation is reduced, degradingthe diVraction resolution. However, crystals can havelarge �� values and small B factors, provided that thedefect densities responsible for the mosaicity are notextremely high.
Fig. 7 shows examples of crystal disorder that aVect Bfactors and mosaicity. Another manifestation of disor-der is the diVuse X-ray scattering between the BraggreXections. DiVuse scattering results from microscopicdefects like vacancies and dislocations and from molecu-lar disorder such as conformation variations, displace-ments, and rotations. In rare cases where a single type ofdisorder (e.g., a particular conformational substate)dominates, information about the disorder can beextracted from the resulting structure in the diVuseintensity. More generally, this inverse process is at pres-ent all but impossible and so B factors, which are deter-mined by largely the same kind of disorder, are a moreconvenient measure of crystal quality.
5. Disorder in macromolecular crystals: Character, origin,and remedies
The combination of atomic force microscopy and X-ray diVraction techniques described in Section 2 hasprovided detailed insight into the nature and origin ofdisorder in macromolecule and virus crystals. As weemphasize below, these insights have several practicalimplications for how these crystals can be improved.

A.J. Malkin, R.E. Thorne / Methods 34 (2004) 273–299 283
5.1. Imaging macromolecular crystal disorder by X-raytopography
X-ray topography has been used by several groups[51,63–70] to study disorder in macromolecular crystals.Fig. 8 shows topographs obtained for a selection of modelmacromolecules [67], where dark regions correspond to
Fig. 7. Examples of crystal disorder. (A) Molecular positional (ther-mal-like) disorder, (B) orientational disorder, and (C) conformationaldisorder all have strong eVects on B but little eVect on mosaic widths.(D) Grain boundaries and dislocations have strong eVects on mosaicwidths but little eVect on B, because short range lattice order is pre-served in most of the crystal.
strong diVracted intensity. Each image is a single diVrac-tion spot, which under the parallel illumination conditionsused has the shape of the crystal's 2D projection. Crystalsof lysozyme (Fig. 8A), ferritin, and insulin typically yieldfeatureless images with sharply deWned crystal edges, sug-gesting that they are relatively free of dislocations, cracks,and other extended defects. Crystal damage caused byhandling produces characteristic patterns (Fig. 8B) ema-nating from the crystal surface that are easily distinguishedfrom other kinds of disorder. Many crystals such as thoseof canavalin (Fig. 8C) show dislocations visible as linesthat radiate out along major crystallographic directionsand that are typically normal to crystal facets. The pres-ence of these dislocations correlates with increased mosaic-ity. The small segment of a catalase crystal in Fig. 8Dshows a microcrystal that sedimented onto the crystal sur-face and was incorporated during growth, a process thathas been directly observed by AFM (Section 4 andFig. 12C). Fig. 8D also shows the dramatic eVect of bend-ing of this rod-like crystal on its mosaicity: although theentire millimeter length of the crystal (oriented vertically inFig. 8(D)) was illuminated by the X-ray beam, only thesmall segment visible has a strongly diVracting orientation.
5.2. “Microscopic” versus “macroscopic” mosaicity
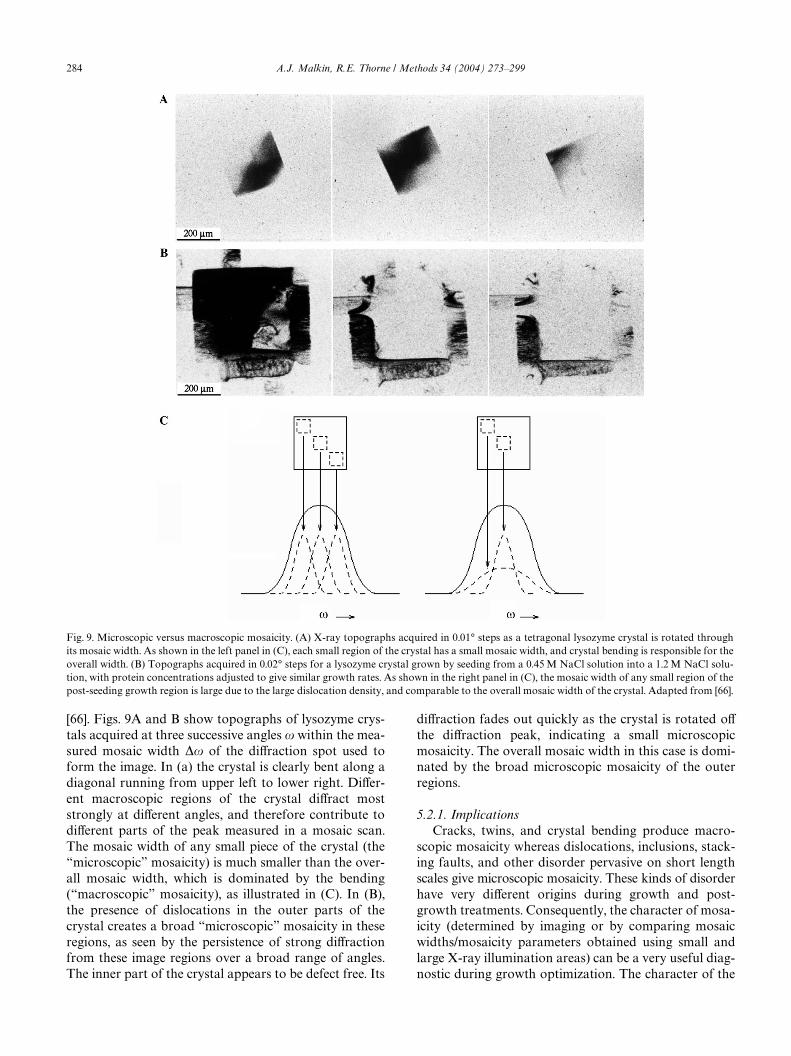
Fig. 9 shows how X-ray topography can be used toascertain the origin and character of crystal mosaicity
Fig. 8. Examples of X-ray topographs. Dark regions correspond tostrong diVracted intensity. (A) A tetragonal lysozyme crystal. (B) Aseed-grown lysozyme crystal. The curved dark band in the lower rightis due to incidental contact during handling. (C) A canavalin crystalwith dislocations. (D) A catalase crystal with an incorporated micro-crystal (indicated by the arrow). Adapted from [67].
284 A.J. Malkin, R.E. Thorne / Methods 34 (2004) 273–299
[66]. Figs. 9A and B show topographs of lysozyme crys-tals acquired at three successive angles � within the mea-sured mosaic width �� of the diVraction spot used toform the image. In (a) the crystal is clearly bent along adiagonal running from upper left to lower right. DiVer-ent macroscopic regions of the crystal diVract moststrongly at diVerent angles, and therefore contribute todiVerent parts of the peak measured in a mosaic scan.The mosaic width of any small piece of the crystal (the“microscopic” mosaicity) is much smaller than the over-all mosaic width, which is dominated by the bending(“macroscopic” mosaicity), as illustrated in (C). In (B),the presence of dislocations in the outer parts of thecrystal creates a broad “microscopic” mosaicity in theseregions, as seen by the persistence of strong diVractionfrom these image regions over a broad range of angles.The inner part of the crystal appears to be defect free. Its
diVraction fades out quickly as the crystal is rotated oV
the diVraction peak, indicating a small microscopicmosaicity. The overall mosaic width in this case is domi-nated by the broad microscopic mosaicity of the outerregions.
5.2.1. ImplicationsCracks, twins, and crystal bending produce macro-
scopic mosaicity whereas dislocations, inclusions, stack-ing faults, and other disorder pervasive on short lengthscales give microscopic mosaicity. These kinds of disorderhave very diVerent origins during growth and post-growth treatments. Consequently, the character of mosa-icity (determined by imaging or by comparing mosaicwidths/mosaicity parameters obtained using small andlarge X-ray illumination areas) can be a very useful diag-nostic during growth optimization. The character of the
Fig. 9. Microscopic versus macroscopic mosaicity. (A) X-ray topographs acquired in 0.01° steps as a tetragonal lysozyme crystal is rotated throughits mosaic width. As shown in the left panel in (C), each small region of the crystal has a small mosaic width, and crystal bending is responsible for theoverall width. (B) Topographs acquired in 0.02° steps for a lysozyme crystal grown by seeding from a 0.45 M NaCl solution into a 1.2 M NaCl solu-tion, with protein concentrations adjusted to give similar growth rates. As shown in the right panel in (C), the mosaic width of any small region of thepost-seeding growth region is large due to the large dislocation density, and comparable to the overall mosaic width of the crystal. Adapted from [66].

A.J. Malkin, R.E. Thorne / Methods 34 (2004) 273–299 285
mosaicity is also important during data collection. Ifmacroscopic mosaicity dominates, then the diVractionsignal-to-noise and spot overlap can be improved byconcentrating the incident Xux onto a smaller region ofthe crystal. If microscopic mosaicity dominates, the inci-dent beam size will have less eVect.
5.3. Mosaicity and strain in as-grown crystals
Mosaic scans performed on as-grown lysozyme, ferri-tin, and insulin crystals that do not show visible cracksyield extremely small mosaic widths of 0.005° or less [63–73], comparable to the instrumental resolution providedby silicon monochromator crystals. Measured mosaicwidths for uncracked crystals of most other macromole-cules studied to date are less than 0.02°. q scans per-formed on lysozyme [66] and ferritin crystals yieldresolution-limited peaks with widths of �(2�)IR t
0.003°. This limit indicates that the strain distribution(corresponding to the distribution of lattice spacings)has a width of less than 0.02%.
5.3.1. ImplicationsAs-grown macromolecular crystals that are not
twinned or cracked generally have extremely smallmosaic widths, so that diVraction peak signal-to-noise atroom temperature can be maximized by using highlyparallel X-ray illumination and Wne phi slicing duringdata collection. Measured mosaicity parameters of Xashcooled crystals (0.1–1°) are completely dominated bypost-growth crystal damage. Typical strains in as-growncrystals—including cracked crystals—are negligiblysmall and cannot, for example, account for growth ces-sation. Large strains exist in the immediate vicinity ofcracks, dislocations, impurities, vacancies, and otherdefects, but unless their densities are very high the aver-age of the strain's magnitude over the crystal volume istiny. For this reason, a crystal can have a large mosaicityand a tiny average strain.
5.4. Molecular resolution imaging of disorder by AFM
X-ray diVraction techniques, although having excel-lent sensitivity to mosaicity and strain, provide poor spa-tial resolution. AFM trades sensitivity to mosaicity andstrain for excellent spatial resolution, and can thus seemany crystal defects invisible in X-ray diVraction. AFMstudies of macromolecular crystals [17,25,26,33] haverevealed a wide variety of defects that parallel thosefound in inorganic crystals. These include zero-dimen-sional (point) defects such as vacant sites (vacancies) andimpurity molecules in the crystalline lattice (Fig. 10); one-dimensional (linear) defects such as dislocations (Figs. 3and 11); and two-dimensional (surface) defects such asstacking faults and grain boundaries (Fig. 11). Mostmacromolecular crystals that grow by two-dimensional
nucleation and all virus crystals show no dislocations.Total densities of point defects and dislocations for avariety of macromolecular crystals are in the range of104–106 cm¡2 [17].
Three-dimensional (volume) defects shown in Figs.12(A)–(D) such as inclusions, precipitates, and incorpo-rated microparticles are common in macromolecularcrystals. At the high supersaturations typically used inmacromolecular crystallization, microcrystals can formin the bulk solution, sediment onto the surfaces of grow-ing crystals, and then become engulfed by the advancinggrowth layers. These incorporated microcrystals are notvisible in optical microscopes and can exist at high densi-ties in well-faceted crystals. Other macroscopic inclu-sions are produced by the incorporation of foreignparticles and of Wbers of microbial origin (Figs. 12E andF. These volume defects often result in formation of dis-locations and other defects that introduce both local andlong-range crystal disorder, at densities much higherthan the densities of the volume defects that cause them.
5.4.1. ImplicationsPoint defect densities per unit area required to pro-
duce a given B factor scale as the fourth power of the
Fig. 10. (A) Point defects in the crystalline lattice of CMV crystals.Two empty lattice sites (indicated with arrows) formed by missing viri-ons (3.4 £ 3.4 �m). (B) Vacancies of by one or more unit cells (indi-cated with arrows) on the surface of a thaumatin crystal(540 £ 540 nm). (C) Incorporation of abnormal CMV virions withdiameters in the range of 22–26 nm (indicated with arrows) results indefect formation. (D) Incorporation of two abnormally large virionsinto the crystalline lattice. Anomalous particle incorporation can pro-ceed either without visible defect formation, as in the example indi-cated by a white arrow, or with the formation of a point defect (wherea black arrow indicates the aberrant particle).

286 A.J. Malkin, R.E. Thorne / Methods 34 (2004) 273–299
lattice constant [66]. Observed macromolecular crystal Bfactors of 5–100 Å2 would require point defect densitiesof at least several molecular percent, or roughly 109–1010
cm¡2. Consequently, the point defect densities typicallyobserved in macromolecular crystals are too small toaccount for their B factors. On the other hand, large den-sities (»106 cm¡2) of incorporated microcrystals areobserved in catalase crystals grown at relatively highsupersaturations [20]. These crystals diVract to relativelylow resolution of »2.8–3.0 Å, but reducing the supersat-uration to minimize formation of microcrystalsimproves the diVraction resolution to »2.3–2.5 Å. Exces-sive supersaturation levels should be avoided to mini-mize formation and incorporation of microcrystals, evenif this results in a crossover from dislocation-free growthby 2D nucleation to dislocation-mediated growth. Whenfeasible, macromolecule and precipitant solutions
should also be centrifuged and/or Wltered immediatelyprior to crystallization to remove precipitate and foreignparticles.
5.5. Origin of macrosteps on crystal surfaces
Macrosteps as shown in Figs. 13 and 14A and B areoften observed on the surfaces of macromolecular crys-tals and result from bunching and cessation of motion ofadvancing growth steps. More generally, step bunchingand related morphological instabilities produce defectsin inorganic and macromolecular crystals such as liquidinclusions and optically visible growth bands or “veils”containing diVerent defect densities (also discussed inSection 6) [5,7,74]. Interferometric studies of lysozymecrystallization reveal signiWcant Xuctuations in growthrates and in local vicinal slopes [75]. These Xuctuations
Fig. 11. (A) Stacking faults (one indicated with an arrow) on the surface of a canavalin crystal, (80 £ 80 �m). (B) Stacking fault (indicated with anarrow) on the surface of a trypsin crystal (40 £ 40 �m). (C) Domain boundary on the surface of a CMV crystal (2.25 £ 2.25 �m).
Fig. 12. Incorporation of microcrystals from solution into growing crystals. (A) Thaumatin (3 £ 3 �m). (B) Canavalin (20 £ 20 �m). (C) A catalasecrystal etched to reveal the embedded microcrystals (42 £ 42 �m). (D) Etched BJP crystals revealing particles (indicated with arrows) with sizes in therange of 10–200 nm (15 £ 15 �m). (E and F) Adsorption of Wlaments on of crystalline surfaces (E) catalase (8 £ 8 �m); and (F) thaumatin (5 £ 5 �m).

A.J. Malkin, R.E. Thorne / Methods 34 (2004) 273–299 287
were suggested to occur through the formation anddecay of step bunches that originate from the couplingof bulk transport with nonlinear interface kinetics [75].As shown in Figs. 14C–F, AFM studies of several mac-romolecular crystals including lysozyme [24] have onlyobserved step bunching due to two- or three-dimen-sional nucleation on the terraces of vicinal slopes, or dueto uneven step generation by complex dislocationsources. No step bunching arising from the interactionof individual steps has been observed.
5.5.1. ImplicationsAt high solution supersaturations, multilayer stacks are
formed when macromolecule-rich droplets, which appearin bulk concentrated macromolecular solutions due to
Fig. 13. A tetragonal lysozyme crystal grown from a solution contain-ing 2% w/w ovotransferrin, showing macrosteps on its surface.Adapted from [78].
density Xuctuations, adsorb onto the crystalline surface.These multilayer stacks cause macrosteps and step bunch-ing on the crystal surfaces. Macrosteps trap impuritiesdiVerently than single steps, resulting in bands with diVer-ent defect densities in the growing crystal. Together withliquid inclusions—another product of morphologicalinstabilities, macrostep-related disorder can aVect thediVraction properties of macromolecular crystals. Exces-sive supersaturation levels should be avoided to minimizeformation of 3D protein-rich clusters in the bulk solutionand their adsorption onto the crystalline surfaces.
5.6. Seeding and solution variations during growth
Macromolecules are very sensitive to their chemicalenvironment. Changes in pH, salt concentration, temper-ature, and other parameters can induce signiWcantchanges in macromolecular conformation and hydration.These also aVect crystal unit cell parameters, solventcontent, and growth kinetics. As a result, macromolecu-lar crystals can be sensitive to changes in growth condi-tions during growth.
This sensitivity should be particularly evident whencrystals are seeded to a new solution. For example, invapor diVusion growth [1], the concentrations of all dropcomponents typically change by a factor of 2 or more asthe drop equilibrates with the well. If a vapor-diVusiongrown crystal is seeded into a solution with concentra-tions close to the initial values of its drop, the change inits solvent content, packing, and growth kinetics can bedramatic.
Fig. 14. Macrosteps (indicated with arrows) on crystalline surfaces. (A) Glucose isomerase (70 £ 70 �m). (B) Thaumatin (3 £ 3 �m). (C–F) Sequenceof 20 £ 20 �m AFM images taken at (C) 0, (D) 9, (E) 17, and (D) 60 min showing advancement of a step train on the surface of a thaumatin crystal.A 2D nucleus (indicated with an arrow) appears on the terrace in (C) and forms a step bunch (indicated with arrows) in (D) and (E).

288 A.J. Malkin, R.E. Thorne / Methods 34 (2004) 273–299
X-ray topographs of lysozyme crystals grown bymacroseeding to conditions diVerent from their motherliquor usually show a signiWcant diVerence in diVractedintensity at the boundary between the seed and the post-seed growth region [66]. This intensity diVerence indi-cates a diVerence in crystal mosaicity, strain and order.Optical images show a striation or “veil” at the bound-ary, arising from changes in refractive index caused bythe increased disorder [64,76]. The overall crystal mosaicwidth usually diVers little from crystals grown withoutmacroseeding, suggesting that the disorder is largelyconWned to the seed boundary. Fig. 15 shows a lysozymecrystal subjected to a large (»0.75 M) change in salt con-centration that, due to incomplete mixing, produced pro-tein-rich droplets (liquid–liquid phase separation [1])that dissipated within 20 min after the change. In thiscase, the surface of the seed is covered with solvent inclu-sions (dark blobs), and dislocations (dark lines) radiateoutward from the seed and normal to the crystal facets.Mosaic scans show a width roughly three times larger(»0.013°) than for unseeded crystals, and broad tailsthat extend out a ten of a degree [66]. As shown in thesequence of topographs acquired from the same crystalin Fig. 9B, these tails and the mosaic broadening are dueto disorder in the post-seeding growth region.
Many mechanisms can produce disorder at the seedboundary and in the post-seed growth region [5,7]. Thechange in solution conditions upon seeding will causesurface nucleation rates, step velocities, and growth ratesto Xuctuate as concentration and convective Xow pro-Wles evolve towards their (quasi) steady-state. This canlead to growth step bunching, enhanced impurity incor-poration, and inclusion formation (as discussed in Section5 above), especially in the early stages of growth on theseed. This is consistent with the increased mosaicity andchange in optical refractive index observed just outside theseed boundary. The change in solution conditions maylead to formation of precipitate, microcrystals, or macro-molecule-rich droplets. When these are encountered by
Fig. 15. An X-ray topograph of a lysozyme crystal grown by seedingfrom a 0.45 M NaCl solution into a 1.2 M NaCl solution, with proteinconcentrations adjusted from 61 to 11 mg/ml to give similar growthrates. The abrupt change in growth conditions creates inclusions (darkblobs) and dislocations that run along the �1 1 0� crystallographicdirections. See also Fig. 9B. Adapted from [66].
the growing crystal's surface they form inclusions, andmistakes when the lattice is closed around the inclusionsgenerate dislocations, as is observed in Fig. 15. Changesin solution conditions may also change the equilibriumsolvent content, lattice constant, and even molecularconformation of the seed, and disorder may result asnew growth layers are added while the seed responds toits new environment. The 0.75 M change in salt concen-tration in (b) should have changed the lattice constantby 0.2% and the linear dimension of the crystal by0.8 �m. This salt concentration change is large, but manymacromolecular crystals—especially those with high sol-vent contents—are far more sensitive to changes in solu-tion conditions than are those of lysozyme.
5.6.1. ImplicationsAfter seeding crystal mosaicity may degrade, cracks
or polycrystals may form, and pronounced optical“veils” may be observed at the seed boundary. To reducethese eVects, diVerences in solution conditions betweenthe seed's mother liquor at the time the seed is removed,any rinse solution, and its Wnal growth solution shouldbe minimized. Increases in precipitant and/or macromol-ecule concentration needed to sustain growth after seed-ing can be induced gradually by, e.g., vapor diVusion,dialysis, or a slow temperature change.
5.7. Impurity eVects: cracking and poly-crystals
Growth solution purity is among the most importantfactors aVecting the success of crystal growth experi-ments [1–3]. Macromolecular solutions may containimpurity concentrations of up to several percent. “Impu-rities” may include structurally unrelated molecules thatremain after puriWcation, structurally related geneticvariants of the host molecule, variants produced by post-translational modiWcations, chemically identical confor-mational variants, and oligomers. These impurities canhave profound eVects on solubility, nucleation, growthkinetics, crystal habit, and crystal morphology, and canpromote the creation of dislocations, cracks, and otherdisorder that can signiWcantly degrade diVraction prop-erties [77]. How do impurities create crystal disorder?
Fig. 16A shows an X-ray topograph of a lysozymecrystal grown from a solution containing 5% w/w ovo-transferrin [78], a common impurity in commercial lyso-zyme. Ovotransferrin has a MW of 78 kDa, roughly Wvetimes larger than lysozyme, and a radius of gyrationroughly 70% larger. The complex contrast pattern (andcorresponding broad mosaic width) is due to micro-cracks formed during growth. At ovotransferrin concen-trations above 5% w/w only polycrystals are observed,and no nucleation has been observed above 20% w/w.
Fig. 16B shows a two-photon excitation Xuorescencemicrograph [79] of a plane passing through the nucleusof a cracked lysozyme crystal grown from a solution

A.J. Malkin, R.E. Thorne / Methods 34 (2004) 273–299 289
containing »5% w/w of Xuorescently labeled ovotrans-ferrin [78]. The impurity concentration (indicated bybrightness) in the crystal core is more than 10 timeslarger than the concentration in surrounding regions.Since ovotransferrin is much larger than lysozyme, whenit incorporates it increases the average lattice constant,and when its concentration varies it produces inhomoge-neous lattice strains. The large inhomogeneous stressescaused by the impurity-rich core are responsible for thecracking.
Impurity incorporation is enhanced in crystal coresbecause, during the early stages of growth, both thesupersaturation of the undepleted solution and thegrowth rate are much larger. As a result, impurities thatadsorb onto the surface of the growing nucleus are bur-ied by advancing growth layers before they have time todesorb [5,7,80]. As the crystal grows and growth ratesdecrease, impurity incorporation drops. Fig. 16C showsan X-ray topograph of a lysozyme crystal grown byplacing a pure seed in a solution containing 20% w/wovotransferrin [78]. Spontaneous nucleation at such highovotransferrin concentrations produces only polycrys-talline balls. Aside from increased disorder at the surfaceof the seed, the crystal in (C) is highly perfect and crack-free, and has a mosaic width comparable to that of
Fig. 16. (A) X-ray topograph of a tetragonal lysozyme crystal grownfrom a solution containing 5% w/w ovotransferrin. (B) Two-photon-excitation Xuorescence microscopy image of a plane passing throughthe core of a lysozyme crystal grown from a solution containing »5%w/w labeled ovotransferrin. Intensity corresponds to impurity concen-tration. In both (A) and (B) extensive cracking is observed. (C) X-raytopograph of a lysozyme crystal grown by seeding a pure crystal(whose boundary is indicated by the arrow) into a solution containing20% w/w ovotransferrin. (D) Two-photon Xuorescence image of aplane passing near the core of a lysozyme crystal grown by seeding apure crystal into a solution containing 0.5% labeled ovotransferrin and4.5% unlabeled ovotransferrin. Impurities are only present in the post-seed growth region. Adapted from [78].
crystals grown from pure solutions. Fig. 16D shows atwo-photon Xuorescence micrograph through the coreof a crystal grown from a pure seed in a solution con-taining 0.5% labeled ovotransferrin and 4.5% unlabeledovotransferrin. Crystals nucleated in such solutions usu-ally crack and yield topographs as in (A). Seeded crystalsare generally perfect, even though the concentration oflabeled ovotransferrin outside the seed is comparable tothat in unseeded crystals. Stresses due to lattice mis-match between the ovotransferrin-free seed and the“extra-seed” region are taken up by defect formation ininitial post-seeding growth layers.
Nonuniform impurity incorporation, stresses, andcracking/disorder can also result due to crystal sectori-ality [5,7,76,78,80]. Fig. 17A shows the typical growthhabit of a tetragonal HEWL crystal, which is formedby a combination of prismatic (1 1 0) and pyramidal(1 0 1) faces [76,78]. DiVerent parts of the molecule areexposed on each type of face, so that each provides adiVerent set of contacts to an impinging lysozyme orimpurity molecule. The shaded regions in Figs. 17Aand B indicate the two inequivalent types of growthsectors, formed by addition of molecules to these twotypes of faces. Because the faces are chemically
Fig. 17. (A) Growth habit of tetragonal lysozyme. The dark shadedregion is one of eight growth sectors formed by addition of moleculesto (1 0 1) faces. The light shaded region is one of four growth sectorsformed by addition of molecules to (1 1 0) faces. (B) Growth sectorstructure in a plane through the crystal center and parallel to a (1 1 0)face. (C) and (D) Two photon Xuorescence images of the correspond-ing plane in lysozyme crystals grown from solutions containing 0.5%labeled ovotransferrin. Impurities preferentially incorporate on the(1 0 1) faces/in the (1 0 1) sectors and at the interface between growthsectors. The curvature of the growth sector interfaces is due to varia-tions in relative face growth rates with supersaturation. Shadowing onthe left side of the crystal in (C) is due to reXection from crystal facetsabove the imaged plane. Adapted from [78].

290 A.J. Malkin, R.E. Thorne / Methods 34 (2004) 273–299
inequivalent, impurity concentrations in the two typesof growth sectors are diVerent, creating stresses thatdrive defect formation along sector boundaries andthat in extreme cases can drive crystal cracking.Fig. 17B shows the growth sector structure in a thinslice passing through the crystal center and parallel to a(1 1 0) face. Figs. 17C and D show two-photon Xuores-cence micrographs of corresponding slices through thecores of lysozyme crystals grown from a solution con-taining 0.5% labeled ovotransferrin. Ovotransferrinincorporates more strongly in the (1 0 1) growth sec-tors, and along the interfaces between growth sectors.The latter may be due to growth instabilities and crys-tal disorder caused by lattice mismatch and stresses atthe sector interfaces.
5.7.1. ImplicationsEnhanced impurity incorporation during the early
stages of postnucleation growth produces many of themisshapen, cracked and poly-crystals observed incrystallization experiments. In vapor diVusion andrelated growth methods, more gradual supersaturationincreases—which promote nucleation at lower supersat-urations—should reduce core impurity concentrationsand cracking. Macroseeding can be used to obtain high-quality crystals from highly impure solutions, butmicroseeding with crystals smaller than »30 �m (theimpurity-rich core size observed in experiments [78,80])likely will not help unless the solution supersaturation issubstantially reduced. Cracking and other growthdefects also result from diVerences in impurity incorpo-ration between diVerent growth sectors within a crystal.PuriWcation or selecting a diVerent crystal form havingsmaller sectorial concentration diVerences can reduce oreliminate these defects. Most impurities incorporate lessreadily than the host macromolecule, so puriWcation canachieved by repeated crystallization. Because of largecore impurity concentrations, separations can beimproved by allowing crystals to grow larger before har-vesting and redissolution.
5.8. Impurity eVects: resolution degradation
High-resolution AFM imaging as illustrated in Figs.18A and B allows impurity molecules adsorbed on thesurfaces of growing macromolecular crystals to bedirectly observed. Impurity incorporation can sometimesbe directly correlated with the diVraction properties.Canavalin crystals [81] can show large impurity densitieson their surfaces, and growth steps exhibiting extremeroughness, as indicated in Figs. 18A and C. After addi-tional growth solution puriWcation (Fig. 18D), the sur-face impurity density is reduced and growth step spiralsaround screw dislocations become polygonal withstraight edges. The diVraction resolution increases from12.8 to 2.0 Å.
5.8.1. ImplicationsGrowth solution purity is one of the most important
factors determining macromolecular crystal quality.However, many growth solution impurities do notappreciably adsorb on crystal surfaces and have littleeVect on crystallization. AFM provides an excellent andfast diagnostic tool for directly visualizing “problemimpurities” and their eVects on crystal growth, and insome cases (e.g., lysozyme dimers in crystallization oflysozyme [42]) allows them to be directly identiWed.
5.9. Impurity eVects: cessation of growth
In nearly all macromolecular crystal growth tech-niques [1], the macromolecule concentration and solu-tion superaturation eventually decrease as the crystalsgrow. In inorganic crystal growth, as supersaturationdecreases, impurity adsorption and surface densityincrease. Impurities impede the motion of growth steps,and at suYciently large coverage step motion stops com-pletely and growth ceases [7]. AFM studies on crystals ofseveral macromolecule and virus crystals show that this“impurity stopper” mechanism is responsible for irre-versible growth cessation of macromolecular crystals[24].
Figs. 19A and B show the surfaces of crystals whichwere grown by batch or vapor diVusion methods, placedin the AFM Xuid cell with supersaturated solutions, and
Fig. 18. Visualization of adsorbed impurities on the surface of macro-molecular crystals. (A) Glucose isomerase (5.5 £ 11 �m). (B) Hexago-nal canavalin (1.8 £ 1.8 �m). (C) and (D) Surface morphology and steproughness for rhombohedral canavalin crystals grown from (C) unpu-riWed and (D) puriWed solutions. Scan areas are (C) 20 £ 20 �m and(D) 18 £ 18 �m.

A.J. Malkin, R.E. Thorne / Methods 34 (2004) 273–299 291
allowed to grow further until growth cessation occurred.The surfaces in each case are completely covered by alayer of adsorbed impurities. As shown in Figs. 19(C)and (D), if this impurity “shield” was partially removedby scratching the surface with the AFM tip, growth stepsappeared and growth resumed.
In general crystallization practice [1], small crystalsthat have stopped growing are often seeded into “fresh”supersaturated solutions, and yet more often than notthe seeds fail to grow larger. But if the crystals arecracked into pieces before seeding, growth occurs on thefresh surfaces. AFM observations clearly indicate thatthe presence of an impurity adsorption layer is the majorreason for the frequent failure of seeding.
How does the “impurity stopper” mechanism causecessation of growth of macromolecular crystals? Whenthe Wrst (3D) crystalline nucleus forms in a drop, thesupersaturation is large and uniform and growth ratesare high. As long as the typical adsorption time ofadsorbed impurities is greater than the time a growthlayer is exposed during deposition of consecutive layers,the few adsorbed impurities will be buried by advancinggrowth steps. The growing crystals gradually deplete themacromolecule concentration and decrease solutionsupersaturation, increasing the exposure time and impu-rity coverage of growth layers. Eventually impurity
Fig. 19. Surfaces of: (A) a CMV crystal and (B) a xylanase crystal arecompletely covered by an impurity adsorption layer, resulting in cessa-tion of growth. On the surface of the xylanase crystal this layer waspartially scratched and removed by the AFM tip, which revealedgrowth steps (C) which had been buried under the impurity adsorptionlayer. In (D) a newly formed two-dimensional nucleus signals resump-tion of growth. The scan areas for the AFM images are: (A)450 £ 450 nm; (B) 8 £ 8 �m; (C) 15 £ 15 �m; and (D) 15 £ 15 �m.
adsorption may result in a suYcient surface concentra-tion of impurity stoppers that growth steps cannot pro-gress and growth stops. This produces a “dead zone”[7,18,24] in the growth rate versus supersaturation rela-tion; below an impurity-concentration-dependent criti-cal supersaturation the growth rate is zero.
AFM studies of Bence-Jones protein (BJP) crystalliza-tion provide a detailed picture of this process [32]. Asgrowth proceeds in the AFM cell and supersaturationdecreases, impurity adsorption increases and growth stepvelocities decrease until complete growth cessation dueto an impurity adsorption layer is observed. Growth doesnot resume on the poisoned crystalline surface even atrelatively high supersaturations, and at low undersatura-tions dissolution does not occur. As shown in Fig. 20, athigher undersaturations etch pits form and grow, eventu-ally leading to complete removal of the impurity-poi-soned layer. Foreign particles incorporated in the volumeof the crystal with sizes in the range of 10–200 nm(Fig. 12D) appear to be the sources of the etch pits.
During dissolution, the etch pit bottoms appear to befree of impurities and show ‘classic' layer-by-layer disso-lution (Fig. 20C). If a partially dissolved surface isexposed to supersaturated conditions, growth by 2D
Fig. 20. Time sequence of tapping mode in situ AFM amplitude andheight (insets) images, taken at (D) 0, (B) 17, (C) 62, and (D) 104 minshows the response of an impurity blocked (0 0 1) BJP crystal face toundersaturated conditions. The largest part of the face is resistant toundersaturation (as well as to supersaturation), while at some pointsetch pits develop perpendicularly and laterally. The white arrow indi-cates a two-dimensional island which neither grew nor dissolved undergrowth and dissolution conditions, respectively. The etch pits expandlaterally by underetching of the top dissolution-resistant layer. Thetopography insets show the deepening of the etch pits relative to thetop, resistant layer.

292 A.J. Malkin, R.E. Thorne / Methods 34 (2004) 273–299
nucleation resumes on the impurity-free Xat surfaces ofthe etch pits but not on the impurity-poisoned surfaces(Fig. 21). This Wlling in of the pits continues until thelevel of the impurity-poisoned surface is reached(Fig. 21C). Subsequent growth on these regions pro-duced square 3D stacks that initially rise above theimpurity covered surface and then spread laterally untilthey cover and incorporate the impurity adsorptionlayer (Fig. 21D). This results in formation of an essen-tially impurity-free crystalline surface (Fig. 21F), whichcontinues to grow as long as the supersaturation is main-tained.
For some macromolecular crystals (e.g., catalase,STMV), AFM observation after growth cessation didnot show an impurity adsorption layer, and growthimmediately resumed when solution supersaturation wasincreased. Growth by 2D nucleation requires a criticalsupersaturation to nucleate the 2D islands on the previ-ous growth layer. For dislocation-free crystals, growthcessation can occur when macromolecule depletion bygrowing crystals drops the supersaturation below thiscritical value. Dislocation growth requires much lowersupersaturations compared with growth by 2D nucle-ation, but a suYcient coverage of impurity stoppers isstill eVective in stopping growth step motion and overallgrowth as the solution becomes depleted. If impuritiesdo not adsorb and cover the surface while growth isstopped, growth can be resumed by increasing the super-saturation.
5.9.1. Implications“Terminal” growth cessation of macromolecular
crystals is caused by impurity adsorption and growthsurface poisoning when the solution supersaturationfalls below an impurity-concentration-dependent value.For some macromolecular systems, regular cycles of rel-atively short periods of undersaturation to removeadsorbed impurities followed by longer periods of super-saturation may revive and sustain growth as described in[32]. This approach has been shown to be successful forgrowth of macromolecular crystals by the dialysis [82]and batch growth techniques [83]. In seeding experi-ments, only microcrystals that are still growing should beused. To prevent growth cessation, fresh solution shouldbe added early and often.
5.10. Unusual defect structures
All of the macromolecular crystal defects discussed sofar are also commonly observed in inorganic and smallmolecule crystals. However, some unusual kinds of dis-order are also observed. As illustrated in Fig. 22, the(0 0 1) face of cucumber mosaic virus (CMV) is com-prised of domains that are crystallographically misori-ented with respect to one another [29]. Domain sizesrange from 0.2 to 50 �m2. AFM observations indicatethat on the (0 0 1) faces, new 2D nuclei of CMV virionsbind in arbitrary positions relative to the preceding crys-talline layer, rather than stacking like billiard balls. This
Fig. 21. Time sequence of tapping mode in situ AFM amplitude and height (insets) images, taken at: (A) 17, (B) 40, (C) 70, (D) 105, (E) 112, and (F)115 min shows the response of an impurity blocked {0 0 1} BJP crystal face to supersaturated conditions. Growth initially does not occur on the por-tions of the original impurity-blocked surface that did not dissolve during undersaturation. 2D nucleation occurs on the bottom of the etch pits. Theetch pits are reWlled (A–C), and then the pits turn into islands (C and D), and these eventually merge to form a perfect crystal lattice (E and F). Scanareas are: (A) 10 £ 10 �m; (B) 4 £ 4 �m; (C–E) 5 £ 5 �m; and (F) 4 £ 4 �m. Adapted from [32].

A.J. Malkin, R.E. Thorne / Methods 34 (2004) 273–299 293
arbitrary binding manifests itself in height variations ofnew growth layers of 0.5–5 nm or 2–18% of the diameterof the virus particles making up the lattice. Even within asingle domain a height diVerence between virions of upto 1.5 nm is observed. Consequently, a two-dimensionalnucleus can grow by addition of virions that end upoccupying signiWcantly diVerent crystallographic posi-tions within the same growth layer. Merging of growthlayers with height diVerences of up to 2 nm proceedswithout defect formation, while merging of layers withlarger height diVerences creates the structured domainboundaries seen in Fig. 22.
Figs. 10C and D show the presence of abnormal viri-ons with diameters in the range of 22–36 nm on the sur-face layers of CMV crystals. Incorporation of theseabnormal virions creates local lattice distortions thatpropagate through several adjacent virion rows, causingdefect formation and accumulation of lattice strain. Thedensity of these defects can be very high, up to 109 cm2,several orders of magnitude larger than point defect den-sities visualized for other macromolecular crystals. Thesedensities are theoretically suYcient to cause substantialdegradation of diVraction resolution, and observed reso-lutions are typically 8–10 Å. High densities of abnormalvirions incorporated in the crystalline lattice are alsoobserved in other virus crystals [23].
5.10.1. ImplicationsVirion microheterogeneity together with weak inter-
particle bonding results in poorer short and long-rangeorder in CMV crystals than has been observed by AFM inany other macromolecular crystals studied. These obser-vations correlate with the poor diVraction resolution ofthese crystals. The local, B-factor destroying disorder dueto microheterogeneity is likely common to crystals ofmost viruses and could help explain their generally poordiVraction properties. In particular, a given fractional sizevariation has larger eVects on B and resolution because ofthe large particle size and unit cell dimensions; as arguedin Section 4.2, the atomic displacements that determine
Fig. 22. In situ AFM images of the (0 0 1) face of CMV crystals show-ing: (A) a large area with multiple domains (indicated by arrows). (B)Higher magniWcation AFM image of the domains (indicated byarrows). The scan areas are: (A) 18 £ 18 �m and (B) 1.3 £ 1.3 �m.
resolution grow with particle size for Wxed fractionalparticle displacements. AFM appears to be the only toolthat can reveal this kind of disorder.
5.11. Creating disorder in post-growth treatments
The disorder that limits the diVraction resolution ofmacromolecular crystals is often caused by treatments—including heavy-atom compound binding, binding ofsubstrate or drug molecules, and cryoprotectant soaks—performed after the crystal is grown [1–3,59]. These post-growth treatments share several features: they involvediVusive transport of molecules into the crystal; theyoften cause changes in lattice constant, lattice symmetry,and molecular conformation that lead to lattice strains,crystal cracking, and mosaic width broadening; and theyusually degrade (but occasionally improve) crystal B fac-tors and diVraction resolutions. A simple post-growthtreatment that shares these general features is crystaldehydration [84]. For example, water diVusion out oftetragonal lysozyme crystals causes a decrease in latticeconstant, and larger dehydrations cause a change inmolecular conformation and a substantial degradationof the diVraction resolution [85].
Fig. 23 shows the lattice constants a and c for tetrago-nal lysozyme measured at diVerent relative humidities(r.h) [86], obtained by equilibrating the crystal in an X-ray capillary with a saturated solution of an appropriatesalt. Near 88% r.h. the c-axis lattice parameter abruptlydecreases by nearly 9%, suggesting that a Wrst-orderstructural phase transition occurs there involving anabrupt loss of crystal water. Fig. 24 shows X-ray
Fig. 23. Lattice parameter c versus lattice parameter a measured dur-ing dehydration to 98% (right-pointing triangle), 93% (square), 88%(Wve-pointed star), 87% (inverted triangle), 83% (left-pointing trian-gle), and 79% r.h. (six-pointed star.) The values are either steady-statevalues, or the last values with suYcient resolution. The open and solidsymbols correspond to crystals with diVraction resolutions 03 and13 Å, respectively. The upper solid line corresponds to the lattice con-stant trajectory in time followed by crystals dehydrating to 86% r.h.The bottom line is a guide to the eye. Adapted from [86].

294 A.J. Malkin, R.E. Thorne / Methods 34 (2004) 273–299
topographs for crystals dehydrated between 93 and 75%r.h. Between 98 and 89% r.h., the mosaicity, lattice con-stant spread, and diVraction resolution do not measur-ably change and the X-ray topographs remainfeatureless, indicating that the lattice adjusts to the »2%contractions of a and c without signiWcantly aVectingcrystal order. Near 88% r.h the steady-state mosaicityand diVraction resolution degrade sharply, substantialdiVuse intensity appears, and topographs develop exten-sive contrast with a symmetry suggestive of a crystal dry-ing out. On further dehydration many crystals crack,and for 679% r.h. microcracks and other defects canform dense, interconnected webs, as shown in Fig. 24D.
Fig. 24. X-ray topographs of crystals dehydrated to 89, 86, 83, and75% r.h. Adapted from [86].
DiVraction patterns of crystals dehydrated to 83% r.h.and lower are severely degraded, and only a few reXec-tions corresponding to d 1 6 Å are typically observed.However, even after such degradation, original order—as indicated by topographs (Fig. 25), mosaicity parameters,and diVraction resolution—can be almost completelyrestored by rehydration above 89% r.h.
Why does the structural transformation near 88% r.h.create so much disorder? X-ray data acquired in situduring dehydration provide some insight [86]. Degrada-tion of diVraction resolution occurs abruptly for dehy-dration to well below 88% r.h. But near 88% r.h. the timerequired can vary by orders of magnitude for crystalsprepared and treated identically, indicating signiWcantmetastability, as expected for a Wrst order transforma-tion. A time series of topographs acquired in situ duringdehydration to below 88% r.h. indicates that the appear-ance of signiWcant image structure coincides with degra-dation of diVraction resolution and an increase inmosaicity parameters from hundredths of a degree toone degree or more. As the resolution degrades, topo-graphs (Fig. 26) appear to show a well-deWned “front”
Fig. 25. X-ray topographs of: (A) an as-grown tetragonal lysozymecrystal; (B) after dehydration to 83.5% r.h.; and (C) 8 h after the startof rehydration to 98% r.h. Adapted from [86].

A.J. Malkin, R.E. Thorne / Methods 34 (2004) 273–299 295
separating ordered, presumably untransformed regionsfrom highly disordered regions. This front appears topropagate inward from the crystal surface and isexpected for a Wrst order transition because of the largeinterfacial energy between phases. The 9% change inc-axis lattice constant between transformed and untrans-formed regions may produce large stresses along the“front” driving formation of dislocations, cracks, andother defects responsible for the mosaic broadening andresolution degradation. The phenomenon of textureformation and mosaic broadening is well known inWrst order “martensitic” transformations in inorganicmaterials.
5.11.1. ImplicationsSigniWcant structural changes can occur during post-
growth treatments involving small molecules (e.g.,heavy-atom compounds, cryoprotectants, and drugs).Even large lattice parameter changes need not createadditional disorder provided that the lattice parametersevolve continuously and that the treatment is performedgradually enough for diVusive equilibrium within thecrystal to be approximately maintained. However, if atreatment causes a discontinuous change in latticeparameters, then the motion of the resulting phaseboundary through the crystal will likely create disorderthat signiWcantly degrades mosaicity and diVraction res-olution. Structural metastability conferred by the con-straints of the crystal lattice may allow metastable orderto be maintained in an initially highly perfect crystal ifthe treatment is performed suYciently gradually. How-ever, in general treatments that cause such Wrst ordertransformations should be avoided.
5.12. Flash cooling and cryocrystallography
Cryocrystallographic techniques are used in an over-whelming fraction of X-ray structure determinations ofbiological macromolecules [2]. Flash cooling macromo-lecular crystals to T 6 150 K reduces radiation damage
Fig. 26. X-ray topograph acquired shortly after crystal resolutionbegan to degrade during dehydration to 83.5% r.h. A sharp boundaryon the right-hand half of the crystal separates an outer region whichnow diVracts only to low resolution and an inner region whichdiVracts to higher resolution. Adapted from [86].
and increases crystal lifetimes in intense X-ray beams bya factor of »103, allowing complete diVraction data setsto be collected using a single crystal [87]. These tech-niques are essential for data collection from small crys-tals, which would otherwise be destroyed by a tinyfraction of the X-ray dose required for a complete dataset.
However, cryocrystallographic techniques have theircosts. When crystals are Xash cooled, their mosaic widthtypically broadens by a factor of 10–100 to 0.1–1°, indi-cating the presence of substantial lattice orientationaldisorder, and this limits resolution improvements madepossible by high-brilliance beam lines and Wne phi slic-ing. Overall diVraction resolution usually degrades, andsometimes dramatically. These problems are especiallyacute for larger crystals (for which radiation damage isless important) and for high solvent content crystals.
Experiments on tetragonal and triclinic lysozymecrystals in the 200–800 �m size range and cryoprotectedusing only nonpenetrating oil can be used to simulatecryodamage to more sensitive macromolecular crystals[88]. For tetragonal crystals, mosaic full-width-at-half-maximum (FWHM) values broadened from »0.005° to0.3–2°, and resolution (determined by the experimentalset-up and an I/� cutoV of 8) degraded from 1.6 to 2–3 Å.Fig. 27 shows a series of X-ray topographs acquiredfrom a cryocooled tetragonal crystal at three angleswithin the mosaic width of a single reXection. Eachimage shows some intensity variation but nothing thatcan be convincingly ascribed to speciWc defects. Theedges of the crystal appear blurred, unlike the sharpedges observed in topographs of as-grown crystals (e.g.,Fig. 8A), indicating the presence of large strains. Com-bined with the large mosaicity, the large strains implythat defects cannot be identiWed because their density isextremely high. As the crystal is rotated oV the diVrac-tion peak, the intensity fades out uniformly over thecrystal's area, indicating that the large mosaic spread hasa primarily microscopic character with a very short char-acteristic length for lattice misorientations. This is con-sistent with the small internal temperature gradientsexpected during Xash cooling.
Fig. 28 shows q scans through diVraction peaks near2�D 12° for three Xash-cooled tetragonal lysozyme crys-tals. Peak widths before Xash cooling are »0.003°, corre-sponding to a lattice constant spread within the crystalof less than 0.03%. After Xash cooling, the widths growto »0.2°, corresponding to a lattice constant spread of»2%, and the peak tails are broader and structured.Comparison of q-scan and mosaic peak widths withdiVraction resolution shows that resolution degradationstrongly correlates with an increase in crystal strain (lat-tice constant spread) but is only weakly correlated withmosaicity. By adding penetrating cryoprotectants likeglycerol, the measured lattice constant spread decreasesand the diVraction resolution improves.

296 A.J. Malkin, R.E. Thorne / Methods 34 (2004) 273–299
Fig. 29 shows a sequence of X-ray topographs for aXash-cooled triclinic lysozyme crystal. The triclinic formsurvives Xash cooling much better than the tetragonalform, with typical diVraction resolutions increasing onlyslightly from »1.6 to »1.7–2 Å. The images show thatthe crystal consists of well-ordered regions or “grains”with a typical size of »20 �m but that have a spread oforientations, a structure reminiscent of an ideal mosaiccrystal. Careful inspection shows that the mosaic widthsof individual grains are signiWcantly smaller than that ofthe crystal as a whole. This implies that a small illumi-nating X-ray beam of the order of the grain size mayyield improvements in the mosaicity parameter anddiVraction resolution.
In an attempt to improve diVraction from frozen crys-tals, a variety of annealing or tempering protocols, inwhich the crystal is warmed and then recooled, havebeen explored [88,89]. Results obtained have been incon-sistent, but annealing sometimes improves resolution.Resolution improvements observed in tetragonal lyso-zyme crystals after either Xash annealing or low-temper-ature annealing are associated with a reduction in theq-scan peak width and the size of the tails [88], corre-sponding to a reduction in lattice strain. Mosaic widths
Fig. 27. X-ray topographs acquired in 1° steps as a Xash-cooled tetrag-onal lysozyme crystal is rotated through its mosaic width. No sharpdefect structures are observed, but fuzzy image boundaries due tolarge strains and the large mosaic width indicate that the crystal isheavily disordered, consistent with its resolution of 2.7 Å at I/� D 8.Adapted from [88].
can show little or no improvement. Fig. 30 shows thatthese resolution and strain improvements are oftenaccompanied by the development of a clear mosaicdomain structure with a characteristic domain size of»20 �m, similar to that observed for unannealed tricliniclysoyzme crystals [88].
These results indicate that tetragonal lysozyme crys-tals Xash cooled without internal cryoprotectants are leftin a more-or-less uniformly disordered state with a smallcharacteristic length scale for mosaic disorder (i.e., asmall “domain” size). Annealing produces larger, rela-tively well-ordered domains, each with improved
Fig. 28. q scans for three Xash-cooled tetragonal lysozyme crystalsacquired at a resolution of »6 Å. The full-width at half maximum val-ues of »0.35°, 0.2°, and 0.1° vary in rough proportion to the diVractionresolutions of 2.9, 2.5, and 1.8 Å, respectively. Adapted from [88].
Fig. 29. X-ray topographs acquired in 0.5° steps as a Xash-cooled tri-clinic lysozyme crystal was rotated through its mosaic width. Adaptedfrom [88].

A.J. Malkin, R.E. Thorne / Methods 34 (2004) 273–299 297
diVraction resolution and mosaicity and reduced strain.These domains have diVerent orientations, and thespread in their orientations can be comparable to thecrystal's pre-anneal mosaic spread.
5.12.1. ImplicationsBased on these results we have argued [88] that disor-
der arises during Xash cooling primarily due to stressesand strains associated with diVerential thermal contrac-tion of the macromolecular lattice and internal crystalsolvent. The lattice constants of most macromolecularcrystals contract on cooling, but water in the form ofboth crystalline and amorphous ice expands. If the crys-tal could be cooled very slowly, solvent might eventuallybe squeezed out and accumulate at the crystal surface.But during the »0.01–1 s required for Xash cooling nosuch large scale movements are possible. Instead, shortscale solvent motions occur, in which solvent is expelledfrom small grains and accumulates in solvent-richregions between them. The macromolecular latticewithin the grains can be well ordered and give theobserved sharp peaks and smaller lattice constants. Butthe surrounding water-rich regions become disrupted,reducing the ordered fraction of the crystal, the overalldiVraction intensities and the resolution, and increasingmosaicity. This mechanism is illustrated in Fig. 31, andthe result is a classic mosaic crystal, consistent with themicrostructure observed for Xash-cooled triclinic lyso-zyme crystals. Consequently, the primary role of pene-trating cryoprotectants is not inhibition of hexagonal iceformation but contraction matching the solvent andmacromolecular lattice. This implies that the search forsearch for “cryoprotectants” can be broadened toinclude any macromolecule-friendly Xuid or additivethat provides contraction matching.
Fig. 30. X-ray topographs acquired in 0.25° steps for a Xash-cooledtetragonal lysozyme crystal that was annealed at T D 250 K for 30 s.Annealing improved the diVraction resolution from 2.9 to 2.4 Å.Adapted from [88].
6. Concluding remarks
Atomic force microscopy, X-ray topography, andhigh-resolution reciprocal space scanning have providedextremely detailed insight into macromolecular crystalgrowth and disorder from the crystal to molecular scales.The growth mechanisms have been identiWed and quan-tiWed, and many important kinds of disorder and theirsources characterized. These results have broad implica-tions for macromolecular crystal growth and crystallog-raphy. Until recently a signiWcant barrier betweencommunities has kept results obtained in fundamentalstudies from having a signiWcant impact on the generalpractice of macromolecular crystallography. Our hope isthat the increasing use of automated tools for routinetasks will provide both the time and resources for theseinsights to be utilized.
Because of their power and relative simplicity, AFMand X-ray topography should become an integral part ofthe toolkit used to address challenging crystals andstructures. However, chemical, conformational, and
Fig. 31. Schematic illustration of protein crystal microstructure (A)before, (B) during, and (C) after Xash cooling. The shading densityindicates local water concentration. Adapted from [88].

298 A.J. Malkin, R.E. Thorne / Methods 34 (2004) 273–299
other kinds of molecular microheterogeneity, whichdominate the poor diVraction properties of many crys-tals, have so far remained largely inaccessible. Physicalmethods to complement the trial-and-error of molecularmodiWcations must be developed to characterize andquantify this important source of macromolecular crys-tal disorder.
Acknowledgments
Research summarized here was supported by grantsfrom the National Aeronautics and Space Administration(NAG8-1357, NAG8-1408, NAG8-1569, NAG8-1574,and NAG8-1831) and the National Institutes of Health.Part of this work was performed under the auspices of theUS Department of the Energy by the University of Cali-fornia, Lawrence Livermore National Laboratory underContract W-7405-Eng-48. The authors wish to thank A.McPherson, M. Plomp, and Yu.G. Kuznetsov at UCIrvine and I. Dobrianov, C. Caylor, S.G. Lemay, S. Kri-minski, and K.D. Finkelstein at Cornell for their contribu-tions into this work. R.E.T. also thanks M.B. Weissmanand S.E. Ealick for encouraging his group's studies of themacromolecular crystal growth problem.
References
[1] A. McPherson, Crystallization of Biological Macromolecules,Cold Spring Harbor Laboratory, Cold Spring Harbor, New York,1999.
[2] N.E. Chayen, T.J. Boggon, A. Cassetta, A. Deacon, T. Gleich-mann, J. Habash, S.J. Harrop, J.R. Helliwell, Y.P. Nieh, M.R. Pet-erson, J. Raftery, E.H. Snell, A. Hadener, A.C. Niemann, D.P.Siddons, V. StojanoV, A.W. Thompson, T. Ursby, M. WulV, Quart.Rev. Biophys. 29 (1996) 227–278.
[3] A. Ducruix, R. Giege (Eds.), Crystallization of Nucleic Acids andProteins, IRL, Oxford, 1992.
[4] F. Rosenberger, P.G. Vekilov, M. Muschol, B.R. Thomas, J. Cryst.Growth 168 (1996) 1–27.
[5] A.A. Chernov, Phys. Rep. 288 (1997) 61–75.[6] S.D. Durbin, G. Feher, Ann. Rev. Phys. Chem. 44 (1996) 171–204.[7] A.A. Chernov, Modern Crystallography III. Crystal Growth,
Springer, Berlin, 1984;A.A. Chernov, H. Komatsu, in: J.P. van der Eerden, O.S.L. Bru-insma (Eds.), Science and Technology of Crystal Growth, KluwerAcademic Publishers, Dordrecht, 1995, pp. 327–353.
[8] G. Binning, C.F. Quate, C. Gerber, Phys. Rev. Lett. 56 (1986) 930–933.
[9] P.K. Hansma, J.P. Cleveland, M. Radmacher, D.A. Walters, P.E.Hillner, M. Bezanilla, M. Fritz, D. Vie, H.G. Hansma, C.B. Prater,J. Massie, L. Fukunage, J.V. Gurley, V. Elings, Appl. Phys. Lett. 64(1984) 1738–1740.
[10] J.H. Hafner, C.L. Cheung, T.H. Oosterkamp, C.M. Lieber, J. Phys.Chem. B 105 (2001) 743–746.
[11] J.H. Hafner, C.L. Cheung, A.T. Woolley, C.M. Lieber, Progress inBiophys. and Mol. Biol. 77 (2001) 73–110.
[12] S.D. Durbin, W.E. Carlson, J. Cryst. Growth 122 (1992) 71–79.[13] S.D. Durbin, W.E. Carlson, M.T. Saros, J. Phys. D 26 (1993) 128–
135.
[14] A.J. Malkin, T.A. Land, Yu.G. Kuznetsov, A. McPherson, J.J.DeYoreo, Phys. Rev. Lett. 75 (1995) 2778–2781.
[15] T.A. Land, A.J. Malkin, Yu.G. Kuznetsov, A. McPherson, J.J.DeYoreo, Phys. Rev. Lett. 75 (1995) 2774–2777.
[16] A.J. Malkin, Yu.G. Kuznetsov, T.A. Land, J.J. DeYoreo, A.McPherson, Nat. Struct. Biol. 2 (1995) 956–959.
[17] A.J. Malkin, Yu.G. Kuznetsov, A. McPherson, J. Struct. Biol. 117(1996) 124–137.
[18] A.J. Malkin, Yu.G. Kuznetsov, W. Glantz, A. McPherson, J. Phys.Chem. 100 (1996) 11736–11743.
[19] Yu.G. Kuznetsov, A.J. Malkin, T.A. Land, J.J. DeYoreo, A.P.Barba de la Rosa, J. Konnert, A. McPherson, Biophys. J. 72 (1997)2357–2364.
[20] A.J. Malkin, Yu.G. Kuznetsov, A. McPherson, Surf. Sci. 393(1997) 95–107.
[21] J.D. Ng, Yu.G. Kuznetsov, A.J. Malkin, G. Keith, R. Giege, A.McPherson, Nucleic Acids Res. 25 (1987) 2582–2588.
[22] Yu.G. Kuznetsov, J. Konnert, A.J. Malkin, A. McPherson, Surf.Sci. 440 (1999) 69–80.
[23] A.J. Malkin, Yu.G. Kuznetsov, R.W. Lucas, A. McPherson, J.Struct. Biol. 127 (1999) 35–43.
[24] A.J. Malkin, Y.u.G. Kuznetsov, A. McPherson, J. Cryst. Growth196 (1999) 471–488.
[25] A. McPherson, A.J. Malkin, Yu.G. Kuznetsov, Annu. Rev. Bio-phys. Biomol. Struct. 29 (2000) 361–410.
[26] A. McPherson, A.J. Malkin, Yu.G. Kuznetsov, M. Plomp, ActaCryst. D 57 (2000) 1053–1060.
[27] A.J. Malkin, Yu.G. Kuznetsov, A. McPherson, J. Cryst. Growth232 (2001) (2001) 471–488.
[28] M. Plomp, A. McPherson, S.B. Larson, A.J. Malkin, J. Phys.Chem. 105 (2001) 542–551.
[29] A.J. Malkin, A. McPherson, J. Phys. Chem. 106 (2002) 6718–6722.[30] A.J. Malkin, M. Plomp, A. McPherson, Acta Cryst. 58 (2002)
1617–1621.[31] M. Plomp, A. McPherson, A.J. Malkin, J. Cryst. Growth 237
(2002) 306–311.[32] M. Plomp, A. McPherson, A.J. Malkin, Proteins: Structure, Func-
tion, and Genetics 50 (2003) 486–495.[33] A.J. Malkin, A. McPherson, in: X.Y. Lin, J.J. DeYoreo (Eds.),
Nanoscale structure and assembly at solid-Xuid interfaces, 2(2004) 201–238.
[34] J.H. Konnert, P. D'Antonio, K.B. Ward, Acta Cryst. D 50 (1994)603–613.
[35] T.A. Land, J.J. DeYoreo, J.D. Lee, Surf. Sci. 384 (1997) 136–155.[36] T.A. Land, J.J. DeYoreo, J. Cryst. Growth 208 (2000) 623–637.[37] M. Yip, M.D. Ward, Biophys. J. 71 (1998) 1071–1078.[38] C.M. Yip, M.L. Brader, M.R. DeFelippis, M.D. Ward, Biophys. J.
74 (1998) 2199–2209.[39] C.M. Yip, M.R. DeFelippis, B.H. Frank, M.L. Brader, M.D. Ward,
Biophys. J. 75 (1998) 1172–1179.[40] H.Y. Li, M.A. Perozzo, J.H. Konnert, A. Nadarajah, M.L. Pusey,
Acta Cryst. D 55 (1999) 1023–1035.[41] M.R. Li, A. Nadarajah, M.L. Pusey,, Acta Cryst. D 55 (1999)
1036–1045.[42] T. Nakada, G. Sazaki, S. Miyashita, S.D. Durbin, H. Komatsu, J.
Cryst. Growth 196 (1999) 503–510.[43] A.A. Chernov, L.N. Rashkovich, I.V. Yaminski, N.V. Gvozdev, J.
Phys.-Condens. Matter 11 (1999) 9969–9984.[44] S.T. Yau, B.R. Thomas, P.G. Vekilov, Phys. Rev. Lett. 85 (2000)
353–356.[45] S.T. Yau, D.N. Petsev, B.R. Thomas, P.G. Vekilov, J. Mol. Biol.
303 (2000) 667–678.[46] S.T. Yau, P.G. Vekilov, Nature 406 (2000) 494–497.[47] S.T. Yau, B.R. Thomas, O. Galkin, O. Gliko, P.G. Vekilov, Pro-
teins: Structure, Function, and Genetics 43 (2001) 343–352.[48] P.G. Vekilov, A.A. Chernov, Solid State Phys.: Adv. Res. Appl. 57
(2002) 1–147.

A.J. Malkin, R.E. Thorne / Methods 34 (2004) 273–299 299
[49] I. Reviakine, D.K. Georgiou, P.G. Vekilov, J. Am. Chem. Soc. 125(2003) 11684–11693.
[50] B.K. Tanner, X-ray DiVraction Topography, Pergammon, Oxford,1976;B.K. Tanner, D.K. Bowen, Characterization of Crystal GrowthDefects by X-ray Methods, Plenum, New York, 1980.
[51] Z.W. Hu, B. Lai, Y.S. Chu, Z. Cai, D.C. Mancini, B.R. Thomas,A.A. Chernov, Phys. Rev. Lett. 87 (2001), Art. No. 148101.
[52] R. Fitzgerald, Phys. Today 53 (2000) 23–28.[53] P. Hartman (Ed.), Crystal Growth an Introduction, North-Hol-
land, Amsterdam, 1973, pp. 319–367.[54] C.M. Pina, U. Becker, P. Risthaus, D. Bosbach, A. Putnis, Nature
395 (1998) 483–486.[55] T.J. Smith, E. Chase, T. Schmidt, K.L. Perry, J. Virol. 74 (2000)
7578–7586.[56] M. Plomp, M.K. Rice, E.K. Wagner, A. McPherson, A.J. Malkin,
Am. J. Pathol. 160 (2002) 1959–1966.[57] A.J. Malkin, A. McPherson, P.D. Gershon, J. Virol. 77 (2003)
6332–6340.[58] A.J. Malkin, M. Plomp, A. McPherson, in: P.M. Lieberman (Ed.),
DNA Viruses: Methods and Protocols. Methods in MolecularBiology Series, The Humana Press Inc., 2004, in press.
[59] T.L. Blundell, L.N. Johnson, Protein Crystallography, AcademicPress, New York, 1976.
[60] M.A. Krivoglaz, X-ray and Neutron DiVraction in Nonideal Crys-tals, Springer, Berlin, 1996.
[61] A.A. Koz'ma, A.V. Arinkin, I.F. Mikhay'lov, M.Ya. Fuks, Fiz.Metal. Metalloved. 36 (1973) 596–604, English transl.: Phys. Met-als Metallogr. 38 (1973) 132–140.
[62] T.H. Metzger, J. Peisl, R. Kaufmann, J. Phys. F 13 (1983) 1103–1113;W.W. Webb, J. Appl. Phys. 33 (1962) 3546–3552.
[63] R. Fourme, A. Ducruix, M. Riess-Kautt, B. Capelle, J. Synchro-ton. Rad. 2 (1995) 136–142.
[64] V. StojanoV, D.P. Siddons, Acta Cryst. D 52 (1996) 498–499;V. StojanoV, D.P. Siddons, L.A. Monaco, P. Vekilov, F. Rosenber-ger, Acta Cryst. D 53 (1997) 588–595.
[65] K. Izumi, S. Sawamura, M. Ataka, J. Cryst. Growth 168 (1996)106–111.
[66] I. Dobrianov, K.D. Finkelstein, S.G. Lemay, R.E. Thorne, ActaCryst. D 54 (1998) 922–937.
[67] I. Dobrianov, C. Caylor, S.G. Lemay, K.D. Finkelstein, R.E.Thorne, J. Cryst. Growth 196 (1999) 511–523.
[68] F. Otalora, J.M. Garcia-Ruiz, J.-A. Gavira, B. Capelle, J. Cryst.Growth 196 (1999) 546–558.
[69] O. Vidal, M.-C. Robert, B. Capelle, B. Arnoux, J. Cryst. Growth196 (1999) 559–571.
[70] B. Capelle, Y. Epelboin, J. Hartwig, A.B. Moraleda, F. Otalora, V.StojanoV, J. Appl. Cryst. 37 (2004) 67–71.
[71] A. Shaikevitch, Z. Kam, Acta Cryst. A 37 (1981) 871–875;J.R. Helliwell, J. Cryst. Growth 90 (1988) 259–272.
[72] E.H. Snell, S. Weisgerber, J.R. Helliwell, E. Weckert, K. Holzer, K.Schroer, Acta Cryst. D 51 (1995) 1099–1102.
[73] E.H. Snell, H.D. Bellamy, G.E.O. Borgstahl, Methods 368 (2003)268–288.
[74] S.R. Coriell, B.T. Murray, A.A. Chernov, G.B. McFadden, J.Cryst. Growth 169 (1996) 773–785.
[75] P.G. Vekilov, J.I.D. Alexander, F. Rosenberger, Phys. Rev. E 54(1996) 6650–6660.
[76] L.A. Monaco, F. Rosenberger, J. Cryst. Growth 129 (1993) 465–484.
[77] B. Lorber, M. Skouri, J.-P. Munch, R. Giege, J. Cryst. Growth 128(1993) 1203–1211;B.R. Thomas, P.G. Vekilov, F. Rosenberger, Acta Cryst. D 52(1996) 776–784;C. Aberel, M.P. Nesa, J.C. Fontecilla-Camps, J. Cryst. Growth 110(1991) 11–19;P.G. Vekilov, L.A. Monaco, F. Rosenberger, J. Cryst. Growth 156(1995) 267–278;J. Hirschler, J.C. Fontecilla-Camps, Acta Cryst. D 52 (1996) 806–812;P.G. Vekilov, F. Rosenberger, J. Cryst. Growth 158 (1996) 540–551.
[78] C.L. Caylor, I. Dobrianov, S.G. Lemay, C. Kimmer, S. Kriminski,K.D. Finkelstein, W. Zipfel, W.W. Webb, B.R. Thomas, A.A.Chernov, R.E. Thorne, Proteins: Structure, Function, and Genet-ics 36 (1999) 270–281.
[79] W. Denk, J.H. Strickler, W.W. Webb, Science 248 (1990) 73–76.[80] P.G. Vekilov, L.A. Monaco, B.R. Thomas, V. StojanoV, F. Rosen-
berger, Acta Cryst. D 52 (1996) 785–798.[81] M.Plomp, B.R. Thomas, A. McPherson, A.A. Chernov, A.J. Mal-
kin, unpublished.[82] R.E. Koeppe, R.M. Stroud, V.A. Pena, D.V. Santi, J. Mol. Biol. 98
(1975) 155–160.[83] W. Heinrichs, M. Heinrichs, H. Schönert, J. Cryst. Growth 122
(1992) 186–193.[84] R. Kiefersauer, M.E. Than, H. Dobbek, L. Gremer, M. Melero, S.
Strobl, J.M. Dias, T. Soulimane, R. Huber, J. Appl. Cryst. 33(2000) 1223–1230.
[85] D.M. Salunke, B. Veerapandian, R. Kodandapani, M. Vijayan,Acta Cryst. B 41 (1985) 431–436;H.E. Huxley, J.C. Kendrew, Acta Cryst. 6 (1953) 76–80.
[86] I. Dobrianov, S. Kriminski, C.L. Caylor, S.G. Lemay, C. Kimmer,A. Kisselev, K.D. Finkelstein, R.E. Thorne, Acta Cryst. D 57(2001) 61–68.
[87] E.F. Garman, T.R. Schneider, J. Appl. Cryst. 30 (1997) 211–237.[88] S. Kriminski, C.L. Caylor, M.C. Nonato, K.D. Finkelstein, R.E.
Thorne, Acta Cryst. D 58 (2002) 459–471.[89] J.M. Harp, D.E. Timm, G.J. Bunick, Acta Cryst. D 54 (1988) 622–
628;J.M. Harp, B.L. Hanson, D.E. Timm, G.J. Bunick, Acta Cryst. D55 (1999) 1329–1334;J.I. Yeh, W.G.J. Hol, Acta Cryst. D 54 (1998) 479–480;E.F. Garman, Acta Cryst. D 55 (1999) 1641–1653;V.R. Samygina, S.V. Antonyuk, V.S. Lamzin, A.N. Popov, ActaCryst. D 56 (2000) 595–603.