growth and yield characteristics of five different sweet
TRANSCRIPT

_____________________________________________________________________________________________________ *Corresponding author: E-mail: [email protected];
Journal of Experimental Agriculture International 43(2): 44-55, 2021; Article no.JEAI.67289 ISSN: 2457-0591 (Past name: American Journal of Experimental Agriculture, Past ISSN: 2231-0606)
Growth and Yield Characteristics of Five Different Sweet Potato Varieties Grown in the Guinea
Savanna Ecological Zone of Ghana
Abonuusum Ayimbire1*, Gabriel Asumboya1, Christina Abi Atinga2, Richard Akazotiyele1 and Bodieu Marcellinus1
1Department of Ecological Agriculture, School of Applied Science and Arts, Bolgatanga Technical
University, P. O. Box 767, Bolgatanga, Ghana. 2Department of Hotel Catering and Institutional Management, School of Applied Science and Arts,
Bolgatanga Technical University, P. O. Box 767, Bolgatanga, Ghana.
Authors’ contributions
This work was carried out in collaboration among all authors. Author AA designed the study, performed the statistical analysis, wrote the protocol and wrote the first draft of the manuscript.
Authors GA and CAA managed the analyses of the study. Author RA supervised author BM to grow the crops. All authors read and approved the final manuscript.
Article Information
DOI: 10.9734/JEAI/2021/v43i230645
Editor(s): (1) Dr. Dalong Guo, Henan University of Science and Technology, China.
Reviewers: (1) Alana Gabrieli de Souza, Universidade Federal do ABC, Brazil.
(2) Obomeghei Abdulkareem Adamu, University of Ibadan, Nigeria. Complete Peer review History: http://www.sdiarticle4.com/review-history/67289
Received 08 February 2021 Accepted 12 April 2021 Published 16 April 2021
ABSTRACT Aim: To determine the growth characteristics of five sweet potato varieties on different soil types as well as how they each relates to tuber yield. This investigation will help guide farmers from resource-limited areas to select varieties that grow well in austere soils to produce good yield of tubers, thereby boosting global food security. Study Design: Randomized complete block design (RCBD) with five treatments and three replications. Place and Duration of Study: Experimental field of Bolgatanga Technical University for five months. Methodology: Planting was done by inserting 10 cm length of each 30 cm long soft wood vine cutting into the soil, followed by watering. Five vine cuttings planted per ridge at a spacing of 60cm.
Original Research Article

Ayimbire et al.; JEAI, 43(2): 44-55, 2021; Article no.JEAI.67289
45
Vine cuttings were transplanted in the same order on each ridge. There were 15 plants per treatment, so seventy-five (75) for the five treatments. Results: Analysis of the soil showed sandy loamy soil with suitable pH of 6.05. The Orange flesh and Agric white varieties had the largest and smallest leaf areas of 177.76 cm2 and 110.74 cm2 respectively. Leaf area was positively correlated with root tuber mass in only the Red local variety (r = 0.026). Petiole length of the Orange flesh variety (19.08 cm) was significantly longer than that of the Agric white (13.55 cm, p = 0.02), Agric orange flesh (13.85 cm, p = 0.04), Red skin (11.84 cm, p = 0.00) and Red local (12.18 cm, p = 0.00) varieties. Petiole length was positively correlated with tuber yield in only the Orange flesh variety (r = 204). The Red skin (174.28 cm) and Red local (172.46 cm) varieties had the longest vines than all the rest, though not statistically significant (p = 0.241). Root tuber yield of the five varieties were Agric white (1.22 Kg), Agric orange flesh (1.40 Kg), Red skin (4.27 Kg), Red local (2.96 Kg) and Orange flesh (5.72 Kg), which were significantly different from each other (p=0.05). Conclusion: The Orange flesh variety had the largest leaf area, longest petioles and the highest root tuber mass. On the other hand, the Agric white variety recorded the least Leaf area, Vine length and Tuber mass while the Red skin variety had the shortest Petioles.
Keywords: Sweet potato; varieties; agric white; agric orange flesh; orange flesh; red local; red skin.
1. INTRODUCTION Sweet potato (Ipomea batatas) is a crop of choice for the subsistent farmer given that it is not only less demanding of land fertility but tolerates a wide range of climate and soil types. Thus, a farmer with no means of affording the high cost of farm inputs can cultivate and realize a substantial yield of sweet potato root tubers [1-4]. The crop exists in a diversity of varieties with characteristic morphological distinctiveness. The different manifestations of the various strains of the crop include tuber skin and flesh colours of white, cream, yellow, orange, pink, red or purple. The plant grows as a cylindrical vine which may be green, purple or red [5-7]. Almost all the parts of the plant is useful to both humans and animals. The root tubers, rich in food nutrients such as proteins, carbohydrates, lipids, vitamins and vitamin precursors, minerals as well as phytochemicals including phenol-related chlorogenic acid, anthocyanins carotenoids and antioxidants are eaten in different ways by peoples of various cultures. The leaves are used in the preparation of soups, stews and salads eaten by humans. The same leaves together with the vines are feed for animals. Some people even employ certain parts of the plant body for medicinal purposes [7,8-15]. The aggregation of these benefits and potentials, has transitioned sweet potato from being a crop farmed solely for domestic food augmentation to a commercial one with the livelihood of many farmers and traders in the less developed countries hinged on it [16-17]. The resulting
effect is the increased production of the crop in almost all tropical and subtropical countries in Africa, Asia and parts of the Americas. China is continually reported to be the world leader in sweet potato farming, producing an average of 70,963,630 metric tons per annum, and being followed by Nigeria and Tanzania, both in Africa with annual yield capacities of 3,478,270 and 3,345,170 metric tons respectively [4-5,16,18-19,20,]. According to data from FAOSTAT. [21], also cited in Ayimbire et al. [7], Ghanaian sweet potato farmers used 76,594 ha of land in 2016 to cultivate and realize 143,111 tons of tubers. This was 0.10% of global sweet potato output in that year. Bidzakin et al. [22], reported that, Upper East Region leads in the growing of sweet potatoes in Ghana, harvesting on the average, 46,000 metric tons or 34.90% of total annual production in the country using a land area of 5,550 ha or 57.70% of total land used for cultivation of the crop. In order to further scale up production of sweet potato in all parts of the world to help boost global food security, farmers from resource-limited areas need to be guided to select varieties that grow well in austere soils to gather enough biomass and form considerable yield of tubers. This calls for investigations on the different growth parameters of the diverse varieties of sweet potato on different soil types as well as how they each relates to tuber yield. Does a sweet potato plant with massive leaf growth for instance, result in high yield of tubers? This will inform the appropriate strategies to

Ayimbire et al.; JEAI, 43(2): 44-55, 2021; Article no.JEAI.67289
46
employ in order to maximize yield [6,16,23]. Data from works done elsewhere on these vegetative parameters and their relationship with tuber yield exist in literature. Rafique et al. [24], for example, reported from Bangladesh that different sweet potato genotypes performed differently with respect to plant growth features as well as tuber roots yield. Then, Amoatey et al. [25] assessed the relationship between sweet potato genotypes on one hand and vegetative plant body morphology and yield on the other, in the coast of Ghana. Saitama et al. [26], in Indonesia studied leaf area, leaf area index, total plant dry weight and harvest yield of ten sweet potato varieties in the Rainy season. On his part, Taffouo et al. [27] investigated growth and yield aspects of sweet potato in Cameroon while Ramírez et al. [28] in Kenyan worked on the effectiveness of the sweet potato plant in utilizing trapped light energy as well as the proportion of same that is transformed into root tubers. A more recent of these studies was when Irwan et al [29], investigated variations in the structural features of leaves and stems of sweet potato varieties grown in valleys in Indonesia. However, there is little of such investigations carried out in Ghana especially in the Northern and Upper Regions where sweet potato farmers are in the majority [22]. Thus, this work is intended to assess the growth characteristics of five varieties of sweet potato commonly grown in the savanna ecological zone of Ghana.
2. METHODOLOGY
2.1 Study Area The experiment was conducted during the dry season from November 2018 to March 2019, in the experimental field in the Department of Ecological Agriculture, Bolgatanga Technical University in the Bolgatanga Municipality of the Upper East Region, Ghana (Figs. 1. a and b). The area lies within the Guinea Savanna zone of Ghana. The municipality experiences an unpredictable, average yearly minimum and maximum rainfall of 800 mm and 1,100 mm respectively, usually between May/June and September/October. Average temperatures are about 14
oC in the night but 35
oC by afternoon,
resulting in low relative humidity. The concomitant vegetation comprises of short, widely dispersed deciduous trees as well as grasses which have adapted to the low moisture content during the long dry seasons [30].
2.2 Land Preparation and Layout Land tillage was done on 5th followed by layout on 8
th November, 2018. The ridges were
prepared on 10th and planting carried out on 15
th
November, 2018. Ridges were used as earlier findings recommend them as suitable for tuber formation [31]. The experiment was conducted in a randomized complete block design (RCBD) with five treatments represented by the five different sweet potato varies and three replications.
2.3 Soil Sampling Using the protocol of Motsara and Roy [32], three soil samples from 0-20cm depth were taken from three randomly selected replicate beds using a hoe, into black, clean plastic bags. Thus, nine samples were taken from each replication to make up 27 soil samples from the three replications, before planting. Each set of nine samples from each replication was bulged, well-mixed in a clean bucket and a composite sample of about 20 g taken, parceled, appropriately labelled and sent for analysis in the Crop and Soil Sciences laboratory of Kwame Nkrumah University of Science and Technology, Kumasi, Ghana. In all, three samples (one from each replicate bed), taken before planting were analysed. Using the same procedure, after harvesting the crops, another three soil samples, 20 g each, were sent to the same laboratory for analysis.
2.4 Planting Five soft wood vine cuttings of the sweet potato vines at six-week stage, each of length 30 cm were planted per ridge at a spacing of 60cm. There were three such ridges and vine cuttings transplanted in the same order on each ridge. This made up 15 plants per treatment (variety) and a total of seventy-five (75) for the five varieties. The planting was done by inserting 10cm length of each vine cutting into the soil, followed by watering.
2.5 Watering and Cultural Practice The Plants were watered twice a day, morning and evening, consecutively for eleven (11) days for the establishment and early growth of the plants. The watering was then reduced to only mornings. Cultural practice carried out was manual weeding.

Ayimbire et al.; JEAI, 43(2): 44-55, 2021; Article no.JEAI.67289
47
Fig. 1. Maps of:
A) Ghana showing Upper East Region and B) Upper East Region showing Bolgatanga Municipal in the middle
2.6 Parameters Studied
The parameters studied were leaf area, vine length, petiole length and mass of tubers. The growth parameters were measured every two weeks from the day of planting until the eighth week when the plants were harvested and the mass of tubers measured.
To measure the leaf area, a plant was randomly selected from each replicate bed of each treatment. A leaf was again randomly selected from the selected plant for the measurement. This leaf was labelled by loosely binding a coloured plastic band to it. Thus, three leaves were labelled per treatment to give a total of fifteen leaves for the five treatments, whose areas were estimated. The same selected plants were used for the measurement of the other growth parameters (vine length and petiole length).
The approximate leaf area was estimated by tracing its outline on a centimetre square grid. All the squares fully covered by the leaf were counted. Those squares that were at least half-covered were counted separately while those that were not covered up to half were ignored. The number of partially or half-covered squares were counted, and their total area estimated. This was then added to the area of the squares that were fully covered by the leaf to give the total estimated area of the leaf in square centimetres (cm
2).
The petiole lengths of the labelled leaves were measured from the point of attachment to the vine of each leaf stalk to the base of the leaf and recorded in centimetres (cm).
The lengths of the vines containing the labelled leaves, from each replication and treatment,
were measured from the base to the tip of the plants and recorded in centimetres (cm).
Harvesting was done by treatment and replication. The mass of all the tubers of each replicate bed were measured and recorded.
2.7 Pest Control
The pests identified on the sweet potatoes were mainly locusts and white flies. However, given that their numbers were very low, no chemical control measure was taken as they hardly made any impact on the growth of the crops. 2.8 Data Analysis
The data from the parameters measurements were analysed using Stata 16.0, StataCorp LLC, College Station, Texas 77845, USA. The five percent (5%) level of confidence was used in comparing sweet potato varieties with respect to any parameter.
3. RESULTS AND DISCUSSION
3.1 The Nature of the Soil
Though the study was designed to mimic the practice by local sweet potato farmers by not applying fertilizer, it was necessary to analyse the soil before planting and after harvesting to assess the nutrient levels in the study site [32]. The results of the soil analysis showed that the study site has sandy loamy soil with a pH of 6.05 (Table 1), which is suitable for the growth of sweet potatoes, before planting [32]. However, as Table 1 shows, the percentage of total nitrogen of 0.09 %, available phosphorus (13.88 Mg/Kg) as well as the concentrations of exchangeable bases in cmol/kg of K (0.23), Ca (1.93) Mg (0.87) and Na (0.0027) were low in the
A B
Ayimbire et al.; JEAI, 43(2): 44-55, 2021; Article no.JEAI.67289
48
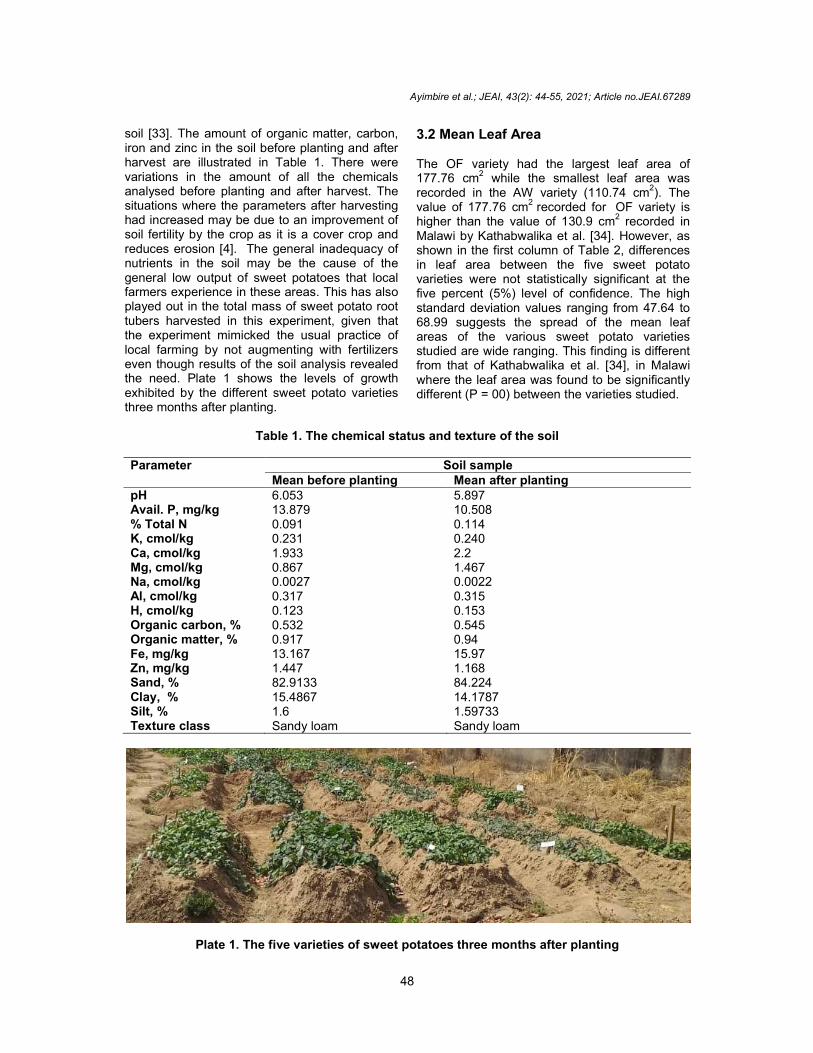
soil [33]. The amount of organic matter, carbon, iron and zinc in the soil before planting and after harvest are illustrated in Table 1. There were variations in the amount of all the chemicals analysed before planting and after harvest. The situations where the parameters after harvesting had increased may be due to an improvement of soil fertility by the crop as it is a cover crop and reduces erosion [4]. The general inadequacy of nutrients in the soil may be the cause of the general low output of sweet potatoes that local farmers experience in these areas. This has also played out in the total mass of sweet potato root tubers harvested in this experiment, given that the experiment mimicked the usual practice of local farming by not augmenting with fertilizers even though results of the soil analysis revealed the need. Plate 1 shows the levels of growth exhibited by the different sweet potato varieties three months after planting.
3.2 Mean Leaf Area The OF variety had the largest leaf area of 177.76 cm2 while the smallest leaf area was recorded in the AW variety (110.74 cm
2). The
value of 177.76 cm2
recorded for OF variety is
higher than the value of 130.9 cm2 recorded in Malawi by Kathabwalika et al. [34]. However, as shown in the first column of Table 2, differences in leaf area between the five sweet potato varieties were not statistically significant at the five percent (5%) level of confidence. The high standard deviation values ranging from 47.64 to 68.99 suggests the spread of the mean leaf areas of the various sweet potato varieties studied are wide ranging. This finding is different from that of Kathabwalika et al. [34], in Malawi where the leaf area was found to be significantly different (P = 00) between the varieties studied.
Table 1. The chemical status and texture of the soil
Parameter Soil sample
Mean before planting Mean after planting pH 6.053 5.897 Avail. P, mg/kg 13.879 10.508 % Total N 0.091 0.114 K, cmol/kg 0.231 0.240 Ca, cmol/kg 1.933 2.2 Mg, cmol/kg 0.867 1.467 Na, cmol/kg 0.0027 0.0022 Al, cmol/kg 0.317 0.315 H, cmol/kg 0.123 0.153 Organic carbon, % 0.532 0.545 Organic matter, % 0.917 0.94 Fe, mg/kg 13.167 15.97 Zn, mg/kg 1.447 1.168 Sand, % 82.9133 84.224 Clay, % 15.4867 14.1787 Silt, % 1.6 1.59733 Texture class Sandy loam Sandy loam
Plate 1. The five varieties of sweet potatoes three months after planting

Ayimbire et al.; JEAI, 43(2): 44-55, 2021; Article no.JEAI.67289
49
Table 2. The average growth and yield parameters of the varieties of sweet potatoes
SPV Leaf area (cm2) Petiole length (cm) Vine length (cm) Tuber mass (Kg) Mean SD Mean SD Mean SD Mean SD AW 110.74a 47.64 13.55a 4.26 138.78a 81.62 1.22a 5.66 AO 124.67
a 47.76 13.85
a 3.05 139.89
a 62.96 1.41
a 1.29
RS 130.08a 78.70 11.84a 3.72 174.28a 111.00 4.27b 3.36 RL 112.40
a 45.00 12.18
a 3.81 172.46
a 88.73 2.96
a 0.20
OF 177.76a 68.99 19.08
b 5.94 153.93
a 70.96 5.72
b 1.35
Key to table: SPV = Sweet Potato Variety, SD = Standard deviation, AW = Agric white, AO = Agric orange flesh, RS = Red
Skin, RL = Red local, OF = Orange flesh. Means having same superscript letters (example a and a) are not significantly different. Means having different superscript letters (example a and b) are significantly different.
In a similar study in Nigeria, however, Yahaya et al. [16] found that the numbers of leaves and roots as well as the average mass of roots in sweet potato plants differed from each other significantly. They also observed a positive relationship between the number of leaves and the yield of root tubers. However, in the current study, leaf area was negatively correlated with root tuber mass in all the varieties (AW, r = -0.391; AO, r = -0.327; RS, r = -0.065; OF, r = -0.042) except the RL variety where a weak positive correlation of r = 0.026 was recorded. This is in line with the work of Widaryanto and Saitama [6] in Indonesia whose findings revealed a negative correlation of both leaf area and leaf area index (LAI) to yield of sweet potato tubers. Su et al. [35], working in Wuhan, China, also found that there was a negative influence of the number of middle leaf lobes on dry matter content of sweet potatoes. Increased in leaf area or its index, beyond a certain threshold, which varies with the stage of growth of the plant, is reported to promote vegetative growth in sweet potatoes by channeling the translocation of food to the vegetative plant body at the expense of root tuber yield [36-37,6]. This may explain the negative relationship between leaf area and sweet potato tuber yield.
3.3 Mean Petiole Length The leaf stalks of the OF variety (19.08 cm) were significantly longer than those of the following varieties: AW (13.55 cm, P = 0.02), AO (13.85 cm, P = 0.04), RS (11.84 cm, P = 0.00) and RL (12.18 cm, P = 0.00) (Table 2). The significant differences in petiole length between varieties agrees with Esan and Omilani [38] and Ochieng [39]. However, the longest petiole length in this
study of 19.08 cm is higher than that of 15.43 cm while the shortest petiole length of 11.84 cm is higher than that of 8.93 cm as reported by Esan and Omilani [38]. The range of petiole length from RS (11.84 cm) to OF (19.08 cm) found in this study fall within the spectrum of short petioles reported in Indonesia by Irwan et al. [29]. The petiole length was weakly, positively correlated to the mass of root tuber in only the OF variety (r = 0.204), which is in keeping with the findings of Esan and Omilani [38], who found r = 0.275. In the rest of the varieties, petiole length was negatively correlated to the mass of root tuber: AW (r = -0.237), AO (r = -0.226), RS (r = -0.310) and RL (r = -0.328).
3.4 Mean Vine Length There were no significant differences in vine length (P ≥ 0.05) among the varieties. However, RS and RL varieties had the longest vine measurements with lengths of 174.28 cm and 172.46 cm respectively (Table 2). The maximum vine length is similar to the findings of Koodi et al. [40] and Esan and Omilani [38]. However, the current results do not agree with the findings of Kathabwalika et al. [34] and Ochieng [39] who recorded significant differences in vine length between the varieties. The highest vine length measured here is longer than the 168.70 cm recorded by Kathabwalika et al. [34]. Again, there were positive but weak correlations of vine length with mass of root tuber in AW (r = 0.0220), RL (r = 0.022) and OF (r = 0.191) varieties, which is in agreement with Ochieng [39] who reported a positive relationship between vine internode length and root yield. There were also negative correlations of vine length with mass of root tuber in the AO (r = -0.046) and RS (r = -0.030) varieties, corroborating the work of Yahaya et al. [16]. as they also observed a

Ayimbire et al.; JEAI, 43(2): 44-55, 2021; Article no.JEAI.67289
50
negative relationship between vine length and root yield.
3.5 Tuber Yield
Plates 2 to 6 are photographs of the root tubers of the different varieties taken immediately after harvest. The root tuber yield of the five varieties were 1.22, 1.4, 4.27, 2.96 and 5.72 kg for the AW, AO, RS, RL and OF respectively. The OF variety produced a significantly higher mass of root tubers than the rest (P = 0.00) except the RS variety that yielded a high mass of root tubers of 4.27 Kg, which is not significantly different (P = 0.45) from that of the OF variety. The AW (1.22 Kg) and the AO (1.41 Kg) varieties produced the lowest mass of tubers, each significantly lower than that of the RS (P = 0.00) (Table 2). The lowest range in the quantity of root tubers produced in this experiment (1.22 to 1.41 Kg) is tantamount to the highest range in the amount of root tubers produced in Bangladesh (1.22 to 1.38 Kg) as reported by Rafique et al. [24]. The
significant differences in root tuber mass between the different sweet potato varieties confirm similar reports by Kathabwalika et al. [34] and Yahaya et al. [16] The present results also differ markedly from the masses of tubers of most of these same sweet potato varieties obtained in an earlier study by Ayimbire et al. [7]. In that study, the AW variety produced the highest mass of root tubers (5.36 kg) with the OF recording among lowest mass of root tubers (0.74 kg). The reverse is the case in the current findings. However, the RS variety is consistent in being the second highest producer of root tubers in both experiments (3.10 kg vs 4.27 kg). These differences in performance may be due to the unique response of each variety of sweet potato to the dissimilar physical and chemical properties of the soils of the respective study sites. The specific responses of individual varieties to each soil condition may result in a unique growth, yield, nutrient and chemical characteristics [5, 7,41,].
Plate 2. Agric white Plate 3. Agric orange flesh
Plate 4. Red skin Plate 5. Red local

Ayimbire et al.; JEAI, 43(2): 44-55, 2021; Article no.JEAI.67289
51
Plate 6. Orange flesh
Fig. 2. The increase in leaf area fortnightly after planting 3.6 Increase in Leaf Area with Weeks
After Planting (WAP) Fig. 2 illustrates that two weeks after planting (WAP), the RS variety recorded the lowest increase in leaf area whereas the OF variety had the highest. However, eight WAP, the leaf area of the RS variety increased to be one of the highest, second only to that of the OF variety. Leaf area increased steadily throughout the period of the experiment in three varieties (AO, RS and OF) while it almost stagnated after the 6th WAP in the remaining two varieties, AW and RL. The stagnation in leaf expansion by the 8
th
WAP in these two varieties may be a necessary physiological process to halt the continuous
translocation of photosynthesized products into the promotion of vegetative growth at the expense of root tuber yield [6,37] The continuous leaf growth in the AO, RS and OF varieties, evidenced by increase in leaf area, suggest the need for pruning 8 WAP in order to arrest continuous vegetative biomass production and increase root tuber formation [37,26].
3.7 The Increase in Petiole Length Fortnightly after Planting
Fig. 3 illustrates that throughout the period of 8 WAP, the highest petiole growth occurred in the OF variety. All the other varieties grew to about the same extend within the period. In the AW and
0
100
200
300
400
500
600
700
800
2 4 6 8
Leaf
Are
a (
M2)
Time (Weeks)
AW AO RS RL OF

Ayimbire et al.; JEAI, 43(2): 44-55, 2021; Article no.JEAI.67289
52
Fig. 3. The increase in Petiole length fortnightly after planting
Fig. 4. The increase in vine length fortnightly after planting.
RS varieties, petiole length increased progressively after planting whereas in the remaining three varieties (AO, RL and OF), increase in petiole length stagnated in the 8th WAP. This trend is similar to the observation in leaf area expansion.
3.8 Increase in Vine Length With Weeks
After Planting (WAP) Unlike in the measurements of leaf area and petiole length, vine length increased progressively after planting in all the sweet
potato varieties (Fig. 4). The RS variety, which together with the AW variety, initially produced the shortest vines within 2 WAP, grew longest of all by the 6th and 8th WAP, followed by the RL variety. The latter grew longer than the OF variety that recorded the highest leaf area and petiole length. The continuous increase in vine length with time is expected to lead to a concomitant increase in sweet potato tuber production in those varieties with positive correlation of vine length to mass of root tuber as in AW (r = 0.0220), RL (r = 0.022) and OF (r = 0.191). This will imply that progressive increase
0
10
20
30
40
50
60
70
2 4 6 8
Peti
ole
Len
gh
t (c
m)
Time (Weeks)
AW AO RS RL OF
0
100
200
300
400
500
600
700
800
900
1000
2 4 6 8
Vin
e L
en
gh
t (c
m)
Time (Weeks)
AW AO RS RL OF

Ayimbire et al.; JEAI, 43(2): 44-55, 2021; Article no.JEAI.67289
53
of vine length is not related to the quantity of root tuber produced in those varieties having negative correlation of vine length with mass of root tuber as in AO (r = -0.046) and RS (r = -0.030). However, relationship between observable physical, vegetative sweet potato plant characteristics like petiole and vine length as well as leaf area on one hand and mass of root tuner on the other, may suggest allelemorphic linkages or otherwise [40] rather than predict that such traits are dependent or independent of root tuber production in some or the other varieties. This may be clear from the background that roots bud into the soil at the nodes, and the longer the vine, the more numerous the nodes sending roots into the soil, some of which expand into root tubers. Therefore, one may not argue that for a sweet potato variety with negative correlation between vine length and mass of root tuber, like AO (r = -0.046), under the same conditions, a 4 m long vine cannot produce more root tubers than a 2 m long vine. 4. CONCLUSION In the absence of nutrient enhancement, all the sweet potato varieties grew well to yield some root tubers. The Orange flesh variety had the largest leaf area, longest petioles and the highest root tuber mass. On the other hand, the Agric white variety recorded the least Leaf area, Vine length and Tuber mass while the Red skin variety had the shortest Petioles. Thus, the OF variety produced the highest vegetative biomass and root tuber mass which could be used as animal fodder and for human consumption. It is therefore, recommended that, the OF variety be used by sweet potato farmers in Sumbrungu community and its environs to produce large quantity of sweet potatoes for animal and human nutrition. The weak and /or negative correlation of vegetative organs like leaf area, length of vines and petiole length to root tuber mass may be suggestive of no gene linkages.
5. RECOMMENDATION i. Further research is required especially on
Dokumah Garden and the Ecological Agriculture Experimental field to gather adequate data to ascertain the disparity in performance displayed by AW and OF in the two sites.
ii. Similar investigations on other varieties of sweet potatoes on different soils are require to give a complete picture to be
able to adequately advise farmers to increase production.
iii. The soil requires enhancement with inputs in the form of organic or chemical fertilizers to increase root tuber production.
iv. Farmers could cultivate sweet potatoes in the dry season as this work was successfully done.
COMPETING INTERESTS Authors have declared that no competing interests exist.
REFERENCES 1. Chagonda I, Mapfeka RF, Chitata T. Effect
of tillage systems and vine orientation on yield of sweet potato (Ipomoea batatas L.). American Journal of Plant Sciences. 2014;5(21):3159–3165.
2. Markos D, Loha K. Sweet potato agronomy research in Ethiopia: Summary of past findings and future research directions. Agriculture and Food Sciences Research. 2016;3(1):1–11.
3. Sugri I, Maalekuu BK, Gaveh E, Kusi F. Sweet Potato Value Chain Analysis Reveals Opportunities for Increased Income and Food Security in Northern Ghana. Advances in Agriculture. 2017;1-14. Article ID 8767340.
4. Amengor NE, Owusu-Asante B, Adofo K, Acheampong PP, Nsiah-Frimpong B, Nimo-Wiredu A, et. al. Adoption of Improved Sweet potato Varieties in Ghana. Journal of Agricultural Extension, Economics and Sociology. 2018;23(3):1-13.
5. Aywa AK, Nawiri MP, Nyambaka HN. Nutrient variation in coloured varieties of Ipomea batatas grown in Vihiga County, Western Kenya. International Food Research Journal. 2013;20(2):819-825.
6. Widaryanto E, Saitama A. Analysis of plant growth of ten varieties of sweet potato (Ipomoea batatas L.) cultivated in rainy season. Asian Journal of Plant Sciences. 2017;16:193-199.
7. Ayimbire A, Abdul-Rahaman SS, Atinga CA, Polycarp D. Sweet potato varietal evaluation trial for food nutritional values. Journal of Agriculture and Ecology Research International. 2018;15(3):1-12.
8. Senanayake SA, Ranaweera KKDS, Gunaratne A, Bamunuarachchi A. comparative analysis of nutritional quality

Ayimbire et al.; JEAI, 43(2): 44-55, 2021; Article no.JEAI.67289
54
of five different cultivars of sweet potatoes (Ipomea batatas (L) Lam) in Sri Lanka. Food Science and Nutrition. 2013; 1(4):284– 291.
9. Trinidad PT, Sagum RS, Mallillin AC, Borlagdan MS, de Leon MP, Aviles T. Sweet potato and cassava can modify cholesterol profile in humans with moderately raised serum cholesterol levels. Food Nutrition Science. 2013; 4(5):491-495.
10. Ellong EN, Billard C, Adenet S. Comparison of physicochemical, organoleptic and nutritional abilities of eight sweet potato (Ipomoea batatas) varieties. Food and Nutrition Science. 2014;5(2):196-211.
11. Hua J, Haixin Z, Hongtao L, Yunchao L. Analysis on the nutrition composition and antioxidant activity of different types of sweet potato cultivars. Food and Nutrition Sciences. 2015;6:161-167.
12. Tierno R, Hornero-Méndez D, GallardoGuerrero L, López-Pardo R, Ruiz de Gallareta JI. Effect of boiling on the total phenolic, anthocyanin and carotenoid concentrations of potato tubers from selected cultivars and introgressed breeding lines from native potato species. Journal of Food Composition and Analysis. 2015;41:58–65.
13. Lachman J, Hamouz K, Orsák M, Kotíková Z. Carotenoids in potatoes – a short overview. Plant Soil Environment. 2016; 62(10):474–481.
14. Sanoussi AF, Adjatin A, Dansi A, Adebowale A, Sanni LO, Sanni A. Mineral composition of ten elites sweet potato (Ipomoea batatas Lam.) landraces of Benin. International Journal of Current Microbiology of Applied Science. 2016; 5(1):103-115.
15. Aweke A, Roba B. Evaluation of proximate composition of sweet potato [Ipomoea batatas L.) Lam] for better utilization through agro-food processing chain. Global Journal of Animal Breeding and Genetics. 2016;4(4):248255.
16. Yahaya SU, Saad AM, Mohammed SG, Afuafe SO. Growth and yield components of sweet potato (Ipomoea batatas L.) and their relationships with root yield. American Journal of Experimental Agriculture. 2015;9(5):1-7.
17. Amengor NE, Adofo K, Frimpong BN, Acheampong PP, Sagoe R, Osei-Adu J, et al. Profitability gap analysis of sweetpotato
production in Ghana: Evidence from sweet potato farmers and traders. Asian Journal of Agricultural Extension, Economics & Sociology. 2017;21(3):1-10.
18. Mitra S. Nutritional status of orange fleshed sweet potatoes in alleviating vitamin A malnutrition through a food-based approach. Journal of Nutrition and Food Science. 2012;2:160.
19. Hue SM, Boyce AN, Chandran S. Antioxidant activity, phenolic and flavonoid contents in different varieties of sweet potato (Ipomea batatas). Australian Journal of Crop Science. 2012;6(3):375-380.
20. Wee RY. Top sweet potato growing countries. WorldAtlas; 2017. Accessed on March 24, 2020 Available:worldatlas.com/articles/top-sweet-potato-growing-countries.html.
21. FAOSTAT. Statistic database. 2017; (Accessed on August 12th, 2020) Available:http://apps.fao.org
22. Bidzakin JK, Acheremu K, Carey E. Needs assessment of sweet potato production in northern Ghana: Implications for research and extension efforts. ARPN Journal of Agricultural and Biological Science. 2014;9(9):315-319.
23. Afuape SO, Nwankwo IIM, Omodamiro RM, Echendu TNC, Toure A. Studies on some important consumer and processing traits for breeding sweet potato for varied end-uses. American Journal of Experimental Agriculture. 2014;4(1):114-124.
24. Rafique F, Fatema K, Rahman MH, Ilossain MM. Vegetative growth and yield performance of eight sweet potato genotypes. Bangladesh Horticulture. 2015;1(2):103-110. ISSN 0379-1288
25. Amoatey HM, Sossah FL, Ahiakpa JK, Quartey EK, Appiah AS, Segbefia MM. Phenotypic profiles of different accessions of sweet potato (Ipomoea batatas L. Lam) in the coastal savanna agro-ecological zone of Ghana. African Journal of Agricultural Research. 2016;11(26):2316-2328. DOI: 10.5897/AJAR2016.11034 Article Number: A67DCBD59258
26. Saitama A, Nugroho A, Widaryanto E. Yield response of ten varieties of sweet potato (Ipomoea batatas L.) cultivated on dryland in rainy season. Journal of Degraded and Mining lands Management. 2017;4(4):919-926.

Ayimbire et al.; JEAI, 43(2): 44-55, 2021; Article no.JEAI.67289
55
27. Taffouo VD, Nono GV, Simo C. Evaluation of different sweet potato varieties for growth, quality and yield traits under chemical fertilizer and organic amendments in sandy ferralitic soils. African Journal of Agricultural Research. 2017;12(48):3379-3388. DOI: 10.5897/AJAR2017.12675 Article Number: D53978A66829
28. Ramírez DA, Gavilán C, Barreda C, Condori B, Rossel G, Mwanga ROM, et al. Characterizing the diversity of sweetpotato through growth parameters and leaf traits: Precocity and light use efficiency as important ordination factors. South African Journal of Botany. 2017;113:192–199
29. Irwan M, Rosmayati, Hanafiah DS, Rahmawati N, Bakti D. Analysis of changes in morphological characteristics of leaves and stems in some sweet potato cultivars (Ipomoea batatas L.) from Simalungun and Dairi highlands planting in the lowlands. IOP Conference Series: Earth and Environmental Science. 260 012150
30. Ghana Statistical Service (GSS). 2010 Population and Housing Census (PHC); 2014.
31. Dumbuya G, Sarkodie-Addo J, MA, Daramy MA, Jalloh M. Growth and yield response of sweet potato to different tillage methods and phosphorus fertilizer rates in Ghana. Journal of Experimental Biology and Agricultural Sciences. 2016;4(5):475-483
32. Motsara MR, Roy RN. Guide to laboratory establishment for plant nutrient analysis. Food and Agriculture Organization of the United Nations Rome, Italy. Fertilizer and Plant Nutrition Bulletin 19. 2008.
33. Agbede TM, Adekiya AO. Evaluation of sweet potato (Ipomoea batatas L.) performance and soil properties under tillage methods and poultry manure levels. Emirates Journal of Food and Agriculture. 2011;23(2):164-177.
34. Kathabwalika DM, Chilembwe EHC, Mwale VM, Kambewa D, J.P, Njoloma JP. Plant
growth and yield stability of orange fleshed sweet potato (Ipomoea batatas) genotypes in three agro-ecological zones of Malawi. International Research Journal of Agricultural Science and Soil Science. 2013;3(11): 383-392.
35. Su W, Liu Y, Lei J, Wang L, Chai S, Jiao C. et al. Phenotypic Variation Analysis of Sweet Potato Germplasm Resources from Different Agro-climate Zones in the World. American Journal of Experimental Agriculture. 2016;13(6):1-13.
36. Fleck S, Raspe S, Cter M, Schleppi P, Ukonmaanaho L. Greve M. Leaf area measurements: Part XVII. Thünen Institute for World Forestry, Germany; 2012.
37. Isa M, Setiado H, Putri LA. The effect of internode number and the grow angle on the growth and yield of several sweet potatoes (Ipomoea batatas L.) varieties. Journal of Agronomy. 2015;4:45-52.
38. Ochieng LA. Agro-morphological characterization of sweet potato genotypes grown in different ecological zones in Kenya. Journal of Horticulture and Plant Research. 2019;5:1-12. ISSN: 2624-814X, DOI:10.18052/www.scipress.com/JHPR.5.1
39. Koodi S, Singh SP, Rolaniya MK, Raj P. The Growth, yield and quality of sweet potato (Ipomoea batatas Lam.) Influenced by different plant densities. International Journal of Chemical Studies. 2017; 5(4):359-361.
40. Esan VI, Omilani OO. Assessment of four sweet potato (Ipomoea batatas L.) varieties for adapatibility and productivity in Iwo, Osun State. Asian Journal of Agricultural and Horticultural Research. 2018;1(1):1-8.
41. Ingabire MR, Vasanthakaalam H. Comparison of the nutrient composition of four sweet potatoes varieties cultivated in Rwanda. American Journal of Food and Nutrition. 2011;1(1):34-38.
_________________________________________________________________________________ © 2021 Ayimbire et al.; This is an Open Access article distributed under the terms of the Creative Commons Attribution License (http://creativecommons.org/licenses/by/4.0), which permits unrestricted use, distribution, and reproduction in any medium, provided the original work is properly cited.
Peer-review history: The peer review history for this paper can be accessed here:
http://www.sdiarticle4.com/review-history/67289