growth and yield responses of soybean in madhya pradesh ... · growth and yield responses of...
TRANSCRIPT

Growth and yield responses of soybean in Madhya Pradesh,
India to climate variability and change
M. Lala,*, K.K. Singhb, G. Srinivasanc, L.S. Rathoreb, D. Naidua, C.N. Tripathia
a Centre for Atmospheric Sciences, Indian Institute of Technology, New Delhi 110016, Indiab National Centre for Medium Range Weather Forecasting, New Delhi, India
c India Meteorological Department, New Delhi, India
Received 27 April 1998; accepted 24 September 1998
Abstract
This study is aimed at assessing the impact of thermal and moisture stresses associated with observed intraseasonal and
interannual variability in key climatic elements on the nature and extent of losses in growth and yield of soybean crop in
central India through the use of CROPGRO model. The crops are found to be more sensitive to higher cumulative heat units
during cropping season. The yields respond substantially to temporal variations in rainfall (associated with observed swings in
the continuity of monsoon). Prolonged dry spells at critical life stages of the soybean crop are found to adversely affect crop
development and growth and hence the yields at selected sites. We have also examined the plausible effects of future climate
change on soybean yields in the selected region based on simulations carried out for doubled atmospheric CO2 level and with
modi®ed weather variables using the available seasonal projections for the future. Our ®ndings on the response of elevated
CO2 concentrations in the atmosphere suggest higher yields (50% increase) for soybean crop for a doubling of CO2. However,
a 38C rise in surface air temperature almost cancels out the positive effects of elevated CO2 on the yield. Soybean crops at
selected site are more vulnerable to increases in maximum temperature than in minimum temperature. The combined effect of
doubled CO2 and anticipated thermal stress (likely by middle of the next century) on soybean crop is about 36% increase in
yield at the selected sites. A decline in daily rainfall amount by 10% restricts this yield gain to about 32%. De®cient rainfall
with uneven distribution during the monsoon season could be a critical factor for the soybean productivity even under the
positive effects of elevated CO2 in the future. # 1999 Elsevier Science B.V. All rights reserved.
Keywords: CROPGRO model; Soybean yields; CO2 effects; Climate change; Water and thermal stresses
1. Introduction
Indian agriculture has made great strides over the
last 50 years. The foodgrains production in India has
increased from 54.92 million tonnes in the 1949±50 to
198.96 million tonnes in 1996±97 with the per capita
availability improving from a low 395 g in 1951 to
about 500 g per day despite the population increase
from 361 millions to 950 millions today. However, in
recent years, the pace of the green revolution seems to
have started slowing down due to immense pressure on
India's land resources and indiscriminate addition of
restorer inputs such as inorganic fertilizers, pesticides
Agricultural and Forest Meteorology 93 (1999) 53±70
*Corresponding author. Tel.: +91-11-6960963; fax: +91-11-
6862037; e-mail: [email protected]
0168-1923/99/$ ± see front matter # 1999 Elsevier Science B.V. All rights reserved.
PII: S0168-1923(98)00105-1

etc. and their inef®cient use. To achieve long-term
sustainability in food production in the coming de-
cade, higher growth rates in crop yields must be
attained from diminishing per capita arable land
and scarce irrigation water resources.
The strong links between vagaries of the Indian
summer monsoon and agricultural productivity are
well known. Even with minor deviations from the
`normal' weather, the ef®ciency of externally applied
inputs and food production is seriously impaired.
Moisture stress due to prolonged dry spells or thermal
stress due to heat wave conditions signi®cantly affect
the agricultural productivity when they occur in cri-
tical life stages of the crop. Lack of our understanding
on the links between the climate variability and crop
productivity together with global warming and its
likely impact could seriously endanger sustained agri-
cultural production in the coming decades.
Recent studies on plausible changes in climate
explored by global climate models (GCMs) suggest
that, in addition to the thermal stress due to global
warming, stress on water availability in tropical Asia
is likely to be exacerbated in the future (IPCC, 1996a).
Studies also suggest a marked reduction in crop yields
in the arid and subhumid tropical regions (IPCC,
1996b). While these are long-term assessments
focussing on average effects over space and time, at
regional and local scales the effects of climate change
could be more adversely felt particularly in developing
countries like India which shares only 2% of the
world's geographical area but supports around 18%
of the world's population and over 15% of world's
livestock. In India, about 65% of gross cropped area
corresponds to the summer monsoon season (about
70% of the total annual rainfall in India occurs during
June±September) indicating its heavy dependence on
the monsoon rainfall. In order to ensure a balanced
growth and development in agriculture (during 1990±
1996 the growth rate is 2.37% per annum), a com-
prehensive understanding and assessment of the likely
impact of climate variability/change on our agricul-
tural productivity is warranted.
There have been a few studies both in India and
elsewhere aimed at understanding the nature and
magnitude of gains and/or losses in yield of particular
crops at selected sites under elevated atmospheric CO2
conditions and associated climatic change (e.g., Abrol
et al., 1991; Sinha and Swaminathan, 1991; Aggarwal
and Sinha, 1993; Aggarwal and Kalra, 1994; Gang-
adhar Rao and Sinha, 1994; Mearns et al., 1996; Riha
et al., 1996; Lal et al., 1998). These studies have been
mainly con®ned to cereal crops namely wheat and
rice. In this study, an attempt has been made to assess
the effects of climate variability and change on the
productivity of soybean, a leguminous crop in the state
of Madhya Pradesh, India using CROPGRO±soybean
simulation model (IBSNAT, 1989).
In recent years, soybean [Glycine max (L.) Merrill]
has emerged as one of the major rainy season cash
crops in central India. The state of Madhya Pradesh
has distinguished itself as a `Soya State' on account of
its largest share in area (77%) and production (72%) of
soybean in India. The growth in area, production and
productivity of soybean in Madhya Pradesh has been
from 1.21 mha in 1986±1987 to 3.70 mha in 1995±
1996, from 0.67 million tonnes in 1986±1987 to 2.90
million tonnes in 1995±1996 and 560 kg haÿ1 in
1986±1987 to 784 kg haÿ1 in 1995±1996, respectively
(SOPA, 1996). This trend of fast adoption of soybean
by the farmers is indicative of its potential to emerge
as a leading commercial crop in future. Soybean is
also ideal for intercropping as well as crop sequences
as it is a short duration (85±130 days) crop and is
comparatively tolerant to drought (Lawn, 1982) and
excessive soil moisture conditions (Wright et al.,
1988). Its better ability to ®x nitrogen, low phosphor-
ous requirement and tolerance to low pH and high
levels of aluminium (Tanaka, 1983) make it a suitable
choice for adoption in a wider area. Compared to
sorghum and corn, soybean ± an edible oil generating
legume ± has been reported to fetch higher price and
net returns (Soni et al., 1990).
The ability of the CROPGRO±soybean model to
simulate realistically the observed soybean yields in
the region during the past decade has been established
here using the daily weather data for four stations viz.,
Indore, Gwalior, Jabalpur and Raipur located in the
state of Madhya Pradesh. The geographical location of
these stations is depicted in Fig. 1. The responses of
the crop growth and yield in the region to thermal and
moisture stresses due to observed intraseasonal and
interannual variability in key weather parameters have
been examined in this paper. We also report here our
®ndings on the possible impacts of climate change on
soybean yields in the selected region based on simula-
tions carried out using doubled atmospheric CO2 level
54 M. Lal et al. / Agricultural and Forest Meteorology 93 (1999) 53±70

and modifying the baseline weather variables with the
future regional projections as inferred from recent
GCM results.
2. Model description and it's validation
2.1. The model
Crop models which share a common input and
output data format have been developed and
embedded in a software package called the Decision
Support System for Agrotechnology Transfer (DSSAT).
The DSSAT itself (Jones, 1993; IBSNAT, 1994; Tsuji
et al., 1994) is a shell that allows the user to organize
and manipulate crop, soil and weather data and to run
crop models in various ways and analyze their outputs.
The models running under DSSAT include the CERES
model for rice, wheat, maize, sorghum, pearl millet
and barley; the CROPGRO (CROP GROwth) model
for bean, peanut and soybean.
CROPGRO is a generic, physiological, process-
oriented legume crop growth model. The major com-
ponents of the CROPGRO±soybean model are the
vegetative and reproductive development, carbon bal-
ance, water balance and nitrogen balance modules
which relate the ¯ow of mass and information between
different modules. The basic structure of the model,
including underlying differential equations, has been
explained in several other publications (Wilkerson
et al., 1983; Boote et al., 1985; Hoogenboom et al.,
1991). The model accounts for vegetative and repro-
ductive development, photosynthesis, respiration, par-
titioning e.g., growth of leaves, stems, roots, shells and
seeds, transpiration, root water uptake, soil evapora-
tion, soil water ¯ow, in®ltration and drainage (Wilk-
erson et al., 1983; Jones et al., 1991; Hoogenboom
et al., 1992).
CROPGRO±soybean model uses empirical func-
tions to compute daily canopy gross photosynthesis
in response to CO2 concentration, air temperature and
daily canopy evapotranspiration (Peart et al., 1989).
Photosynthesis and evapotranspiration algorithms
have been modi®ed to take into account the changes
in daily canopy photosynthesis under elevated CO2
concentration and temperature conditions (Curry
et al., 1990a, b).
2.2. Input data
The input data required to run the CROPGRO±
soybean model include daily weather data, soil albedo,
soil water drainage constant, ®eld capacity, wilting
point and initial soil moisture in different layers as
well as maximum root depth, crop genetic coef®cients
and management practices (plant population, plant
Fig. 1. Locations of selected stations in the state of Madhya Pradesh, India considered in this study.
M. Lal et al. / Agricultural and Forest Meteorology 93 (1999) 53±70 55

row spacing and nitrogen application). Other input
®les include chemical and physical description of the
soil pro®le with separate information for each horizon,
initial organic matter in the soil at the beginning of the
experiment, initial soil water content, nitrogen con-
centration and pH for each layer of the soil pro®le,
dates and amount of irrigation required for irrigation
management, dates, amount and types of fertilizer
required for fertilizer management, planting date
and depth, row and plant spacing and other informa-
tion for crop management, cultivar-speci®c character-
istics and genetic coef®cients, and crop speci®c
characteristics.
The long-term observed daily weather data on
maximum and minimum temperatures, solar radiation
(derived from sunshine hours data) and rainfall at the
selected stations, namely, Indore, Gwalior, Jabalpur
and Raipur have been used in this study. The optimum
dates of sowing are chosen as per the current ®eld
practices at the selected sites. Soil water holding
characteristics for selected sites and the period of
weather data used are given in Table 1. The terms
lower limit and drained upper limit correspond to the
permanent wilting point and ®eld capacity, respec-
tively (Ritchie et al., 1986). Total extractable soil
water is a function of soil physical characteristics
as well as rooting depth.
2.3. Genetic coefficients
Crop genetic input data, which explain how the life
cycle of a soybean cultivar responds to its environ-
ment, are not usually available and therefore, these
were derived iteratively following Hunt's method
(Hunt et al., 1993). This involved determining values
of the phenology coef®cients and then values of the
coef®cients describing growth and grain development.
Minimum crop data sets required for these calcula-
tions included dates of emergence, anthesis, maturity,
pod initiation and full pod, grain yield, above-ground
biomass, grain density and weight. To obtain the
desired level of agreement between simulated and
observed values of development and growth, the
model was run initially with genetic coef®cients
derived elsewhere for cultivar Bragg (Table 2) and
then re-run using a range of values of each coef®cient
in the order indicated above. All calibration data to
derive genetic coef®cients were obtained from plot
experiments at Jabalpur during 1993 and 1994. Soy-
bean variety considered in the model is JS7244 (early
maturing `Gaurav' variety with life cycle of 105 days),
one of the currently prevailing varieties in the state.
2.4. Model validation
Validation of the model is based on crop yield data
available from experimental sites at Jabalpur (for the
period 1987±1996 with marginally different sowing
dates in different years) and at Raipur for the period
1991±1997. At Jabalpur, irrigation was given in some
of the years during seed ®lling stage whenever severe
moisture stress was observed. In order to evaluate the
performance of CROPGRO model in simulating soy-
bean crop yields in response to historical climate
variability, a comparison of observed vs. model-simu-
lated yields for Jabalpur and Raipur has been made in
Fig. 2. Each of the series of data represent the same
agromanagement and other agricultural practices.
Table 1
Soil water holding characteristics at selected sites and period of weather data used
Station/period Location Soil depth
(cm)
Lower/drained
upper limit (mm)
Saturated water
content (mm)
Extractable water
content (mm)
Raipur (1971±97) 21.27 N 60 102/180 240 78
81.60 E
Gwaliora (1965±88) 26.15 N 90 126/234 333 108
78.14 E
Indore (1985±95) 22.72 N 80 152/264 344 112
71.80 E
Jabalpur (1969±97) 23.15 N 70 133/226 294 93
79.97 E
a Weather data beyond 1988 currently not available.
56 M. Lal et al. / Agricultural and Forest Meteorology 93 (1999) 53±70

Correlation coef®cients of 0.90 and 0.93 between the
observed and model simulated yields for Jabalpur and
Raipur have been obtained, respectively. Although the
model realistically simulates the year to year varia-
tions in yields, deviations in simulated and observed
yields are perhaps due to unaccounted factors such as
soil micronutrient status, soil pH, pest or disease
incidences etc. The large deviation between observed
and simulated yields at Jabalpur in the years 1993 and
1994 are due to rust incidences reported at the experi-
mental site. The farm level yield data at Raipur for the
variety considered in this study were within
360 kg haÿ1 of the model simulated yields during
the period from 1991 to 1997.
CROPGRO model simulates interannual variability
in crop yields depending upon the daily weather
variables for each of the selected years. The long-
term mean soybean crop yields of 1234 kg haÿ1 for
Indore (SD �928 kg haÿ1), 1097 kg haÿ1 for Gwalior
(SD �660 kg haÿ1), 1407 kg haÿ1 for Jabalpur (SD
�830 kg haÿ1) and 1586 kg haÿ1 for Raipur (SD
�783 kg haÿ1) are simulated during the selected per-
iod. To establish validity of the model's applicability
at a regional scale, a comparison of the simulated
yields at selected sites with those reported at district
level has also been made. In view of the varietal
transition in the soybean crop in Madhya Pradesh
after 1990, average simulated yields for the years
1991±95 only has been considered here. Fig. 3 depicts
a comparison of observed and model-simulated mean
soybean yields at selected sites (observed as well as
simulated yields are for the period 1991±1995 but for
Gwalior, the simulated yields are for 1983±88). Keep-
ing in view that the applications of fertilizers are
identical at all the four locations in the model simula-
tions and that the changes in variety sown within each
district in actual practice are not accounted for, the
simulated yields are in close proximity to those
obtained in ®eld at selected stations.
2.5. The model experiments and climate change
scenarios
Our primary interest in this study was to explore the
impact of intraseasonal and interannual variability in
key climatic elements as observed in historical daily
weather data on the productivity of soybean crop in the
selected regions. To examine the crop growth char-
acteristics under contrasting thermal and water stress
conditions, years with extreme cumulative heat unit
and/or rainfall anomalies (deviation from long-term
cumulative daily maximum and minimum tempera-
Table 2
Genetic coefficient development for soybean cultivar JS7244 in the agroclimatic conditions of Madhya Pradesh
Growth and development aspects of the soybean crop Genetic coefficient
for Bragg
Genetic coefficient
for JS7244
Development aspects
Critical short day length (hour) 12.01 11.0
Slope of relative response of development to the photoperiod (hÿ1) 0.32 0.305
Time between plant emergence and flower appearance (photothermal days) 19.5 15.53
Time between first flower and first pod (-do-) 10.0 6.00
Time between first flower and first seed (-do-) 15.0 10.0
Time between first seed and physiological maturity (-do-) 35.3 26.0
Time between first flower and end of leaf expansion (-do-) 15.0 15.0
Seed filling duration (photothermal days) 20.6 23.06
Time required for cultivar to reach final pod load (-do-) 10.0 8.84
Growth aspects
Maximum leaf photosynthesis rate (minimal CO2 mÿ2 sÿ1) 0.95 0.90
Specific leaf area (cm2 gmÿ1) 350 370
Maximum size of full leaf (cm2) 170 170
Maximum fraction of daily growth partitioned to seed and shell 1.00 1.00
Maximum weight per seed (gm) 0.10 0.10
Average seed per pod 1.6 1.9
M. Lal et al. / Agricultural and Forest Meteorology 93 (1999) 53±70 57

tures in degrees Celsius and cumulative rainfall in mm
during the crop growth period) were identi®ed. The
selected contrast years, weather anomalies (including
the climatological percentiles) and model-simulated
yields for each of the four stations considered in the
study are listed in Table 3. These climatologically
anomalous seasons enable us to identify the speci®c
impacts of intraseasonal variability in weather para-
meters on crop development and growth in our model
simulations.
We have also assessed the changes in productivity
of soybean crop in the selected region under condi-
tions of elevated atmospheric CO2 level and environ-
mental stress linked to future climatic changes through
sensitivity studies. Two key factors of the environ-
mental management namely the thermal and water
Fig. 2. Observed (yields at experimental sites) and model-simulated soybean yields at Jabalpur (for the years 1987±1996) and Raipur (for the
years 1991±1997).
58 M. Lal et al. / Agricultural and Forest Meteorology 93 (1999) 53±70

stresses have been considered while simulating the
soybean yields. The response of soybean crop at
selected sites to change in CO2 concentration from
330 ppmv to 660 ppmv (doubled CO2 atmosphere) has
been examined. The response to thermal and water
stresses (for changes in mean surface air temperature
ranging from ÿ58C to 48C and for ÿ40% to �40%
change in total rainfall) on soybean yields have been
Fig. 3. Observed and model-simulated average soybean yields at selected sites in Madhya Pradesh (observed as well as simulated yields are
for the period 1991±1995 but for Gwalior, the simulated yields are for 1983±88). The solid bars indicate the observed and simulated standard
deviations in yield.
Table 3
Anomalies in key climatological parameters and simulated soybean yields at selected sites during contrasting years
Station Years Yield (kg haÿ1) ��Tx (8C) ��Tn (8C) ��R (mm)
Raipur 1979 307 162 (>0.99) 90 (>0.90) ÿ431 (<0.01)
1994 2181 ÿ144 (<0.05) ÿ110 (<0.15) 255 (>0.85)
1995 948 37 (<0.70) 43 (<0.65) 2 (<0.60)
Gwalior 1978 459 ÿ168 (<0.10) ÿ449 (<0.01) ÿ398 (<0.05)
1983 1963 3 (<0.50) ÿ25 (<0.35) 56 (<0.55)
1987 398 246 (>0.99) 246 (>0.99) ÿ341 (<0.10)
Indore 1987 803 226 (>0.99) 102 (>0.95) ÿ187 (<0.20)
1990 2716 ÿ11 (<0.01) 9 (<0.85) ÿ32 (<0.75)
1991 386 39 (<0.70) ÿ156 (<0.01) ÿ117 (<0.35)
Jabalpur 1979 129 299 (>0.99) 22 (>0.65) ÿ713 (<0.01)
1981 1101 59 (>0.70) ÿ10 (<0.45) ÿ657 (<0.02)
1991 431 31 (>0.55) ÿ40 (<0.25) 43 (>0.45)
Tx and Tn represent maximum and minimum temperatures and R is the rainfall.
The numbers in brackets are the climatological percentiles.
M. Lal et al. / Agricultural and Forest Meteorology 93 (1999) 53±70 59
explored. Simulations of soybean crop yields have
also been performed under the combined in¯uence of
elevated CO2 concentrations (660 ppmv) and the pro-
jected regional climate change scenarios.
The spatial distributions of likely changes in surface
air temperature as simulated by the recent global
climate models for doubled CO2 atmosphere with
respect to the present-day climate reveal that the
simulated surface warming over the central plains
of India during monsoon season is likely to be
�1.08C (Lal et al., 1995). A decline (�0.58C) in
the diurnal temperature range is also simulated (Lal
et al., 1996). Over the central plains of India, the
model simulations suggest an average decrease of
about 1.0 mm dayÿ1 in summer monsoon rainfall
under the combined in¯uence of doubled CO2 and
sulphate aerosol forcings (Mitchell et al., 1995; Lal
et al., 1995; Meehl et al., 1996). These scenarios have
been used in the crop simulation experiments to assess
the vulnerability of soybean crops at selected sites in
India to future climate change. Our ®ndings on these
experiments are presented and discussed in the
following section.
3. Results and discussion
3.1. Intraseasonal and interannual climate
variability and simulated crop yields
Two contrast years 1979 and 1994 at Raipur are
characterized as warm season (�1628C day-time heat
unit anomaly) and cold season (ÿ1108C night-time
heat unit anomaly), respectively, during the selected
time period. The cumulative rainfall for the cropping
season was also signi®cantly below normal in the year
1979. Soybean yields of 307 kg haÿ1 for the year 1979
and 2181 kg haÿ1 for the year 1994 are obtained in our
model simulation. The soybean yield was simulated to
be 948 kg haÿ1 in year 1995 when no net thermal or
water stresses were present during the cropping sea-
son. However, the crop in 1995 suffered acute water
stress conditions from ®rst pod to harvesting stages
due to uneven distribution of rainfall during the crop-
ping season this year. The simulated partitioning
factors (fraction of total dry matter weight of a plant)
for various components of the crop from sowing to
harvesting stages for each of these 3 years are illu-
strated in Fig. 4. A larger partitioning of the photo-
synthetic assimilates to the stem and/or root at the
expense of pod and grain are obtained for the years
1979 and 1995 as compared to the year 1994. Parti-
tioning of the photosynthetic assimilates to pod and
grain was higher in 1994 which led to higher biomass
production and hence better crop yields in our simula-
tions. The dry matter weights for stem, leaf and grain
at few stages of the development and growth of
soybean crop reported from one experimental site in
Raipur for the years 1994 and 1995 are found to be
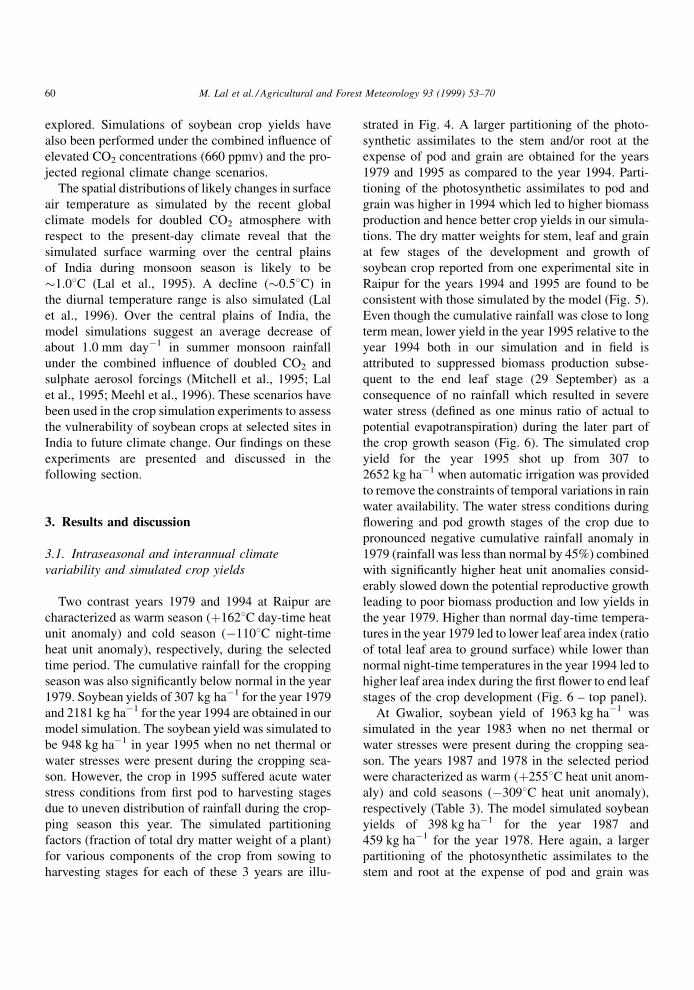
consistent with those simulated by the model (Fig. 5).
Even though the cumulative rainfall was close to long
term mean, lower yield in the year 1995 relative to the
year 1994 both in our simulation and in ®eld is
attributed to suppressed biomass production subse-
quent to the end leaf stage (29 September) as a
consequence of no rainfall which resulted in severe
water stress (de®ned as one minus ratio of actual to
potential evapotranspiration) during the later part of
the crop growth season (Fig. 6). The simulated crop
yield for the year 1995 shot up from 307 to
2652 kg haÿ1 when automatic irrigation was provided
to remove the constraints of temporal variations in rain
water availability. The water stress conditions during
¯owering and pod growth stages of the crop due to
pronounced negative cumulative rainfall anomaly in
1979 (rainfall was less than normal by 45%) combined
with signi®cantly higher heat unit anomalies consid-
erably slowed down the potential reproductive growth
leading to poor biomass production and low yields in
the year 1979. Higher than normal day-time tempera-
tures in the year 1979 led to lower leaf area index (ratio
of total leaf area to ground surface) while lower than
normal night-time temperatures in the year 1994 led to
higher leaf area index during the ®rst ¯ower to end leaf
stages of the crop development (Fig. 6 ± top panel).
At Gwalior, soybean yield of 1963 kg haÿ1 was
simulated in the year 1983 when no net thermal or
water stresses were present during the cropping sea-
son. The years 1987 and 1978 in the selected period
were characterized as warm (�2558C heat unit anom-
aly) and cold seasons (ÿ3098C heat unit anomaly),
respectively (Table 3). The model simulated soybean
yields of 398 kg haÿ1 for the year 1987 and
459 kg haÿ1 for the year 1978. Here again, a larger
partitioning of the photosynthetic assimilates to the
stem and root at the expense of pod and grain was
60 M. Lal et al. / Agricultural and Forest Meteorology 93 (1999) 53±70

simulated for the years 1978 and 1987 as compared to
the year 1983. The cumulative crop duration rainfall
was below normal in both the years 1978 and 1987.
The crops were subjected to severe water stress which
led to increase in the amount of carbohydrates dis-
tributed to stem and roots. Leaf and grain growth
suppression resulted in a negative feedback on photo-
synthetic assimilation thereby further reducing bio-
mass production. The simulated crop yields shot up to
2713 and 1910 kg haÿ1 in 1978 and 1987, respec-
tively, when automatic irrigation switch was turned
on. Soybean yields of over 2500 kg haÿ1 have been
Fig. 4. Relative vegetative and reproductive partitioning factors (fraction of total dry matter weight of a plant) as a function of crop lifetime
for Raipur in selected years.
M. Lal et al. / Agricultural and Forest Meteorology 93 (1999) 53±70 61

attained at experimental sites in Madhya Pradesh in
years with uniform distribution of rainfall during the
cropping season.
The features on crop development and growth
similar to those discussed above were also obtained
in our simulation using year-speci®c environmental
conditions as listed in Table 3 for two other sites. The
soybean yields at selected sites are found to be sensi-
tive to higher than normal cumulative heat units during
the cropping season. Moreover, water stress condi-
tions at critical life stages of the crop adversely affect
the development and growth and hence the crop yields
at the selected sites. This suggests that the temporal
variations in rainfall (associated with the observed
swings in the continuity of monsoon) during the
cropping season plays a dominant role in the inter-
Fig. 5. Observed (O) and simulated (S) dry matter weights of vegetative and reproductive components of soybean crop as a function of time
for Raipur in selected years.
62 M. Lal et al. / Agricultural and Forest Meteorology 93 (1999) 53±70

annual variability of rainfed soybean crop productivity
at selected sites.
3.2. Elevated CO2 levels and crop productivity
CO2 is vital for photosynthesis and hence for plant
growth. The increase in atmospheric CO2 concentra-
tion should increase the rate of plant growth (Cure and
Acock, 1986). There are, however, important differ-
ences between the photosynthesis mechanisms of
different crop plants and hence in their response to
increasing CO2. Plants with nitrogen-®xing symbiont
(e.g., soybean, beans) under favourable environmental
conditions tend to bene®t more from enhanced CO2
supplies than other plants (Cure et al., 1988). Root/
shoot ratios often increase under elevated CO2 levels
favouring root capillaries and also contribute to soil
organic matter build-up (Mauney et al., 1992). Crop
plants show increased water-use ef®ciency under ele-
vated CO2 levels (due to stomatal closure), but water
Fig. 6. Biomass production (BIO) and leaf area index (LAI) (top panel) and cumulative rainfall, CRF and water stress, WS (bottom panel) as a
function of crop lifetime for Raipur in selected years (CRF is the accumulated rainfall amount from the date of sowing and WS is defined as
one minus the ratio of actual to potential evapotranspiration. These two parameters together identify the moisture deficient condition at
selected stages of crop growth).
M. Lal et al. / Agricultural and Forest Meteorology 93 (1999) 53±70 63

consumption on ground area basis vs. leaf area basis is
also affected. Water use on a ground area basis can
actually increase if leaf area (canopy) increases.
On an average, a 50% increase in yield of soybean
has been obtained in our simulations for a doubling of
atmospheric CO2 from its current level of 330 ppmv.
This is essentially due to an increase in photosynthesis
rate and hence plant growth under the direct effects of
elevated CO2 concentration. Our results are consistent
with those reported elsewhere suggesting that a dou-
bling of atmospheric CO2 concentration from 330 to
660 ppmv might cause a 18±40% increase in yield of
soybean crop (Adams et al., 1990; Sinclair and Raw-
lins, 1993). In some studies yield increases upto 110%
have also been reported (Haskett et al., 1997).
The increased CO2 has an important effect on the
stomatal regulation also. Our simulation experiments
suggest that, increases beyond the current atmospheric
CO2 level only marginally reduce transpiration at leaf
level due to decreased stomatal aperture. It may be,
therefore, stated that higher CO2 concentration alone
will exert little or no effect on regional evapotranspira-
tion. Moreover, as a consequence of rise in surface air
temperature under elevated CO2 levels due to green-
house effect, evaporative demand may increase enhan-
cing water loss from vegetation without any
substantial compensation expected from CO2-induced
stomatal closure. Morison (1987) suggested that, as an
upper limit, doubling of CO2 concentration could
reduce the plant transpiration by about 40% (depend-
ing upon the humidity conditions around a leaf) as a
result of stomatal conductance changes and this may
lead to higher water use ef®ciency by the plant.
However, the decline in transpiration is subject to
atmospheric feedback at spatial scales (McNaughton
and Jarvis, 1991; Jacobs and DeBruin, 1992). The
recent literatures also suggest that, for C3 species, the
major effect of CO2 increase is in assimilation rather
than in transpiration (Goudriaan and Unsworth, 1990).
While CO2 enrichment of the atmosphere tends to
increase crop yields, the associated warming may
decrease or increase crop yields depending on envir-
onment. Therefore, interaction of CO2 effects with
other environmental factors, such as temperature,
rainfall etc. must also be examined. In the next section,
we shall examine the response of soybean crop to
thermal and moisture stresses both under current and
elevated CO2 conditions.
3.3. Sensitivity to thermal and water stresses
The biological processes in plants associated with
increased levels of CO2 would depend on the changes
in surface temperature. Higher temperatures could
accelerate plant development (early ¯owering) and
shorten the growth period (grain ®lling) and thus affect
the crop phenology and dry matter production (Butter-
®eld and Morison, 1992). Particularly, the enzyme
controlled biochemical portion of photosynthesis is
strictly dependent on temperature. Thus, the light use
ef®ciency could be affected below some threshold of
minimum temperature and above some threshold of
maximum temperature. Whigham and Minor (1978)
suggested that decrease in temperature would nor-
mally delay ¯owering in soybean by 2±3 days for
each decrement of 0.58C. Flower initiation was accel-
erated when mean temperature increased; however,
beyond a certain limit, temperature increase had an
adverse effect on the rate of node formation, internal
growth and ¯ower initiation. Jeyaraman et al. (1990)
also studied the in¯uence of temperature on the crop
growth stages and yield of soybean, and concluded
that production potential of soybean crop can be
enhanced when grown under maximum temperatures
of 31.2±31.68C and minimum temperatures of 20.4±
20.98C.
We performed a set of simulations to examine the
sensitivity of soybean productivity to surface tempera-
ture on at the selected sites using the CROPGRO
model wherein daily mean surface temperature
changes within a range from ÿ58C to �48C have
been considered under the current and elevated CO2
conditions. These temperature changes were super-
imposed on the observed daily maximum and mini-
mum temperature data series for all the years
considered in our simulations. The average yields
are higher by 14% for a mean temperature 38C below
the present-day climate for current atmospheric CO2
concentrations (Fig. 7) suggesting thereby that the
present-day temperatures at selected sites are already
higher in terms of optimal thermal condition for
attaining highest yields for the soybean variety con-
sidered here. Under doubled atmospheric CO2 con-
centration, a 22% increase in soybean yield is obtained
at this optimal temperature when the 50% increase in
yields due to doubling of CO2 are not included. The
maturity day of the crop extends by 3 days in duration
64 M. Lal et al. / Agricultural and Forest Meteorology 93 (1999) 53±70

for both the CO2 levels at this optimal temperature.
Soybean yields show a marginal decline for mean
temperatures below 58C relative to the present-day
conditions.
The yields in soybean are found to decline more
signi®cantly for a rise in temperature with respect to
the present-day climate. When CO2 concentrations is
doubled but no changes in surface air temperature are
imposed, the soybean yield is 50% more than that
simulated for the current atmospheric CO2 concentra-
tions. The maturity day remains unchanged. When
daily mean temperatures are increased by 18C and
CO2 is doubled, the net increase in yield is limited to
only 36% and crop maturity shortens by a day. A rise
in temperature by 38C almost cancels out the positive
effects of elevated CO2 such that soybean yield
decreases by 1%. Maturity occurs 2 days earlier. A
rise in present-day temperature by 48C together with
doubling of CO2 leads to a net decline of 21% in
simulated soybean yield.
Probably the most important consequences for
agriculture would stem from a reduction in soil moist-
ure due to higher rates of evaporation from soil surface
exposed to higher temperatures. A decline in rainfall
and hence reduced water availability could put an
additional stress on the crop productivity in a region.
To consider the sensitivity of changes in monsoon
rainfall on soybean yields in the region under study,
we have also performed a series of simulations
wherein daily rainfall changes within a range from
ÿ40% to �40% have been considered under the
current and elevated atmospheric CO2 concentrations.
A 40% decline in daily rainfall reduces the soybean
yield by about 18% (due to constraints on the avail-
ability of water) while a 40% enhancement in daily
rainfall increases the yield by just 8% under present-
day atmospheric CO2 level when other environmental
conditions including the intraseasonal variability
remain unchanged (Fig. 8). A 40% decline in daily
rainfall in doubled CO2 atmosphere, however, reduces
the soybean yield by only 12% as a consequence of
increased water use ef®ciency. Thus, it appears that
the adverse impacts of rainfall decline on soybean
crops would be at least marginally reduced under
elevated CO2 levels.
3.4. Soybean yields under projected climate change
scenario
The surface air temperature over the selected sites is
likely to increase by about 18C during the soybean
cropping season when atmospheric CO2 would double
its current concentrations. Climate model simulations
also indicate that future temperature change linked to
Fig. 7. Response of changes in surface air temperature on soybean yields in Madhya Pradesh (averaged for selected stations) for the present-
day and doubled atmospheric CO2 conditions.
M. Lal et al. / Agricultural and Forest Meteorology 93 (1999) 53±70 65

global warming might be characterized by a marked
asymmetry between day time maxima and night time
minima (Karl et al., 1991). The increase would be
more pronounced in the night-time temperature, thus
leading to a decline in diurnal temperature range
(DTR). Under doubled atmospheric CO2 conditions,
a 0.58C decline in DTR during the soybean cropping
season over the selected sites could occur by a change
in both maximum and minimum temperatures by
different magnitude (Lal et al., 1996). We have exam-
ined the implications of this change in DTR under
elevated CO2 conditions on the productivity of soy-
bean at selected sites.
A 50% increase in soybean yield is obtained in our
simulations for a doubling of atmospheric CO2. A rise
of 18C in minimum temperature with doubled CO2
limits the yield increases to 48% (Fig. 9). However, a
rise of 18C in maximum temperature with elevated
CO2 restricts the yield increase to only 40%. The
combined effect of enhanced CO2 and thermal stress
(maximum temperature is increased by 18C and mini-
mum temperature increased by 1.58C) on the soybean
crop productivity in the selected region is a net 35%
increase in current yields. A concurrent rise in max-
imum temperature by 38C and minimum temperature
by 3.58C cancels out the positive effects of elevated
CO2 such that a net 5% decrease in the current yields is
obtained in our simulations.
From above, it is evident that in a doubled CO2
atmosphere, soybean yield at selected sites should
increase as compared to current CO2 levels even under
moderate thermal stress condition projected for the
future based on available climate change scenarios.
The interannual variations in soybean crop yield are,
however, likely to be more pronounced under elevated
CO2 concentration than under current CO2 levels. The
standard deviation for yield is minimum for Gwalior
(�966 kg haÿ1) and maximum for Indore
(�1279 kg haÿ1) under doubled CO2 conditions.
Recent climate model simulations suggest the possi-
bility of more frequent extreme events e.g., heat
waves, droughts etc. in a warmer atmosphere (IPCC,
1998). However, we have assumed here that the nature
of observed intraseasonal variability in key climatic
elements remains unchanged which may not be valid
in the future.
In order to assess the impact of any future decline in
the observed rainfall on soybean crop over the region,
we have conducted another set of simulations con-
sidering a 10±50% decline in daily observed rainfall
Fig. 8. Response of changes in cumulative rainfall on soybean yields in Madhya Pradesh (averaged for selected stations) for the present-day
and doubled atmospheric CO2 conditions.
66 M. Lal et al. / Agricultural and Forest Meteorology 93 (1999) 53±70

Fig. 9. Response on soybean yields in Madhya Pradesh under doubled CO2 conditions to changes in maximum and minimum temperatures
and a decline in diurnal temperature range.
Fig. 10. Response on soybean yields in Madhya Pradesh under doubled CO2 conditions to changes in maximum and minimum temperatures,
likely decline in diurnal temperature range and a decline in rainfall.
M. Lal et al. / Agricultural and Forest Meteorology 93 (1999) 53±70 67

over the region. These simulations suggest that a
decline in rainfall with anticipated thermal stress
(maximum temperature is increased by �18C and
minimum temperature is increased by �1.58C) leads,
on an average, to a reduction in crop yield by nearly
5% for every 10% decline (Fig. 10). The positive
effects of elevated CO2 almost cancel out with
enhanced thermal stress (maximum temperature is
increased by �28C and minimum temperature is
increased by �2.58C) and reduction in rainfall by
40% and 50% such that soybean yield is up by only
�1% and down by ÿ6%, respectively. This suggests
that signi®cantly de®cient monsoon rainfall condi-
tions combined with thermal stress should adversely
affect the positive effect of elevated CO2 on the
soybean crop in Madhya Pradesh, India.
4. Limitations of the study
The primary thrust of most crop simulation models
is to analyze how the weather and genetic character-
istics can affect the potential crop yields under a
speci®ed management scheme. The nutrient factors
representing phosphorus, potassium and other essen-
tial plant nutrients are assumed to be in abundant
supply in the soil so as not to cause any extent of
stress over plant and currently excluded in models.
Investigations on the crop's response to adverse soil
conditions need attention. The study reported here
does not include the yield losses due to weeds, insects
and diseases. The rise in surface temperature, parti-
cularly during the humid monsoon season, may create
more conducive conditions for pest infection and
hence loss of crops. The prevalence of pests and
diseases could be among the major constraints for
achieving higher crop yields in tropical countries like
India.
The agricultural crop yields are sensitive to climate
variability experienced through the occurrence of
extreme events such as droughts, ¯oods and heat
waves. Since subtle interactions of climate variables
are responsible for differential crop growth, an
increase in the probability of extreme events may
adversely affect the crop productivity. The impact
of intraseasonal and interannual variability in pre-
sent-day climate and its impact on soybean yields is
accounted for in our simulations through use of a long
time-series of daily weather data. However, the nature
of interannual and intraseasonal variability may not
remain same under enhanced CO2 conditions. There is
considerable uncertainty regarding how climate varia-
bility will change under perturbed climate conditions
and hence not accounted for in this study.
5. Conclusions
CROPGRO model is able to simulate soybean
yields which are in fair agreement with the currently
reported yields at selected locations in Madhya Pra-
desh (Indore, Gwalior, Jabalpur and Raipur). The
interannual variability in simulated yields are also
in close proximity to observed farm level yields.
The soybean crops are found to be more sensitive
to higher than normal heat units. Water stress condi-
tions due to temporal variations in rainfall (associated
with observed swings in the continuity of monsoon)
during the cropping season are found to adversely
affect the crop development and growth at critical life
stages of the crop and hence the yields at the selected
sites.
Our ®ndings suggest higher yields for soybean crop
(50% for a doubling of CO2) under elevated CO2
levels essentially as a result of enhanced photosynth-
esis rate. However, a rise in the surface air temperature
due to doubling of CO2 results in reducing the total
duration of crop (and hence reduced productivity) by
inducing early ¯owering and shortening the grain ®ll
period. Soybean crops in the study region are found to
be more vulnerable to increases in maximum tem-
perature than in minimum temperature. While the
moisture stress is crucial for the soybean yield at
selected sites, the adverse impacts of likely rainfall
decline on soybean crops would be relatively less
pronounced under elevated CO2 levels.
The combined effect of doubled CO2 and antici-
pated thermal stress (Tmax � 18C and Tmin � 1.58C ±
that is likely at the selected sites by middle of next
century) on soybean crop is about 36% increase in
yield provided the total rainfall amount and its intra-
seasonal variability does not change. A decline in
daily rainfall amount by 10% should bring down this
gain in soybean yield to about 32%. The acute water
stress due to prolonged dry spells during monsoon
season could be a critical factor for the soybean
68 M. Lal et al. / Agricultural and Forest Meteorology 93 (1999) 53±70

productivity even under the positive effects of elevated
CO2 in the future.
Acknowledgements
The World Meteorological Organization funded the
acquisition of DSSAT model software at NCMRWF,
New Delhi. The United Nations Development Pro-
gramme, New Delhi provided fellowship to one of the
authors (KKS) for DSSAT familiarization training
with Prof. J.T. Ritchie at Michigan State University.
The weather data used in this study were made avail-
able by the India Meteorological Department.
References
Abrol, Y.P., Bagga, A.K., Chakravarty, N.V.K., Wattal, P.N., 1991.
Impact of rise in temperature on the productivity of wheat in
India. In: Abrol, Y.P., Wattal, P.N., Gnaman, A., Govindjee, Ort,
D.R., Teramuka, A.H. (Eds.), Impact of Global Climatic
Changes on Photosynthesis and Plant Productivity. Oxford
and IBH Publishing, New Delhi, pp. 787±789.
Adams, R.M., Rosenzweig, C., Peart, R.N., Ritchie, J.T., McCarl,
D.A., Glyer, J.D., Curry, R.D., Jones, J.W., Boote, K.J., Allen,
L.H., 1990. Global climate change and U.S. Agriculture.
Nature 345, 219±224.
Aggarwal, P.K., Sinha, S.K., 1993. Effect of probable increase in
carbon dioxide and temperature on productivity of wheat in
India. J. Agric. Meteorol. 48(5), 811±814.
Aggarwal, P.K., Kalra, N. (Eds.), 1994. Simulating the effect of
climatic factors, genotypes and management on productivity of
wheat in India, Division of Environmental Sciences, IARI, New
Delhi, pp. 156.
Boote, K.J., Jones, J.W., Mishoe, J.W., Wilkerson, G.G., 1985.
Modeling growth and yield of groundnut. Proc. Int. Symp. on
Agrometeorology of Groundnut. 21±26 August 1985, Niamey,
NIGER.
Butterfield, R.E., Morison, J.I.L., 1992. Modelling the impact of
climate warming on winter cereal development. Agric. Forest
Meteorol. 62, 241±261.
Cure, J.D., Acock, B., 1986. Crop responses to carbon dioxide
doubling - a literature survey. Agric. Forest Meteorol. 38, 127±
145.
Cure, J.D., Israel, D.W., Rufty, T.W., 1988. Nitrogen stress effects
on growth and seed yield on nodulated soybean exposed to
elevated carbon dioxide. Crop Sci. 28, 671±677.
Curry, R.B., Peart, R.M., Jones, J.W., Boote, K.J., Allen, L.H.,
1990a. Simulation as a tool for analyzing crop response to
climate change. Trans. ASAE 33, 981±990.
Curry, R.B., Peart, R.M., Jones, J.W., Boote, K.J., Allen, L.H.,
1990b. Response of crop yield to predicted change in climate
and atmospheric CO2 using simulation, Trans. ASAE 33, 1383±
1390.
Gangadhar Rao, D., Sinha, S.K., 1994. Impact of climate change on
simulated wheat production in India, In: Rosenzweig, C.,
Iglesias, I. (Eds.), Implications of Climate Change for
International Agriculture ± Crop Modelling Study. U.S.
Environmental Protection Agency, EPA230-B-94-003, Wa-
shington, DC.
Goudriaan, J., Unsworth, M.H., 1990. Implications of increasing
carbon dioxide and climatic change for agricultural productiv-
ity and water resources. Am. Soc. Agronom. Special Publica-
tion No. 23, 111±130.
Haskett, J.D., Pachepsky, Y.A., Acock, B., 1997. Increase of CO2
and climate change effects on Iowa soybean yield simulated
using GLYCIM. Agron. J. 89, 167±176.
Hoogenboom, G., Jones, J.W., Boote, K.J., 1991. A decision
support system for prediction of crop yield, evapotranspiration,
and irrigation management. Proc. Symp. Irrigation and
Drainage. ASCE, Honolulu, Hawaii, pp. 198±204.
Hoogenboom, G., Jones, J.W., Boote, K.J., 1992. Modeling growth,
development and yield of grain legumes using SOYGRO,
PNUTGRO and BEANGRO ± a review. Trans. ASAE 35(6),
2043±2056.
Hunt, L.A., Pararajasingham, S., Jones, J.W., Hoogenboom, G.,
Imamura, D.T., Ogoshi, R.M., 1993. GENCAL software to
facilitate the use of crop models to analyze field experiments.
Agron. J. 85, 1090±1094.
IPCC (Intergovernmental Panel on Climate Change), 1996a.
Second scientific assessment of climate change. In: Houghton,
J.T., Meira Filho, L.G., Callander, B.A., Harris, N., Kattenberg,
A., Maskell, K. (Eds.), WMO-UNEP Rep. Cambridge Uni-
versity Press, UK, 572 pp.
IPCC (Intergovernmental Panel on Climate Change), 1996b.
Impacts, adaptations and mitigation of climate change:
scientific-technical analyses, In: Watson, R.T., Zinyowera,
M.C., Ross, R.H., Dokken, D.J., WMO-UNEP Rep. Cambridge
University Press, UK, 879 pp.
IPCC (Intergovernmental Panel on Climate Change), 1998. The
regional impacts of climate change: an assessment of vulner-
ability. In: Watson, R.T., Zinyowera, M.C., Moss, R.H.,
Dokken, D.J. (Eds.), WMO-UNEP Rep. Cambridge University
Press, UK, 517 pp.
IBSNAT (International Benchmark Sites Network for Agrotechnol-
ogy Transfer), 1989. Decision Support System for Agrotech-
nology Transfer Version 2.1 User Guide, (DSSAT v2.1),
University of Hawaii, Honolulu.
IBSNAT (International Benchmark Sites Network for Agrotechnol-
ogy Transfer), 1994. Decision Support System for Agrotech-
nology Transfer Version 3.0 User Guide, (DSSAT v3.0),
University of Hawaii, Honolulu.
Jacobs, C.M.J., DeBruin, H.A.R., 1992. The sensitivity of regional
transpiration to land surface characteristics: significance of
feedback. J. Clim. 5, 683±698.
Jeyaraman, S., Subramaniym, S., Sree Rangaswamy, S.R., 1990.
Influence of weather parameters at the crop growth stages on
seed yield of soybean. Mausam 41(4), 575±578.
Jones, J.W., 1993. Decision support systems for agricultural
development, In: Penning de Vries, F.W.T., Teng, P.S.,
Metselaar, K. (Eds.), Systems Approaches for Agricultural
M. Lal et al. / Agricultural and Forest Meteorology 93 (1999) 53±70 69

Development. Kluwer Academic Publishers, Dordrecht, The
Netherlands, pp. 459±472.
Jones, J.W., Boote, K.J., Jagtap, S.S., Mishoe, J.W., 1991. Soybean
development. In: Hanks, J., Ritchie, J.T. (Eds.), Modeling Soil
and Plant Systems. American Society of Agronomy, Madison,
WI, pp. 71±90.
Karl, T.R., Kukla, G., Razuvayev, V.N., Changery, M.J., Quayle,
K.G., Heim, R.R., Easterling, D.R., Fu, C.B., 1991. A new
perspective on global warming: asymmetric increases of day
and night temperatures. Geophys. Res. Lett. 18, 2253±2256.
Lal, M., Cubasch, U., Voss, R., Waszkewitz, J., 1995. The effect of
transient increase in greenhouse gases and sulphate aerosols on
monsoon climate. Curr. Sci. 69(9), 752±763.
Lal, M., Srinivasan, G., Cubasch, U., 1996. Implications of
increasing greenhouse gases and aerosols on the diurnal
temperature cycle of the Indian subcontinent. Curr. Sci.
71(10), 746±752.
Lal, M., Singh, K.K., Rathore, L.S., Srinivasan, G., Saseendran,
S.A., 1998. Vulnerability of Rice and Wheat Yields in NW ±
India to Future Changes in Climate. Agric. Forest Meteorol. 89,
101±114.
Lawn, R.J., 1982. Response of four grain legumes to water stress in
southern Queensland ± physiological response mechanisms.
Aust. J. Agric. Res. 33, 481±496.
Mauney, J.R., Lewin, K.F., Hendrey, G.R., Kimball, B.A., 1992.
Growth and yield of cotton exposed to free CO2 enrichment
(FACE). Critic. Rev. Plant Sci. 11, 213±222.
McNaughton, K.G., Jarvis, P.G., 1991. Effects of spatial scale on
stomatal control of transpiration. Agric. Forest Meteorol. 54,
279±302.
Mearns, L.O., Rosenzweig, C., Goldberg, R., 1996. The effect of
changes in daily and interannual climate variability on CERES±
Wheat: a sensitivity study. Clim. Change 32, 257±292.
Meehl, G.A., Washington, W.M., Erickson III, D.J., Briegleb, B.P.,
Jaumann, P.J., 1996. Climate Change from increased CO2 and
direct and indirect effects of sulfate aerosols. Geophys. Res.
Lett. 23(25), 3755±3778.
Mitchell, J.F.B., Johns, T.C., Gregory, J.M., Tett, S.F.B., 1995.
Climate response to increasing levels of greenhouse gases and
sulphate aerosols. Nature 376, 501±504.
Morison, J.I.L., 1987. Intercellular CO2 concentration and stomatal
response to CO2. In: Zeiger, E., Cowan, I.R., Farquhar, G.D.
(Eds.), Stomatal Function. Stanford University Press, pp. 229±
251.
Peart, R.M., Jones, R.W., Curry, R.B., Boote, K.J., Allen, L.H., Jr.,
1989. Impact of climate change on crop yield in the
southeastern USA ± a simulation study. in: Smith, J.B., Tripak,
D.A. (Eds.), The Potential Effects of Global Climate Change on
the United States. Appendix C, Agriculture, vol. 1, EPA 230-
05-89-053, U.S. Environmental Protection Agency, Washing-
ton, DC.
Riha, S.J., Wilks, Daniel S., Simoens, P., 1996. Impact of
temperature and precipitation variability on crop model
predictions. Clim. Change 32, 293±311.
Ritchie, J.T., Kiniry, J.R., Jones, C.A., Dyke, P.T., 1986. In: Jones,
C.A., Kiniry, J.R. (Eds.), A Simulation Model of Maize Growth
and Development ± the Model Input. Texas A & M University
Press, TX, pp. 37±48.
Sinclair, T.R., Rawlins, S.L., 1993. Inter-seasonal variation in
soybean and maize yields under global environmental change.
Agron. J. 85, 406±409.
Sinha, S.K., Swaminathan, M.S., 1991. Deforestation, climate
change and sustainable nutrition security. Clim. Change 16, 33±
45.
Soni, S., Rajput, A.M., Goyal, M., 1990. Grow soybean instead of
jower and maize in Indore district, Indian Farming, vol. XL, 10
pp.
SOPA, 1996, The soybean processors association of India, Indore,
Madhya Pradesh, Issues 8 and 10.
Tanaka, A., 1983. The physiology of soybean yield improvement.
Proc. Symp. on Soybean in tropical and subtropical systems,
26±30 September, 1983, Tsukuba, Japan, pp. 323±331.
Tsuji, G.Y., Uehara, G., Balas, S.S. (Eds.), 1994. DSSAT v. 3,
University of Hawaii, Honolulu, Hawaii.
Whigham, D.K., Minor, H.C., 1978. Agronomic characteristics and
environmental stress. In: Normal, A.G. (Ed.), Soybean
Physiology, Agronomy and Utilization. Academic Press, New
York, pp. 77±118.
Wilkerson, G.G., Jones, J.W., Boote, K.J., Ingram, K.T., Mishoe,
J.W., 1983. Modeling soybean growth for crop management.
Trans. ASAE 26, 63±73.
Wright, G.C., Smith, C.J., Nilson, I.B., 1988. Growth and yield of
soybean under wet soil culture and conventional furrow
irrigation in south eastern Australia. Irrig. Sci. 9, 127±142.
70 M. Lal et al. / Agricultural and Forest Meteorology 93 (1999) 53±70