growth - california institute of technologyjlr/courses/econ11/jlr-ec11-19 growth.pdfacross...
TRANSCRIPT

GrowthGrowth
Practice final posted
Final for senior email June 1 5pmdue June 4 at noondue June 4 at noon
Final for all non‐seniors posted June 5 5pmp pdue June 9 at noon
1

Why is growth an in issue?Why is growth an in issue?
• Over the period 1960–2000, the richest 5% of the world’s nations averaged a per capita income (PPP) that was about twenty‐nine times the corresponding figure for the poorest 5%. g p
• As Parente and Prescott [2000] quite correctly observed, interstate disparities within the United States do not even come close to these internationalStates do not even come close to these international figures: In 2000, the richest state in the United States was Connecticut and the poorest was Mississippi, and the ratio of per capita incomes worked out to slightlythe ratio of per capita incomes worked out to slightly less than 2!
From Debraj Ray Selected Lecture Notes for a Graduate Development CourseDevelopment Course.
2

OutlineOutline• Growth
• Growth and capital per worker
• Growth and technical changeGrowth and technical change
• Solow
I li ti f S l• Implications of Solow
• What do the data say– Capital accumulation
– Rate of technical change
– Unconditional convergence3
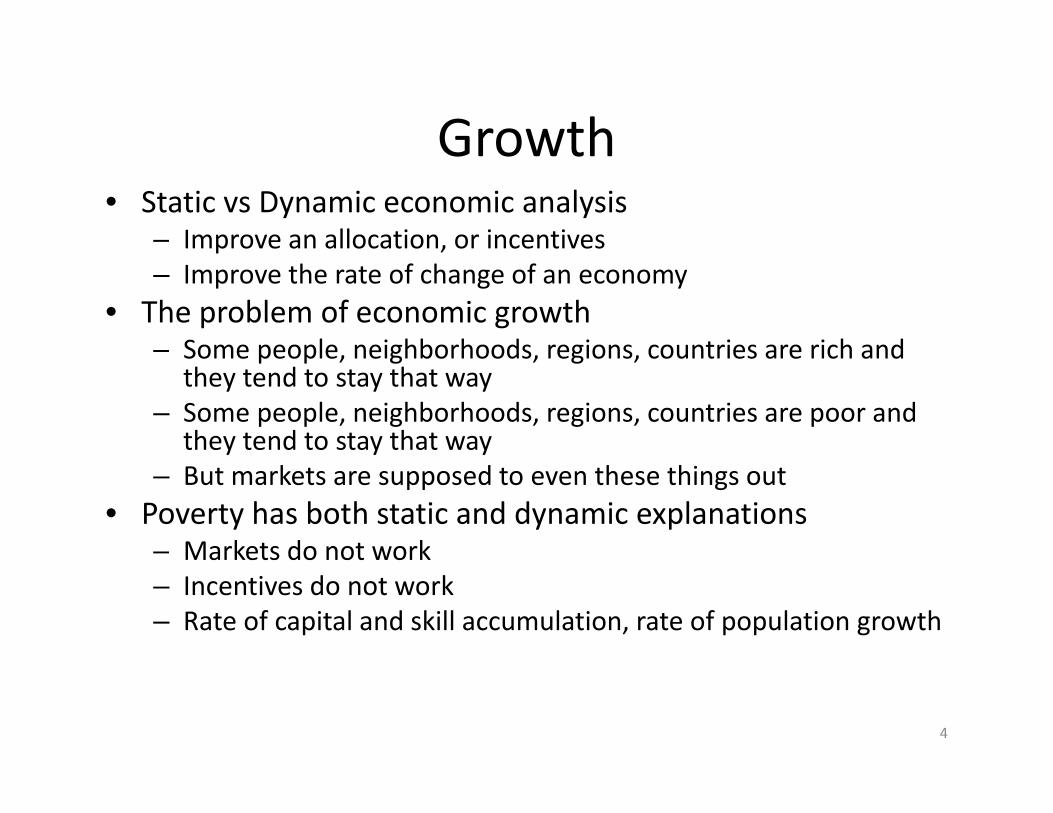
GrowthGrowth• Static vs Dynamic economic analysis
– Improve an allocation, or incentivesp– Improve the rate of change of an economy
• The problem of economic growth– Some people, neighborhoods, regions, countries are rich andSome people, neighborhoods, regions, countries are rich and
they tend to stay that way– Some people, neighborhoods, regions, countries are poor and
they tend to stay that way– But markets are supposed to even these things out
• Poverty has both static and dynamic explanations– Markets do not work– Incentives do not work– Rate of capital and skill accumulation, rate of population growth
4
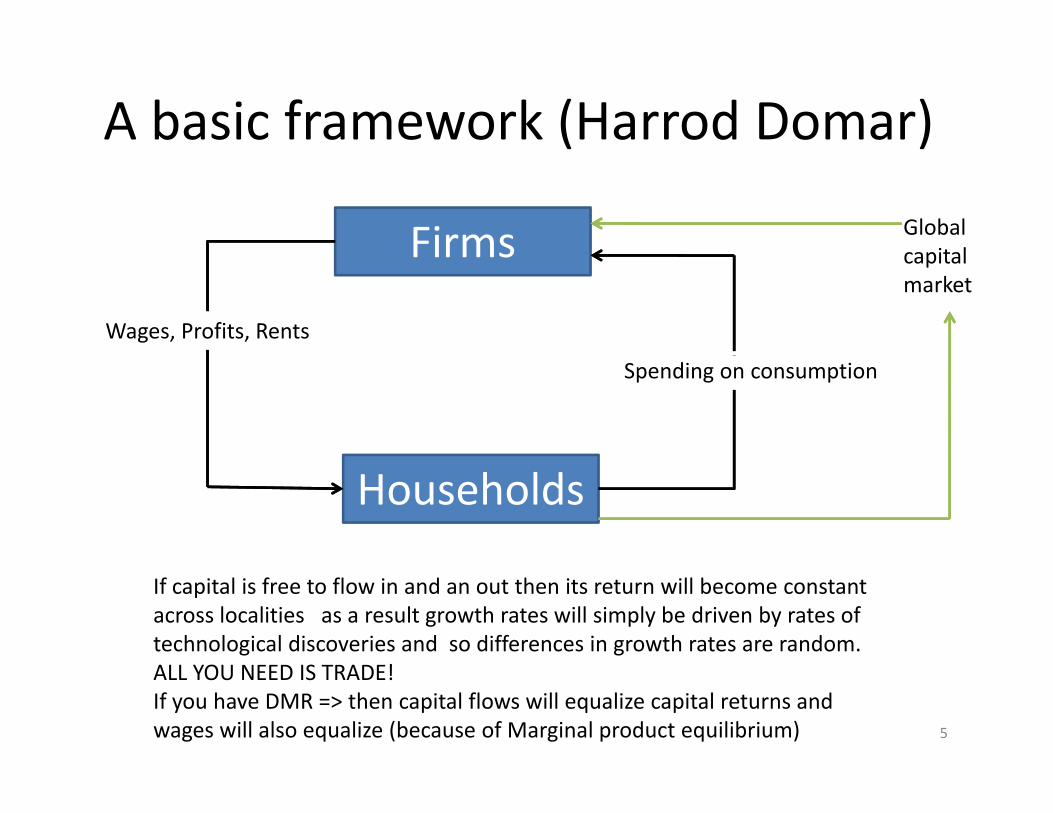
A basic framework (Harrod Domar)
Firms Global capitalFirms
Wages, Profits, Rents
capital market
Spending on consumption
Households
If capital is free to flow in and an out then its return will become constant across localities as a result growth rates will simply be driven by rates of technological discoveries and so differences in growth rates are random.
5
ALL YOU NEED IS TRADE!If you have DMR => then capital flows will equalize capital returns and wages will also equalize (because of Marginal product equilibrium)
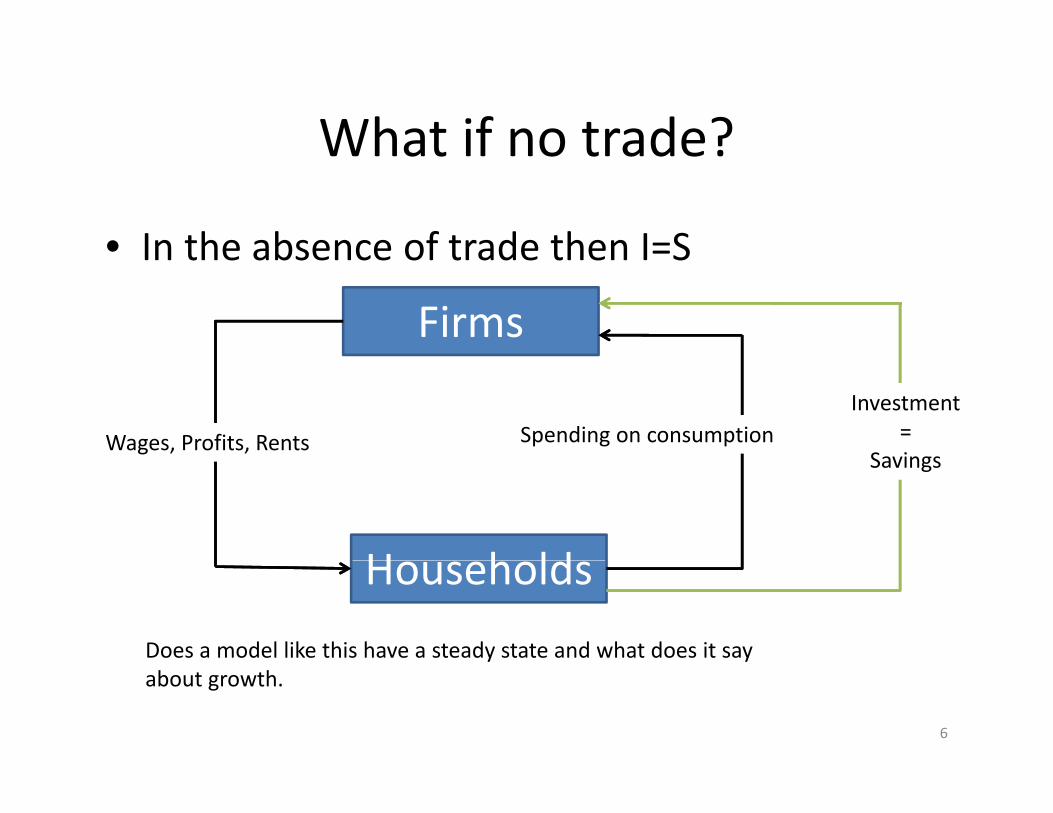
What if no trade?What if no trade?
• In the absence of trade then I=SIn the absence of trade then I=S
Firms
Spending on consumptionWages, Profits, Rents
Investment=
Savings
H h ld
Savings
Households
Does a model like this have a steady state and what does it say
6
about growth.
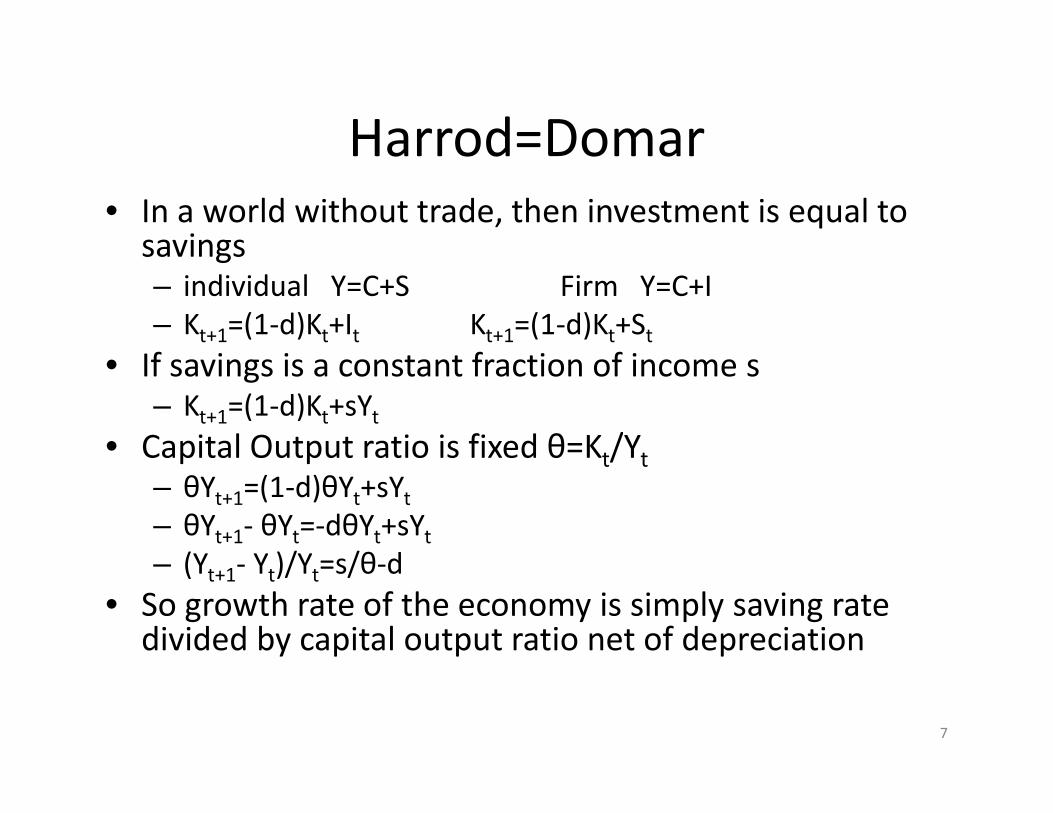
Harrod=DomarHarrod Domar• In a world without trade, then investment is equal to savingssavings – individual Y=C+S Firm Y=C+I– Kt+1=(1‐d)Kt+It Kt+1=(1‐d)Kt+StIf i i t t f ti f i• If savings is a constant fraction of income s– Kt+1=(1‐d)Kt+sYt
• Capital Output ratio is fixed θ=Kt/Ytap a Ou pu a o s ed θ t/ t– θYt+1=(1‐d)θYt+sYt– θYt+1‐ θYt=‐dθYt+sYt(Y Y )/Y =s/θ d– (Yt+1‐ Yt)/Yt=s/θ‐d
• So growth rate of the economy is simply saving rate divided by capital output ratio net of depreciation
7

SolowSolow
• Solow (1957). Instead of constant capital output So o ( 95 ). stead o co sta t cap ta outputratio, put in diminishing returns– Start with a production function F(K,L) that is constant
1returns to scale (eg KαL1‐α) but that is DMR in one argument
– K 1=(1‐d)K +sYKt+1=(1 d)Kt+sYt– Now divide by population time t P time t+1 (1+η)P– (1+η)kt+1=(1‐d)kt+sytη t+1 t yt
• Critical here is that yt=F(1 ,Kt/Pt). And that has DMR.
8

Solow (2)Solow (2)
Y (1+η)kt+1=(1‐d)kt+syt
(1‐d)k+syThe right hand side is linear in k
(1+η)k
The left hand side has a concave function yt =f(kt)
F(K L) is CRSF(K,L) is CRSOnce you fix population it becomes DMR
K
9
K

InterpretationInterpretation
• System stabilizes when kt =kt+1Syste stab es e t t+1• (1+η)kt+1=(1‐d)kt+syt• (1+η)k=(1‐d)k+sy
O ( d)/ (k)/k d t f it l l ( d)/• Or (η+d)/s=y(k)/k or average product of capital equals (η+d)/s
• DMR insure there is a unique solution to this• LevelsLevels
• The saving’s rate =>More savings more total output. • The growth rate of the population affects lower η=> more y
D i i l d• Depreciation lower d=> more y
• Long run rate of growth is zero.• So growth not so much an issueSo g o t ot so uc a ssue
10

Solow and the US economySolow and the US economy• The model suggested to Solow that there were three things that mattered
– 1) population growth1) population growth
– 2) the savings’ rate
– 3) technical change
• Why?y– Back to Y=F(K,L) now look at two economies
– F(K,L)= KαL1‐α and G(K,L)=aKαL1‐α
– The parameter a is a measure of technological progress (if a>1, then G is more efficient th F)than F)
• So now you can ask what fraction of output growth per capita is the result of capital accumulation and what fraction is the result of changes in efficiencyefficiency.
– But we did that already (see lecture XX)
– a is simply the difference between the rate of growth of output per capital and the rate of growth of capital per capita.
– What Solow found was surprising more than half of all the output growth per capita in the first six decades of the twentieth century came from technical change
11

Solow with technical changeSolow with technical change
• Assume technichal change makes people more productive so that the effective labor units Lt =EtPt
• Population grows at rate η• Efficiency at rate π =>Et+1=(1+ π)EtEfficiency at rate π Et+1 (1 π)Et• Kt+1=(1‐d)Kt+sYt• But now divide by the labor units (Lt)• (1+η)(1+π)k =(1 d)k +sy• (1+η)(1+π)kt+1=(1‐d)kt+syt• These are total per labor unit (not per capita) but that is
what you need to get equilibrium ((1+η)(1+π)+(d 1))/s y/k– ((1+η)(1+π)+(d‐1))/s =y/k
– In effect capital per labor unit stays the same at k*
– But capital per worker grows at the rate π and so does output per workerper worker
12

Recipes for developmentRecipes for development
• Harrod Domar• ΔYt=s/θ‐d• Work on s and θ
• Solow no technical changeg– (η+d)/s=∂y/∂k– Work on s, η
• Solow no technical change• Solow no technical change– (η+d)/s=∂y/∂k– Work on s, η
• Solow with technical change– ((1+η)(1+π)+(d‐1))/s– Work on s and η and if possible πWork on s and η and if possible π
13

Raising savingsRaising savings
• The saving’s rate of the previous model actually g p yhas to come out of individual decisions.
• If the economy is infinitely divisible then each individual faces a private investment/savingindividual faces a private investment/saving decision
• If the economy is not so divisible you have to getIf the economy is not so divisible you have to get the savings into the firms and return some profit to the saversM j f fi i l i i i• Major focus on financial institutions– Reduce the spread between the rate of return of firms and the rate of return to savers.
14

ConvergenceConvergence• Most of these models have a convergence i li iimplication:– The poorer an economy is the faster it should grow.
– Two possible implication• Give up on international aid
• Aid can accelerate convergence
B t h t i th id i f f• But what is the evidence in favor of convergence?
15
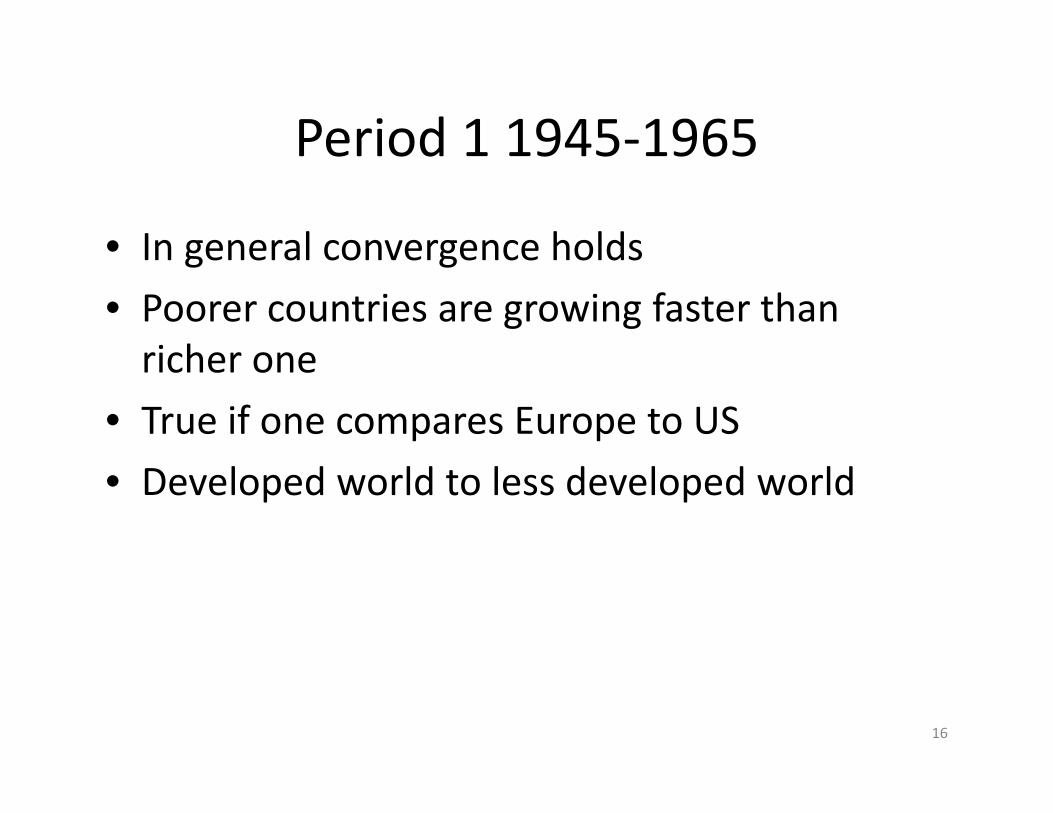
Period 1 1945‐1965Period 1 1945 1965
• In general convergence holdsIn general convergence holds
• Poorer countries are growing faster than richer onericher one
• True if one compares Europe to US
• Developed world to less developed world
16
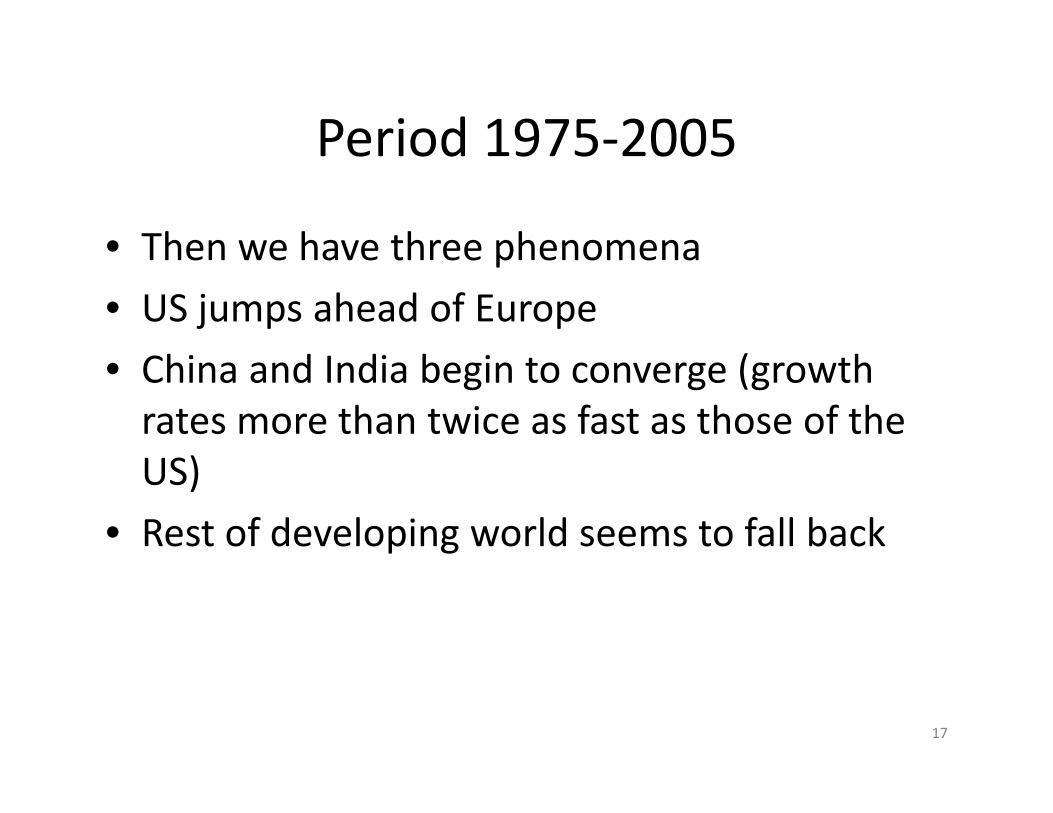
Period 1975‐2005Period 1975 2005
• Then we have three phenomenaThen we have three phenomena
• US jumps ahead of Europe
Chi d di b i ( h• China and India begin to converge (growth rates more than twice as fast as those of the US)US)
• Rest of developing world seems to fall back
17
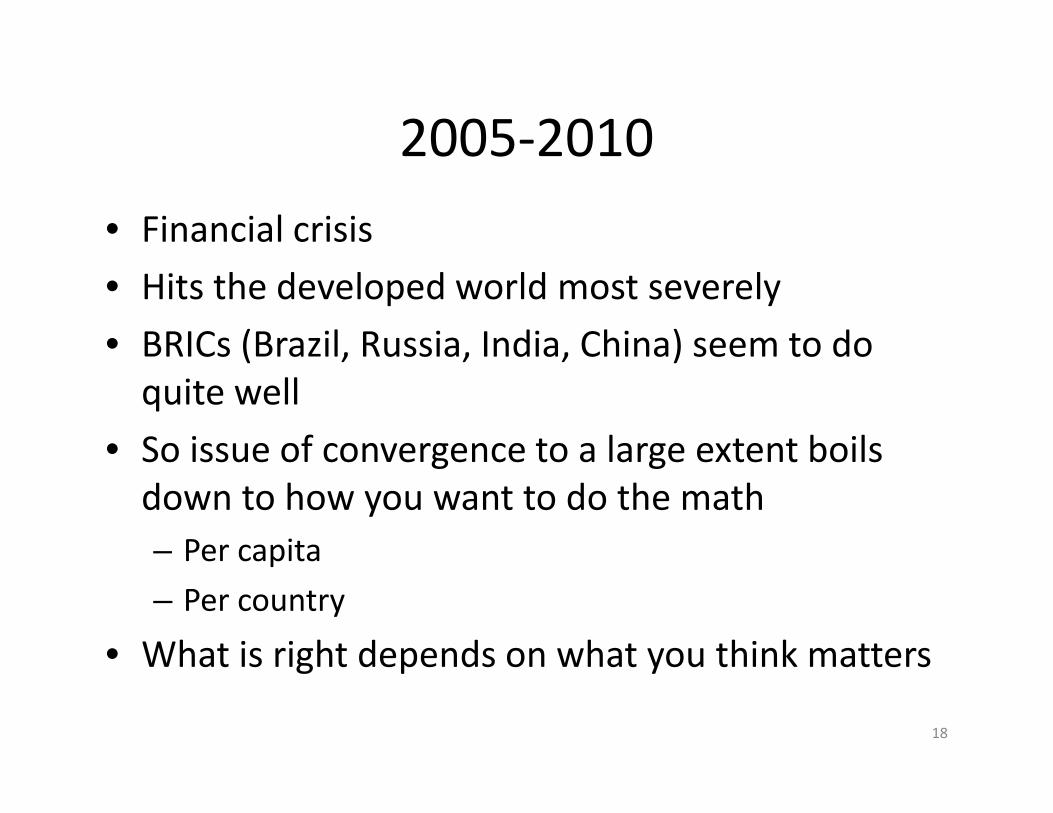
2005‐20102005 2010
• Financial crisis
• Hits the developed world most severely
• BRICs (Brazil, Russia, India, China) seem to doBRICs (Brazil, Russia, India, China) seem to do quite well
• So issue of convergence to a large extent boilsSo issue of convergence to a large extent boils down to how you want to do the math– Per capitaPer capita
– Per country
• What is right depends on what you think mattersWhat is right depends on what you think matters
18
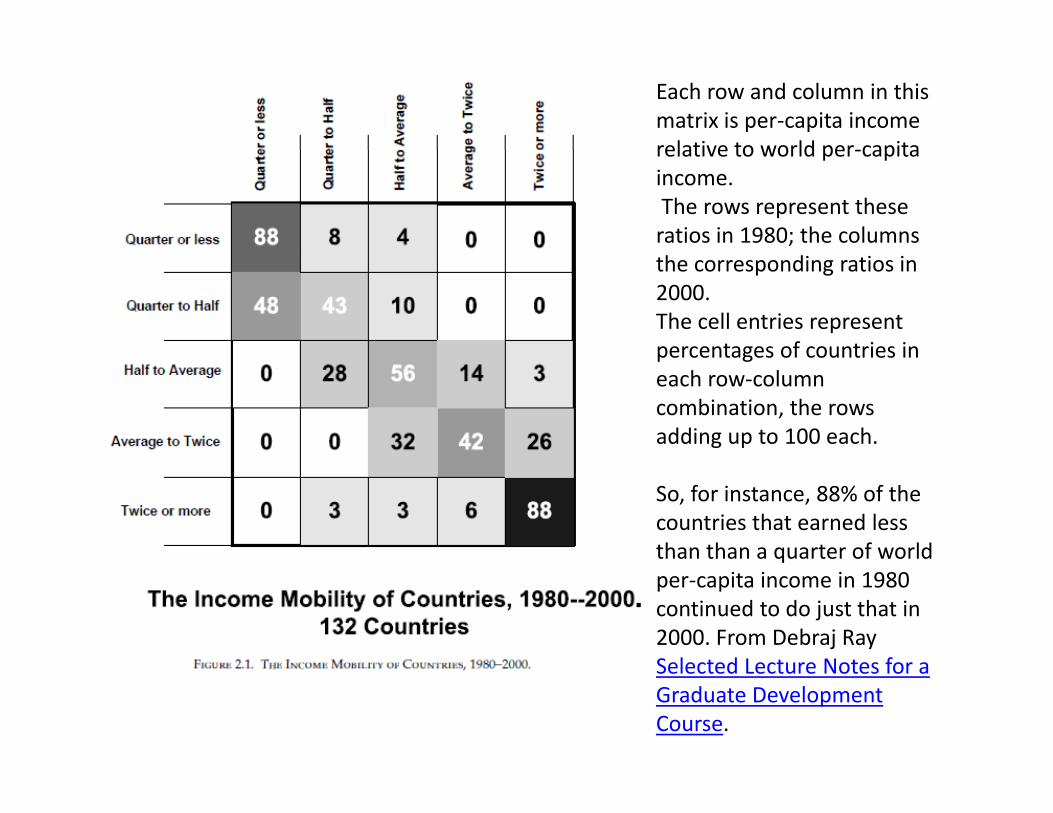
Each row and column in this matrix is per‐capita income relative to world per‐capitarelative to world per‐capita income. The rows represent these ratios in 1980; the columns the corresponding ratios in 2000. The cell entries represent percentages of countries inpercentages of countries in each row‐column combination, the rows adding up to 100 each.
So, for instance, 88% of the countries that earned less than than a quarter of world qper‐capita income in 1980 continued to do just that in 2000. From Debraj Ray Selected Lecture Notes for a
19
Selected Lecture Notes for a Graduate Development Course.
20
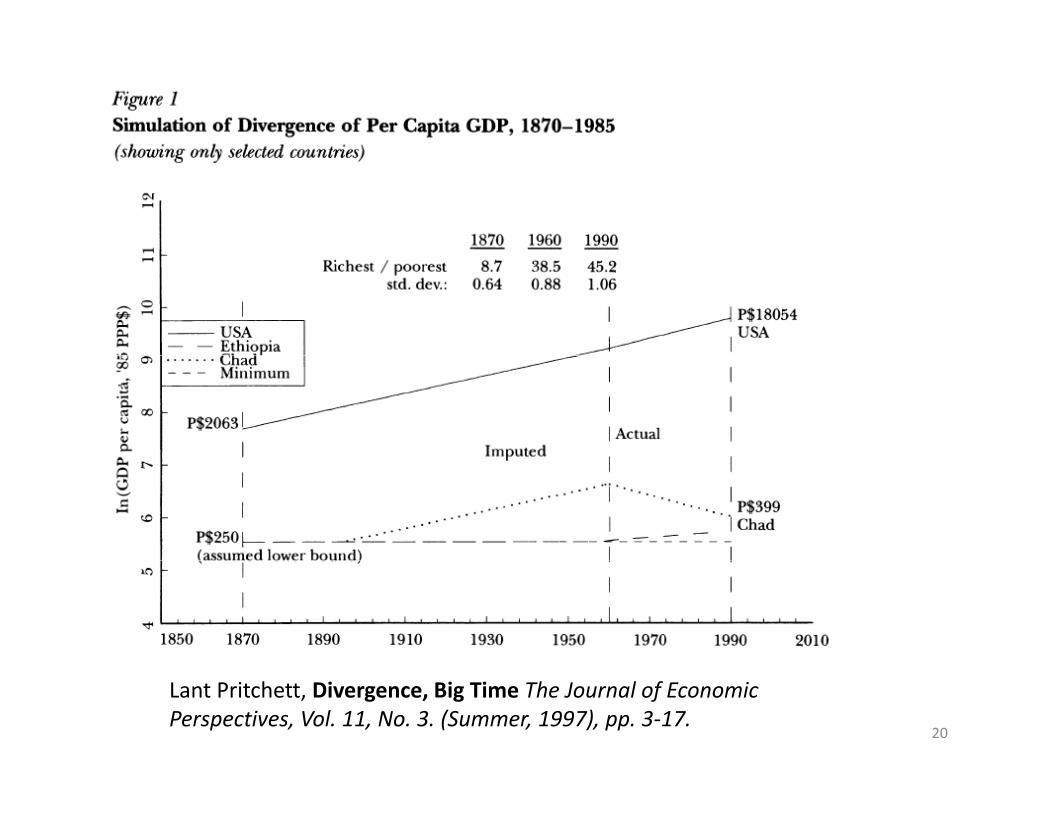
Lant Pritchett, Divergence, Big Time The Journal of Economic Perspectives, Vol. 11, No. 3. (Summer, 1997), pp. 3‐17.

21
Lant Pritchett, Divergence, Big Time The Journal of Economic Perspectives, Vol. 11, No. 3. (Summer, 1997), pp. 3‐17.