growth, characterization and theoretical parameter study
TRANSCRIPT

Growth, characterization and theoretical parameter studyof benzimidazole L-tartrate single crystal: a nonlinearoptical material
HIRAL RAVAL1,2, P S RAVAL1,2, B B PAREKH1,* and M J JOSHI3
1Pandit Deendayal Petroleum University, Gandhinagar 382007, India2L D College of Engineering, Ahmedabad 380015, India3Department of Physics, Saurashtra University, Rajkot 360005, India
*Author for correspondence ([email protected])
MS received 13 July 2020; accepted 30 August 2020
Abstract. Good quality, non-hygroscopic and transparent crystals of organic benzimidazole L-tartrate (BILT) were
grown successfully with a slow evaporation method. The powder X-ray diffraction patterns were analysed with
Powder-X software which confirms the monoclinic crystal structure. The charge distribution, transport mechanism
and intramolecular bonding mechanism have been investigated with the help of natural bond orbital analysis and
molecular electrostatic potential diagram. The presence of various functional groups was confirmed with the help of
FTIR–ATR response. The values were compared with the values obtained from computational output with the help of
Gaussian software. The crystalline quality was further analysed with UV–visible spectral analysis. The lower cut-off
wavelength of 288 nm and further optical parameters like band gap, change in refractive index with wavelength and
extinction coefficient values support the usage of the material for optoelectronic devices. With band gap of 4.2 eV,
the reactivity of material has been observed with the HOMO and LUMO study. The TGA and DTA analyses confirm
the thermal stability of the material up to 192�C. The lower dielectric constant and lower dielectric loss support the
usage of the material for an NLO device. The hopping motion and Joncher’s power law parameters were also
obtained. The material decomposes in single-phase which observes in a range of 180–250�C. The second harmonic
generation capacity of the material is found to be 2.69 times that of the KDP with the help of Kurtz and Perry powder
technique.
Keywords. Crystal growth; organic nonlinear optical material; second harmonic generation; DFT; UV–visible.
1. Introduction
The synthesis of multicomponent crystals like salts, moi-
eties, co-crystals and solvates attracts researchers due to
their versatile properties and applications in the area of
optoelectronic devices and NLO properties. The formation
of co-crystals has been achieved with the help of a stoi-
chiometric ratio mixture of two or more compounds. The
intramolecular assembly is mainly with the help of hydro-
gen bonding, bond interactions and charge transfer activities
[1,2]. The advanced requirements of optical image pro-
cessing, photonics, communication and storage devices
require a large spectrum of NLO materials with stability and
efficient conversion capabilities can be accomplished with
the help of such mentioned frames of molecular assemblies
[3–6]. In addition to the same, the molecular assemblies of
multi-component materials can be unfailingly formed with
the help of carboxylic acids [7]. The recent work for the
development of powerful NLO materials shows promising
results with hydrogen bonding between carboxylic groups
and other groups like hydroxyl group, heterocyclic aromatic
group [8–11]. The supramolecular assembly framework can
be established with the help of carboxylic and heterocyclic
compounds through building blocks that self-assemble via
N–H…H–O, O–H…O, N–H…O, and C–H…O hydrogen
bonds when crystallized [12,13]. Based on the same, in this
present work, the effect of a combination of the carboxyl
group with bicyclic fusion aromatic compounds in non-
linear behaviour has been reported. The various analyses
have been carried out which confirm the application of the
title compound as potential NLO material.
2. Experimental and computational details
2.1 Synthesis
The AR grade L-tartaric acid (Merk Millipore) was dis-
solved in water along with the same grade benzamida-
zolium (Sigma Aldrich), were dissolved in methanol in
Bull. Mater. Sci. (2021) 44:38 � Indian Academy of Scienceshttps://doi.org/10.1007/s12034-020-02320-2Sadhana(0123456789().,-volV)FT3](0123456789().,-volV)

equal proportion and mixed. The mixture was dried in the
oven at 60�C for 2 h. The powder was again dissolved in
water and filtered with filter paper grade 41. At every stage
of dissolution, the homogeneous solution was prepared with
the help of magnetic stirrer. The solution was kept in beaker
and covered with polythene to enable very slow evapora-
tion. After 26 days, the good quality transparent crystals
(figure 1) were harvested for analysis. The average size of
good quality and the transparent crystal was 129 89 6 mm3.
Furthermore, no hygroscopic nature of crystal was observed
and quality remains the same for a long period.
2.2 Experimental analysis
The grown crystals were subjected to various analyses
which help to identify its potential usage for non-linear
activity. The crystals were analysed by various means
like structural analysis by powder X-ray diffraction
(XRD), thermal analysis with TGA and DTA, optical
quality analysis with UV–visible photo-spectrometer,
functional group analysis with FTIR–ATR spectroscopy,
dielectric analysis with PSM analyzer and second har-
monic generation (SHG) analysis with Kurtz and Perry
powder technique.
2.3 Computational analysis
The theoretical quantum chemical computation of BILT
was carried out with the help of the Gaussian 09 software
[14]. The calculations were carried out with time-dependent
density functional theory (TD-DFT) matrix on the basis set
of B3LYP/6-311 G(d,p). The experimental correlated cal-
culations, such as vibrational response, molecular electro-
static potential (MEP) distribution, natural bond orbital
(NBO), polarizability and HOMO and LUMO calculations
were carried out. All calculations were performed on an
optimized structural output.
3. Results and discussion
3.1 Structural analysis
Structural analysis of BILT crystal was carried out with the
help of fine powder X-ray analysis. The diffraction pattern
was recorded on PANalytical X’pert PRO X-ray diffrac-
tometer from 0 to 90� range with a source of CuKa (k =
1.5418 A) radiation. The data were analysed with Powder-X
software as shown in figure 2. The analysis confirmed that
the BILT crystal belongs to monoclinic crystal structure
system with cell parameters a = 9.227 A, b = 7.278 A and
c = 10.889 A, volume = 731.241 A3 and a = c = 90� and b =
110.50�.The titled compound structure was also optimized for
further theoretical analysis with the help of the Gaussian
09W program package with the TD-SCF DFT method
with the basis point of B3LYP (6-311G). The hydrogen
sharing bond is observed between H21 and H26 with a
sharing bond length of 2.894 A. The bond parameters
observed after optimization are listed in the supplemen-
tary information. The zigzag tartrate structure with car-
bon chain C–C–C–C is observed with torsion angle of
0.0346�. The higher non-linearity and stability are pro-
jected due to the expected zigzag configuration of tartrate
molecules [15].
The benzimidazole and tartrate are aligned with head
to the tail arrangement on the axis. The formation of
chain suggests good stability of the crystalline material.
The diagram is illustrated in figure 3 with bond length.
The aromatic ring and benzene sharing bond is observed
with (C4–N5) and (C3–N2) with bond lengths of 1.407Figure 1. As grown crystal of BILT.
38 Page 2 of 16 Bull. Mater. Sci. (2021) 44:38

Figure 2. Powder X-ray pattern of single crystal BILT.
Figure 3. DFT optimized structure of title compound.
Bull. Mater. Sci. (2021) 44:38 Page 3 of 16 38

Table 1. Optimized structure parameters: bond angles.
Bond angles (�)
A1 A(2, 1, 5) 113.2446 A25 A(8, 9, 25) 122.0727
A2 A(2, 1, 20) 122.0501 A26 A(13, 10, 16) 124.6301
A3 A(5, 1, 20) 124.7053 A27 A(13, 10, 17) 111.6144
A4 A(1, 2, 3) 106.8479 A28 A(16, 10, 17) 123.7555
A5 A(1, 2, 21) 126.3753 A29 A(13, 11, 26) 108.3887
A6 A(3, 2, 21) 126.7734 A30 A(14, 12, 27) 109.6223
A7 A(2, 3, 4) 105.0491 A31 A(10, 13, 11) 106.9263
A8 A(2, 3, 6) 132.8331 A32 A(10, 13, 14) 113.1617
A9 A(4, 3, 6) 122.1177 A33 A(10, 13, 28) 107.4244
A10 A(3, 4, 5) 109.9713 A34 A(11, 13, 14) 108.5269
A11 A(3, 4, 9) 120.2394 A35 A(11, 13, 28) 110.9093
A12 A(5, 4, 9) 129.7892 A36 A(14, 13, 28) 109.8738
A13 A(1, 5, 4) 104.8871 A37 A(12, 14, 13) 107.5088
A14 A(3, 6, 7) 116.7278 A38 A(12, 14, 15) 108.4815
A15 A(3, 6, 22) 122.1184 A39 A(12, 14, 29) 108.5087
A16 A(7, 6, 22) 121.1528 A40 A(13, 14, 15) 112.8954
A17 A(6, 7, 8) 121.7074 A41 A(13, 14, 29) 108.7375
A18 A(6, 7, 23) 119.1121 A42 A(15, 14, 29) 110.5767
A19 A(8, 7, 23) 119.1805 A43 A(14, 15, 18) 123.116
A20 A(7, 8, 9) 121.1947 A44 A(14, 15, 19) 112.3854
A21 A(7, 8, 24) 119.1298 A45 A(18, 15, 19) 124.4736
A22 A(9, 8, 24) 119.6755 A46 A(10, 17, 30) 111.4637
A23 A(4, 9, 8) 118.0127 A47 A(15, 19, 31) 112.5425
A24 A(4, 9, 25) 119.9145
Dihedral angles (�)
D1 D(5, 1, 2, 3) -0.0632 D36 D(7, 8, 9, 25) 179.9462
D2 D(5, 1, 2, 21) -179.424 D37 D(24, 8, 9, 4) 179.9404
D3 D(20, 1, 2, 3) 179.9194 D38 D(24, 8, 9, 25) -0.0209
D4 D(20, 1, 2, 21) 0.5588 D39 D(16, 10, 13, 11) -112.734
D5 D(2, 1, 5, 4) 0.0566 D40 D(16, 10, 13, 14) 127.8303
D6 D(20, 1, 5, 4) -179.925 D41 D(16, 10, 13, 28) 6.3771
D7 D(1, 2, 3, 4) 0.04 D42 D(17, 10, 13, 11) 67.2116
D8 D(1, 2, 3, 6) 179.8703 D43 D(17, 10, 13, 14) -52.2242
D9 D(21, 2, 3, 4) 179.3972 D44 D(17, 10, 13, 28) -173.677
D10 D(21, 2, 3, 6) -0.7724 D45 D(13, 10, 17, 30) -177.979
D11 D(1, 2, 11, 13) -68.111 D46 D(16, 10, 17, 30) 1.9671
D12 D(3, 2, 11, 13) 133.8215 D47 D(26, 11, 13, 10) -173.965
D13 D(2, 3, 4, 5) -0.0077 D48 D(26, 11, 13, 14) -51.5809
D14 D(2, 3, 4, 9) 179.986 D49 D(26, 11, 13, 28) 69.2053
D15 D(6, 3, 4, 5) -179.861 D50 D(27, 12, 14, 13) 110.8703
D16 D(6, 3, 4, 9) 0.1329 D51 D(27, 12, 14, 15) -11.5126
D17 D(2, 3, 6, 7) -179.979 D52 D(27, 12, 14, 29) -131.69
D18 D(2, 3, 6, 22) -0.3446 D53 D(10, 13, 14, 12) 165.7882
D19 D(4, 3, 6, 7) -0.1726 D54 D(10, 13, 14, 15) -74.6044
D20 D(4, 3, 6, 22) 179.462 D55 D(10, 13, 14, 29) 48.4972
D21 D(3, 4, 5, 1) -0.0289 D56 D(11, 13, 14, 12) 47.2765
D22 D(9, 4, 5, 1) 179.9782 D57 D(11, 13, 14, 15) 166.8838
D23 D(3, 4, 9, 8) 0.0043 D58 D(11, 13, 14, 29) -70.0145
D24 D(3, 4, 9, 25) 179.9665 D59 D(28, 13, 14, 12) -74.1477
D25 D(5, 4, 9, 8) 179.9967 D60 D(28, 13, 14, 15) 45.4596
D26 D(5, 4, 9, 25) -0.0411 D61 D(28, 13, 14, 29) 168.5612
D27 D(3, 6, 7, 8) 0.0827 D62 D(12, 14, 15, 18) 7.0101
D28 D(3, 6, 7, 23) -179.964 D63 D(12, 14, 15, 19) -174.735
D29 D(22, 6, 7, 8) -179.556 D64 D(13, 14, 15, 18) -112.035
D30 D(22, 6, 7, 23) 0.3975 D65 D(13, 14, 15, 19) 66.22
D31 D(6, 7, 8, 9) 0.0492 D66 D(29, 14, 15, 18) 125.8914
D32 D(6, 7, 8, 24) -179.984 D67 D(29, 14, 15, 19) -55.8538
D33 D(23, 7, 8, 9) -179.904 D68 D(14, 15, 19, 31) -177.248
D34 D(23, 7, 8, 24) 0.0635 D69 D(18, 15, 19, 31) 0.9793
D35 D(7, 8, 9, 4) -0.0925
38 Page 4 of 16 Bull. Mater. Sci. (2021) 44:38
and 1.395 A, respectively. The detailed bond angles are
given in table 1.
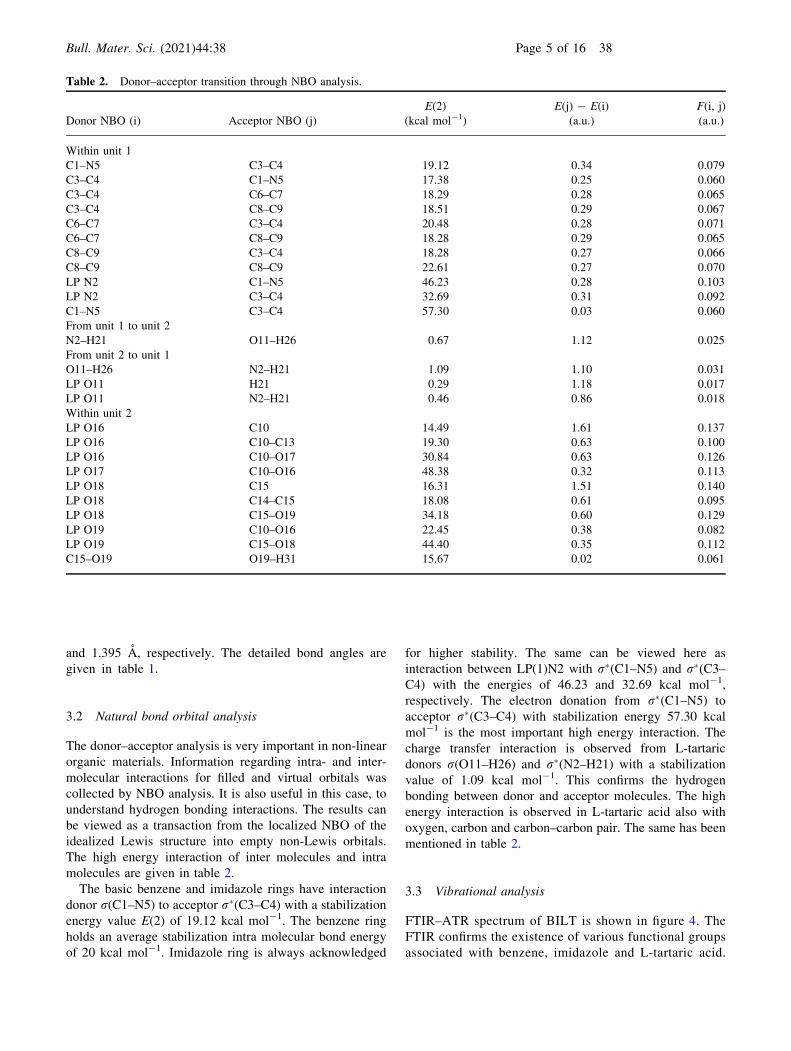
3.2 Natural bond orbital analysis
The donor–acceptor analysis is very important in non-linear
organic materials. Information regarding intra- and inter-
molecular interactions for filled and virtual orbitals was
collected by NBO analysis. It is also useful in this case, to
understand hydrogen bonding interactions. The results can
be viewed as a transaction from the localized NBO of the
idealized Lewis structure into empty non-Lewis orbitals.
The high energy interaction of inter molecules and intra
molecules are given in table 2.
The basic benzene and imidazole rings have interaction
donor r(C1–N5) to acceptor r�(C3–C4) with a stabilization
energy value E(2) of 19.12 kcal mol-1. The benzene ring
holds an average stabilization intra molecular bond energy
of 20 kcal mol-1. Imidazole ring is always acknowledged
for higher stability. The same can be viewed here as
interaction between LP(1)N2 with r�(C1–N5) and r�(C3–C4) with the energies of 46.23 and 32.69 kcal mol-1,
respectively. The electron donation from r�(C1–N5) to
acceptor r�(C3–C4) with stabilization energy 57.30 kcal
mol-1 is the most important high energy interaction. The
charge transfer interaction is observed from L-tartaric
donors r(O11–H26) and r�(N2–H21) with a stabilization
value of 1.09 kcal mol-1. This confirms the hydrogen
bonding between donor and acceptor molecules. The high
energy interaction is observed in L-tartaric acid also with
oxygen, carbon and carbon–carbon pair. The same has been
mentioned in table 2.
3.3 Vibrational analysis
FTIR–ATR spectrum of BILT is shown in figure 4. The
FTIR confirms the existence of various functional groups
associated with benzene, imidazole and L-tartaric acid.
Table 2. Donor–acceptor transition through NBO analysis.
Donor NBO (i) Acceptor NBO (j)
E(2) E(j) - E(i) F(i, j)(kcal mol-1) (a.u.) (a.u.)
Within unit 1
C1–N5 C3–C4 19.12 0.34 0.079
C3–C4 C1–N5 17.38 0.25 0.060
C3–C4 C6–C7 18.29 0.28 0.065
C3–C4 C8–C9 18.51 0.29 0.067
C6–C7 C3–C4 20.48 0.28 0.071
C6–C7 C8–C9 18.28 0.29 0.065
C8–C9 C3–C4 18.28 0.27 0.066
C8–C9 C8–C9 22.61 0.27 0.070
LP N2 C1–N5 46.23 0.28 0.103
LP N2 C3–C4 32.69 0.31 0.092
C1–N5 C3–C4 57.30 0.03 0.060
From unit 1 to unit 2
N2–H21 O11–H26 0.67 1.12 0.025
From unit 2 to unit 1
O11–H26 N2–H21 1.09 1.10 0.031
LP O11 H21 0.29 1.18 0.017
LP O11 N2–H21 0.46 0.86 0.018
Within unit 2
LP O16 C10 14.49 1.61 0.137
LP O16 C10–C13 19.30 0.63 0.100
LP O16 C10–O17 30.84 0.63 0.126
LP O17 C10–O16 48.38 0.32 0.113
LP O18 C15 16.31 1.51 0.140
LP O18 C14–C15 18.08 0.61 0.095
LP O18 C15–O19 34.18 0.60 0.129
LP O19 C10–O16 22.45 0.38 0.082
LP O19 C15–O18 44.40 0.35 0.112
C15–O19 O19–H31 15.67 0.02 0.061
Bull. Mater. Sci. (2021) 44:38 Page 5 of 16 38

The theoretical (figure 4b) and experimental (figure 4a)
calculated values of each absorption peak have been
listed in table 3. The absorption peak at 3495 cm-1 is
attributed to asymmetric stretching and 3348 cm-1 is
attributed to symmetric stretching of the aromatic NH2
group of benzimidazole. The comparatively broad band is
observed at 3124 cm-1 asymmetric and symmetric
stretchings of NH2 group [16,17]. The benzene ring C–H
stretching band is observed at 2970 cm-1 [18]. The strong
absorption peak of C=O stretching corresponding to
L-tartaric bonds have also been recorded. It has contin-
uous absorption peaks up to 1500 cm-1 [18]. O–H
bending absorption is observed at 1378 cm-1 which
corresponds to L-tartaric acid. This band also involved in
intermolecular interaction. The strong C–O stretching is
observed at 1228 cm-1 [18]. The medium C–N stretching
is observed at 1130 and 1066 cm-1. The observed peak
for C–N in simulation and experimental suggest the
intramolecular charge transfer activities. The peaks
observed at 851 and 751 cm-1 corresponds to C–H
bending. The experimental and simulated peaks are in
agreement with each other. Further lower absorption at
544 cm-1 is due to deformation modes of carboxylic
group.
Figure 4. (a) Experimental FTIR–ATR response. (b) DFT calculation of FTIR analysis.
38 Page 6 of 16 Bull. Mater. Sci. (2021) 44:38

3.4 UV–visible spectral analysis
The non-linear optical process is basically the absorption
of energy and promotes the electrons to excited states.
Response of crystals in absorption of radiated energy in
UV–visible range will make available the information
about the same. The low absorption characteristic, com-
monly observed in organic crystals, supports non-linear
behaviour as well as the usage of material in optical
switching devices [19,20]. The UV–visible response of
BILT was analysed in the range of 200–1400 nm using
Perkin Elmer Lambda spectrophotometer. The transmis-
sion curve depicted in figure 5 shows lower cut-off
wavelength of 288 nm. Both are in good agreement of
each other. Further, good quality of[75% transmission
(*80% in visible range) observed throughout. This
confirms the usage of analysed crystal for optoelectronic
device [21].
Table 3. Experimental and calculated band assignment from FTIR repsonse.
Band—experimental
wavenumber (cm-1)
Band—calculated
wavenumber (cm-1) Band assignment
3495 3589 Symmetric stretching of NH2
3348
3124 3106 Asymmetric and symmetric stretching of NH2
2970 2861 C–H stretching
2766 C=O stretching
1904 1902
1700 1690
1378 1370 O–H bending
1228 1178 C–O stretching
1130 1120 C–N stretching
1066 1040
852 860 C–H bending
746 745
530 470 C–O bending
Figure 5. UV–visible transmission response of title compound.
Bull. Mater. Sci. (2021) 44:38 Page 7 of 16 38

With the help of Tauc’s plot [22] (figure 6), the optical
band gap was found to be 4.2 eV and the transition was
observed to be indirect band gap with the coefficient (m =
0.5) from the Tauc’s equation [23]. The tuning of energy
intensity during device fabrication can be subjected to
optical constants like change in refractive index (g) and
extinction coefficient (K) of the material [24]. The loss of
energy due to absorption and scattering with propagation
can be evaluated with extinction coefficient. The graph of
extinction coefficient with wavelength is given in figure 7
which suggests the value of coefficient is very low and
remains constant in the range of 280–800 nm. As shown
Figure 6. Tauc’s plot and band gap calculation.
Figure 7. Extinction coefficient observation with wavelength.
38 Page 8 of 16 Bull. Mater. Sci. (2021) 44:38

in figure 8, the refractive index remains almost constant
in the range of 280–850 nm. Furthermore, minor raise has
been observed.
3.5 Frontier molecular orbital and MEP analysis
Quantum chemical calculation was carried out with TD-
DFT using function B3LYP. The simulation (figure 9)
shows best fit absorption peak with experimental value at
305 nm which shows the transition from HOMO to LUMO.
The frontier molecular orbital plays a decisive role in
assessing the optical and electrical parameters [25,26]. The
NLO and chemical activities can also be explained with
HOMO and LUMO energy gap. The HOMO–LUMO tran-
sition is shown in figure 10. It shows delocalization of
charge density over the benzimidazole in HUMO and over
tartrate in LUMO. This confirms charge transfer interaction
[27,28]. The energy of HOMO is 6.0140 eV and LUMO is
1.9801 eV. Hence, the calculated energy gap between
HOMO and LUMO is 4.03 eV.
The net electrostatic effect and relative polarity of
molecule at point in space can be examined by overall
charge distribution of the molecule [29–31]. The MEP
describes the net charge distribution. This also helps in
visualizing reaction activity of the molecules and hydrogen
bonding as well [32–34]. The plot (figure 11) is distributed
in the range of -9.322e-2 to 9.322e-2 graded in range of
colours from red to blue, respectively. The green colour
represents central range (towards neutral or zero potential)
of the electrostatic field. The tartrate section represents the
blue (positive potential) and the benzimidazole represents
Figure 8. Change in refractive index with wavelength.
Figure 9. Quantum chemical UV–visible output and energy transition response.
Bull. Mater. Sci. (2021) 44:38 Page 9 of 16 38

yellow and red (negative potential). This is also evident that
benzene ring is mostly less reactive here. Overall, the
compound has excellent charge transfer system among two
molecules.
3.6 Mulliken charge distribution analysis
The distribution of charges in title compound helps us to analyse
the overall distribution, net charges and confirmation for
bondinganalysis.TheMullikenpopulationanalysis, as shown in
figure 12, suggests that the distribution of charges has a range of
-0.8390 to 0.5438. As given in table 4, all the hydrogen atoms
including H21 and H26 which are involved in interaction, pos-
sess positive charges in the range of 0.1402–0.4148. All the
nitrogen and oxygen atoms possess negative charge distribution
in the range of (-0.8390 to -0.3666) and (-0.6582 to
-0.3443), respectively. This analysis confirms the intramolec-
ular bond (benzene and imidazole through N2) and inter-
molecular hydrogen sharing (N2–H21—O11–H26).
Figure 10. Molecular frontier analysis: HOMO–LUMO transition.
38 Page 10 of 16 Bull. Mater. Sci. (2021) 44:38

Figure 11. Molecular electrostatic potential response.
Figure 12. Mulliken charge distribution.
Bull. Mater. Sci. (2021) 44:38 Page 11 of 16 38

3.7 Thermal analysis
Non-linear crystals are usually subjected to high energy
environment and required good stability. Thermal
decomposition of any material will give idea about its
usage range over temperature. Thermogravimetric
analysis (TGA) and differential thermal analysis (DTA)
were carried out on powder sample of grown BILT.
The analysis was carried out in nitrogen atmosphere in
the range of 30–650�C at a heating rate of 10�C per
minute. Figure 13 represents that the material starts
decomposing at 180�C and sharp decomposition is
observed at 192�C. During this single-phase decompo-
sition, the weight loss of material is observed up to
98% from 180 to 250�C. The usage range for BILT
crystal is up to 192�C which is a potential range for
any NLO devices.
3.8 Dielectric analysis
Behaviour of the material subject to external electric field
with change in frequency is observed at different tempera-
tures (30–70�C, in steps of 10�C) with ac frequency range
of 100 Hz–4 MHz. The observations were taken in PSM-
1735 impedance analyzer. The change in dielectric constant
and dielectric loss with temperature and frequency is shown
in figure 14a and b. The value of dielectric constant is found
to sustain with very minor change, temperature and same
frequency in most of the operating range. The value of the
dielectric constant is observed high at lower frequency due
to space charge polarization [35]. The space charge polar-
ization activity is high at higher temperature and lower
frequency [36,37]. The dielectric loss is very less in high
Table 4. Mulliken charge distribution.
Atom Mullikan charge value
N2 -0.839024
O12 -0.658213
O11 -0.570645
O17 -0.548349
O19 -0.537313
N5 -0.366636
O18 -0.362641
O16 -0.344361
C7 -0.193743
C8 -0.151598
C4 -0.147369
C9 -0.059228
C14 -0.024802
C6 -0.018802
C13 -0.000983
H23 0.140239
H24 0.141622
H25 0.159301
H20 0.190351
H22 0.198324
H28 0.200106
C1 0.209542
H29 0.266243
C3 0.290833
H21 0.385646
H26 0.394738
H30 0.402617
H27 0.410771
H31 0.414875
C15 0.474682
C10 0.543815
Figure 13. Thermal analysis of BILT compound.
38 Page 12 of 16 Bull. Mater. Sci. (2021) 44:38

frequency range due to less correlation with natural
frequency of bound charges and applied external field. Low
dielectric constant and dielectric loss support the second
harmonic generation activities in material [36].
The further analysis was carried out for frequency-de-
pendent conductivity (figure 15) which is also dependent on
temperature. This shows motion of weakly bound charges
with external field. As shown in figure 16, the Joncher’s
Figure 14. (a) Dielectric constant response in operating range of frequency. (b) Dielectricloss response in operating range of frequency.
Bull. Mater. Sci. (2021) 44:38 Page 13 of 16 38

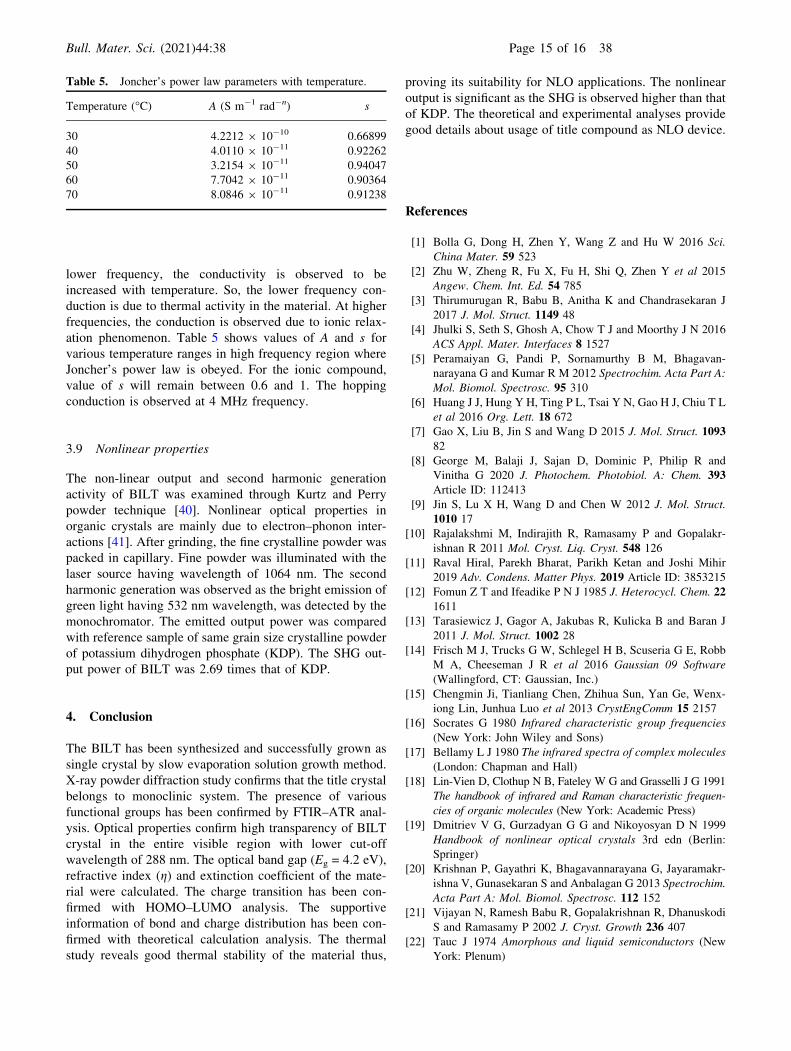
power law helps us to analyse the same [38,39]. The power
law represents total conductivity as r(x) which can be
presented as:
rðxÞ ¼ rdc þ Axs;
here, rdc is the conductivity in the absence of ac field. Axs
the dispersive component of ac conduction, x the applied
angular frequency, A the strength of polarizability and s thedegree of interaction among lattice and mobile ions. At the
Figure 15. ac conductivity with frequency.
Figure 16. Joncher’s power law analysis.
38 Page 14 of 16 Bull. Mater. Sci. (2021) 44:38
lower frequency, the conductivity is observed to be
increased with temperature. So, the lower frequency con-
duction is due to thermal activity in the material. At higher
frequencies, the conduction is observed due to ionic relax-
ation phenomenon. Table 5 shows values of A and s for
various temperature ranges in high frequency region where
Joncher’s power law is obeyed. For the ionic compound,
value of s will remain between 0.6 and 1. The hopping
conduction is observed at 4 MHz frequency.
3.9 Nonlinear properties
The non-linear output and second harmonic generation
activity of BILT was examined through Kurtz and Perry
powder technique [40]. Nonlinear optical properties in
organic crystals are mainly due to electron–phonon inter-
actions [41]. After grinding, the fine crystalline powder was
packed in capillary. Fine powder was illuminated with the
laser source having wavelength of 1064 nm. The second
harmonic generation was observed as the bright emission of
green light having 532 nm wavelength, was detected by the
monochromator. The emitted output power was compared
with reference sample of same grain size crystalline powder
of potassium dihydrogen phosphate (KDP). The SHG out-
put power of BILT was 2.69 times that of KDP.
4. Conclusion
The BILT has been synthesized and successfully grown as
single crystal by slow evaporation solution growth method.
X-ray powder diffraction study confirms that the title crystal
belongs to monoclinic system. The presence of various
functional groups has been confirmed by FTIR–ATR anal-
ysis. Optical properties confirm high transparency of BILT
crystal in the entire visible region with lower cut-off
wavelength of 288 nm. The optical band gap (Eg = 4.2 eV),
refractive index (g) and extinction coefficient of the mate-
rial were calculated. The charge transition has been con-
firmed with HOMO–LUMO analysis. The supportive
information of bond and charge distribution has been con-
firmed with theoretical calculation analysis. The thermal
study reveals good thermal stability of the material thus,
proving its suitability for NLO applications. The nonlinear
output is significant as the SHG is observed higher than that
of KDP. The theoretical and experimental analyses provide
good details about usage of title compound as NLO device.
References
[1] Bolla G, Dong H, Zhen Y, Wang Z and Hu W 2016 Sci.China Mater. 59 523
[2] Zhu W, Zheng R, Fu X, Fu H, Shi Q, Zhen Y et al 2015Angew. Chem. Int. Ed. 54 785
[3] Thirumurugan R, Babu B, Anitha K and Chandrasekaran J
2017 J. Mol. Struct. 1149 48
[4] Jhulki S, Seth S, Ghosh A, Chow T J and Moorthy J N 2016
ACS Appl. Mater. Interfaces 8 1527
[5] Peramaiyan G, Pandi P, Sornamurthy B M, Bhagavan-
narayana G and Kumar R M 2012 Spectrochim. Acta Part A:Mol. Biomol. Spectrosc. 95 310
[6] Huang J J, Hung Y H, Ting P L, Tsai Y N, Gao H J, Chiu T L
et al 2016 Org. Lett. 18 672
[7] Gao X, Liu B, Jin S and Wang D 2015 J. Mol. Struct. 109382
[8] George M, Balaji J, Sajan D, Dominic P, Philip R and
Vinitha G 2020 J. Photochem. Photobiol. A: Chem. 393Article ID: 112413
[9] Jin S, Lu X H, Wang D and Chen W 2012 J. Mol. Struct.1010 17
[10] Rajalakshmi M, Indirajith R, Ramasamy P and Gopalakr-
ishnan R 2011 Mol. Cryst. Liq. Cryst. 548 126
[11] Raval Hiral, Parekh Bharat, Parikh Ketan and Joshi Mihir
2019 Adv. Condens. Matter Phys. 2019 Article ID: 3853215
[12] Fomun Z T and Ifeadike P N J 1985 J. Heterocycl. Chem. 221611
[13] Tarasiewicz J, Gagor A, Jakubas R, Kulicka B and Baran J
2011 J. Mol. Struct. 1002 28
[14] Frisch M J, Trucks G W, Schlegel H B, Scuseria G E, Robb
M A, Cheeseman J R et al 2016 Gaussian 09 Software(Wallingford, CT: Gaussian, Inc.)
[15] Chengmin Ji, Tianliang Chen, Zhihua Sun, Yan Ge, Wenx-
iong Lin, Junhua Luo et al 2013 CrystEngComm 15 2157
[16] Socrates G 1980 Infrared characteristic group frequencies(New York: John Wiley and Sons)
[17] Bellamy L J 1980 The infrared spectra of complex molecules(London: Chapman and Hall)
[18] Lin-Vien D, Clothup N B, Fateley W G and Grasselli J G 1991
The handbook of infrared and Raman characteristic frequen-cies of organic molecules (New York: Academic Press)
[19] Dmitriev V G, Gurzadyan G G and Nikoyosyan D N 1999
Handbook of nonlinear optical crystals 3rd edn (Berlin:
Springer)
[20] Krishnan P, Gayathri K, Bhagavannarayana G, Jayaramakr-
ishna V, Gunasekaran S and Anbalagan G 2013 Spectrochim.Acta Part A: Mol. Biomol. Spectrosc. 112 152
[21] Vijayan N, Ramesh Babu R, Gopalakrishnan R, Dhanuskodi
S and Ramasamy P 2002 J. Cryst. Growth 236 407
[22] Tauc J 1974 Amorphous and liquid semiconductors (New
York: Plenum)
Table 5. Joncher’s power law parameters with temperature.
Temperature (�C) A (S m-1 rad-n) s
30 4.2212 9 10-10 0.66899
40 4.0110 9 10-11 0.92262
50 3.2154 9 10-11 0.94047
60 7.7042 9 10-11 0.90364
70 8.0846 9 10-11 0.91238
Bull. Mater. Sci. (2021) 44:38 Page 15 of 16 38

[23] Mott N F and Gurney R W 1940 Electronic processes inionic crystals 2nd edn (London: Oxford)
[24] Sangeetha V, Gayathiri K, Krishnan P, Sivakumar N, Kana-
gathara N and Anbalagan G 2014 J. Cryst. Growth 389 30
[25] Srinivasaraghvan R, Thamaraikannan S, Seshadri S and
Gnanasambandan T 2015 Spectrochim. Acta A 137 1194
[26] Khalid M, Ullah M A, Adeel M, Usman Khan M, Nawaz
Tahir M and Carmo Braga A A 2019 J. Saudi Chem. Soc. 23546
[27] Mrouesh M, Daher C, Hariri E, Demirdjian S, Isber S, Choi
E S et al 2015 Chem.-Biol. Interact. 231 53
[28] Venkatesh Nampally, Naveen Baindla, Venugopal Abbu,
Gangadhari Suresh, Varukolu Mahipal, Palnati Manojkumar
et al 2019 J. Mol. Struct. 1196 462
[29] Jug K and Maksic Z B 1991 Theoretical model of chemicalbonding (Berlin, Heidelberg: Springer) p 235
[30] Fliszar S 1983 Charge distribution and chemical effects(New York: Springer-Verlag)
[31] Smith P E and Pettit B M 1991 J. Am. Chem. Soc. 113 6029
[32] Murray J S and Sen K 1996 Molecular electrostatic poten-tials (Amsterdam: Elsevier)
[33] Scrocco E, Tomasi J and Lowdin P 1978 Advances inquantum chemistry (New York: Academic Press)
[34] Sponer J and Hobza P 1996 Int. J. Quantum Chem. 57 959
[35] Prasad N V, Prasad G, Bhimasankaran T, Suryanarayana S V
and Kumar G S 1969 Indian J. Pure Appl. Phys. 14 639
[36] Syed K, Babu S, Peramaiyan G, Nizam Mohideem M and
Mohan R 2015 J. Therm. Anal. Calorim. 120 1337
[37] Kremar F and Schoenhals A 2012 Broadband dielectricspectroscopy (Berlin: Springer)
[38] Jonscher A K 1983 Dielectric relaxation in solids (London:Chelsea Dielectrics Press)
[39] Jonscher A K 1977 Nature 267 673
[40] Kurtz S K and Perry T T 1968 J. Appl. Phys. 39 3798
[41] Krishnakumar V, Manohar S, Nagalakshmi R, Piasecki M,
Kityk I V and Bragiel P 2009 Eur. J. Appl. Phys. 47 30701
38 Page 16 of 16 Bull. Mater. Sci. (2021) 44:38