growth hormone assays and dynamic tests in the diagnosis
TRANSCRIPT

3
Growth hormone assays and dynamic testsin the diagnosis of acromegaly and
GH deficiency in adults
Helene Markkanen
Doctoral Dissertation
To be presented for public discussion with the permission of the Faculty of Medicine of the University of Helsinki, in lecture room 2, Haartman Institute,
on the 4th of June, 2021 at 12 o´clock.
Helsinki 2021
Department of Clinical Chemistry and HaematologyUniversity of Helsinki
andHUS Diagnostic Center
Helsinki University Hospital
4
Supervisors
Professor, emeritus Ulf-Håkan Stenman, MD, PhDDepartment of Clinical ChemistryUniversity of HelsinkiHelsinki, Finland
Professor Esa Hämäläinen, MD, PhDDepartment of Clinical ChemistryUniversity of Eastern FinlandKuopio, Finland
Reviewers
Docent Tapani Ebeling, MD, PhDDepartment of Internal MedicineDivision of EndocrinologyOulu University HospitalUniversity of OuluOulu, Finland
Docent Pertti Koskinen, MD, PhDDepartment of Clinical ChemistryTurku University Central HospitalHospital District of Southwest FinlandUniversity of TurkuTurku, Finland
Opponent
Docent Kerttu Irjala, MD, PhDDepartment of Clinical Chemistry, Medical FacultyUniversity of TurkuTurku, Finland
Doctoral Programme in Clinical Research
The Faculty of Medicine uses the Urkund system (plagiarism recognition)to examine all doctoral dissertations.
ISBN 978-951-51-7272-3 (nid.)ISBN 978-951-51-7273-0 (PDF)
Copy-Set OyHelsinki 2021

5
To middle-aged women
6
ABSTRACT
Background: The measurement of serum growth hormone (GH) is the cornerstone of diagnosis and management of GH-related disorders, acromegaly, and GH defi-ciency (GHD). GH secretion is pulsatile and stimulated by a variety of factors (e.g. stress and exercise). Therefore, results from a single random blood sample are not diagnostic. The diagnosis of GH diseases is based on testing the suppression and stimulation of GH secretion from the pituitary.
GH measurement is challenging due to the heterogenous structure and binding pro-teins of GH. The first assays for GH were based on radioimmunoassay (RIA) using polyclonal antibodies. The International Standard (IS) reference preparations used to calibrate GH assays were of pituitary origin and contained a pooled cadaver-de-rived mixture of GH isoforms. There was a significant methodological change in serum GH assays during the 1990s, when RIAs using polyclonal antibodies were gradually replaced by more specific sandwich assays with monoclonal antibodies and highly sensitive labels. Thus, the use of monoclonal antibodies and IS pre-parations containing different GH isoforms caused significant between-assay and between-laboratory variation of GH concentrations.
In 1994, the standard of recombinant 22-kDa GH was available and in 2001 the WHO IS 98/574 was established. During the last 10 years, GH immunoassay manu-facturers have adopted the WHO IS 98/574 (22 kDa) for calibration of GH assays. Together with monoclonal antibodies, this has resulted in reduced GH concentra-tion values obtained by the recent GH assays.
Aims: The aim of study (Study I) was to evaluate the GH assays used in Finland between 1998 to 2003, when between-assay variation was large. The second aim was to evaluate the clinical use of AutoDELFIA and Immulite 2000 assays (both cali-brated against IS 80/505) and to compare them with polyclonal RIA, which was ca-librated against the older standard (IRP 66/217) (Study II). The third and fourth aims were to evaluate the consensus cut-offs of the oral glucose tolerance test (OGTT) (Study II) and insulin tolerance test (ITT) (Study III) in clinical practice using Auto-DELFIA and Immulite 2000 assays. The fifth aim was to evaluate and adopt into clinical use a new GHRH+ARG test by studying control subjects and GHD patients (Study IV). We used the AutoDELFIA GH assay, which was in routine use until 2015. The sixth aim was to establish the cut-offs for the GHRH+ARG test using the Immu-lite 2000 XPi GH assay, which is calibrated against the current recombinant GH IS 98/574 (Study IV).
Subject and methods: The study included 128 control subjects and 71 treated and 7 untreated acromegalic patients and 34 patients with GHD. Of the 128 control subjects, 67 (36 men and 31 women) underwent all three tests (OGTT, ITT, and the GHRH+ARG test). GH concentrations were analysed by AutoDELFIA and Immulite 2000 or AutoDELFIA and Immulite 2000 XPi assays.
7
Results and conclusions: The cut-off values for the diagnosis and follow up of GH diseases, which are mentioned in consensus statements and guidelines, cannot be adopted without validation of the GH assay used. Male control subjects in the OGTT and GHRH+ARG test had significantly lower GH values than women, sug-gesting that different cut-off values for men and women are necessary. This gender difference is not addressed in consensus statements. In our study, the ITT was an un-reliable test for GHD. Almost half of apparently healthy adults had peak GH values <3 µg/L, which is the cut-off for GHD recommended in the consensus statement of 2011. Because of the between-assay variation of GH results, it is important that the same assay is used in the follow up of each patient.
The Immulite 2000 XPi assay, which is calibrated against the latest WHO IS 98/574, yields sufficiently similar GH results as the AutoDELFIA assay, which was calibrated against IS 80/505. Thus, the cut-off values established by the AutoDELFIA assay could be adopted for use with the new Immulite 2000 XPi. Awareness of the dif-ferences between GH assays and the importance of external quality assessment schemes are crucial.
8
CONTENTS
ABSTRACT 6
LIST OF ORIGINAL PUBLICATIONS 10
ABBREVIATIONS 11
INTRODUCTION 12
REVIEW OF THE LITERATURE 14
1. Growth hormone 141.1 Historical background 141.2 GH effects 141.3 GH synthesis and structure 151.4 Growth hormone receptor 16 1.5 Growth hormone binding proteins 171.6 Physiology 171.7 Synthesis and physiology of IGF-1 191.8 Diurnal variation 201.9 Effect of age and gender 201.10 Effect of weight 21
2. Growth hormone measurement 232.1 Assay type and antibodies 232.2 Standard preparations 242.3 GHBPs and other confounding factors 252.4 GH measurement in clinical practice 262.4.1 GH measurement in acromegaly 262.4.2 GH measurement in growth hormone deficiency 272.4.3 GH sampling and storage 27
3. Acromegaly 283.1 Aetiology 283.2 Clinical findings 283.3 Laboratory diagnosis 293.4 Treatment and laboratory follow up 30
4. Growth hormone deficiency 334.1 Aetiology 334.2 Clinical findings 334.3 Laboratory diagnosis 344.3.1 Serum IGF-1 in GHD 354.3.2 Stimulation tests 354.4 Treatment and laboratory follow up 37

9
AIMS OF THE STUDY 39
SUBJECTS AND METHODS 40
1. Study design 40
2. Subjects 402.1 Controls (study II, III, IV) 402.2 Patients (study II, IV) 40
3. Tests 413.1 Oral glucose tolerance test 413.2 Insulin tolerance test 413.3 Growth hormone-releasing hormone (GHRH) + arginine test 42
4. Samples 42
5. Laboratory methods 42
6. Statistical methods 44
7. Ethical aspects 44
RESULTS 45
1. Comparison of GH assays 452. Basal GH concentrations 493. OGTT 494. ITT 515. GHRH+ARG test 53
DISCUSSION 56
1. The need for harmonization of GH methods 562. OGTT in diagnosis of acromegaly in adults 583. Stimulation tests for the diagnosis of GH deficiency in adults 634. Strengths of the study 675. Limitations of the study 676. Clinical guidelines 677. New laboratory diagnostics of GH diseases in the near future 69
SUMMARY AND CONCLUSIONS 70
APPENDICES 72
ACKNOWLEDGEMENTS 74
REFERENCES 76
ORIGINAL PUBLICATIONS 97
10
LIST OF ORIGINAL PUBLICATIONS
This thesis is based on the following original publications, which are referred to in the text by their Roman numerals:
I. Mörsky P, Tiikkainen U, Ruokonen A, Markkanen H. Problematic determination of serum growth hormone: Experience from external quality assurance surveys 1998-2003. Scand J Clin Lab Invest 2005; 65: 377-86.
II. Markkanen H, Pekkarinen T, Välimäki M, Alfthan H, Kauppinen-Mäkelin R, Sane T, Stenman UH. Effect of sex and assay method on serum concentrations of growth hormone in patients with acromegaly and in healthy controls. Clin Chem 2006; 52: 468-473.
III. Markkanen H, Pekkarinen T, Välimäki M, Alfthan H, Hämäläinen E, Stenman UH. Comparison of two growth hormone stimulation tests and their cut-offs limits in healthy adults at an outpatient clinic. Growth horm IGF Res 2013; 23: 165-169.
IV. Markkanen H, Pekkarinen T, Hämäläinen E, Välimäki M, Alfthan H, Stenman UH. Gender has to be taken into account in diagnosing adult growth hormone deficiency by the GHRH plus arginine test. Growth horm IGF Res 2017; 35: 52-56.
11
ABBREVIATIONS
ACTH Adrenocorticotropic hormoneADH Antidiuretic hormoneALS Acid-labile subunitBMI Body mass indexCV Coefficient of variationDM Diabetes mellitusFFA Free fatty acidsFSH Follicle-stimulating hormoneGH Growth hormone GHBP Growth hormone binding proteinGHD Growth hormone deficiencyGHR Growth hormone receptorGHRH Growth hormone-releasing hormoneGHRH+ARG test GHRH+arginine testGHRP-2 Growth hormone-releasing peptide-2GHRP-6 Growth hormone-releasing peptide-6GnRH Gonadotropin-releasing hormoneELISA Enzyme-linked immunosorbent assayEQAS External quality assessment schemehGH Human growth hormoneICMA Immunochemiluminometric assayIFMA Immunofluorometric assayIGF-1 Insulin-like growth factor-1IGFBP Insulin-like growth factor binding proteinIRMA Immunoradiometric assayIRP International Reference PreparationIS Internal standardITT Insulin tolerance testLH Luteinizing hormoneMAb Monoclonal antibodyOGTT Oral glucose tolerance testPAb Polyclonal antibodyPIT-1 Transcription factor PIT-1PROP-1 Transcription factor PROP-1QAS Quality assessment schemerhGH Recombinant human growth hormoneRIA RadioimmunoassaySDS Standard deviation scoreSPSS Statistical Package for the Social SciencesSRIF Somatotropin release-inhibiting factorSS SomatostatinTACE Tumour necrosis factor alpha converting enzymeTRH Thyrotropin-releasing hormoneTSH Thyroid-stimulating hormoneUKNEQAS United Kingdom National External Quality Assessment ServiceVIP Vasoactive intestinal peptideWHO World Health Organization
12
INTRODUCTION
Measurement of human growth hormone (hGH, somatotropin) is indispensable in the diagnosis and follow up of GH deficiency (GHD) and conditions with excessive GH secretion, acromegaly, and pituitary gigantism. The exact diagnosis is essential, as these diseases are associated with increased morbidity and mortality in the ab-sence of treatment (Molitch et al. 2011; Katznelson et al. 2014).
GH is a species-specific hormone (Popii and Baumann 2004). This thesis is focu-sed exclusively on hGH and GH measurement in adults. GH promotes growth through insulin-like growth factor (IGF-1). Individuals with genetic mutations in the GH receptor (GHR, Laron’s syndrome) experience dwarfism (Laron 2004). Use of a GHR antagonist, pegvisomant, which blocks the effects of GH on IGF-1, results in resolution of symptoms and metabolic features of acromegaly despite persistently elevated GH (Trainer et al. 2000). GH reflects GH secretion and IGF-1 reflects both the secretion and action of GH. Serum IGF-1 is fundamental in the diagnosis and follow up of GH disorders.
Serum GH measurement is challenging, as GH secretion is pulsatile and stimula-ted by a variety of factors (e.g. stress, exercise). Thus, results from a single, random blood sample are not diagnostic (Sata and Ho 2007). Dimaraki et al. have shown that a portion of newly diagnosed and untreated acromegalic patients sampled for plasma GH every 10 minutes for 24 hours may have mean daily GH levels within the normal range (Dimaraki et al. 2002). The biochemical confirmation of acrome-galy and GHD is based on measurement of GH concentrations during suppression and stimulation tests, respectively (Molitch et al. 2011; Katznelson et al. 2014). As GH immunoassays have shown poor interassay agreement, the cut-off values of the-se tests are dependent on the assay. Using the GH cut-off values from consensus sta-tements without validating samples from control subjects and patients may lead to misdiagnosis (Pokrajac et al. 2007; Bidlingmaier and Freda 2010; Clemmons 2011).
GH measurements are complicated by the heterogeneous nature of GH and two growth hormone binding proteins (GHBPs) in circulation. The major and minor forms of GH have a molecular weight of 22 kDa and 20 kDa, respectively. In ad-dition, several minor isoforms exist. The GH concentrations in serum or plasma are determined by immunoassay; the results are dependent on the assay method, the different characteristics of standards and calibrators, antibody specificity (po-lyclonal vs. monoclonal), and the different matrices of the calibrators (Felder et al. 1989; Bidlingmaier and Freda 2010; Meazza et al. 2012). Generally, the correlation between different GH assays is good, but there is large between-assay variation of GH levels (Reiter et al. 1988; Celniker et al. 1989; Pokrajac et al. 2007; Arafat et al. 2008; Müller et al. 2011). Several decades ago, differences in GH levels from diffe-rent assays could vary by as much as 2.5- to 6-fold (Celniker et al. 1989; Granada et al. 1990; Pokrajac et al. 2007; Arafat et al. 2008). Recently, up to 2-fold differences have been observed (Müller et al. 2011).
13
The use of different units (mass or international units) and a variety of unit conver-sion factors complicate the interpretation of GH results (Pokrajac et al. 2007). Ac-cording to the international recommendations for GH assay standardization, only the 22-kDa recombinant (GH, WHO IS 98/574) form should be used to standardize GH assays and the results should be expressed in substance concentrations (µg/L) (Trainer et al. 2006; Clemmons 2011). Although assays specific for the 22-kDa GH isoform are recommended, the antibodies presently used also detect other forms and thus cause differences in specificity and in GH concentrations between assays (Clemmons 2011; Müller et al. 2011).
Along with the increased use of recombinant hGH treatment in clinical practice, the demand for GH measurements has increased. The diagnosis affects the costs of GH therapy and of acromegaly treatment. A correct diagnosis also reduces morbi-dity and mortality of GH diseases and the side effects of treatment. The criteria for decision limits of suppression and stimulation tests have changed over time as assay performance has developed. There is ongoing debate about the cut-off for nadir GH during the oral glucose tolerance test (OGTT) and which stimulation test should be used for diagnosis of GHD in adults. The hypothesis was that the earlier cut-offs used for GH were not optimal with newer, more sensitive assays (Wood 2001). The aim of this study was to evaluate the cut-off values for currently used GH suppres-sion and stimulation tests using different GH assays from 1998 until the present day.

14
REVIEW OF THE LITERATURE
1. Growth hormone
1.1 Historical background
The existence of a “hormone of growth” that controls and promotes skeletal growth was proposed for the first time in 1912 by Harvey Cushing. He demonstrated that a pituitary adenoma was the cause of acromegaly and gigantism (Cushing 1909; Sheaves 1999). Earlier, in 1886, the neurologist Pierre Marie had linked the term “acromegaly” to a previously described distinct disease characterized by hyper-trophy of the hands, feet, and face (de Herder 2016). Since then, the treatment of acromegaly has diversified and improved, and diagnosis and follow up have beco-me more important.
GH was isolated from human cadaveric pituitaries in 1956 (Li and Papkoff 1956) and its structure was established in 1971 (Li and Dixon 1971). The first GH assay based on a radioimmunological technique (RIA) was presented in 1963 (Glick et al. 1963). Insulin-induced hypoglycaemia was demonstrated to increase plasma GH concentration in healthy subjects but not in patients with GH deficiency; glucose load induced GH suppression in healthy subjects but not in acromegaly patients (Roth et al. 1963).
In 1960, treatment of growth retardation in children with hypopituitarism with cadaveric GH became an accepted clinical option. Since 1962, when a 35-year-old woman with hypopituitarism was successfully treated with GH therapy, a dis-cussion on the benefits of the GH treatment in adults began (Raben 1962). In 1985, GH derived from human pituitaries was shown to cause lethal Creutzfeldt-Jakob disease (Koch et al. 1985). This problem was solved with the introduction of recom-binant human GH (rhGH, WHO IS 88/624) in 1985; thus GH treatment of adult GHD became possible. GH treatment of GHD in adults was accepted in 1996, when several studies indicated that some GHD patients with the metabolic, body composition, and psychological symptoms of GH deficiency benefited from GH substitution (Jørgensen et al. 1989; Salomon et al. 1989; Cuneo et al. 1992; Growth Hormone Research Society 1998).
1.2 GH effects
The main function of GH is stimulation of linear bone growth from birth until the completion of puberty. GH has anabolic properties and is also important as it re-gulates body composition, affecting muscle and bone metabolism throughout life. It is responsible for a variety of metabolic effects, such as increasing lipolysis and protein synthesis but decreasing glucose uptake. However, GH increases hepatic glucose production (Carroll et al. 1998). By increasing free fatty acids (FFA) in plas-ma, GH causes insulin resistance and hyperinsulinemia. Thus, GH has a central role in regulating whole-body lipid metabolism and glucose homeostasis. Long-term GH replacement in patients with GHD induces sustained lipolysis and a gradual reduction in fat mass towards normal levels (Kopchick et al. 2020).
15
Many effects of GH are mediated through the influence of IGF-1, which also supp-resses GH gene transcription and GH secretion by negative feedback on GH and GH-releasing hormone (GHRH). IGF-1 affects not only growth but also glucose and lipid metabolism (Melmed and Fagin 1987; Kopchick et al. 2020). GH is diabetoge-nic and lipolytic, whereas IGF-1 is not (Kopchick et al. 2020). GH increases perip-heral deiodination of T4 to T3 (Porretti et al. 2002) and decreases the conversion of inactive cortisone to active cortisol by reducing the activity of 11-beta-hydroxyste-roid dehydrogenase type 1 (Giavoli et al. 2004). These effects should be considered in GH hormone replacement therapy of hypopituitarism with GHD.
1.3 GH synthesis and structure
GH is encoded by the GH-1 gene on the long arm of chromosome 17 and is expres-sed in somatotroph cells of the anterior pituitary gland. In pregnancy, the placenta produces a GH variant, placental somatomammotropin (GH-V or GH-2) from the GH-2 gene (Baumann 1991; Popii and Baumann 2004). The heterogeneity of GH is not only due to genetic variation but also to posttranscriptional and posttranslatio-nal modifications. Plasma contains more than 100 variants of GH (Baumann 1991).
The main form of GH is 22-kDa GH, also known as GH-1 and GH-N. It is a non-gly-cosylated single-chain polypeptide containing 191 amino acids and two disulfide bonds (Baumann 1991). It has two binding sites for interaction with GHR. The 22-kDa monomeric form represents approximately 55-75% of total GH secretion in the pituitary. In circulation, 15 to 30 minutes after a secretory pulse, the 22-kDa monomeric form is the most abundant (Table 1) and bioactive form of GH (Bau-mann 1991; Baumann 2009). Monomeric 22-kDa GH is used as a standard against which all other GH variants are compared (Baumann 1991; Popii and Baumann 2004). The biological actions and clinical significance of the other different variants remain unclear (Ribeiro de Oliveira Longo Schweizer et al. 2018).
The second most abundant form of pituitary GH is the 20-kDa form (5-10% of the total GH production), which is a splicing variant of 22-kDa GH with deletion of amino acids 32 to 46 (Lewis et al. 1978; Baumann 2009). It has less biological acti-vity than the 22-kD form and it binds to GHR with lower affinity and has a tendency to dimerize (Baumann 1991). These main forms are secreted from the somatotroph cells in the anterior pituitary in bursts with a constant molar ratio of 22- and 20-kDa GH. Deamidated and N-acylated forms of 22-kDa GH and various oligomers are also secreted by the pituitary (Baumann 1991). In blood, homodimerization and heterodimerization of monomeric molecules add to the variety of the GH iso-forms (Table 1). In circulation, there are less monomers and more oligomers than in the pituitary, because oligomeric GH is cleared more slowly than monomeric GH (Baumann 1991). The half-life of monomeric 22-kDa GH in blood is approximately 15 minutes, and that of 20-kDa is some minutes longer (Leung et al. 2002). GHBPs prolong the half-life of GH but also inhibit binding to GHR (Popii and Baumann 2004).
The concentrations of 20-kDa GH are higher in women than in men, but the ratio of 20-kDa to 22-kDa GH does not differ between genders (Leung et al. 2002). Leung did not observe any significant difference between the ratio of 20-kDa to 22-kDa

16
GH in healthy controls or in patients with acromegaly or GH deficiency. 20-kDa GH cosecretes and circulates at a constant ratio with 22-kDa GH under various physiological and pharmacological conditions. Administration of recombinant 22-kDa GH in normal subjects rapidly reduced the 20-kDa GH concentrations. This suggests rapid negative feedback regulation on pituitary release (Leung et al. 2002). Later, Lima et al. reported that acromegalic patients exhibit an increased proportion of the 20-kDa isoform in circulation and the use of an assay specific to 22-kDa GH may underestimate tumour-derived GH (Lima et al. 2010). The measurement of 20-kDa GH is not in clinical use.
Table 1. Human GH isoforms in pituitary gland and blood 15-30 minutes after a secretory pulse according to Baumann 1991 and 2009.
1.4 Growth hormone receptor
GH exerts its biological effects by binding to a specific cell-surface receptor, GHR, which belongs to the cytokine receptor family. GHR is most abundant in the liver but is also expressed in many other tissues, including muscle, fat, kidney, and heart (Leung et al. 2004). GHR is a single transmembrane glycoprotein that contains a 246-residue ex-tracellular N-terminus, a single 24 amino acid transmembrane helix, and a 350 amino acid intracellular domain. The GH molecule has two separate, nonoverlapping epito-pes for GHR binding. Thus, a single GH molecule binds to two GH receptor molecules resulting in dimerization of the GH receptor, which is required for signal transduction (Fisker 2006). Activation of receptor-associated Janus kinase 2 (Jak2) is considered a critical step in initiating GH signalling (Leung et al. 2004).
In pituitary In blood (%) (%)
Monomeric GH22-kDa GH (22% free in plasma) 55-75 4520-kDa GH (2% free in plasma) 6 5Deamidated, N-acylated, and glycosylated GH 12 5
Dimeric GH 18 22-kDa GH dimers 2020-kDa GH dimers 5Deamidated, N-acylated, and glycosylated GH 2
Oligomeric GH (trimer-pentamer) <822-kDa GH oligomers 1020-kDa GH oligomers 2Deamidated, N-acylated, and glycosylated GH 2
Immunoreactive fragments (12, 16 and 30 kDa) variable variable

17
1.5 Growth hormone binding proteins
Blood contains two GHBPs, one with high affinity for GH and the other with low affinity. GHBPs have no diagnostic value in acromegaly or GHD. However, changes in their concentrations can disturb measurement of GH (Baumann 1991).
The high-affinity GHBP (GHBP-1) is generated by proteolytic cleavage of GHR by the zinc metalloproteinase tumour necrosis factor alpha converting enzyme (TACE) in the liver. The molecular mass of GHBP-1 (i.e. the circulating extracellular domain of the GHR), is 61 kDa and forms a complex with GH and delays its elimination. The average plasma concentration in adults is approximately 1 nmol/L (Baumann 1991; Popii and Baumann 2004). Under basal conditions with serum GH concen-trations <10 µg/L, approximately 45% to 55% of circulating 22-kDa GH is com-plexed with high-affinity GHBP. Approximately 25% of 20-kDa GH is bound to this GHBP. Due to the low concentration of GHBP in plasma, a 1:1 complex between GH and GHBP predominates and not the ternary complex (GHBP-GH-GHBP) (Po-pii and Baumann 2004; Baumann 2009).
High-affinity GHBP concentrations are low in infants and rise progressively during childhood to adult levels. Although concentrations depend on nutritional, metabo-lic, and hormonal conditions, there is no large diurnal variation. Low concentra-tions occur in uraemia and insulin-dependent diabetes and fasting tends to lower GHBP-1 concentrations (Baumann et al. 1989; Baumann 1991). High GHBP con-centrations are associated with increased fat mass and low concentrations of GH. The influence of gender on GHBP concentrations is controversial. In some studies, females have higher concentrations whereas no gender difference has been obser-ved in other reports (Fisker 2006). Plasma GHBP-1 levels reflect GHR abundance in the liver. GHBP-1 binds 22-kDa GH with considerably higher affinity than the 20-kDa variant. In Laron’s syndrome, GHBP-1 concentration is low or undetectable (Baumann 1991).
A low-affinity GHBP (GHBP-2) consists of modified alpha-2-macroglobulin (Bau-mann 2009). The source of GHBP-2 is unknown, but it is most likely produced by the liver. The average concentration of GHBP-2 in plasma is 700 nmol/L. Low-affi-nity GHBP is responsible for complexing 7% to 8% of circulating 22-kDa GH and 25% of circulating 20-kDa GH. GHBP-2 has a molecular mass of 100 kDa and a high capacity for GH binding and thus does not become saturated at GH levels within the physiological range (Baumann 1991).
1.6 Physiology
GH is secreted in a pulsatile pattern, which is largely due to hypothalamic neuro-peptides, the stimulatory action of GHRH, and the fluctuating inhibitory influence of somatostatin (SRIF, somatotropin release-inhibiting factor). The activation of the suprahypothalamic neurotransmitter system (e.g. catecholamines and acetylcholi-ne) regulates these hormones. IGF-1 has a major inhibitory action on GH release through feedback both in the hypothalamus and pituitary (Cuttler 1996; Giustina and Veldhuis 1998).
18
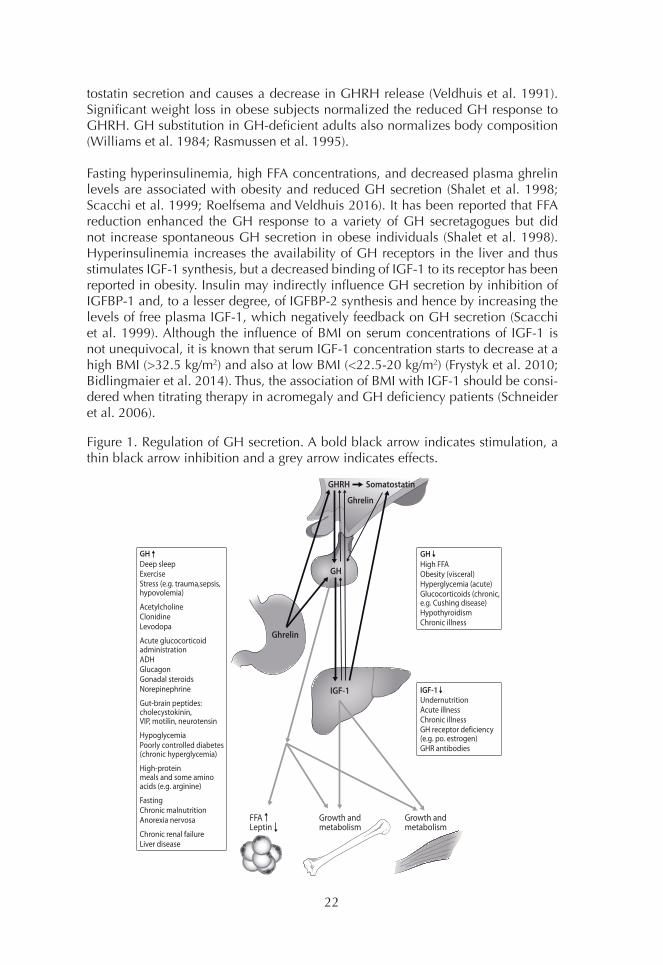
GHRH is a polypeptide of 44 amino acids and increases GH gene transcription and GH synthesis and secretion in the anterior pituitary gland. The half-life of GHRH is 3 to 6 minutes. GHRH plays an important role in pituitary somatotropic develop-ment. GHRH is required for initiation of GH pulses. Somatostatin is a peptide of 28 amino acids and inhibits the secretion of GH without affecting transcription and synthesis. Its half-life is only approximately 2 minutes. The timing and amplitude of GH secretion are primarily controlled by intermittent release of somatostatin (Hart-man et al. 1993; Giustina and Veldhuis 1998). It was later shown that ghrelin, which is mainly synthesized in the stomach, binds to somatotroph cells and stimulates GH secretion and appetite. Plasma ghrelin concentration is increased when fasting and decreased after food intake (Kojima and Kangawa 2005). The hypothalamo-pituitary response is influenced by negative GH feedback (Cuttler 1996).
The amplitude and frequency of GH secretory pulses are regulated by a complex interplay of internal and external stimuli, including diurnal variation, age, gender, body composition, nutrition, exercise, stress, and different diseases and medica-tions (Hartman et al. 1993; Giustina and Veldhuis 1998). Nutritional status influen-ces GH secretion; thus fasting stimulates and meals suppress GH secretion. GH se-cretion is inhibited by glucose and fatty acids and increased by several amino acids (Hartman et al. 1993). Glucocorticoids inhibit the pituitary GH release normally provoked by hypoglycaemia (Frantz and Rabkin 1965). However, small amounts of exogenous synthetic glucocorticoid stimulate pulsatile GH secretion over several days in healthy adults. GH secretion is further modified by acute and chronic ill-ness, including liver failure. GH concentrations are often elevated in chronic renal failure (Hartman et al. 1993; Cuttler 1996; Giustina and Veldhuis 1998) (Figure 1).
GH is very stable in plasma but undergoes fragmentation in peripheral tissues (Bau-mann 1991). The proportions of GH isoforms in plasma change as a function of time after secretion (Popii and Baumann 2004). Not only the concentrations of GH but also GHR turnover, post-receptor regulation of GHR, and plasma GHBP concentra-tions determine the biological effects of GH (Fisker 2006). Approximately 65% of the clearance of GH proceeds via glomerular filtration and extensive GH reuptake and degradation occurs in the proximal tubule cells. Only a minimal part (approx-imately 0.01%) of the filtered GH reaches the final urine (Hanssen 1972; Popii and Baumann 2004). The 20-kDa GH form is eliminated more slowly than 22-kDa GH, partially due to its tendency to dimerize (Leung et al. 2002; Baumann 2009). Only the monomeric forms are detectable in urine (Hanssen 1972; Baumann 1991).
Placental GH, which is present in high plasma concentrations in the third trimester, is secreted in a tonic fashion, as the placenta is not under hypothalamic control (Baumann 1991; Popii and Baumann 2004). It is also a 191-amino acid single-chain protein of 22 kDa, similar to pituitary GH-1, but the sequence differs in 13 residues. A progressive rise in placental GH during pregnancy suppresses and supplants pitu-itary GH by increasing IGF-1 concentration (Popii and Baumann 2004; Ribeiro de Oliveira Longo Schweizer et al. 2018).
19
1.7 Synthesis and physiology of IGF-1
Somatomedin, later termed insulin-like growth factor (IGF), was discovered by Sal-mon and Daughaday in 1957 (Salmon and Daughaday 1957). Since 1977, when the first RIA for IGF-1 was developed, IGF-1 has been used for diagnosis of GH-re-lated disorders (Furlanetto et al. 1977). However, as for GH, the different assays yield different IGF-1 concentrations. Interference of binding proteins is challenging in IGF-1 assays (Clemmons 2011).
IGF-1 is a polypeptide of 70 amino acids and is synthesized mainly (75-85%) in the liver following GH binding to hepatic GH receptors. It is also synthesized in other tissues, such as bone, muscle, and vascular endothelium. IGF-1 exerts its action in an endocrine, autocrine, and paracrine manner. IGF-1 has metabolic and mitogenic functions that regulate cell proliferation (Juul 2003). Exogenous IGF-1 was shown to stimulate growth when administered to hypophysectomized rats (Dehkhoda et al. 2018).
IGF-1 exerts its function by activating the IGF-1 receptor. Insulin-like growth factor binding proteins (IGFBPs), particularly the most abundant binding protein IGFBP-3, modulate this interaction. Under normal conditions, more than 95% of IGF-1 circu-lates as a ternary complex (150 kDa) bound to the acid-labile subunit (ALS) and IG-FBPs, while a smaller part is associated with low-molecular-weight IGFBPs (40-50 kDa). Less than 1% exists in the free (7.6 kDa) form (Juul 2003). IGFBPs extend the half-life of free IGF-1 from 10 to 15 minutes to 30 to 90 minutes in binary complex-es. In the ternary complex, the half-life is approximately 16 hours. The production of IGFBP-3 and ALS is regulated by GH. IGFBP-3 concentration decreases in liver disease and fasting but increases in chronic renal failure. IGFBP-3 concentration changes with age but less strikingly than IGF-1 (Juul 2003).
Although serum IGF-1 concentrations are mainly regulated by GH and insulin, many other factors affect IGF-1 concentrations (Ketelslegers et al. 1995; Duncan and Wass 1999; Juul 2003). In adults with type 1 diabetes and children with newly diagnosed insulin-dependent diabetes, IGF-1 concentrations are lower than in healthy controls. Low IGF-1 concentrations are seen in liver disease, malnutri-tion, anorexia nervosa, and cachexia (Juul 2003; Brabant and Wallaschofski 2007). Those factors may result in false-negative values in patients with acromegaly (Katz-nelson et al. 2014). In anorexia, the IGF-1 concentration is as low as in GHD; however, GH concentrations are elevated (Hall et al. 1999). Although total IGF-1 levels are elevated in renal failure, the free IGF-1 concentrations are decreased due to elevated IGFBPs. Increases in sex steroids may increase IGFBP production leading to an increase in circulating IGF-1 concentrations. Androgens increase IGF-1 production (Jørgensen et al. 2005). In hypothyroidism, IGF-1 concentrations are usually decreased but are normal or elevated in hyperthyroidism. However, age and pubertal development are the most important factors in the regulation of IGF-1 concentrations (Juul 2003).
Many variables that influence GH concentrations (such as diurnal variation, exer-cise, obesity, or acute fluctuations in blood glucose) have minimal or no effect on IGF-1. While IGF-1 concentration remains relatively stable throughout the day and
20
is unaffected by food intake, circulating IGFBP-3 appears to be acutely influenced by food intake (Frystyk et al. 2010). IGF-1 concentrations varied from 10% to 30% between two consecutive tests at a 2-week interval in 41 of 84 volunteers and was >30% in 5 of 84 volunteers; thus a single IGF-1 value should be interpretated with caution. Conflicting results should be confirmed with a new sample (Milani et al. 2004). It has been suggested that an individual change in IGF-1 concentration must exceed 28% to be regarded as significant (Juul 2003).
1.8 Diurnal variation
Serum GH concentrations are very low (<0.1-0.2 µg/L) between pulses and 70% to 80% of GH concentrations over a 24-hour period remained below the detection limit in the majority of older assays, such as RIAs (Giustina and Veldhuis 1998; Duncan and Wass 1999). A GH pulse that reaches 5 to 30 µg/L is released 6 to 10 times over 24 hours approximately every 1 to 3 hours (Giustina and Veldhuis 1998; Sata and Ho 2007). The night-to-day ratio of GH secretion is approximately 4-fold with increases in both pulse frequency and total GH secretion at night (Duncan and Wass 1999). Thus, sleep is an important physiological factor that increases GH re-lease. The highest peak in plasma GH is found during slow-wave sleep, 1 to 2 hours after falling asleep. Contrasting results on diurnal variation of total IGF-1 are most likely caused by a small nocturnal decrease from midnight for 4 hours (Juul 2003).
1.9 Effect of age and gender
GH production increases at puberty and decreases progressively thereafter. Begin-ning from age 20, GH production decreases by approximately 14% in a decade (Rudman et al. 1981; Zadik et al. 1985; Iranmanesh et al. 1991). During puberty, the GH increase is due to the marked rise in gonadal steroid concentrations and is predominantly a reflection of increased GH pulse amplitude (Finkelstein et al. 1972; Martha et al. 1992). The synergy between sex steroids and GH secretion is largely responsible for the adolescent growth spurt (Martha et al. 1992). Sex-steroid depletion at any age after adolescence predicts relative GH deficiency (Ho et al. 1987; Iranmanesh et al. 1991). However, basal (nonpulsatile) GH secretion was not found to be dependent on age among subjects between 20 to 77 years (Roelfsema and Veldhuis 2016). The age-related decline in the activity of the somatotropic axis (GHRH, ghrelin, GH, and IGF-1) and an increase in somatostatin release has been termed “somatopause” (Giustina and Veldhuis 1998).
During the first trimester, IGF-1 acts as an intrauterine growth promoter, which during this period is GH independent. From birth to 6 months of age, the IGF-1 concentration decreases and then increases in response to GH. Between 1 and 17 years of age, IGF-1 concentrations are significantly higher in girls than in boys, although discordant results have been reported (Juul 2003; Bidlingmaier 2014). An IGF-1 peak is approximately 1 year earlier in girls than in boys (14.5 vs. 15.5 years) (Juul 2003). In studies with adults, no significant gender difference has been ob-served (Fisker et al. 1999; Hilding et al. 1999; Juul 2003; Massart and Poirier 2006; Granada et al. 2008) while in other studies a significant gender difference has been found (Gomez et al. 2003; Vierhapper et al. 2003; Arafat et al. 2008). In the study of Roelfsema, IGF-1 levels in the whole group (n=130) showed no gender difference,

21
but beyond the age of 50 years, women had lower IGF-1 concentrations than men. Postmenopausal women had lower oestradiol levels than premenopausal women, but in men of the same age no decrease in serum testosterone concentrations was observed (Roelfsema and Veldhuis 2016).
In 1965, Frantz et al. demonstrated that the sex difference in GH concentration is associated with higher oestrogen concentrations in women. However, morning GH levels did not differ between men and women if the sample was taken before the subjects arose from bed, but after 1 to 3 hours of being awake the concentration was approximately 6-fold higher in women than in men (Frantz and Rabkin 1965). The late follicular phase concentrations of oestradiol may enhance circulating GH via an amplitude-modulated rather than a frequency-modulated effect on the en-dogenous GH pulse (Faria et al. 1992). The mean 24-hour serum GH concentration is 2 to 3 times higher in premenopausal women than in men of the same age with equivalent IGF-1 concentrations. However, this GH concentration difference is no longer present after 50 years and IGF-1 concentrations were lower in women than in men of a similar age (van den Berg et al. 1996; Roelfsema and Veldhuis 2016). Oestradiol has an amplifying action on the neuroendocrine regulation of pulsatile GH release (Ho et al. 1987). GH responsiveness to provocative stimuli is incre-ased after administration of oestrogens and also androgens (Shalet et al. 1998). Oestrogen likely stimulates GH release via effects on hypothalamic somatostatin and GHRH secretion (Hartman et al. 1993). Androgens, which can be aromatized to oestrogens, may also play an important role in the increase in GH and IGF-1 secretion (Juul 2003).
Females with untreated GHD have lower IGF-1 concentrations than men and re-quire higher GH doses to achieve the same IGF-1 response as males. Use of oral oestrogens decreases hepatic IGF-1 production and this increases serum GH in postmenopausal females, whereas transdermal oestradiol exerts a far smaller effect on GH or IGF-1 (Friend et al. 1996; Jørgensen et al. 2005). Thus, it is not possible to use low IGF-1 to diagnose GHD in women taking oral oestrogen preparations.
1.10 Effect of weight
Intra-abdominal fat mass, rather than overall obesity, is an important negative pre-dictor of peak and mean 24-hour serum GH concentrations (Parker et al. 1967; Vahl et al. 1997; Clasey et al. 2001). Abdominal fat correlates with decreased GH levels, even in individuals with normal BMI (Vahl et al. 1997). Roelfsema et al. found that the impact of BMI was 3.5-fold greater than that of age on total 24-hour GH secre-tion, but the nonpulsatile basal GH secretion was only weakly dependent on BMI (Roelfsema and Veldhuis 2016). Iranmanesh et al. observed that daily GH secretion decreases by 6% for each unit increase in BMI (Iranmanesh et al. 1991).
Obese subjects show attenuated GH responses to most stimuli, including sleep, physical exercise, insulin-induced hypoglycaemia, and GHRH (Williams et al. 1984; Kopelman et al. 1985; Scacchi et al. 1999; Biller et al. 2002). The pathogene-sis of GH suppression in obesity has been not established (Bonert et al. 2004; Roelf-sema and Veldhuis 2016). A dual effect of obesity is suggested, thus the decreased GH concentration in obese subjects is related to a diminished GH burst frequency and an increased clearance of GH (Veldhuis et al. 1991). Obesity increases soma-
22
tostatin secretion and causes a decrease in GHRH release (Veldhuis et al. 1991). Significant weight loss in obese subjects normalized the reduced GH response to GHRH. GH substitution in GH-deficient adults also normalizes body composition (Williams et al. 1984; Rasmussen et al. 1995).
Fasting hyperinsulinemia, high FFA concentrations, and decreased plasma ghrelin levels are associated with obesity and reduced GH secretion (Shalet et al. 1998; Scacchi et al. 1999; Roelfsema and Veldhuis 2016). It has been reported that FFA reduction enhanced the GH response to a variety of GH secretagogues but did not increase spontaneous GH secretion in obese individuals (Shalet et al. 1998). Hyperinsulinemia increases the availability of GH receptors in the liver and thus stimulates IGF-1 synthesis, but a decreased binding of IGF-1 to its receptor has been reported in obesity. Insulin may indirectly influence GH secretion by inhibition of IGFBP-1 and, to a lesser degree, of IGFBP-2 synthesis and hence by increasing the levels of free plasma IGF-1, which negatively feedback on GH secretion (Scacchi et al. 1999). Although the influence of BMI on serum concentrations of IGF-1 is not unequivocal, it is known that serum IGF-1 concentration starts to decrease at a high BMI (>32.5 kg/m2) and also at low BMI (<22.5-20 kg/m2) (Frystyk et al. 2010; Bidlingmaier et al. 2014). Thus, the association of BMI with IGF-1 should be consi-dered when titrating therapy in acromegaly and GH deficiency patients (Schneider et al. 2006).
Figure 1. Regulation of GH secretion. A bold black arrow indicates stimulation, a thin black arrow inhibition and a grey arrow indicates effects.
IGF-1
GH
GHRH Somatostatin
Ghrelin
Ghrelin
Growth andmetabolism
Growth andmetabolism
FFALeptin
IGF-1UndernutritionAcute illnessChronic illnessGH receptor deficiency(e.g. po. estrogen)GHR antibodies
GHDeep sleepExerciseStress (e.g. trauma,sepsis,hypovolemia)
AcetylcholineClonidineLevodopa
Acute glucocorticoidadministrationADHGlucagonGonadal steroidsNorepinephrine
Gut-brain peptides:cholecystokinin,VIP, motilin, neurotensin
HypoglycemiaPoorly controlled diabetes (chronic hyperglycemia)
High-proteinmeals and some amino acids (e.g. arginine)
FastingChronic malnutritionAnorexia nervosa
Chronic renal failureLiver disease
GH High FFAObesity (visceral)Hyperglycemia (acute)Glucocorticoids (chronic, e.g. Cushing disease)HypothyroidismChronic illness
23
2. Growth hormone measurement
2.1 Assay type and antibodies
The first radioimmunoassay for hGH was introduced by Glick in 1963 (Glick et al. 1963). The first assays were competitive RIAs, which used radiolabelled GH that competes with unlabelled GH for binding to a polyclonal antiserum that recognizes several epitopes. Monoclonal antibodies directed against a single epitope on the surface of the antigen were introduced later. The spectrum of GH isoforms detec-ted by polyclonal antibodies is quite broad, whereas the assays with monoclonal antibodies may detect only one or a limited number of GH isoforms (Bidlingmaier and Freda 2010).
Since the 1990s, immunometric assays or sandwich assays with monoclonal an-tibodies have become routinely used in GH assays. Initially, the between-method variation was smaller with competitive RIAs with polyclonal antibodies than with immunometric assays with monoclonal antibodies (Reiter et al. 1988). In the UK National External Quality Assessment (UKNEQAS), a between-method variation in-creased from 17% to approximately 30% between 1994 and 1998 with increasing use of assays based on monoclonal antibodies (Seth et al. 1999). This was mainly caused by the better sensitivity of immunometric assays that facilitate accurate de-termination of GH concentrations below the detection limit of RIA methods.
Immunometric assays (also known as non-competitive sandwich assays) use an excess of antibodies that are directed against different epitopes on GH. Methods using two monoclonal antibodies usually show negligible recognition of 20-kDa GH while the combination of monoclonal/polyclonal or polyclonal/polyclonal as-say formats may show higher reactivity to 20-kDa GH (Wood 2001). Assays using monoclonal antibodies against the 22-kDa form usually give lower results than tho-se based on polyclonal antibodies, which measure different forms of GH (Jansson et al. 1997).
The choice of antibodies and assay type (assay design) affects the sensitivity of im-munoassays. The ideal assay should use antibodies with high affinity and specificity (Popii and Baumann 2004; Clemmons 2011). Traditional polyclonal RIAs had a detection limit of approximately 0.3 to 1.0 µg/L (Popii and Baumann 2004; Bid-lingmaier and Freda 2010). Sandwich-type radioimmunoassays (IRMA) have a sen-sitivity of approximately 0.2 µg/L. Later, development of more sensitive immuno-chemiluminometric (ICMA), immunofluorometric (IFMA), and enzyme-linked immunosorbent assay (ELISA) assays improved detection limits to approximately 0.01 - 0.05 µg/L (Freda et al. 1998, Biller et al. 2002, Ronchi et al. 2005). Ultrasen-sitive assays have a detection limit of 0.001 to 0.002 µg/L (Chapman et al. 1994; Bidlingmaier and Freda 2010). Previously undetectable levels can be quantified with these assays. According to the consensus statement of 2011, GH assays with a lower limit of quantitation of 0.05 µg/L with a coefficient of variation (CV) of <20% are recommended (Clemmons 2011). Measurement of GH is challenging because of several factors that must be considered (Table 2).
24
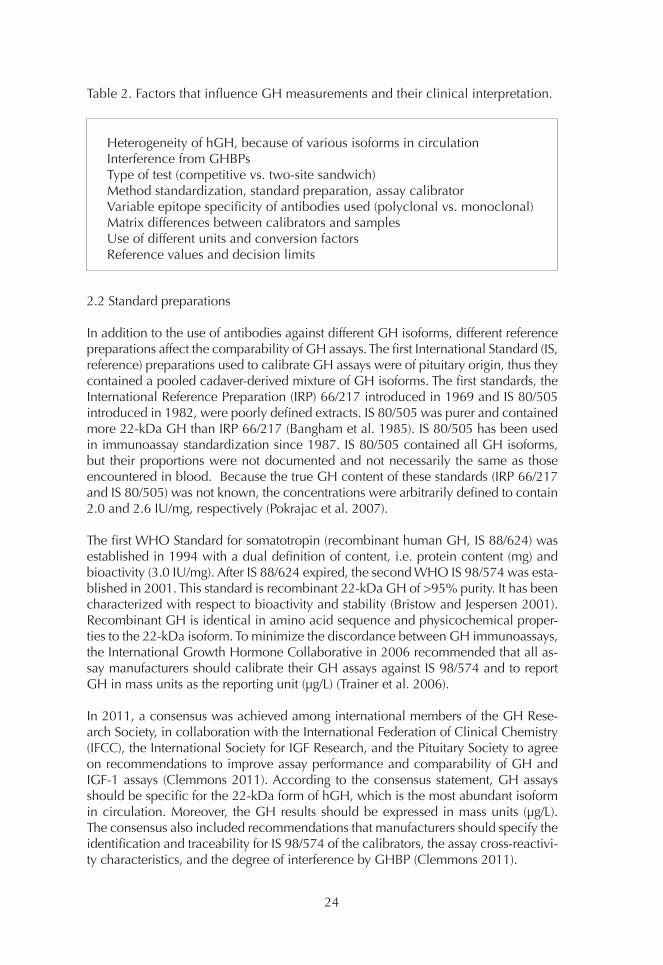
Table 2. Factors that influence GH measurements and their clinical interpretation.
2.2 Standard preparations
In addition to the use of antibodies against different GH isoforms, different reference preparations affect the comparability of GH assays. The first International Standard (IS, reference) preparations used to calibrate GH assays were of pituitary origin, thus they contained a pooled cadaver-derived mixture of GH isoforms. The first standards, the International Reference Preparation (IRP) 66/217 introduced in 1969 and IS 80/505 introduced in 1982, were poorly defined extracts. IS 80/505 was purer and contained more 22-kDa GH than IRP 66/217 (Bangham et al. 1985). IS 80/505 has been used in immunoassay standardization since 1987. IS 80/505 contained all GH isoforms, but their proportions were not documented and not necessarily the same as those encountered in blood. Because the true GH content of these standards (IRP 66/217 and IS 80/505) was not known, the concentrations were arbitrarily defined to contain 2.0 and 2.6 IU/mg, respectively (Pokrajac et al. 2007).
The first WHO Standard for somatotropin (recombinant human GH, IS 88/624) was established in 1994 with a dual definition of content, i.e. protein content (mg) and bioactivity (3.0 IU/mg). After IS 88/624 expired, the second WHO IS 98/574 was esta-blished in 2001. This standard is recombinant 22-kDa GH of >95% purity. It has been characterized with respect to bioactivity and stability (Bristow and Jespersen 2001). Recombinant GH is identical in amino acid sequence and physicochemical proper-ties to the 22-kDa isoform. To minimize the discordance between GH immunoassays, the International Growth Hormone Collaborative in 2006 recommended that all as-say manufacturers should calibrate their GH assays against IS 98/574 and to report GH in mass units as the reporting unit (µg/L) (Trainer et al. 2006).
In 2011, a consensus was achieved among international members of the GH Rese-arch Society, in collaboration with the International Federation of Clinical Chemistry (IFCC), the International Society for IGF Research, and the Pituitary Society to agree on recommendations to improve assay performance and comparability of GH and IGF-1 assays (Clemmons 2011). According to the consensus statement, GH assays should be specific for the 22-kDa form of hGH, which is the most abundant isoform in circulation. Moreover, the GH results should be expressed in mass units (µg/L). The consensus also included recommendations that manufacturers should specify the identification and traceability for IS 98/574 of the calibrators, the assay cross-reactivi-ty characteristics, and the degree of interference by GHBP (Clemmons 2011).
Heterogeneity of hGH, because of various isoforms in circulationInterference from GHBPsType of test (competitive vs. two-site sandwich)Method standardization, standard preparation, assay calibratorVariable epitope specificity of antibodies used (polyclonal vs. monoclonal)Matrix differences between calibrators and samplesUse of different units and conversion factorsReference values and decision limits
25
Use of the recombinant reference preparation IS 88/624 (22 kDa) in Japan has led to a significant reduction (from 35% to 18%) in between-laboratory variability in GH assay results. All GH kits in Japan began use of the same recombinant human stan-dard from April 2005. Since then, the diagnostic GH cut-off peak for children with GH deficiency changed from 10 µg/L to 6 µg/L (Tanaka et al. 2005). Later, Müller et al. calculated a CV of 17.3% among methods calibrated against IS 98/574 (Müller et al. 2011). The use of recombinant 22-kDa standard instead of pituitary-derived standard yields lower GH results (Meazza et al. 2012; Chaler et al. 2013).
2.3 GHBPs and other confounding factors
The effect of GHBPs on GH measurement depends on the affinity of the antibodies and the time allowed for incubation (Ebdrup et al. 1999). High-affinity GHBP com-petes with antibodies for binding to GH. The affinity of antibodies is usually at least 2 orders of magnitude higher than that of high-affinity GHBP and 4 to 5 orders of mag-nitude higher than low-affinity GHBP (Jan et al. 1991). During the assay, GH-GHBP complexes should dissociate and GH should be transferred to the antibody. Many polyclonal antibodies have higher avidity for the antigen than monoclonal antibodi-es, which reduces the effect of GHBP interference. In the past, long incubation times were used, minimizing the effect of GHBP. However, newer assays are more sensitive to interference by GHBP due to the use of nonequilibrium assay conditions. The large antibody excess used in sandwich assays reduces the interference (Fisker et al. 1998a; Ebdrup et al. 1999).
Depending on the assay used, the proportion of GHBP-bound GH declines at GH concentrations above 10 to 30 µg/L (Baumann 1991; Hansen et al. 2002). The degree of interference by GHBP within its physiological range should be evaluated for each assay method (Hansen et al. 2002). Thus, samples should be spiked with physiologi-cal concentrations of recombinant GHBP (0.2-2 nmol/L) and incubated for at least 12 hours to allow formation of the GH-GHBP-complexes before measurement (Popii and Baumann 2004). In obese patients, inherently higher GHBP concentrations may contribute to erroneously low GH concentrations (Hansen et al. 2002).
The matrix used in the calibrators should be as similar as possible to those in nonpat-hological human serum. However, different manufacturers may use different matrices in the calibrators, which can lead to different GH results (Bidlingmaier and Freda 2010).
Pegvisomant, a GH competitive receptor antagonist, is a modified form of GH. Peg-visomant is used for treatment of acromegaly and circulates at concentrations up to 1000- fold greater than that of endogenous GH. Pegvisomant has a 30-fold greater affinity for GHBP than for GHR (Paisley et al. 2007). Manolopoulou demonstrated that pegvisomant can cause overestimation of GH results with the Liaison assay and negative interference in the Immulite assay, but there was no interference in the iSYS assay using monoclonal antibodies (which do not recognize pegvisomant). In the Im-mulite assay, pegvisomant is most likely recognized by only one of the antibodies and this displaces endogenous GH and prevents sandwich formation. The IDS-iSYS (IDS, Immunodiagnostic Systems) assay is specific for the 22-kDa GH isoform and is thus
26
not affected by GH analogues or GH binding proteins (Manolopoulou et al. 2012). In general, only IGF-1 is measured with pegvisomant treatment.
2.4 GH measurement in clinical practice
Immunoassays do not measure the biological activity of GH but the immunoreacti-vity of protein epitopes that may or may not be linked to bioactivity. In plasma, GH exists in many molecular forms with varying bioactivity. Twenty years ago, a two-site immunofunctional assay was developed to measure the bioactivity of GH. The im-munofunctional assay recognized only about 73% of circulating GH isoforms when a recombinant 22-kDa form was used as the standard. However, it was not known whether unrecognized GH isoforms have biological activity (Strasburger 1998; Popii and Baumann 2004). It was problematic to develop assays for different isoforms. Thus, a non-22-kDa GH assay was developed, in which the 22-kDa form was first extracted from serum with a specific anti-22-kDa antibody and the remaining GH isoforms were measured by a polyclonal IRMA (Boguszewski et al. 1996). Later, mo-noclonal antibodies facilitated development of an assay for 20-kDa GH (Hashimoto et al. 1998). However, these assays are not in routine use.
GH can also be measured from overnight urine, but this method is neither sufficiently sensitive nor sufficiently specific for diagnosis of GHD in patients >60 years (Bates et al. 1995). The diagnostic value of urinary GH is poor due to large intra-individual variation in normal children (Léger et al. 1995). Frequent (every 5-20 minutes) blood sampling over a 24-hour period is impractical and expensive. Thus, measuring the concentration of serum GH during dynamic tests is considered the basis for diagnosis of GH-related diseases (Molitch et al. 2011; Katznelson et al. 2014).
2.4.1 GH measurement in acromegaly
In the 1980s, a GH level of 5 µg/L (10 mU/L) measured with polyclonal RIAs in ran-dom postoperative samples was considered a criterium of remission after surgical treatment of acromegaly (Bates et al. 1993; Wass 1993). However, it is not clear on what basis that value was chosen (Bates et al. 1993). Bates et al. demonstrated that a reduction of average GH concentrations <2.5 µg/L (5 mU/L) improved the long-term prognosis and reduced mortality to that of the general population (Bates et al. 1993). GH concentrations <2.5 µg/L (5 mU/L) from multiple sampling through the day or a nadir GH in the OGT test were usually associated with a normal IGF-1 concentra-tion (Wass 1993). With more sensitive GH assays, decision limits for GH have been lowered.
In the 1980s, the biochemical confirmation of acromegaly was made based on the OGTT. In healthy adults, the serum GH concentration after ingestion of 100 g glucose should be suppressed to less than 5 µg/L or 2.5 µg/L. According to guidelines from 1994 and 1998, the GH nadir during the OGTT <2 µg/L when measured by a po-lyclonal RIA in combination with normal IGF-1 concentrations indicated successful treatment (Acromegaly Therapy Consensus Development Panel 1994; Melmed et al. 1998). In the 1998 consensus, using sensitive sandwich GH assays, the serum GH should be suppressed to <1 µg/L (Melmed et al. 1998).

27
In 2000, an international consensus group (Cortina consensus) suggested a two-step strategy for diagnosis of acromegaly (Giustina et al. 2000). In the first step, a diagnosis of acromegaly was excluded if the patient had a random GH level of <0.4 µg/L with an IGF-1 concentration within the age- and gender-matched reference range and has no other intercurrent illness. If acromegaly was not excluded in the first step, an OGTT (75 g oral glucose) using a nadir GH of 1 µg/L as cut-off should be performed (Giustina et al. 2000). Definition of cure was based on the OGTT and serum IGF-1. The consensus pointed out that using commercial assays, a GH value <1 µg/L sepa-rated normal subjects from those with acromegaly. The sensitivity of the GH assay should be at least 0.5 µg/L (Giustina et al. 2000). The consensus statement of The Growth Hormone Research Society and The Pituitary Society from 2004 established that the sensitivity limit of the GH assay should be <0.1 µg/L (Growth Hormone Re-search Society and Pituitary Society 2004).
However, already in the 1990s, some authors that used highly sensitive assays pro-posed lowering the cut-off for nadir GH from 1 µg/L to from 0.14 to 0.71 µg/L in the OGTT to define diagnosis and cure of acromegaly (Hattori et al. 1990; Chapman et al. 1994; Freda et al. 1998). In 2002, Trainer recommended random GH and IGF-1 measurements, and acromegaly would be excluded if both GH was <0.3 µg/L and IGF-1 was normal. However, if either test was abnormal, the patient should proceed to have a 75-g OGTT and repeat IGF-1 measurement. Active acromegaly would be excluded if both the nadir GH is <0.3 µg/L and IGF-1 is normal (Trainer 2002). In 2005, the consensus statement of the Acromegaly Consensus Group suggested a na-dir of 0.4 µg/L for complete control of acromegaly (Melmed et al. 2005). Some studies were in agreement (Gullu et al. 2004; Serri et al. 2004), while other studies did not provide better discrimination with a nadir GH of 0.3 to 1 µg/L (Costa et al. 2002; Ronchi et al. 2005). In the early 2000s, some less sensitive radioimmunometric assays (sensitivity 0.15 µg/L) were used (Grottoli et al. 2003). Along with improvement of GH assay sensitivity (to 0.05 µg/L) and better specificity, the nadir GH during OGTT used for diagnosis and monitoring of acromegaly decreased to 0.3 to 1.0 µg/L (Bid-lingmaier and Freda 2010; Clemmons 2011).
2.4.2 GH measurement in growth hormone deficiency
Until 1994, a rise of GH in the ITT >10 µg/L was a normal response, between 5 to 10 µg/L was slightly abnormal, and <5 µg/L was considered an abnormal response (Fish et al. 1986). In 1994, Hoffman et al. demonstrated that the maximal GH response to insulin hypoglycaemia was ≤3 µg/L in severe GHD and the normal response was at least 5 µg/L using a polyclonal RIA (Hoffman et al. 1994). In 1994, a GH concentra-tion of 3 µg/L with polyclonal antibody-based RIAs was used as a cut-off for treatment of GHD (Growth Hormone Research Society 1998). This cut-off is still used in clinical practice, although the sensitivity of GH assays has been improved and the GH levels measured by current assays are lower than 20 years ago.
2.4.3 GH sampling and storage
GH in serum is stable and concentrations of 22-kDa GH measured by an immunoas-say did not change over a period of more than 10 years when the samples were stored at -80°C (Wagner et al. 2014). Some assay manufacturers do not recommend

28
the use of EDTA plasma in GH assays because results tend to be higher than those in serum (Bidlingmaier and Freda 2010). The stability in blood is such that separation of serum from blood cells is recommended within 2 hours of sample collection. The GH concentration in serum remains stable for at least 24 hours at room temperature, for longer times at 4°C, and for several weeks at -20°C (Evans et al. 2001; Bidlingmaier and Freda 2010; Clemmons 2011). Thus, sample handling is not a concern when interpreting GH results.
3. Acromegaly
3.1 Aetiology
In over 95% of cases, acromegaly is due to a pituitary GH-producing sporadic ade-noma (somatotropinoma), of which most are benign. Approximately 30% of patients are also hyperprolactinaemic, either due to loss of inhibition of prolactin secretion due to pituitary stalk compression or co-secretion by the adenoma. A hypothalamic GHRH-secreting tumour or ectopic GH or GHRH secretion by a carcinoid tumour in the pancreas or lung are rare causes of excess GH secretion. Acromegaly is also asso-ciated with familial syndromes, such as multiple endocrine neoplasia type 1 (MEN1) syndrome or an aryl hydrocarbon receptor-interacting protein (AIP)-gene mutation (Melmed 2009; Katznelson et al. 2014).
Recent studies have revealed a higher prevalence and incidence of acromegaly than previously shown (Mestron et al. 2004; Agustsson et al. 2015; Hoskuldsdottir et al. 2015; Burton et al. 2016). Depending on geographical area, the prevalence and an-nual incidence varies between 28 and 137 and 2 to 11 cases per million, respecti-vely (Lavrentaki et al. 2017). In 2013, there were 600 to 700 acromegalic patients in Finland and the annual incidence of the disease is approximately 20 new cases (Kauppinen-Mäkelin, Finnish Endocrine Society, https://endo.fi).
The average age at diagnosis is 40 to 50 years (Ezzat et al. 1994; Lavrentaki et al. 2017; Maione and Chanson 2019). In 1994, Ezzat et al. reported an equal distribution in men and women (Ezzat et al. 1994). However, a recently published study of national acromegaly registries revealed that women are affected slightly more frequently than men (mean ratio F/M=1.24). At the time of diagnosis, most (67-84%) GH-producing tumours are macroadenomas (>1 cm) (Maione and Chanson 2019).
3.2 Clinical findings
GH hypersecretion that occurs before the epiphyses have fused results in excess line-ar bone growth and gigantism. The clinical presentation of acromegaly can be divi-ded into those due to compression effects of an expanding pituitary mass (headaches, visual field defect, hypopituitarism) and those due to prolonged excess GH and IGF-1 secretion, which causes a wide range of metabolic, endocrine, cardiovascular, and respiratory diseases (Colao et al. 2004; Melmed et al. 2009).
Acromegaly is currently diagnosed earlier than previously. However, due to its slow progression, acromegaly is typically diagnosed 5 to 14 years after the appearance of initial symptoms (Melmed 2009; Maione and Chanson 2019). The initial symptoms

29
are nonspecific and include e.g. tiredness, headache, joint pain, and increased swea-ting. The most typical clinical signs are coarse facial features and wide hands and feet due to soft tissue swelling and bone enlargement. The most significant functional disability is arthropathy. Symptomatic carpal tunnel syndrome affects up to 60% of patients (Colao et al. 2004). Organ overgrowth as goitre and cardiomyopathy is com-mon. Hypertension occurs in 33% to 46% of patients. Macroglossia and swelling of nasopharyngeal tissues are important causes of sleep apnoea. High concentrations of GH are diabetogenic and this effect is independent of IGF-1; thus disorders of glucose metabolism are frequently seen in acromegaly patients. Prolonged excess GH can lead to pancreatic beta-cell failure and diabetes. GH excess also affects lipid metabo-lism, causing hypertriglyceridemia (Katznelson et al. 2014).
If not treated appropriately, acromegaly is associated with increased mortality (Wright et al. 1970; Bates et al. 1993; Holdaway et al. 2004; Kauppinen-Mäkelin et al. 2005; Dekkers et al. 2008; Sherlock et al. 2010; Arosio et al. 2012). Currently, when trans-sphenoidal surgery is the primary treatment and the medical treatment and strictly defined cure criteria are used, the mean standardized mortality ratio (SMR) has dimi-nished from 1.2-3.5 to 1.1-1.9 (Alexander et al. 1980; Giustina et al. 2000; Kauppi-nen-Mäkelin et al. 2005; Dekkers et al. 2008; Esposito et al. 2018). In 2014, Mercado et al. reported that in a retrospective study of 442 patients, the most common cause of death was cancer. Patients treated with radiation did not have an increased risk of death (Mercado et al. 2014). In other long-term follow-up studies, there has been a shift from cardiovascular disease to cancer as the cause of death (Ritvonen et al. 2016; Maione and Chanson 2019). The evidence is strongest for an increased risk of colorectal cancer in patients with acromegaly (Katznelson et al. 2014).
3.3 Laboratory diagnosis
According to an Endocrine Society Clinical Practice Guideline from 2014, measure-ment of serum IGF-1 is recommended in patients with typical clinical manifestations of acromegaly, particularly those with acral and facial features and in patients with a pituitary mass (Katznelson et al. 2014). Serum IGF-1 concentrations are more strongly correlated with the manifestations of acromegaly than GH concentrations. Although serum IGF-1 correlates linearly with serum GH concentrations up to approximately 20 µg/L, at higher GH concentrations serum IGF-1 reaches a plateau (Clemmons et al. 1979; Dobrashian et al. 1993; Ho and Weissberger 1994) and with newer assays the limit may be lower. Measurement of IGF-1 is also recommended in patients without typical manifestations of acromegaly who have several associated diseases or symp-toms, including sleep apnoea, type 2 diabetes mellitus, debilitating arthritis, carpal tunnel syndrome, hypertension, and hyperhidrosis (Katznelson et al. 2014).
In patients with equivocal serum IGF-1 concentrations or concentrations above the age-specific reference range, acromegaly is confirmed by showing the absence of GH suppression during an oral glucose load with a documented hyperglycaemia (Katz-nelson et al. 2014). Kalavalapalli et al. reported that some patients with a normal se-rum IGF-1 concentration at the time of pituitary surgery can have a high serum IGF-1 and GH concentration postoperatively. In that study, it was pointed out that clinically silent somatotroph adenoma can be missed without the OGTT. Oral contraceptive pills or hormone replacement treatment may have resulted in the lowering of measu-
30
red serum IGF-1 (Kalavalapalli et al. 2007).
The OGTT evaluates neuroregulation of GH secretion. In a 2014 guideline, a cut-off of GH <1 µg/L (2 mU/L) was considered sufficient to exclude diagnosis of acromega-ly, as not all assays have sufficient accuracy to measure GH levels <1 µg/L (Katznelson et al. 2014). It is notable that the earlier consensus of the American Association of Clinical Endocrinologists in 2011 recommended that a nadir serum GH <0.4 µg/L during OGTT excludes the diagnosis of acromegaly (Katznelson et al. 2011).
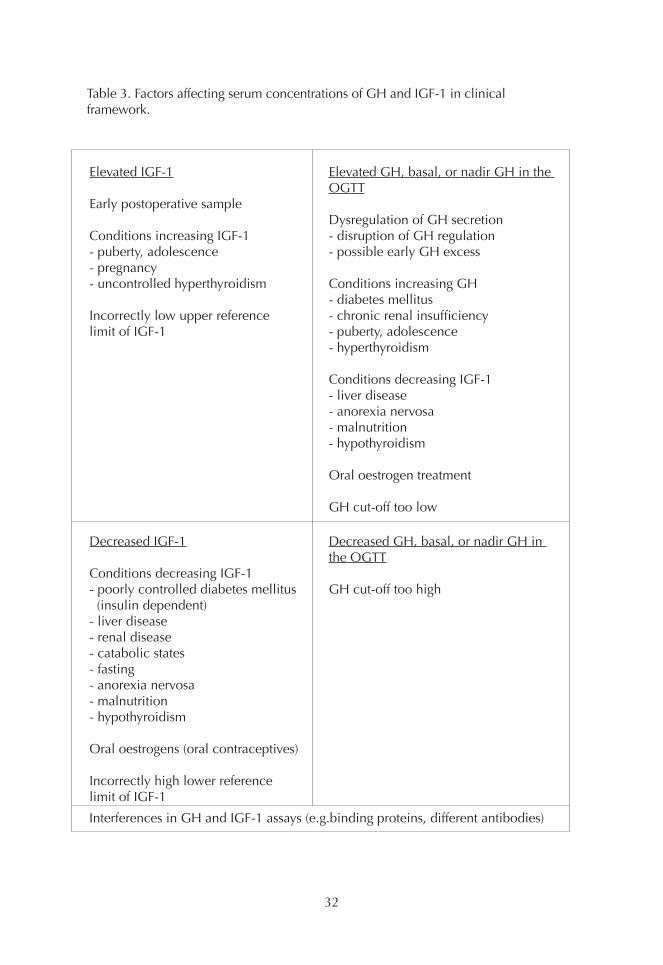
The OGTT is performed after an overnight fast. The mechanism of GH suppression is not fully understood, but a glucose-mediated increase in hypothalamic somatostatin has been suggested. Oral glucose suppresses GH release 1 to 2 hours after ingestion. Blood samples for measurement of GH and glucose are taken before administration of 75 g of glucose and then every 30 minutes over 2 hours (Giustina et al. 2010; Katz-nelson et al. 2014). Glucose fails to suppress GH secretion in acromegaly patients and GH secretion even rises in up to 20% to 30% of patients with acromegaly (Mel-med and Fagin 1987; Duncan and Wass 1999). While OGTT is safe and inexpensive, there are conditions that may lead to a false-positive GH response in the OGTT, such as stress, Laron-type dwarfism, and low serum IGF-1. Some factors (Table 3) affect GH by increasing or decreasing IGF-1 (Melmed and Fagin 1987, Freda 2009). The OGTT is unreliable in diabetes mellitus, in which loss of normal GH suppression is possible (Melmed et al. 2005). In these conditions, measurement of IGF-1 is a useful indicator of GH excess.
According to the consensus statement of 2010, a random GH level <1 µg/L (2 mU/L) and a normal age- and sex-matched IGF-1 concentration excludes active acromegaly (Giustina et al. 2010). The 2014 guideline recommends against relying on the use of random GH levels to diagnose acromegaly (Katznelson et al. 2014). Due to pulsatile GH secretion, a random or 24-hour mean GH concentration in serum can be simi-lar in control subjects and acromegaly patients, although acromegaly patients have elevated IGF-1 concentrations (Clemmons et al. 1979; Ho and Weissberger 1994; Dimaraki et al. 2002; Gullu et al. 2004).
Other dynamic tests (TRH, GnRH) offer no advantage over the OGTT. No other tests (free IGF-1, IGFBP-3, ALS) are of diagnostic value (Giustina et al. 2000; Giustina et al. 2010). Freda et al. observed that 32% of the subjects with active acromegaly had IGFBP-3 concentrations within the normal range despite elevated IGF-1 concentra-tions and inadequate GH suppression in the OGTT (Freda et al. 1998). Later, other studies confirmed that IGFBP-3 concentrations can overlap normal levels in many acromegalic patients (Marzullo et al. 2001). Some patients have an increase in their GH concentrations after stimulation with TRH, GnRH, or both. It has been shown that only approximately 50-80% of patients have a positive GH response after TRH admi-nistration (Melmed and Fagin 1987; Duncan and Wass 1999). Following biochemi-cal diagnosis, magnetic resonance imaging (MRI) should be performed. A computed tomography scan should be performed when MRI is contraindicated or unavailable (Katznelson et al. 2014).
3.4 Treatment and laboratory follow up
The main aims of acromegaly treatment are to remove or shrink the pituitary tumour mass, normalize GH and IGF-1 concentrations, and maintain (substitution therapy)

31
pituitary function, all of which improve quality of life and reduce morbidity and mor-tality associated with GH and IGF-1 excess (Holdaway et al. 2004; Dekkers et al. 2008; Melmed et al. 2009; Katznelson et al. 2014). In addition to surgery, medical treatment and radiotherapy are used (Holdaway et al. 2004; Katznelson et al. 2014).
Medical treatment is recommended in patients with persistent disease following transsphenoidal surgery and as a primary therapy if surgery is contraindicated (Mel-med et al. 2018). The medical therapies are receptor-based and directed at the pitu-itary adenoma. These include somatostatin receptor ligands or agonists (octreotide, lanreotide, and pasireotide) and dopamine agonists (bromocriptine, cabergoline). The third option is directed at blocking GH effects in the periphery using the GH receptor antagonist pegvisomant (Melmed et al. 2018). Stereotactic radiotherapy is used in the setting of residual tumour mass following surgery if medical therapy is unavailable, unsuccessful, or not tolerated. After radiotherapy, the full effect may take 5 to 10 years to achieve. In more than 50% of patients, hypopituitarism may also develop within that time (Katznelson et al. 2014).
The optimal test and cut-off values that confirm the return of normal GH secretion are debated. It is apparent that normal GH or IGF-1 concentrations alone may miss cases of active acromegaly (Dimaraki et al. 2002; Freda et al. 2004). The 2014 guideline suggests measurement of IGF-1 and a random GH at 12 weeks or later following surgery. The same GH and IGF-1 assays should be maintained in the same patient during follow up. An age-normalized serum IGF-1 concentration and undetectable basal GH value are sufficient to indicate surgical remission. Measurement of nadir GH during OGTT in patients with a random GH >1 µg/L is recommended (Katznel-son et al. 2014).
In a consensus statement from 2018, a nadir GH <0.4 µg/L during OGTT using ultra-sensitive GH assays along with a normal IGF-1 concentration was considered eviden-ce of normal GH secretion (Melmed et al. 2018). Nadir GH can be normalized in a week while normalization of IGF-1 takes 3 to 12 months (Growth Hormone Research Society and Pituitary Society 2004; Feelders et al. 2005; Melmed et al. 2005; Freda 2009). Kim et al. observed that normalization of IGF-1 concentration was achieved one week postoperatively in only 28 of 153 patients (18.3%) in the remission group. However, the nadir GH concentration at the 1-week postoperative OGTT was as low as 0.55±0.05 µg/L in the remission group and 8.53±2.53 µg/L in the non-remission group (Kim et al. 2012). According to the 2014 guideline, serum GH <0.14 µg/L sug-gested “surgical remission” and a level <1 µg/L indicated “control” and normalization of the mortality risk (Katznelson et al. 2014). Although GH measurement may be performed as early as on the first postoperative day (Krieger et al. 2003), an elevated value may reflect surgical stress (Katznelson et al. 2014). Preoperative treatment with long-acting somatostatin analogues may suppress GH for up to 4 months (Melmed et al. 2005). GH measurement is not informative in patients receiving pegvisomant, because GH concentration remains elevated (Melmed et al. 2018).
If the operation is performed by an experienced neurosurgeon, normalization of IGF-1 can be expected in 75% to 95% of patients with a microadenoma and in 40% to 68% with non-invasive macroadenomas (Melmed et al. 2009). Patients with normal IGF-1 and abnormal GH responses to glucose do not need to be treated, but they require closer follow up to detect disease recurrence (Freda 2009).
32
Table 3. Factors affecting serum concentrations of GH and IGF-1 in clinicalframework.
Elevated GH, basal, or nadir GH in the OGTT
Dysregulation of GH secretion- disruption of GH regulation- possible early GH excess
Conditions increasing GH- diabetes mellitus- chronic renal insufficiency- puberty, adolescence- hyperthyroidism
Conditions decreasing IGF-1- liver disease- anorexia nervosa- malnutrition- hypothyroidism
Oral oestrogen treatment
GH cut-off too low
Elevated IGF-1
Early postoperative sample
Conditions increasing IGF-1- puberty, adolescence- pregnancy- uncontrolled hyperthyroidism
Incorrectly low upper referencelimit of IGF-1
Interferences in GH and IGF-1 assays (e.g.binding proteins, different antibodies)
Decreased GH, basal, or nadir GH in the OGTT
GH cut-off too high
Decreased IGF-1
Conditions decreasing IGF-1- poorly controlled diabetes mellitus (insulin dependent)- liver disease- renal disease- catabolic states- fasting- anorexia nervosa- malnutrition- hypothyroidism
Oral oestrogens (oral contraceptives)
Incorrectly high lower referencelimit of IGF-1

33
4. Growth hormone deficiency
4.1 Aetiology
The clinical features of GHD in adults were recognized 30 years ago and the first placebo-controlled studies demonstrated the benefits of GH treatment (Jørgensen et al. 1989; Salomon et al. 1989). GHD has been reported to affect 2 to 4 per 100 000 people per year. The prevalence of hypopituitarism is estimated to be 290 to 455 per million. Most of the patients with hypopituitarism have GHD (Regal et al. 2001; Stochholm et al. 2006). GH deficiency in adulthood may have onset during childhood or later in life. Idiopathic GH deficiency is the most common cause of GHD in children. There may be structural (e.g. empty sella syndrome) or genetic (e.g. PIT-1, PROP-1 mutation) causes. In addition, children also have tumours that can cause GHD (Molitch et al. 2011). About 30% to 60% of children with idio-pathic GHD have normal GH response when tested in adulthood (Nicolson et al. 1996; Aimaretti et al. 2000a; Attanasio et al. 2002).
Adult-onset GHD generally presents as part of combined pituitary hormone de-ficiency (i.e. hypopituitarism) and is often attributable to a pituitary adenoma or treatment with surgery, radiotherapy, or combinations thereof (Cuneo et al. 1992; Carroll et al. 1998; Molitch et al. 2011). Other hypothalamic-pituitary causes, such as primary brain tumours (e.g. craniopharyngioma, glioma), traumatic brain injury, subarachnoid haemorrhage, infiltrative diseases (e.g. lymphocytic hypophysitis), and infectious diseases (e.g. tuberculosis) can lead to hypopituitarism. Idiopathic GHD in adults is very rare (Molitch et al. 2011). After cranial irradiation, the risk of developing GHD evolves over time and depends on dose; the risk is above 50% if the biologically effective dose was >40 Gy (Gleeson et al. 2004).
4.2 Clinical findings
A short stature and a low growth velocity for age in childhood are clear signs of GHD. In adults there are no pathognomonic features and clinical signs and sympt-oms are non-specific. Patients suffer from fatigue, lack of energy, decreased muscle strength, and reduced physical activity. Adult GHD is recognized as a clinical syn-drome, which is characterized by reduced lean body mass, increased (in particu-lar) visceral adiposity, decreased total body water, low bone mineral density and mineral content, and diminished quality of life (Cuneo et al. 1992; Carroll et al. 1998; Molitch et al. 2011). GHD patients also have impaired fibrinolysis, glucose intolerance, insulin resistance, adverse lipid profile, increased prevalence of hyper-tension, and premature atherosclerosis (Katznelson et al. 2014).
The standard mortality rate (SMR) for individuals with hypopituitarism without GH treatment varies from 1.46 to 3.34 (95% confidence interval) compared to the gene-ral population (Sherlock et al. 2010; Pappachan et al. 2015). Cerebrovascular and cardiovascular diseases are the main causes of premature mortality. GH replace-ment reduces the mortality risk (SMR to 1.05-1.24) (Pappachan et al. 2015).

34
4.3 Laboratory diagnosis
Consensus guidelines for the diagnosis and treatment of adult GHD have been published by endocrinology societies since 1998 (Growth Hormone Research So-ciety 1998; Gharib et al. 2003; Molitch et al. 2006; Ho and GH Deficiency Consen-sus Workshop Participants 2007; Cook et al. 2009; Molitch et al. 2011). According to the latest Endocrine Society Clinical Practice Guideline from 2011, evaluation for adult GHD should be considered for patients who are selected for treatment (Molitch et al. 2011).
In organic hypothalamic-pituitary disease, GH is usually the first anterior pituitary hormone affected by the development of hypopituitarism. GH is followed by go-nadotropins (LH and FSH), adrenocorticotropic hormone (ACTH), thyroid-stimu-lating hormone (TSH), and antidiuretic hormone (ADH), usually in this sequence following radiotherapy (Toogood et al. 1994). Patients should receive stable and adequate hormone replacement for other hormonal deficiencies before GH testing (Molitch et al. 2011). In patients with three or more concomitant pituitary hormone deficiencies, the likelihood for having GHD is 90% to 95% (Toogood et al. 1994; Hartman et al. 2002). In this case, a stimulation test is not necessarily required but clinical signs and symptoms in combination with low IGF-1 are sufficient for the diagnosis of GHD (Molitch et al. 2011).
There have been reports on worsening lipoprotein profiles, body composition, and bone mass in adolescents with severe GHD if GH treatment was stopped at the time of final height (Colao et al. 2002b; Underwood et al. 2003). The need for con-tinuous GH treatment must be confirmed with an IGF-1 measurement and a stimu-lation test during the transition period, which extends from mid-to-late adolescence until 6 to 7 years after final height is reached (Clayton et al. 2005). GH treatment should be withdrawn for at least 1 month before the stimulation test (Molitch et al. 2011). In some cases, a low IGF-1 level (≤-2 SD) after at least 1 month off GH the-rapy is sufficient indication of persistent GHD without additional stimulation tests. This is in cases of children with irreversible structural lesions that cause multiple hormone deficiencies (≥3) or with proven genetic causes (Clayton et al. 2005; Mo-litch et al. 2011).
The diagnosis of adult GH deficiency should be established by an appropriate GH stimulation test. Adult patients who appear to have isolated GHD should undergo two stimulation tests to confirm the diagnosis, particularly if serum IGF-1 is not low (Molitch et al. 2011; Melmed 2013). After traumatic injury, the GH axis may recover and thus testing for GHD should be undertaken no sooner than 12 months after the injury (Ho and GH Deficiency Consensus Workshop Participants 2007).
A random serum GH concentration, mean 24-hour serum GH concentrations, or assay for IGFBP-3 or ALS do not distinguish between normal and GHD subjects (Hoffman et al. 1994). Hoffman reported that 15 of 21 (72%) hypopituitary subjects had IGFBP-3 concentration within the normal range (Hoffman et al. 1994). Other studies have also shown that adult-onset GHD patients may have false negative IGFBP-3 results (Marzullo et al. 2001).
35
4.3.1 Serum IGF-1 in GHD
In adults, a low serum IGF-1 value in the presence of multiple pituitary hormone deficiencies provides strong evidence of GHD, but normal age-related serum IGF-1 concentrations do not exclude severe adult GHD (Hoffman et al. 1994; Growth Hormone Research Society 1998; Hilding et al. 1999; Marzullo et al. 2001; Biller et al. 2002; Hartman et al. 2002; Aimaretti et al. 2003; Mukherjee and Shalet 2009). Normal IGF-1 values have been reported in 34% to 70% of GHD adults (Hoffman et al. 1994; Bates et al. 1995; Svensson et al. 1997; Hilding et al. 1999; Marzullo et al. 2001; Aimaretti et al. 2003).
Seventy percent of GHD patients <40 years had a serum IGF-1 level below the age-related third percentile, but the percentage of these patients >40 years was only 35% (Aimaretti et al. 2003). In untreated adult GHD, IGF-1 concentrations are lower in females than in males (Hilding et al. 1999). While truncal obesity and high BMI is associated with a blunted GH response to stimulation (Qu et al. 2005; Colao et al. 2009), serum IGF-1 is often normal in obesity (Molitch et al. 2011). A low IGF-1 in obese patients with a blunted GH response in stimulation tests strongly suggests true GHD (Clemmons 2010).
A low serum IGF-1 concentration in a well-nourished adult without liver or kidney disease, hypothyroidism, poorly controlled DM, or oral oestrogen therapy is highly suggestive of GHD and is indication for GH stimulation testing (Aimaretti et al. 1998b; Hartman et al. 2002; Aimaretti et al. 2003; Molitch et al. 2011). Lissett et al. observed that 86% of patients with childhood-onset GHD (compared to 52% with adult-onset GHD) had serum IGF-1 standard deviation score (SDS) below -2 SDS (Lissett et al. 2003).
4.3.2 Stimulation tests
The ITT is regarded as the diagnostic test of choice for assessment of patients with GH deficiency (Hoffman et al. 1994; Growth Hormone Research Society 1998). According to the latest consensus statement, the ITT and the GHRH+arginine test are regarded as the best tests in adults and provide sufficient sensitivity and speci-ficity to establish a reliable diagnosis when appropriate cut-offs are used (Molitch et al. 2011). The GHRH analogue is not available in the USA and the glucagon test is considered the preferred alternative to the GHRH+ARG test (Yuen et al. 2016).
Many classical tests are weak and unreliable in diagnosing GHD in adults. These tests include stimulation of GH secretion with arginine, GHRH, clonidine, levo-dopa, and ghrelin alone and the combination of arginine plus levodopa (Rahim et al. 1996; Aimaretti et al. 2000b; Biller et al. 2002; Molitch et al. 2011). GHRH has also been combined with pyridostigmine or a synthetic GH secretagogue (GH-re-leasing peptides) such as GHRP-6, GHRP-2, or hexarelin, but these tests are not widely used (Yuen et al. 2016).
36
Insulin tolerance test
In the ITT, hypoglycaemia (blood glucose ≤2.2 mmol/L) potently stimulates GH by decreasing somatostatin tonus (Shibasaki et al. 1985; Fish et al. 1986) and also by increasing GHRH release (Fisker et al. 1998b). GH concentrations are measured every 15 to 30 minutes for 2 hours. Hypoglycaemia stimulates GH release approx-imately within 45 minutes. The fundamental study that established the peak values in the ITT for normal and GHD subjects was the study of Hoffman et al. in 1994. They studied 25 normal subjects with a range of GH responses from 5.3 to 42.5 µg/L (mean 16.3 µg/L). In GHD patients (n=21), the range of stimulated peak GH responses was <0.2 to 3.1 µg/L. This study demonstrated that the maximal GH re-sponse to insulin hypoglycaemia (0.05-0.1 units/kg) was <3.1 µg/L in severe GHD and a normal GH response was ≥5 µg/L using a polyclonal GH RIA (Hoffman et al. 1994). In the first consensus statement from 1998, these cut-off values were adequ-ate for the polyclonal RIA assays calibrated against WHO IS 80/505, in which 1 µg corresponds to 2.6 mU (Growth Hormone Research Society 1998).
In 2000, Aimaretti et al. reported cut-offs of 5.3 µg/L based on the third and 3.8 µg/L on the first percentile of the GH response in healthy lean subjects (Aimaretti et al. 2000b). Later, Biller et al. used a sensitive immunochemiluminescence sandwich assay and established a cut-off of 5.1 µg/L for ITT in the control group, which also included obese subjects (Biller et al. 2002). Interestingly, the cut-off has been the same although the GH concentrations have decreased with newer GH assays and the cut-off for diagnosis of acromegaly has decreased.
ITT is contraindicated in patients with a history of seizure disorders and ischaemic heart disease and in elderly patients (Ho and GH Deficiency Consensus Workshop Participants 2007; Molitch et al. 2011). ITT is cumbersome to perform and may cause serious adverse effects and thus should be performed under careful supervi-sion by experienced staff (Shah et al. 1992; Jones et al. 1994). An adequate insulin dose is essential to achieve sufficient hypoglycaemia while avoiding adverse events. Some patients develop neuroglycopenic symptoms. On the other hand, the test should not be terminated prematurely before onset of hypoglycaemic symptoms due to the risk of falsely diagnosing GHD (Borm et al. 2005).
The consensus statement from 1998 stated that the ITT can be used to distinguish GH deficiency from the reduced GH secretion that accompanies normal aging and obesity (Growth Hormone Research Society 1998). ITT is complicated by the lack of age-, sex-, and BMI-adjusted reference values and variations in the amount of insulin used and the duration of hypoglycaemia used. False-positive results may occur in patients who are severely obese (Qu et al. 2005).
In the transition phase (from late puberty to adulthood and somatic maturation), the cut-off for ITT is lower in children but higher in adults (Molitch et al. 2011). In a consensus statement from the European Society for Paediatric Endocrinology, a cut-off of <5 µg/L in response to a GH stimulation test for severe GHD has been suggested (Clayton et al. 2005). The GH Research Society guidelines suggest a cut-off of 6 µg/L (Ho and GH Deficiency Consensus Workshop Participants 2007).
37
Growth hormone-releasing hormone (GHRH) + arginine test
GHRH-induced GH release is significantly potentiated when combined with the amino acid arginine, which inhibits somatostatin tonus (Alba-Roth et al. 1988). Infusion of arginine (0.5 g/kg, maximal dose 30 g) over 30 minutes together with an intravenous bolus of GHRH (1 µg/kg) is administered and blood samples for GH determination are drawn every 15 to 30 minutes for 2 hours. In 1996, Ghigo and co-workers reported that a peak response to the GHRH+ARG was 0.1-9.5 µg/L in hypopituitary subjects (Ghigo et al. 1996). The third percentile of the GH response to GHRH+ARG was 16.5 µg/L in the healthy subjects. Thus, the cut-off of 9 µg/L was introduced (Ghigo et al. 1996; Aimaretti et al. 1998a). No significant gender- or age-related differences were found (Ghigo et al. 1996; Valetto et al. 1996). Only small intra-individual variability of the GH response to GHRH+arginine in two tes-ting sessions was observed in adult and healthy elderly subjects and in patients with severe GHD (Valetto et al. 1996; Aimaretti et al. 2000a). In 2002, Biller et al. studied a control group with higher BMI (mean 30.3 kg/m2) and suggested a GH cut-off of 4.1 µg/L (Biller et al. 2002).
In 2005, Corneli et al. suggested BMI-related cut-off values for diagnosing GHD in adults using the GHRH+ARG test. For subjects with normal BMI (<25 kg/m2), the cut-off for GH peak was 11.5 µg/L. The cut-off was 8.0 µg/L for overweight subjects (BMI 25-30 kg/m2) and 4.2 µg/L for obese subjects (BMI ≥30 kg/m2) (Corneli et al. 2005). It was later shown that the GH response in the GHRH+ARG test is also negatively correlated with age (Colao et al. 2009). Thus, BMI-related cut-offs are proposed in the latest consensus statements (Ho and GH Deficiency Consensus Workshop Participants 2007; Molitch et al. 2011).
The GHRH+ARG test has no significant side effects or contraindications. However, in cases of hypothalamic causes of GHD within 10 years (e.g. irradiation), the GHRH + ARG test may give false normal results as GHRH directly stimulates the pituitary (Darzy et al. 2003; Molitch et al. 2011). An ITT should also be performed if the peak GH level during a GHRH+ARG test is normal in those who have received radiation (Ho and GH Deficiency Consensus Workshop Participants 2007).
4.4 Treatment and laboratory follow up
Treatment with GH should be started with a low dose and gradually increased ba-sed on clinical response. The goal is to achieve an IGF-1 level within the age-adju-sted reference range. Weight-based dosing, which is used in children, is supraphy-siological and causes side effects in adults (Mukherjee and Shalet 2009; Molitch et al. 2011). GH is administered as daily subcutaneous injections in the thigh or abdomen in the evening. Patients aged 30 to 60 years are given a starting dose of 0.2 to 0.3 mg/day. Younger patients (<30 years) may need a higher initial dose and older patients (>60 years) should be started on lower doses that are increased slowly (Underwood et al. 2003; Molitch et al. 2011). Those with childhood-onset GHD do not require more GH than adult-onset GHD (Molitch et al. 2011).
Due to a direct inhibitory effect of oestrogen on hepatic IGF-1 production, fema-les with GHD require higher GH doses to achieve the same IGF-1 response as in
38
males. For females who are taken off oestrogen therapy or switched from oral to transdermal oestrogens, lower GH doses may be adequate (Jørgensen et al. 2005). Clinically significant effects have not been observed before 6 months of treatment. It may be appropriate to discontinue GH replacement if there are no benefits after 1 year of treatment.

39
AIMS OF THE STUDY
The aims of the present study were
1. to evaluate the GH concentration difference and variation with GH assays used in Finland between 1998 to 2003, when between-laboratory variation in GH con-centrations was large in clinical practice.
2. to evaluate the use of IS 80/505 by AutoDELFIA and Immulite 2000 assays on serum GH levels and to compare them with polyclonal RIA, which was calibrated against the older standard IRP 66/217.
3. to evaluate the consensus cut-offs of the OGTT in healthy control subjects and acromegaly patients by the AutoDELFIA and Immulite 2000 assays.
4. to evaluate the consensus cut-offs of the ITT with healthy control subjects using AutoDELFIA and Immulite 2000 assays.
5. to evaluate and adopt into clinical use a new GHRH+ARG test by studying con-trol subjects and GHD patients with the AutoDELFIA assay, which was in routine use until 2015.
6. to evaluate the cut-offs of the GHRH+ARG test using the Immulite 2000 XPi as-say, which is calibrated against the current recombinant GH IS 98/574.
40
SUBJECTS AND METHODS
1. Study design
During the 1990s, the change from competitive RIAs based on polyclonal antibo-dies to sandwich-type immunoassays using monoclonal antibodies caused consi-derable differences in GH results between assays. The aim of the first study (I) was to start a new external quality assessment scheme (EQAS) for serum GH using QA samples of pooled serum specimens. The EQAS for serum GH measurement was organized by a community-owned company, Labquality Ltd (Helsinki, Finland), in co-operation with the University Hospital laboratories in Tampere, Oulu, and Helsinki (Study I). GH measurement was studied in clinical practice in the other studies (II-IV). 2. Subjects
2.1 Controls (II, III, IV) One hundred and twenty apparently healthy controls (55 men and 65 women) were recruited through advertisement in our hospital newspaper during the years 2001 to 2008. The controls consisted of medical students, hospital personnel, and their relatives. Exclusion criteria were pregnancy or known or suspected disease or any symptoms or signs indicating disease or medication. However, a sufficient number of healthy controls was not obtained in the oldest group (50-60 years). Among the controls in study IV and in the group of older subjects (in which the OGTT was performed later), five men and three women received medication (five used statins, one beta blocker, one tamsulosin, and one thyroxine for hypothyroidism because of thyroidectomy and vitamin B12 injections for pernicious anaemia). These subjects were aged 46.6 to 61 years (median 57.4 years). Women did not use oestrogens.
In study IV, we also included seven subjects who had been referred due to fatigue but without history of pituitary or hypothalamic disease. They had been studied ca-refully with no abnormal findings in hormone concentrations and other laboratory tests; two of them had pituitary imaging with normal findings. One male had type 1 diabetes and used insulin and the other used testosterone for primary hypogona-dism.
Of the 128 control subjects, 67 (36 men and 31 women) underwent the following three tests: OGTT, ITT, and the GHRH+ARG test. Characteristics of control subjects in studies II-IV are presented in Table 4.
2.2 Patients
Acromegaly patients (II)
Seventy-one treated acromegaly patients and seven patients with newly diagnosed untreated acromegaly were studied with the OGTT (Table 4).
41
Patients with GH deficiency (IV)
We studied 34 patients with pituitary disease and suspicion of GH deficiency by the GHRH+ARG test (Table 4).
Among these, 24 had undergone pituitary surgery and nine had pituitary radiation. The primary diseases were eight non-functioning pituitary adenomas, five secre-ting adenomas, three craniopharyngiomas, three cysts of the Rathke pouch, three hypophysitis, two meningeomas, one astrocytoma, one glioma, one ependymo-ma, one myxomatic pseudotumour, one histiocytosis, one Sheehan syndrome, one congenital panhypopituitarism, two idiopathic GHD diagnosed in childhood (one with continuing secondary hypogonadism), and one secondary hypogonadism. Of these patients, 20 had three, 13 had two, one had one anterior pituitary hormone deficiency other than GH, and 11 patients had hypothalamic diabetes insipidus. The patients were on adequate replacement therapy for other deficiencies during the GHRH+ARG test.
3. Tests
OGTTs, ITTs, and GHRH+ARG tests were performed at the Division of Endocrino-logy, Department of Medicine, Helsinki University Central Hospital. The subjects were asked to refrain from strenuous exercise in the morning of the tests when they arrived at the hospital after an overnight fast. Fertile healthy women were tested during the follicular phase of the menstrual cycle (days 7-11).
3.1 Oral glucose tolerance test
The OGTT was started at 7.00 to 10.30 (average 8.00) a.m. A cannula was inserted into the cubital vein and 75 g of glucose was administered per os. Blood samples for GH assays were taken at 0, 30, 60, 90, and 120 minutes. Blood glucose was measured during the test.
3.2 Insulin tolerance test
The ITT was started at 7.00 to 10.30 (average 8.30) a.m. Intravenous (i.v.) cannu-las were inserted in both arms for blood sampling and infusions. At 0 minutes, a blood sample for serum GH measurement and regular human insulin (Actrapid Novo-Nordisk, Copenhagen, Denmark) at a dose of 0.1 to 0.15 IU/kg was given as an i.v. bolus injection. Further blood samples for serum GH were drawn at 30, 60, 90, and 120 minutes. The target for plasma glucose level after insulin injection was ≤2.2 mmol/L and should have been accompanied with hypoglycaemic symptoms. Additional insulin boluses were administered if needed to reach this glucose le-vel if considered safe by a supervising experienced clinician. When the target was reached, the subject ate a snack, was given i.v. glucose, or both. The test was termi-nated prematurely if the clinician deemed it unsafe to continue due to symptoms of hypoglycaemia.
42
3.3 Growth hormone-releasing hormone (GHRH) + arginine test
The GHRH+ARG stimulation test was started at 7.00 to 10.30 (average 7.30) a.m. Intravenous cannulas were inserted in each arm for blood sampling and infusions. One µg/kg GHRH (GHRH(1-29), GEREF; Serono, Italy) was administered as an i.v. bolus at 0 minutes, followed by arginine (L-arginine monohydrochloride, Braun, Melsungen, Germany) at a dose of 0.5 g/kg (maximal dose 30 g) over 30 minutes. Blood samples were drawn at -15, 0, 15, 30, 45, 60, 75, and 90 minutes.
4. Samples
Serum samples of patients and control subjects were separated into four to six tu-bes, which were stored frozen for 4 to 6 weeks at -20°C and then at -80°C until analysed.
During the initial phase of the study (years 2001-2008), all patient samples were analysed by a time-resolved immunofluorometric GH assay (AutoDELFIA, PerkinEl-mer, Wallac, Turku, Finland), which was our routine method at that time. Additional sample tubes from all three dynamic tests were stored at -80°C. Thus, all samples, including the samples of control subjects, had been frozen and thawed once be-fore analysis. In study IV, only the basal and peak samples were analysed with the Immulite 2000 XPi in 2014 to 2015. To evaluate the possible effect of long-term storage on GH levels, we reanalysed 193 samples from 2001 to 2008 in 2013 by the AutoDELFIA assay. No loss of GH during storage was observed.
5. Laboratory methods
GH concentrations of all samples were analysed by the AutoDELFIA human GH, hGH assay (PerkinElmer, Wallac, Turku, Finland). In studies II and III, the samples were also analysed by the Immulite 2000 GH assay (DPC, later Siemens, Los An-geles, CA, USA). In study II, we analysed some samples using the Orion Diagnostica Spectria RIA. In study IV, the method used was our new routine GH method (Im-mulite 2000 XPi recalibrated against the WHO IS 98/574) (Appendix 1 and 2). The lowest reported results were 0.63, 0.05, and 0.04 µg/L for the Orion RIA, Immulite 2000, and AutoDELFIA assays, respectively. Values below the lowest reported result were assigned a value half of that obtained.
In study III, blood glucose was measured using a bed-side glucometer (One Touch Ultra, Life Scan) and part of the samples was also analysed by a hexokinase/glu-cose-6-phosphate dehydrogenase assay (Roche Diagnostics, Gluco-quant glucose/hexokinase) using a Hitachi Modular PP Automatic analyzer (Hitachi Ltd, Tokyo, Japan). In study III, serum cortisol concentrations were measured by the Immuno-1 assay (Bayer Diagnostic). In study IV, serum IGF-1 concentrations were measured by the Immulite 2000 XPi assay, which was calibrated against the WHO IRR 87/518.
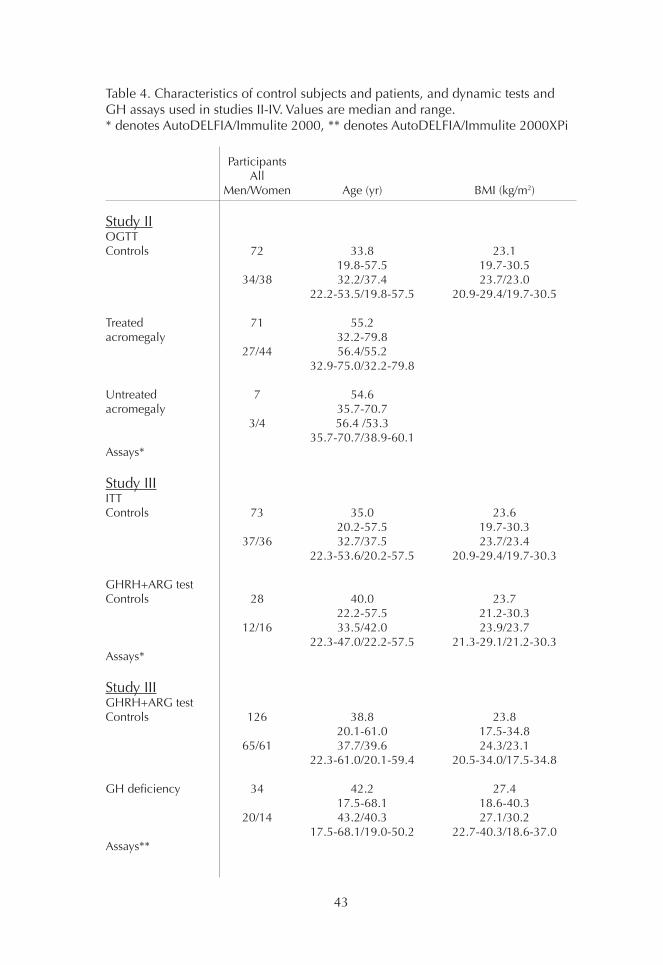
43
Participants All Men/Women Age (yr) BMI (kg/m2)
Study IIOGTTControls 72 33.8 23.1 19.8-57.5 19.7-30.5 34/38 32.2/37.4 23.7/23.0 22.2-53.5/19.8-57.5 20.9-29.4/19.7-30.5
Treated 71 55.2acromegaly 32.2-79.8 27/44 56.4/55.2 32.9-75.0/32.2-79.8
Untreated 7 54.6acromegaly 35.7-70.7 3/4 56.4 /53.3 35.7-70.7/38.9-60.1Assays*
Study IIIITT Controls 73 35.0 23.6 20.2-57.5 19.7-30.3 37/36 32.7/37.5 23.7/23.4 22.3-53.6/20.2-57.5 20.9-29.4/19.7-30.3
GHRH+ARG testControls 28 40.0 23.7 22.2-57.5 21.2-30.3 12/16 33.5/42.0 23.9/23.7 22.3-47.0/22.2-57.5 21.3-29.1/21.2-30.3Assays*
Study IIIGHRH+ARG testControls 126 38.8 23.8 20.1-61.0 17.5-34.8 65/61 37.7/39.6 24.3/23.1 22.3-61.0/20.1-59.4 20.5-34.0/17.5-34.8
GH deficiency 34 42.2 27.4 17.5-68.1 18.6-40.3 20/14 43.2/40.3 27.1/30.2 17.5-68.1/19.0-50.2 22.7-40.3/18.6-37.0Assays**
Table 4. Characteristics of control subjects and patients, and dynamic tests and GH assays used in studies II-IV. Values are median and range.* denotes AutoDELFIA/Immulite 2000, ** denotes AutoDELFIA/Immulite 2000XPi
44
6. Statistical methods
Statistical analyses were performed using SPSS (Statistical Package for the Social Sciences) for Windows (version 11-25). In study II, Spearman correlation, Deming unweighted regression, and Wilcoxon signed-rank tests were used for comparing assay results, and Mann-Whitney and McNemar tests for comparing groups were used. In study III, Spearman and Pearson analyses were used for correlations invol-ving normally and non-normally distributed values, respectively. The Mann-Whit-ney U test was used to compare results between men and women. In study IV, the non-parametric Mann-Whitney U test was used to compare non-nor-mally distributed continuous variables between groups and the two-sample t-test to compare normally distributed variables between groups. Spearman correlation was used to study test associations between continuous variables. The difference in values between groups was studied using analysis of covariance after adjustment for potential confounding factors. Due to the positively skewed distributions, log-trans-formed peak GH, basal GH, and IGF-1 values were used in analysis of covariance.The Friedman test was used to study the difference of medians in basal GH con-centrations in men and women. A Bland-Altman plot was used to compare serum GH concentrations measured in 2001-2008 and 2013 by the AutoDELFIA and GH concentrations measured by the AutoDELFIA and Immulite 2000 XPi assays.
7. Ethical aspects
The protocol was approved by the Ethical Committee of the Department of Med-icine of Helsinki University Hospital (203/2001 Dnro 274/E5/01 and Dnro 514/E5/02). Written informed consent was obtained from all study participants.
45
RESULTS
Detailed results are given in the original publications and therefore only the main results are summarized here. Some new unpublished data are also included.
1. Comparison of GH assays
In the first study (I), the differences between the GH assays used in Finland were evaluated by organizing an external quality assurance survey. In the first year (1998), 9 of the 14 participating laboratories were Finnish. Seven methods were used and this decreased to three by the end of the study in 2003. At that time, im-munoanalyzers were used and hormone analytics were centralized to laboratories in the university hospitals and some private laboratories in Finland. Since 2000, all participants used immunometric assays calibrated against the WHO IS 80/505 standard. In the 1998 survey, the Orion Diagnostica Spectria assay was calibrated against WHO IRP 66/217. In 1998, 14 participating laboratories reported five dif-ferent conversion factors (from µg/L to mU/L) ranging from 1.6 to 2.6, whereas in 2003 seven of eight participants reported the same factor (2.6). Two conversion factors (1.6 and 2.0) were used with the Spectria RIA assay. In the assay manual a conversion factor of 1.6 was used.
In 1998, the Spectria RIA gave the highest concentrations in all four samples of the round due to the old standardization but also due to the use of polyclonal antibodi-es. The AutoDELFIA assay gave the lowest values. The biggest difference was at low concentrations; the GH result was 7.1 mU/L by Spectria RIA, 3.4 mU/L by Immuli-te, and 2.3 mU/L by AutoDELFIA. This difference affects the diagnostic decision of acromegaly unless assay-specific reference values are used.
In the second study (II), a strong correlation (r=0.995, P<0.001) was observed between the Immulite 2000 and AutoDELFIA assays. Both assays were calibrated against IS 80/505. The Immulite results were on average 37% higher than those obtained by the AutoDELFIA assay in samples (n=690) from healthy controls and acromegaly subjects during the OGTT. The Immulite 2000 values were approxima-tely 2-fold higher than AutoDELFIA values around the cut-off (1 µg/L). The Orion method also showed a strong overall correlation (n=40 samples from 5 treated or 3 untreated acromegaly patients; r=0.951-0.959) compared with the other methods. However, the correlation was poor compared with the other methods at concentra-tions <2 µg/L. The Orion method gave approximately 2-fold higher results (concen-tration range 8-27 µg/L) than those obtained by the AutoDELFIA assay and about 1.7-fold higher than by the Immulite 2000 assay.
In the third study (III), we compared the AutoDELFIA and Immulite 2000 assays using samples from control subjects (n=58) during the ITT and GHRH + ARG test. The correlation between the assays was excellent (r=0.998; P<0.001), but the GH results with Immulite 2000 were 48% higher than those with the AutoDELFIA.
In the fourth study (IV), the basal and peak GH concentrations in the samples from the GHRH+ARG tests from controls and GHD subjects were analysed by the re-standardized (against IS 98/574) Immulite 2000 XPi assay. The results of GH con-
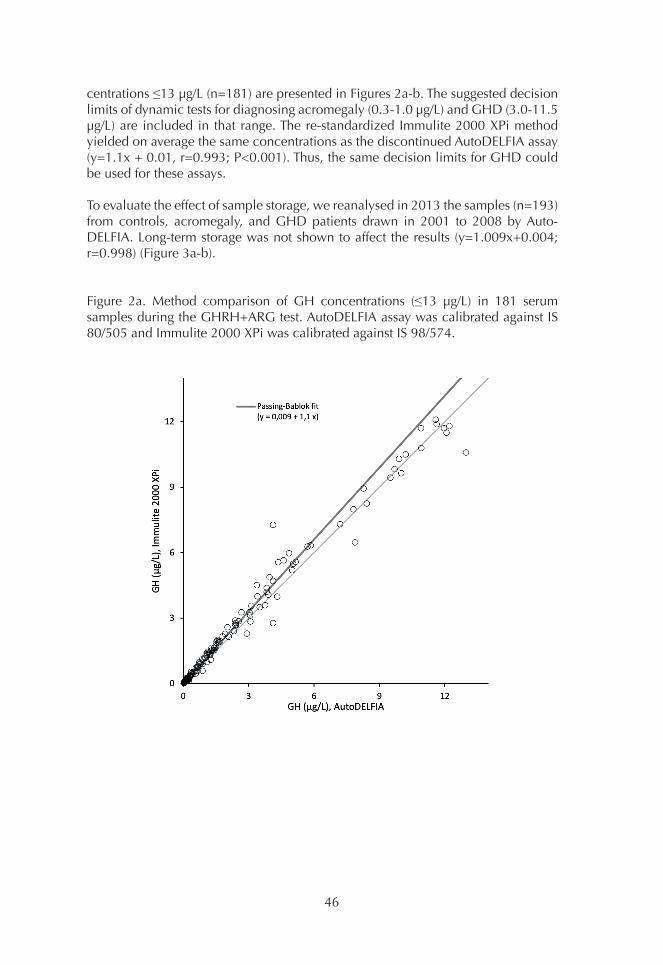
46
centrations ≤13 µg/L (n=181) are presented in Figures 2a-b. The suggested decision limits of dynamic tests for diagnosing acromegaly (0.3-1.0 µg/L) and GHD (3.0-11.5 µg/L) are included in that range. The re-standardized Immulite 2000 XPi method yielded on average the same concentrations as the discontinued AutoDELFIA assay (y=1.1x + 0.01, r=0.993; P<0.001). Thus, the same decision limits for GHD could be used for these assays.
To evaluate the effect of sample storage, we reanalysed in 2013 the samples (n=193) from controls, acromegaly, and GHD patients drawn in 2001 to 2008 by Auto-DELFIA. Long-term storage was not shown to affect the results (y=1.009x+0.004; r=0.998) (Figure 3a-b).
Figure 2a. Method comparison of GH concentrations (≤13 µg/L) in 181 serum samples during the GHRH+ARG test. AutoDELFIA assay was calibrated against IS 80/505 and Immulite 2000 XPi was calibrated against IS 98/574.
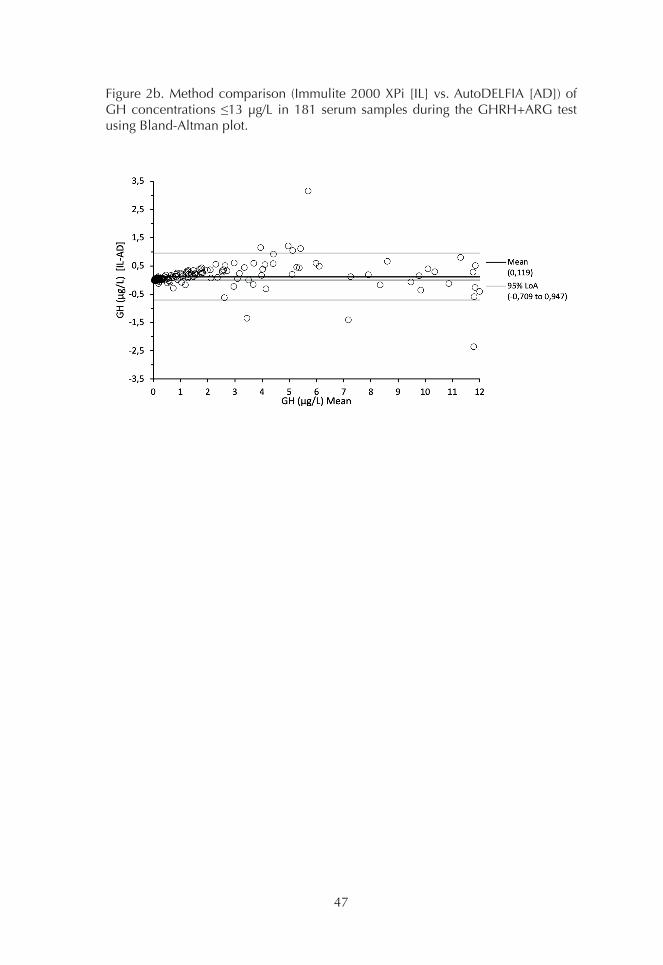
47
Figure 2b. Method comparison (Immulite 2000 XPi [IL] vs. AutoDELFIA [AD]) of GH concentrations ≤13 µg/L in 181 serum samples during the GHRH+ARG test using Bland-Altman plot.
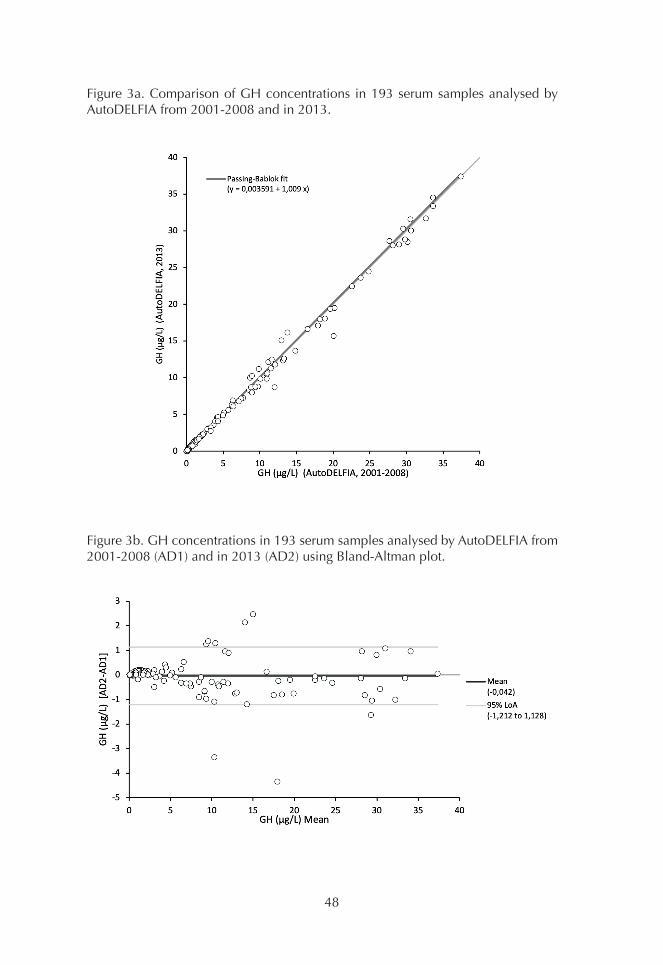
48
Figure 3a. Comparison of GH concentrations in 193 serum samples analysed by AutoDELFIA from 2001-2008 and in 2013.
Figure 3b. GH concentrations in 193 serum samples analysed by AutoDELFIA from 2001-2008 (AD1) and in 2013 (AD2) using Bland-Altman plot.
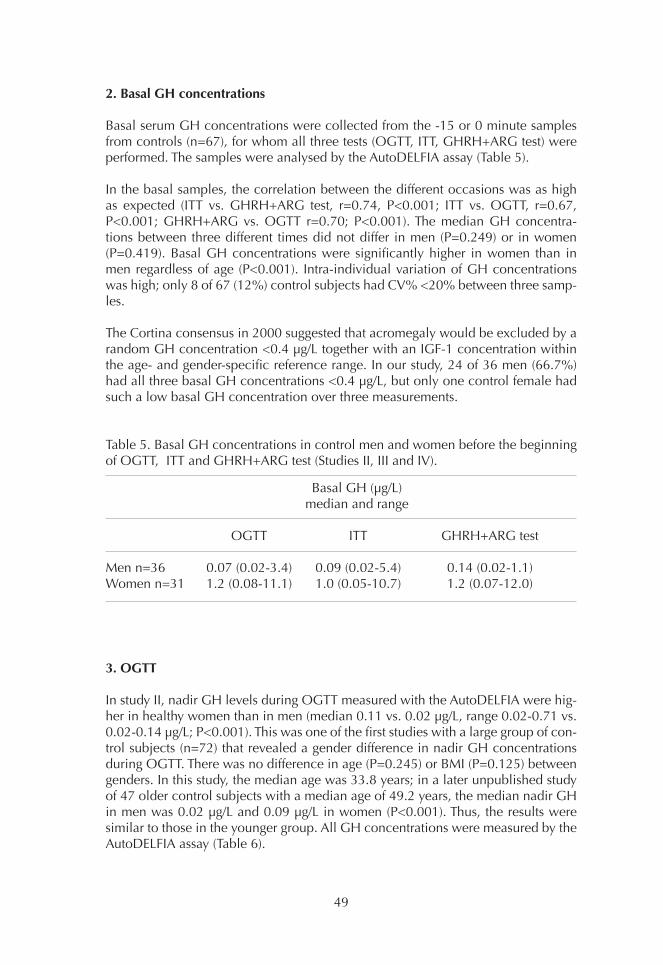
49
2. Basal GH concentrations
Basal serum GH concentrations were collected from the -15 or 0 minute samples from controls (n=67), for whom all three tests (OGTT, ITT, GHRH+ARG test) were performed. The samples were analysed by the AutoDELFIA assay (Table 5).
In the basal samples, the correlation between the different occasions was as high as expected (ITT vs. GHRH+ARG test, r=0.74, P<0.001; ITT vs. OGTT, r=0.67, P<0.001; GHRH+ARG vs. OGTT r=0.70; P<0.001). The median GH concentra-tions between three different times did not differ in men (P=0.249) or in women (P=0.419). Basal GH concentrations were significantly higher in women than in men regardless of age (P<0.001). Intra-individual variation of GH concentrations was high; only 8 of 67 (12%) control subjects had CV% <20% between three samp-les.
The Cortina consensus in 2000 suggested that acromegaly would be excluded by a random GH concentration <0.4 µg/L together with an IGF-1 concentration within the age- and gender-specific reference range. In our study, 24 of 36 men (66.7%) had all three basal GH concentrations <0.4 µg/L, but only one control female had such a low basal GH concentration over three measurements.
Table 5. Basal GH concentrations in control men and women before the beginning of OGTT, ITT and GHRH+ARG test (Studies II, III and IV).
3. OGTT
In study II, nadir GH levels during OGTT measured with the AutoDELFIA were hig-her in healthy women than in men (median 0.11 vs. 0.02 µg/L, range 0.02-0.71 vs. 0.02-0.14 µg/L; P<0.001). This was one of the first studies with a large group of con-trol subjects (n=72) that revealed a gender difference in nadir GH concentrations during OGTT. There was no difference in age (P=0.245) or BMI (P=0.125) between genders. In this study, the median age was 33.8 years; in a later unpublished study of 47 older control subjects with a median age of 49.2 years, the median nadir GH in men was 0.02 µg/L and 0.09 µg/L in women (P<0.001). Thus, the results were similar to those in the younger group. All GH concentrations were measured by the AutoDELFIA assay (Table 6).
Basal GH (µg/L) median and range
OGTT ITT GHRH+ARG test
Men n=36 0.07 (0.02-3.4) 0.09 (0.02-5.4) 0.14 (0.02-1.1)Women n=31 1.2 (0.08-11.1) 1.0 (0.05-10.7) 1.2 (0.07-12.0)

50
Table 6. Characteristics and results of the older age group of control subjects during the OGTT (unpublished data).
BMI correlated with age in control subjects (n=119, r= 0.35, P<0.001). Nadir GH in the OGTT did not correlate with age (r=-0.09, P=0.351) but correlated negatively with BMI (r=-0.38, P<0.001). In treated acromegalic women, nadir GH was higher than in acromegalic men (median GH 0.40 vs. 0.15 µg/L). There was no age diffe-rence between acromegalic men and women (median 56.4 vs. 55.2 years; P=0.78). Acromegalic patients were older (median 55.2 years, range 32.2-79.8) than control subjects (n=119; median 39.8 years, range 19.8-61.0 years).
In the entire control group (n=119), the highest nadir GH value was 0.71 µg/L in women and 0.14 µg/L in men with the AutoDELFIA assay. The consensus statements (Melmed et al. 1998; Giustina et al. 2000) recommended a nadir GH cut-off of 1 µg/L for the OGTT in 2006, when the results of study II were published. It was suggested that the cut-off value should be lowered to 0.14 to 0.30 µg/L (Freda et al. 1998; Trainer 2002). In the 2018 consensus statement, it was suggested that a cut-off <0.4 µg/l should be used to indicate remission (Melmed et al. 2018).
Table 7 shows the effect of nadir cut-off GH for classifying treated acromegaly patients (n=71) as cured. With AutoDELFIA results, the “remission or cure rate” in men with acromegaly decreased from 85% to 48% (P=0.002) and in women from 68% to 57% (P=0.063) when using gender-specific limits (0.14 µg/L for men and 0.71 µg/l for women) instead of 1 µg/l as recommended in the consensus statement. Using the assay- and gender-specific cut-offs instead of consensus cut-off (1 µg/L), more women patients were classified as treated than men. With the consensus cut-off, more women than men were classified to have active disease.
Men n=25 Women n=22 All n=47
Median (range) Age, years 47.0 (31.8-61.0) 49.7 (22.8-59.4) 49.2 (22.8-61.0)BMI, kg/m2 25.6 (20.6-34.0) 24.4 (17.5-34.8) 24.9 (17.5-34.8)S -GH, basal, µg/L 0.08 (0.02-0.78) 1.06 (0.06-6.77) 0.17 (0.02-6.77)S -GH, nadir, µg/L 0.02 (0.02-0.09) 0.09 (0.02-0.40) 0.05 (0.02-0.40)
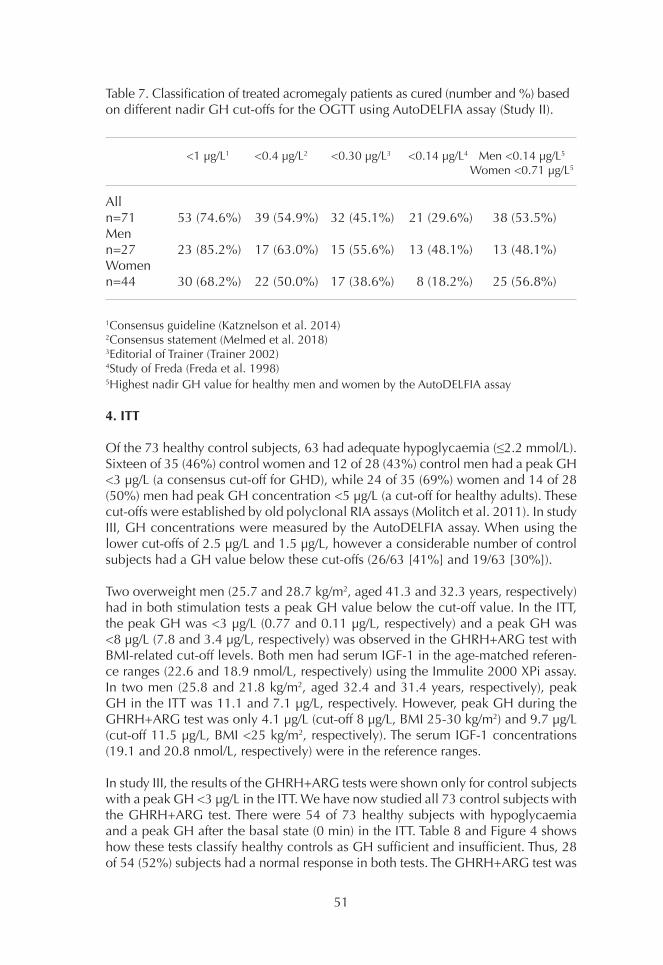
51
Table 7. Classification of treated acromegaly patients as cured (number and %) based on different nadir GH cut-offs for the OGTT using AutoDELFIA assay (Study II).
1Consensus guideline (Katznelson et al. 2014) 2Consensus statement (Melmed et al. 2018) 3Editorial of Trainer (Trainer 2002) 4Study of Freda (Freda et al. 1998) 5Highest nadir GH value for healthy men and women by the AutoDELFIA assay
4. ITT
Of the 73 healthy control subjects, 63 had adequate hypoglycaemia (≤2.2 mmol/L). Sixteen of 35 (46%) control women and 12 of 28 (43%) control men had a peak GH <3 µg/L (a consensus cut-off for GHD), while 24 of 35 (69%) women and 14 of 28 (50%) men had peak GH concentration <5 µg/L (a cut-off for healthy adults). These cut-offs were established by old polyclonal RIA assays (Molitch et al. 2011). In study III, GH concentrations were measured by the AutoDELFIA assay. When using the lower cut-offs of 2.5 µg/L and 1.5 µg/L, however a considerable number of control subjects had a GH value below these cut-offs (26/63 [41%] and 19/63 [30%]).
Two overweight men (25.7 and 28.7 kg/m2, aged 41.3 and 32.3 years, respectively) had in both stimulation tests a peak GH value below the cut-off value. In the ITT, the peak GH was <3 µg/L (0.77 and 0.11 µg/L, respectively) and a peak GH was <8 µg/L (7.8 and 3.4 µg/L, respectively) was observed in the GHRH+ARG test with BMI-related cut-off levels. Both men had serum IGF-1 in the age-matched referen-ce ranges (22.6 and 18.9 nmol/L, respectively) using the Immulite 2000 XPi assay. In two men (25.8 and 21.8 kg/m2, aged 32.4 and 31.4 years, respectively), peak GH in the ITT was 11.1 and 7.1 µg/L, respectively. However, peak GH during the GHRH+ARG test was only 4.1 µg/L (cut-off 8 µg/L, BMI 25-30 kg/m2) and 9.7 µg/L (cut-off 11.5 µg/L, BMI <25 kg/m2, respectively). The serum IGF-1 concentrations (19.1 and 20.8 nmol/L, respectively) were in the reference ranges.
In study III, the results of the GHRH+ARG tests were shown only for control subjects with a peak GH <3 µg/L in the ITT. We have now studied all 73 control subjects with the GHRH+ARG test. There were 54 of 73 healthy subjects with hypoglycaemia and a peak GH after the basal state (0 min) in the ITT. Table 8 and Figure 4 shows how these tests classify healthy controls as GH sufficient and insufficient. Thus, 28 of 54 (52%) subjects had a normal response in both tests. The GHRH+ARG test was
<1 µg/L1 <0.4 µg/L2 <0.30 µg/L3 <0.14 µg/L4 Men <0.14 µg/L5 Women <0.71 µg/L5
Alln=71 53 (74.6%) 39 (54.9%) 32 (45.1%) 21 (29.6%) 38 (53.5%)Menn=27 23 (85.2%) 17 (63.0%) 15 (55.6%) 13 (48.1%) 13 (48.1%)Womenn=44 30 (68.2%) 22 (50.0%) 17 (38.6%) 8 (18.2%) 25 (56.8%)

52
normal in 93% (50/54) and the ITT only in 56% (30/54) of the control subjects.
Among 10 control subjects who did not have adequate hypoglycaemia (2.3-2.8 mmol/L), the median GH peak of these subjects in the ITT was 5.5 µg/L (range 0.24-13.8 µg/L) and in the GHRH+ARG test the median peak GH was 28.4 µg/L (range 4.1-49.5 µg/L). The age range of these 10 subjects was 23.5 to 53.6 years and only one subject was female. While 3 of 10 subjects had a peak value <3 µg/L (0.24-0.42 µg/L) in the ITT, the GH response in the GHRH+ARG test was in the BMI-related reference values (31.6-49.5 µg/L). Two overweight men (53.0 and 38.1 years, BMI 27.8 and 25.7 kg/m2, respectively) had low GH response (4.1 and 7.9 µg/L, respec-tively) in the GHRH+ARG test using BMI-related cut-off values. However, the ITT responses were >5 µg/L (5.8 and 13.8 µg/L, respectively).
Table 8. Healthy hypoglycaemic subjects with a nadir GH after the basal state in the ITT (26 men, 28 women) classified based on peak GH in the ITT and GHRH+ARG test (Study III).
Figure 4. Correlation of peak GH during the ITT and GHRH+ARG test in lean (BMI <25 kg/m2) and overweight (BMI≥25 kg/m2) control subjects. BMI in women was 19.7-30.3 kg/m2 and in men 20.9-29.4 kg/m2 (Study III and IV).
ITT, GH peak >3 µg/L ITT, GH peak <3 µg/L Men Women Men Women
GHRH+ARG test normal 13 15 9 13using BMI-related cut-offs GHRH+ARG test abnormal 2 0 2 0using BMI-related cut-offs
53
5. GHRH+ARG test
In study IV, we included seven subjects in the control group (6 men and 1 woman) who had been referred due to fatigue but had no history of pituitary or hypotha-lamic disease. These subjects had IGF-1 concentrations within the age-related re-ference ranges with the Immulite 2000 XPi assay. The characteristics of the control group are presented in Table 9. The peak GH concentrations of the control group in the GHRH+ARG test measured with the AutoDELFIA and Immulite 2000 XPi GH assay are shown in Table 10.
In the control group with the Immulite 2000 XPi assay, 14 of 65 (22%) males had a GH peak value below the BMI-related cut-off limits. Only one man in the control group had a peak GH (10.6 µg/L) below the cut-off of 11.5 µg/L with the Immulite 2000 XPi, although a peak GH of 13.0 µg/L with the AutoDELFIA assay was in the normal range. The immunoassays were classified similarly for the remaining men and all women. The peak GH response was lower in patients than in controls (me-dian 1.5 µg/L, range 0.03-16.3 µg/L vs. 27.2 µg/L, range 2.70-116.00 µg/L by the Immulite 2000 XPi).
Among patients, only a 19-year-old female had a peak GH (16.3 µg/L with Immulite XPi and 16.2 µg/L with AutoDELFIA) over the BMI-related cut-off limits for diagno-sis of adult GHD. Thus, this study showed that the result with the re-standardized Immulite 2000 XPi assay is on average the same as in the earlier used AutoDELFIA assay. We used the GH results of the Immulite 2000 XPi in study IV.
Peak GH in the GHRH+ARG test correlated negatively with BMI both in healt-hy control men (n=59, r=-0.48; P<0.001) and women (n=60, r=-0.49; P<0.001). In the entire control group (n=126), the corresponding correlations were r=-0.52, P<0.001 (n=65) and r=-0.50; P<0.001 (n=61), respectively. The correlation between the peak GH and BMI in the entire group (n=126) is shown in Figure 5. Women had higher peak GH values than men and the gender difference remained significant af-ter adjustment for age and BMI (P<0.001). The peak GH value correlated negatively with age (n=126, r=-0.37; P<0.001).
Among patients, women had a higher peak GH than men. However, the difference was not significant after adjustment for age and BMI (P=0.15). In patients, the peak GH did not correlate with BMI (r=0.09; P=0.63) but correlated negatively with age (r=-0.43; P<0.05). The correlation between BMI and peak GH is shown in Figure 6.
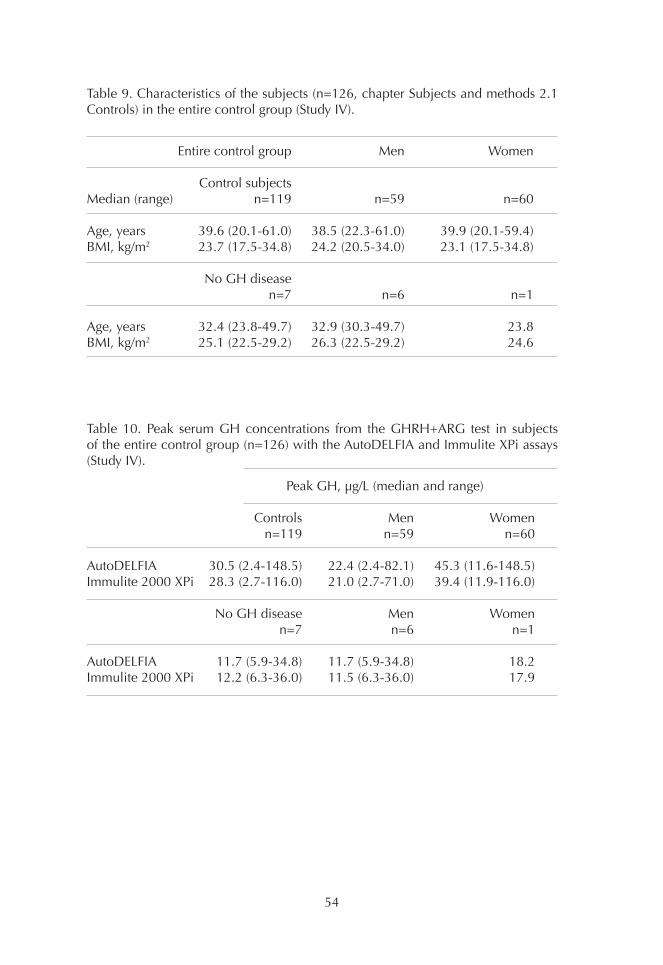
54
Table 9. Characteristics of the subjects (n=126, chapter Subjects and methods 2.1 Controls) in the entire control group (Study IV).
Table 10. Peak serum GH concentrations from the GHRH+ARG test in subjects of the entire control group (n=126) with the AutoDELFIA and Immulite XPi assays (Study IV).
Peak GH, µg/L (median and range) Controls Men Women n=119 n=59 n=60
AutoDELFIA 30.5 (2.4-148.5) 22.4 (2.4-82.1) 45.3 (11.6-148.5)Immulite 2000 XPi 28.3 (2.7-116.0) 21.0 (2.7-71.0) 39.4 (11.9-116.0) No GH disease Men Women n=7 n=6 n=1
AutoDELFIA 11.7 (5.9-34.8) 11.7 (5.9-34.8) 18.2Immulite 2000 XPi 12.2 (6.3-36.0) 11.5 (6.3-36.0) 17.9
Entire control group Men Women
Control subjectsMedian (range) n=119 n=59 n=60
Age, years 39.6 (20.1-61.0) 38.5 (22.3-61.0) 39.9 (20.1-59.4)BMI, kg/m2 23.7 (17.5-34.8) 24.2 (20.5-34.0) 23.1 (17.5-34.8)
No GH disease n=7 n=6 n=1
Age, years 32.4 (23.8-49.7) 32.9 (30.3-49.7) 23.8BMI, kg/m2 25.1 (22.5-29.2) 26.3 (22.5-29.2) 24.6
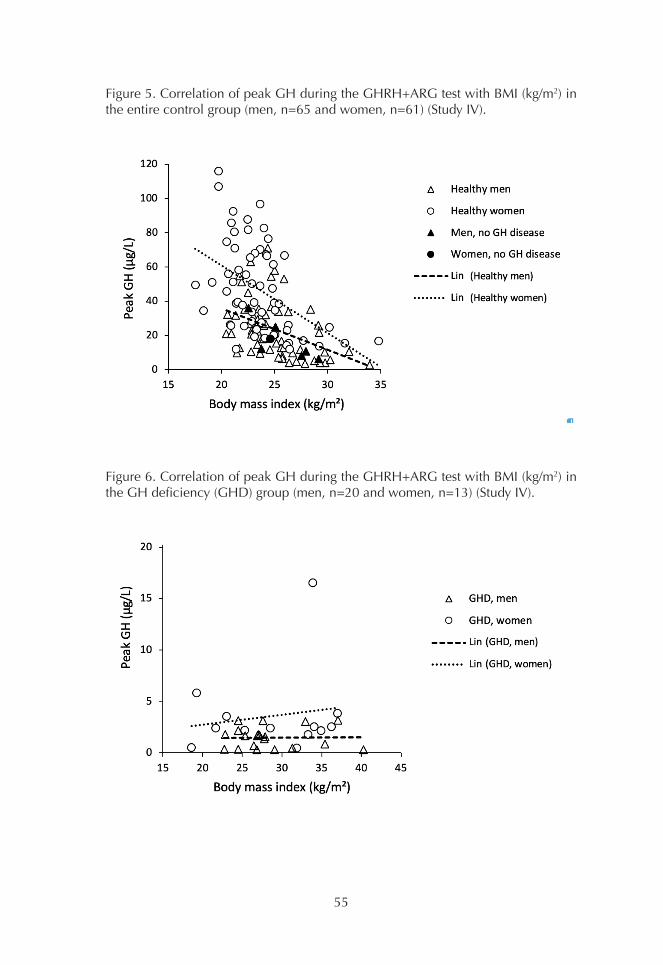
55
Figure 5. Correlation of peak GH during the GHRH+ARG test with BMI (kg/m2) in the entire control group (men, n=65 and women, n=61) (Study IV).
Figure 6. Correlation of peak GH during the GHRH+ARG test with BMI (kg/m2) in the GH deficiency (GHD) group (men, n=20 and women, n=13) (Study IV).
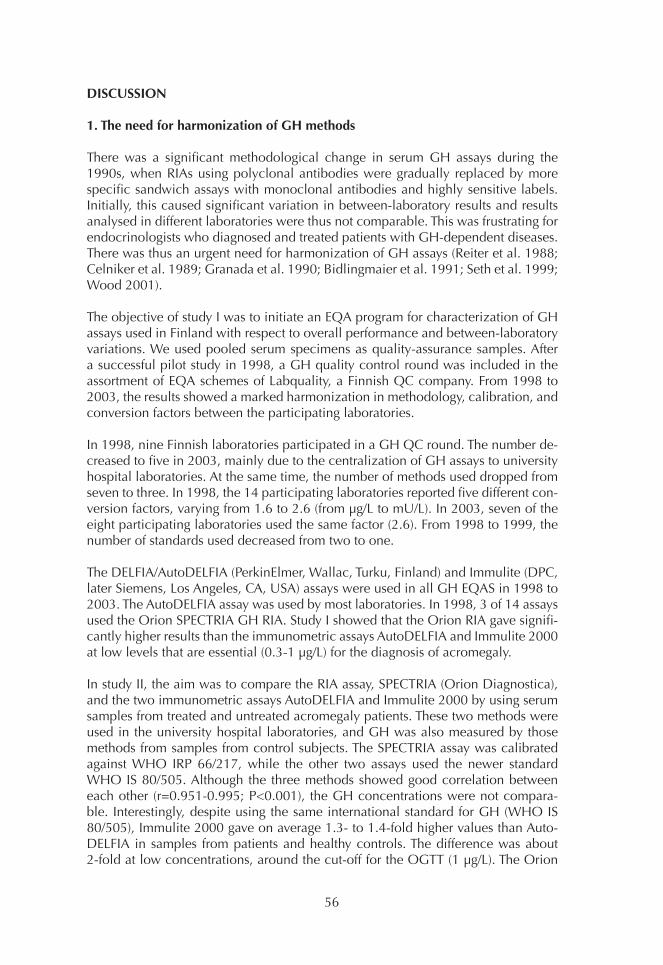
56
DISCUSSION
1. The need for harmonization of GH methods
There was a significant methodological change in serum GH assays during the 1990s, when RIAs using polyclonal antibodies were gradually replaced by more specific sandwich assays with monoclonal antibodies and highly sensitive labels. Initially, this caused significant variation in between-laboratory results and results analysed in different laboratories were thus not comparable. This was frustrating for endocrinologists who diagnosed and treated patients with GH-dependent diseases. There was thus an urgent need for harmonization of GH assays (Reiter et al. 1988; Celniker et al. 1989; Granada et al. 1990; Bidlingmaier et al. 1991; Seth et al. 1999; Wood 2001).
The objective of study I was to initiate an EQA program for characterization of GH assays used in Finland with respect to overall performance and between-laboratory variations. We used pooled serum specimens as quality-assurance samples. After a successful pilot study in 1998, a GH quality control round was included in the assortment of EQA schemes of Labquality, a Finnish QC company. From 1998 to 2003, the results showed a marked harmonization in methodology, calibration, and conversion factors between the participating laboratories.
In 1998, nine Finnish laboratories participated in a GH QC round. The number de-creased to five in 2003, mainly due to the centralization of GH assays to university hospital laboratories. At the same time, the number of methods used dropped from seven to three. In 1998, the 14 participating laboratories reported five different con-version factors, varying from 1.6 to 2.6 (from µg/L to mU/L). In 2003, seven of the eight participating laboratories used the same factor (2.6). From 1998 to 1999, the number of standards used decreased from two to one.
The DELFIA/AutoDELFIA (PerkinElmer, Wallac, Turku, Finland) and Immulite (DPC, later Siemens, Los Angeles, CA, USA) assays were used in all GH EQAS in 1998 to 2003. The AutoDELFIA assay was used by most laboratories. In 1998, 3 of 14 assays used the Orion SPECTRIA GH RIA. Study I showed that the Orion RIA gave signifi-cantly higher results than the immunometric assays AutoDELFIA and Immulite 2000 at low levels that are essential (0.3-1 µg/L) for the diagnosis of acromegaly.
In study II, the aim was to compare the RIA assay, SPECTRIA (Orion Diagnostica), and the two immunometric assays AutoDELFIA and Immulite 2000 by using serum samples from treated and untreated acromegaly patients. These two methods were used in the university hospital laboratories, and GH was also measured by those methods from samples from control subjects. The SPECTRIA assay was calibrated against WHO IRP 66/217, while the other two assays used the newer standard WHO IS 80/505. Although the three methods showed good correlation between each other (r=0.951-0.995; P<0.001), the GH concentrations were not compara-ble. Interestingly, despite using the same international standard for GH (WHO IS 80/505), Immulite 2000 gave on average 1.3- to 1.4-fold higher values than Auto-DELFIA in samples from patients and healthy controls. The difference was about 2-fold at low concentrations, around the cut-off for the OGTT (1 µg/L). The Orion
57
RIA method was not sufficiently sensitive to analyse GH concentrations <2 µg/L. This confirmed that there were large discrepancies when samples from individual subjects were analysed by different methods.
Our results showed that when using the same cut-off value of the OGTT (1 µg/L), acromegaly patients can be misclassified as being in biochemical remission or healthy depending on which method was used. Later, similar results were reported by other groups (Arafat et al. 2008; Rosario and Furtado 2008). The AutoDELFIA assay gave lower results than the other assays in the EQA assessments, as shown in the study of Pokrajac (Pokrajac et al. 2007). The lower results were at least partly explained by lack of recognition of the 20-kDa minor form of GH. Two monoclonal antibodies, which in combination did not recognize 20-kDa GH, were used in the AutoDELFIA. The Immulite 2000 assay uses a monoclonal-polyclonal combination, which according to the manufacturer recognizes 20-kDa GH.
In 2011, the GH Research, IGF Research and Pituitary Societies, and IFCC issued a consensus statement with recommendations to improve performance and com-parability of GH assays (Clemmons 2011). The recombinant hGH standard 98/574, which consists of 22-kDa GH, was assigned a biopotency of 3.0 IU/mg. The use of different units (µg/L and mU/L) may have caused misinterpretation. According to the consensus, the concentration of GH should therefore be expressed in mass units (µg/L) (Clemmons 2011). Since 2006, some of the major clinical endocrinolo-gy journals only accept manuscripts in which GH concentrations are expressed in µg/L and standardized against IS 98/574 (Trainer et al. 2006; Wieringa et al. 2014).
Meazza et al. demonstrated that when using the Immulite 2000 assay calibrated against IS 98/574, GH results were lower than with WHO IS 80/505 (Meazza et al. 2012). The average change was 23% and thus affected GHD diagnosis and the decision on when to start GH treatment in children (Chaler et al. 2013). In studies II and III, the GH concentrations were analysed by Immulite 2000 calibrated against IS 80/505. We observed that the GH concentrations were higher than with the Au-toDELFIA assay (also calibrated against IS 80/505). In study IV, GH was measured with the Immulite 2000 XPi, which was calibrated with the new standard WHO IS 98/574. This yielded on average the same GH results as the AutoDELFIA at concen-trations of 1 to 12 µg/L, which includes the cut-off in the OGTT and GHRH+ARG test. Thus, it is possible to use the same cut-off as established with the AutoDELFIA in the Study II.
In addition to the change in calibration, differences between the antibodies used, interference from GH-binding proteins, and matrix effects can cause large variation in GH results (Hansen et al. 2002). Thus, the results obtained by different GH as-says will rarely be completely comparable. The consensus guideline for GH assay performance suggests that method-specific cut-offs for each GH assay should be established (Clemmons 2011). The most important consensus recommendations for diagnosis and treatment monitoring of GH-related diseases advise the users to apply specific decision limits (the cut-offs for the immunometric or ultrasensitive GH assays) (Molitch et al. 2011; Katznelson et al. 2014; Melmed et al. 2018). The consensus guideline of acromegaly (Katznelson et al. 2014) recommends that it is crucial to use the same assay during treatment follow up. However, preservation

58
of the same assay has become increasingly difficult with laboratories undergoing frequent tendering cycles (D’Arcy et al. 2017).
Although a pure, chemically defined GH standard does not need to reflect all GH biology, the use of monomeric 22-kDa GH as a standard preparation is a good approximation (Popii and Baumann 2004). During the last 10 years, all major GH immunoassay manufacturers have adopted WHO IS 98/574 for calibration of GH assays (Ribeiro de Oliveira Longo Schweizer et al. 2018). Thus, the first step for harmonization of GH assays has been taken. National external quality assessments, as used in Finland since 1998, have played important roles in the recognition of between-method concentration differences (Bidlingmaier et al. 1991; Seth et al. 1999; Tanaka et al. 2005; Bidlingmaier and Freda 2010; Wieringa et al. 2014). Considering the intra- and inter-assay variations between methods, a single cut-off value for dynamic tests (as suggested in consensus guidelines) should be interpreted with caution.
2. OGTT in diagnosis of acromegaly in adults
A single basal serum GH determination is not a reliable test for diagnosing acrome-galy, as it does not properly distinguish acromegalic patients from healthy subjects. Traditionally the investigation of suspected acromegaly is initiated by measurement of IGF-1 combined with basal GH (Giustina et al. 2000; Trainer 2002). Epidemiolo-gical studies on acromegaly, which have investigated the correlation of GH levels with mortality rate, have mainly been based on either fasting or random serum GH concentrations. A meta-analysis suggested that a random GH result <2.5 µg/L with RIAs, which is roughly equivalent to <1 µg/L as measured by sensitive and specific sandwich assays, shows mortality rates similar to those expected in the normal po-pulation (Holdaway et al. 2008; Katznelson et al. 2011).
In study II, the basal GH concentration in control subjects ranged from a concen-tration below the detection limit to 12.2 µg/L and in untreated acromegalic patients from 6.9 to 44.6 µg/L by the AutoDELFIA assay. Thus, the results in acromegaly cle-arly overlapped with those in control subjects. In our study, there was also a male control subject with basal GH concentrations that varied from 0.07 and 0.05 to 5.35 µg/L at the basal state from three consecutive dynamic tests. Measurement of a random GH concentration lacks the specificity to make or exclude the diagnosis of acromegaly (Sata and Ho 2007).
The suppression of GH concentrations following an oral glucose load has been considered the ”gold standard” for verification of autonomous GH secretion. A nadir GH cut-off value for diagnosis and remission of acromegaly decreased when more sensitive and specific GH immunoassays were introduced into diagnostic use. In the years 2000 to 2014, the consensus concentration for the GH nadir cut-off in acromegaly diagnosis varied between 1 µg/L and 0.4 µg/L (Giustina et al. 2000; Melmed et al. 2009; Giustina et al. 2010; Katznelson et al. 2011; Katznelson et al. 2014). The latest consensus guideline suggests a nadir cut-off of 1.0 µg/L (Katznel-son et al. 2014). Recently, a GH nadir <0.4 µg/L was established as a criterium for successfully treated acromegaly (Melmed et al. 2018).

59
Study II in 2006 was one of the first large studies on apparently healthy subjects that evaluated the effect of the GH assay method and other confounding factors (e.g. gender) for nadir GH during the OGTT. In healthy subjects, the highest nadir GH concentrations were below 1.0 µg/L, but female subjects had significantly higher nadir GH concentrations than males (range 0.02-0.71 vs. 0.02-0.14 µg/L, respec-tively). After publication of study II, we studied nadir GH in an older age group (median age 49.2 years, range 22.8-61.0 years) and also observed a gender diffe-rence (range in women and men 0.02-0.40 vs. 0.02-0.09 µg/L, respectively). GH was measured by the AutoDELFIA assay, which was in routine use in our laboratory until 2015.
The results of study II support the use of different nadir cut-off values for men and women in the OGTT. The AutoDELFIA assay has also been used in other studies on healthy controls (Vierhapper et al. 2003; Pekic et al. 2006; Ronchi et al. 2007; Ro-sario and Furtado 2008; Verrua et al. 2011). Some studies confirmed our results on gender differences in GH concentrations (Ronchi et al. 2007; Rosario and Furtado 2008; Verrua et al. 2011). In contrast to these findings, Vierhapper et al. observed in 2003 an inverse relationship between nadir GH concentration and age and BMI, but not a gender difference (Vierhapper et al. 2003). In that study, the control group was older and heavier than in study II and also in comparison with the four other studies. Moreover, Vierhapper et al. did not report GH concentrations separately for men and women. Furthermore, the nadir GH concentrations in their study were quite high (0.1-3.8 µg/L) compared with the results of study II and others (Vierhap-per et al. 2003, Pekic et al. 2006; Ronchi et al. 2007; Rosario and Furtado 2008; Verrua et al. 2011).
Although many of the latest reports on controls and acromegalic subjects using other assays also support our findings that women have higher GH concentrations than men (Chapman et al. 1994; Colao et al. 2002a; Costa et al. 2002; Endert et al. 2006; Arafat et al. 2008; Colao et al. 2011), some other studies do not show this (Freda et al. 1998; Freda et al. 2001; Bancos et al. 2013). However, as early as 1987 Melmed and Fagin pointed out the gender difference in a review article. The upper limit of basal and nadir GH concentration were proposed to be 5 µg/L in men and 10 µg/L in women (Melmed and Fagin 1987). However, the gender difference in reference range or cut-off values for GH was not considered in the international consensus guidelines (Giustina et al. 2000; Giustina et al. 2010; Katznelson et al. 2011; Katznelson et al. 2014).
An age-related decrease in GH concentration during the OGTT has been reported in some studies (Costa et al. 2002; Vierhapper et al. 2003; Arafat et al. 2008; Colao et al. 2011), but not in others (Freda et al. 1998; Freda et al. 2001; Elias et al. 2010, Bancos et al. 2013). An age-dependent effect on GH has been found only in women in some studies (Costa et al. 2002). In study II including the older group analysis, the nadir GH did not correlate with age but correlated negatively with BMI, as also reported in other studies (Vierhapper et al. 2003; Arafat et al. 2008; Colao et al. 2011; Schilbach et al. 2019). A correlation between nadir GH and BMI has not been found in all studies (Freda et al. 1998; Bancos et al. 2013). Rosario et al. 2010 observed a correlation between nadir GH and BMI only in subjects with a BMI ≥30 kg/m2 but not with a BMI ≤27 kg/m2. Nadir GH cut-off values of 0.35 and 0.15 µg/L
60
were suggested for obese women and men, respectively, which were lower than those recommended for non-obese subjects (0.6 and 0.25 µg/L, respectively) (Rosa-rio et al. 2010). Colao et al. reported that subjects with waist circumference above 88 cm in women and 102 cm in men independently from age had the lowest GH nadir post-glucose (97th percentile value 0.16 µg/L), while premenopausal women with a waist circumference below 88 cm had the highest GH nadir (0.65 µg/L). No difference in GH nadir (0.33 µg/L) was found between men and postmenopausal women with a waist circumference below the safe threshold (Colao et al. 2011).
Since the study of Chapman et al. in 1994, many studies on OGTT in control sub-jects have proposed a cut-off value <1.0 µg/L (Chapman et al. 1994). Nadir GH in normal adults has been reported to be as low as 0.13 µg/L (Freda et al. 1998) and 0.15 µg/L (Serri et al. 2004). Several studies supported a cut-off of 1 µg/L to exclude acromegaly and reliably differentiate between active and adequately treated acro-megaly (Costa et al. 2002; De Marinis et al. 2002; Mercado et al. 2004). A nadir GH cut-off of 0.5 µg/L and 1 µg/L for the Immulite have been suggested (Feelders et al. 2005; Arafat et al. 2008). Presently, most authors consider a nadir GH con-centration over 0.3 µg/L or 0.4 µg/L during the OGTT adequate for the diagnosis of active acromegaly in patients with elevated IGF-1 concentrations (Freda et al. 1998; Cordero and Barkan 2008; Chanson et al. 2009; Katznelson et al. 2011; Ri-beiro-Oliveira et al. 2011).
In study II, using a GH cut-off of 1 µg/L in the OGTT, 85% of men (23/27) and 68% (30/44) of women with acromegaly were classified as biochemically adequately treated using the AutoDELFIA assay. Using a new remission consensus GH cut-off of 0.4 µg/L, 63% (17/27) of men and 50% (22/44) of women were classified as trea-ted. Thus, a greater proportion of men than women were classified as treated using both cut-off limits. If a lower cut-off value is used (<0.14-0.3 µg/L), still more treated women will be considered to have active acromegaly (Table 7).
In the control group (median age 33.8 years), the nadir GH was in the range 0.02 to 0.14 µg/L in men and 0.02 to 0.71 µg/L in women. In a younger female group (median 37.4 years, n=38) three women (age range 22.4-41.0 years old) had a nadir GH >0.4 µg/L (0.50-0.71 µg/L). Using the assay- and gender-specific cut-off values, more treated women than men are considered cured. Thus, the definition of a biochemically successfully treated patient is challenging. We do not know the follow-up history of these treated acromegaly patients, and we cannot know which nadir GH cut-off values are clinically correct. There are only a few studies with fol-low-up data in which the GH assay is considered in the interpretation of nadir GH results (Freda et al. 2004; Ronchi et al. 2007; Rosario and Calsolari 2015).
In study II, the AutoDELFIA results were compared with those of Immulite 2000. The correlation between the results was good, but the Immulite 2000 yielded values that were 37% higher than the AutoDELFIA. Thus, the choice of immunoassay has a significant influence on the interpretation of patient results. Using a consensus cut-off value of 1 µg/L for classifying treated acromegaly patients with AutoDELFIA and Immulite 2000, 85% to 82% of the treated acromegalic men were classified as being in remission, which is significantly higher than the 48% to 52% of men if we used the assay- and gender-specific cut-off values (0.14 µg/L for AutoDELFIA
61
and 0.25 µg/L for Immulite) determined with control subjects using these assays. The corresponding differences in acromegalic women were smaller, as there was a rather small difference between the assay-specific cut-off values (0.71 µg/L for AutoDELFIA and 1.30 µg/L for Immulite 2000) and the consensus value of 1 µg/L. Using the assay- and gender-specific cut-offs instead of the consensus cut-off, more women patients were classified as treated than men.
It has been confirmed in many studies that the nadir GH cut-off used to distinguish active acromegaly from remission should be assay-specific due to the considerable between-assay variation of GH levels (Pokrajac et al. 2007; Arafat et al. 2008; Ro-sario and Furtado 2008). In the study of Pokrajac et al., a serum sample known to give a borderline result in the OGTT was sent to all centres participating in the UK-NEQAS. The median GH value (n=104 laboratories) for the sample was 2.6 mU/L (range 1.04-3.5 mU/L) (Pokrajac et al. 2007).
In 2008, Arafat et al. defined an assay-specific cut-off limit of 1 µg/L for the Immu-lite and 0.5 µg/L for the Nichols method. Both methods were calibrated against IS 98/574. Immulite 2000 was calibrated against the IS 98/574 for hGH, but the calibrators consisted of pituitary extracts and the results should be multiplied by the factor 2.4 for the conversion of mass units to IU (although a factor of 3 is defined by WHO when the calibrators consist of recombinant hGH) (Arafat et al. 2008). Our first results with Immulite in 2006 (Study II), the results of Arafat et al. in 2008, and those with Immulite in 2017 (Study IV) were based on different conversion factors (2.6 IU/mg, 2.4 IU/mg, and 3.0 IU/mg, respectively); thus the results obtained by these methods are not comparable. Studies II and III demonstrated that the GH concentrations measured by the Immulite 2000 assay were higher than that of the AutoDELFIA assay. The GH concentrations were on average similar at the decision limits (0.3-12 µg/L) when using the AutoDELFIA and Immulite 2000 XPi (IS 98/574)assays in study IV. Thus, we could replace the AutoDELFIA with Immulite 2000 XPi.
Since 1982, the 75-g OGTT has been used in the diagnosis of diabetes mellitus and later acromegaly (Stewart et al. 1989). However, the protocol used in the OGTT is not always the same. For example, in some studies 100 g glucose or dextrose has been used (Freda et al. 2001; Dimaraki et al. 2002; Freda et al. 2003; Endert et al. 2006) or sample collection at 30 (Freda et al. 2001; Serri et al. 2004), 90 (Vierhap-per et al. 2003), or 120 minutes has been omitted (Endert et al. 2006). The use of either 75 g or 100 g glucose load does not affect the GH concentration (Rosario and Furtado 2008; Arafat et al. 2011). The association between peak glycaemia and amplitude of nadir GH is poor. However, the use of 75 g according to the consensus guideline is recommended (Giustina et al. 2000).
Good reproducibility of nadir GH in the OGTT with 75 g glucose was demonstra-ted in the study of Rosario and Furtado (Rosario and Furtado 2008). In 79 subjects who underwent a second test 4 weeks after the first, the between-test variation of nadir GH concentrations over three GH assays was <10.2% to <13.4% in 95% of the tests. The correlation between nadir GH concentrations in the OGTTs was very good (r=0.86-0.91; P<0.001) (Rosario and Furtado 2008). Arafat et al. found that GH nadirs obtained on three different occasions were highly reproducible in men. In women, the highest nadir GH was measured in the midcycle, when the level was

62
3 to 4 times higher than in the early follicular phase. Thus, in women the OGTT should be performed in the early follicular phase (Arafat et al. 2011). However, the menstrual phase has not been reported in all studies.
The biochemical markers of acromegaly, nadir GH during OGTT and serum IGF-1, usually give concordant results. However, discrepancies in test results can be anti-cipated with patients showing either persistent GH dysregulation (but normalized IGF-1 levels) or adequate GH suppression (but elevated IGF-1 levels) (Costa et al. 2002; Freda 2003; Vierhapper et al. 2003; Freda et al. 2004; Freda 2009). In a recent meta-analysis, the discordance rate between GH and IGF-1 concentrations in 39 studies of acromegalic patients was 25.7%, and most (15.3%) were of the “high IGF-1” type of discrepancy (Kanakis et al. 2016). Measurement of both GH and IGF-1 is complicated by a variety of factors, such as methodology and binding proteins. Thus, assay-specific reference ranges are crucial. A 2.5-fold between-labo-ratory variation in IGF-1 levels has been observed (Pokrajac et al. 2007). In 2016, Chanson et al. reported that concordance between the manufacturer’s reference intervals and those obtained in their cohort with six IGF-1 assays were generally poor (Chanson et al. 2016). There are several factors, conditions, and other diseases (Table 3) that can affect GH and IGF-1 concentrations (Freda 2009; Kanakis et al. 2016). Discordant results have also been reported in patients treated with soma-tostatin receptor ligands and in those with GH receptor polymorphisms (Melmed et al. 2018). Patients presenting discordant values should be monitored more closely and management of such patients should be individualized (Freda 2009; Kanakis et al. 2016).
Plasma IGF-1 concentrations represent an integrated measure of GH action. It has been shown that plasma IGF-1 concentration is more predictive of the degree of insulin resistance in acromegaly than plasma GH. In contrast to overweight patients with type 2 diabetes, insulin resistance in acromegaly is related to GH and IGF-1 excess in a lean phenotype with little visceral fat. Thus, IGF-1 may be a better mar-ker of disease activity and end organ damage than GH (Hannon et al. 2017).
It has been debated whether glucose-suppressed GH concentrations need to be as low as those found in healthy subjects to ensure adequate control of acromegaly. Excessively tight biochemical control of acromegaly can cause GH deficiency (Pe-kic et al. 2006). Using the Access Ultrasensitive hGH assay, Bancos et al. found that the best sensitivity and specificity to differentiate patients with acromegaly in remission from those with active disease were obtained using a cut-off of 0.53 µg/L in the OGTT. The maximum nadir GH concentration in healthy subjects was 0.3 µg/L (Bancos et al. 2013).
Rosario et al. studied 160 patients aged 18 to 70 years with clinical suspicion of acromegaly. Among women with basal GH >0.4 µg/L and normal IGF-1 concen-tration (70/88), 30% (21/70) exhibited GH nadir concentrations >0.4 µg/L, whereas GH nadir was <0.4 µg/L in all men with basal GH >0.4 µg/L and normal IGF-1 concentration (33/72). A nadir GH >0.4 µg/L in the OGTT was observed in 14/42 (33%) younger women (age<50 years) and in 7/46 (15.2%) women ≥50 years of age. A microadenoma was revealed only in 2/21 women, but no clinical progressi-on was observed over 4 years of follow up, although after 36 months a GH nadir in
63
the OGTT was still between 0.4 to 1 µg/L (0.6 and 0.7 µg/L, respectively) (Rosario and Calsolari 2015). Therefore, the assay- and gender-specific cut-off for nadir GH during OGTT is essential as demonstrated in study II. There are studies in which different GH and IGF-1 assays have been used during a study (Carmichael et al. 2009). It is questionable whether firm conclusions can be based on such data. The importance of the nadir cut-off value in the OGTT and early diagnosis cannot be emphasized enough.
3. Stimulation tests for the diagnosis of GH deficiency in adults
The ITT is regarded as the ”gold standard” test for assessment of adult GHD, alt-hough concerns about its reproducibility and specificity have been raised (Hoffman et al. 1994; Hoeck et al. 1995; Growth Hormone Research Society 1998; Pfeifer et al. 2001; Molitch et al. 2011). According to the consensus statement of 2011, the GH cut-off for severe GHD is <3 µg/L and for healthy subjects >5 µg/L (Molitch et al. 2011). The consensus statement also mentioned the study of Biller et al., in which a cut-off of 5.1 µg/L for the ITT was proposed using a sensitive, two-site assay (Biller et al. 2002; Molitch et al. 2011).
However, the results of study III demonstrated that using the AutoDELFIA assay, 28/63 (44%) and 38/63 (60%) healthy control subjects with adequate hypoglycae-mia had a peak GH <3 µg/L or <5 µg/L, respectively. A peak GH during ITT <3 µg/L or <5 µg/L with the Immulite 2000 was observed in 38% and 50%, respectively. The correlation between the GH results from the AutoDELFIA and Immulite 2000 assays was excellent (r=0.998; P<0.001), but the GH concentrations with Immulite 2000 were 48% higher than those with AutoDELFIA. Based on the ITT, many healthy subjects were classified as GHD by using the cut-offs of the consensus regardless of the assay method used.
The cut-off values of the consensus (<3 µg/L for severe GHD and >5 µg/L for healt-hy adults) were initially defined based on results determined by a polyclonal RIA calibrated against WHO IS 80/505 (Hoffman et al. 1994; Molitch et al. 2011). Sand-wich assays yield up to 50% lower GH results than RIAs (Biller et al. 2002). We confirmed this in studies I and II. However, using cut-offs of 2.5 µg/L or 1.5 µg/L, as many as 26/63 (41%) and 19/63 (30%) controls were below these cut-offs using the AutoDELFIA assay.
Among the 54 control subjects who had adequate hypoglycaemia (1.3-2.2 mmol/L) and a GH peak after baseline, the median GH peak response in the ITT was 3.55 µg/L (range 0.06-18.62 µg/L). Nadir plasma glucose did not correlate with the peak GH concentration or with the basal glucose concentrations, which ranged from 4.1 to 6.8 mmol/L. The GH peak response in the ITT did not correlate with age or with BMI. However, Qu et al. found a strong negative correlation (r=-0.65) between BMI and GH response in the ITT from healthy subjects (Qu et al. 2005).
In study III, 28 of the 63 properly hypoglycaemic subjects had a GH peak response in the ITT of <3 µg/L. They had also undergone the GHRH+ARG test. In this test, only two overweight men had subnormal peak responses (9.1 µg/L as the cut-off). Using the BMI-related cut-offs (11.5 µg/L, BMI<25 kg/m2; 8.0 µg/L, BMI 25-30 kg/m2;

64
4.2 µg/L, BMI>30 kg/m2), these men were also classified as deficient despite having normal IGF-1 concentrations. After study III, we performed the GHRH+ARG test for the remaining 54 subjects (n=30) who had plasma glucose ≤2.2 mmol/L in the ITT and a GH peak after baseline. In addition to those two men, there were two other men with a GH peak below the BMI-related cut-offs in the GHRH+ARG test (4.1 and 9.7 µg/L). However, these men had a GH peak of 11.1 and 7.1 µg/L in the ITT, respectively. Using the BMI-related cut-offs in the GHRH+ARG test, all 28 women had a GH peak over the cut-offs, although 13/28 had a GH peak <3 µg/L in the ITT. Twenty-two of 26 men were classified as normal using the GHRH+ARG test, but only 15 were classified as such using the ITT with a cut-off of 3 µg/L (Table 8).
Standardization of the ITT is ambiguous. Adequate hypoglycaemia (≤2.2 mmol/L) is needed for establishing GHD. The dose of insulin (0.05-0.2 IU/kg) used is not the same in all studies; the dose was 0.1-0.15 IU/kg in study III. Adequate hypoglyca-emia was not always achieved (study III), as also observed in previous studies (Jo-nes et al. 1994; Lange et al. 2002). Subjects with insulin resistance require higher insulin doses (0.15-0.2 IU/kg), which increases the risk of delayed hypoglycaemia. Frequent re-testing of blood glucose and BMI should be considered when selecting an insulin dose to avoid complications (Lange et al. 2002). It is also necessary to wait long enough for hypoglycaemic symptoms to achieve sufficient GH stimula-tion in the ITT (Borm et al. 2005). In study III, we continued the test as long as it was considered safe. All subjects considered the ITT unpleasant due to hypoglycaemic symptoms, but fortunately no severe complications occurred.
It was shown as early as in 1995 that the reproducibility of the ITT is poor both in healthy men and women. Hoeck et al. performed the ITT twice in eight men and eight women. No correlation between the results of the two tests was observed. In 4/8 healthy women, one of the two tests (25%) with adequate hypoglycaemia had peak GH values <5 µg/L with no correlation between the results. The lowest peak value was 0.09 µg/L in a female subject, who in the second ITT had a GH value of 17.9 µg/L. Low values were confirmed by a different assay. In that study, the sub-jects arrived at the hospital in the morning after an overnight fast and all women were tested in the early follicular phase. The participants were hypoglycaemic for a period of 15 to 45 minutes and oral glucose was given within 15 minutes after be-ginning of hypoglycaemia. The peak GH level in serum occurred 20 to 40 minutes after hypoglycaemia. There was no significant correlation between the fall in blood glucose or nadir blood glucose (median 1.3 mmol/L, range 0.8-2.0 mmol/L) and peak GH value. There was no correlation between the duration of hypoglycaemia and GH response in both genders. The test response did not correlate body weight (Hoeck et al. 1995).
Interestingly, in the study of Hoeck et al., the median peak GH concentrations in two tests were higher in males (27.9 and 30.5 µg/L) than in females (9.0 and 8.4 µg/L). The range of peak GH concentrations was 0.09 to 71.1 µg/L (Hoeck et al. 1995). In the study of Hoffman et al., the range was 5.3 to 42.5 µg/L. In that study, separate peak GH concentrations for males and females and data on the phase of menstrual cycle were not reported (Hoffman et al 1994).
65
Borm et al. showed that a shortened duration of hypoglycaemia by glucose infusion did not significantly reduce peak GH values (Borm et al. 2005). Later, a within-sub-ject peak GH variation of 4.6% to 59.3% was reported in the ITT in healthy young men. In that study, all healthy men had a peak GH concentration >5 µg/L (lowest peak 27 µg/L). The time between the ITTs was 3 to 14 days. No significant correla-tion was observed in any of these subjects between their GH peak concentrations (Pfeifer et al. 2001).
The conditions of testing are rarely precisely defined with respect to variables such as duration of fasting, heat exposure (e.g. a hot bath), or previous physical activity (Fisker et al. 1998b). In the study of Fisker, all participants were asked to avoid any major physical activity prior to hospitalization. The GH response was significantly decreased in the ITT when healthy subjects were tested after transportation to the hospital on the test day instead of the night before testing. Pre-testing factors may thus explain some of the variation in peak GH values in different studies (Fisker et al. 1998b). In study III, all subjects arrived at the hospital after an overnight fast and they were asked to avoid any major physical activity prior to hospitalization. The plasma glucose concentrations at baseline (median 5.5 mmol/L, range 3.9-6.8 mmol/L) suggested good compliance with fasting. Physical activity before ITT has been found to blunt the GH response to hypoglycaemia (Fisker et al. 1998b). This could explain part of our results. Another reason for lack of response in ITT may be an insufficient duration of hypoglycaemia, as serum cortisol did not increase from the basal value in five of the eight subjects with a low GH peak. One subject with a GH peak of 0.37 µg/L had a plasma glucose of 1.4 mmol/L at 30 minutes and remained <3 mmol/L for 90 minutes.
Interestingly, the ITT incorrectly diagnosed GHD (GH peak <3 µg/L) in almost half of the healthy subjects (Table 8). We analysed GH concentrations by two methods and thus the reason cannot be due to the assay differences. The ITT is not currently used in our hospital. Our experience with the ITT shows that new stimulation tests cannot be adopted into clinical use based on the literature without showing how it works in practice. Standardization of the ITT procedure is difficult.
Since 1996, the GHRH+ARG test has been considered the most appropriate pro-cedure for patient compliance and safety. No overlap was found between normal subjects (GH peak >16 µg/L) and GHD patients (GH peak <9.5 µg/L) when using a sandwich assay (IRMA, Sorin) (Ghigo et al. 1996; Valetto et al. 1996). These first studies did not show any difference between genders or correlation between peak GH and age (Ghigo et al. 1996; Valetto et al. 1996). In the study of Ghigo et al., all subjects were within ±15% of ideal body weight (Ghigo et al. 1996). Thus, BMI was not considered in the interpretation of GH stimulation results.
In 2002, Biller et al. obtained a cut-off of 4.1 µg/L in the GHRH+ARG test using a sandwich assay, which yielded on average a value half of those obtained with a polyclonal RIA. In that study, the average BMI of the controls was 30.3 kg/m2, which is common in GHD patients (Biller et al. 2002). In other studies, it has been shown that not only basal GH but also stimulated GH secretion is negatively correlated with BMI or obesity (Kopelman et al. 1985; Maccario et al. 1997; Maccario et al. 1999; Bonert et al. 2004; Qu et al. 2005; Colao et al. 2009). The functional GH
66
deficiency associated with excess weight confounds the interpretation of the GH response to stimulation tests; adult GHD patients are often overweight (Cuneo et al. 1992). In 2004, Bonert et al. demonstrated that BMI correlated negatively with the peak GH response (r=-0.59; P<0.01) in the GHRH+ARG test. Using a cut-off of 9 µg/L, the incidence of low values in obese (BMI ≥30 kg/m2) healthy men was 64% compared with 5% in subjects with a normal BMI (<25 kg/m2) (Bonert et al. 2004). Qu et al. also found a strong negative correlation (r=-0.76) between BMI and GH response in the GHRH+ARG test (Qu et al. 2005). In that study, the peak GH response to GHRH+ARG was higher in females than males, but the difference decreased after eliminating the influence of BMI (Qu et al. 2005). Already in 1967, the GH response to arginine has been found to be higher in females than in males (Parker et al. 1967).
A gender difference has been shown in three studies with control subjects. However, the significance of this difference for diagnosis of adult GHD was not emphasized (Aimaretti et al. 2000b; Biller et al. 2002; Carmichael et al. 2006). Colao et al. did not observe a gender effect but provided age- and BMI-specific cut-offs. In that stu-dy, the GH method was not reported and was changed during the study, which can affect the results (Colao et al. 2009).
According to the latest consensus statement from 2011, BMI-specific cut-offs for the GHRH+ARG test are better than a single cut-off of 4.1 µg/L, which was used in the study of Biller et al. (Biller et al. 2002; Molitch et al. 2011). Appropriate cut-off points for diagnosing GHD are 11.5 µg/L for those with a BMI <25 kg/m2, 8.0 µg/L for a BMI of 25-30 kg/m2, and 4.2 µg/L for those with a BMI ≥30 kg/m2 (Corneli et al. 2005; Molitch et al. 2011). These cut-offs are based on the study of Corneli et al., which compared 318 control subjects and 322 patients with organic hypotha-lamic-pituitary disease (Corneli et al. 2005).
Gender-related cut-off limits are not currently routinely used. Interestingly, in study IV, 14/65 (22%) control men had a GH peak value below the BMI-specific cut-off values. The peak GH value varied between 2.7 to 71.0 µg/L using the Immulite 2000 XPi assay. All control women had a normal GHRH+ARG response (GH 11.9-116.0 µg/L) when using the consensus cut-offs. All 61 control women had higher peak GH values (median 39.3 µg/L) than men (median 21 µg/L) and the gender dif-ference remained significant after adjustment for age and BMI. Except for a woman of 19.3 years with a peak GH of 16.3 µg/L, all patients had a deficient response compatible with a diagnosis of GHD. This young patient received oral oestrogen, which is known to reduce serum IGF-1 concentration and thus increase the GH concentration (Leung et al. 2004). On the other hand, it has been suggested that a higher cut-off value (15.9 µg/L) should be used for diagnosis of GHD in young adults (Dreismann et al. 2016).
In 2017, Deutschbein et al. reported that BMI- and gender-adjusted cut-offs impro-ve the diagnostic accuracy of GHD. After adjustment for BMI and gender in controls and using an immunoassay specifically measuring 22-kDa GH (iSYS, IDS), the op-timal cut-offs for men and women were 6.5 vs. 9.7 µg/L in lean, 3.5 vs. 8.5 µg/L in overweight, and 2.2 vs. 4.4 µg/L in obese subjects, respectively. Patients with only one pituitary hormone deficiency were included in the control group (Deutschbein
67
et al. 2017). The iSYS assay is calibrated against the latest IS 98/574 as is the Immu-lite 2000 XPi used in study IV. The iSYS assay measures only the 22-kDa isoform of GH. The optimal cut-offs especially in women were lower in that study than in study IV, in which all women had a GH peak higher than the BMI-specific cut-off of 11.5 µg/L for lean subjects.
The GHRH+ARG test is well tolerated and standardization of the procedure is eas-ier than for the ITT, as the dose of GHRH and arginine and the test protocol are the same for all cases. The GH response to the GHRH+ARG test shows good intra-indi-vidual reproducibility in GHD patients and in obese and healthy subjects (Valetto et al. 1996; Maccario et al. 1997; Chanson et al. 2010). However, studies of the GHRH +ARG test indicate that the proposed cut-off values may depend on the con-trols used (Biller et al. 2002; Bonert et al. 2004). Study IV confirmed that if the gen-der difference is not considered, which is the case in the present guidelines of adult GHD (Ho and GH Deficiency Consensus Workshop Participants 2007; Molitch et al. 2011), men are at risk of being falsely diagnosed as GH deficient. However, the GHRH+ARG test is better than the ITT for evaluation of GHD.
According to the present consensus statements, stimulation testing should not be conducted in cases where there is no indication of a history of hypothalamic-pitu-itary disease, because these tests have significant false-positive rates (Molitch et al. 2011; Yuen et al. 2016). Recently, new indications for GH stimulation tests have been suggested. These indications include traumatic brain injury and aneurysmal subarachnoid haemorrhage, which are known to cause a transient or persistent GHD (Molitch et al. 2011; Yuen et al. 2016). Thus, there is a need for stimulation tests and cut-off limits suitable for finding subjects with GHD.
4. Strengths of the study
One of the strengths of studies II to IV was that all female controls were studied during the follicular phase of the menstrual cycle (days 7-11) and none of them used oestrogens. All results were obtained by two different GH assay methods, AutoDELFIA and Immulite 2000 or Immulite 2000 XPi. Low GH peaks in the ITT were confirmed by measuring GH with two methods. The studies were performed in 2001 to 2015 and thus the effects using the GH methods with different assay ty-pes and the importance of proper standardization of the GH assay could be shown. Our results in studies I to II and IV have been confirmed in other studies (Pokrajac et al. 2007; Arafat et al. 2008; Rosario and Furtado 2008; Deutschbein et al. 2017).
5. Limitations of the study
Hormone measurements (FSH, LH, oestradiol, and progesterone), which are used to confirm the follicular phase, were not available. The number of obese subjects was small and a larger number of subjects would have increased the statistical power.
6. Clinical guidelines
GH in serum is stable, but the measurement of serum GH is challenging due to its heterogeneous nature, pulsatile secretion, and sensitivity to preanalytical factors

68
(e.g. fasting, exercise, stress, menstrual cycle, oral oestrogens). In females, the OGT test should preferably be performed in the early follicular phase, when GH concen-tration is low. The effect of the menstrual cycle on GH concentration is important when the results of nadir GH and S -IGF-1 are discordant. Furthermore, it is impor-tant to remember that low IGF-1 concentrations can be due to malnutrition and oral oestrogens. It also important to note that GH affects the metabolism of cortisol and thyroid hormones.
The current sandwich-type immunoassays use combinations of two monoclonal antibodies or a monoclonal antibody and a polyclonal antiserum. The originally used RIAs with polyclonal antibodies gave higher results, especially at low concen-trations. Presently, GH assays are standardized against recombinant 22-kDa GH (WHO IS 98/574). There are differences between assays due to the use of different antibodies, sensitivity to matrix effects, and interference by GHBPs. The Immulite 2000 XPi assay also measures 20-kDa GH. Thus, the results of the stimulation and suppression tests are assay specific. We could confirm that the AutoDELFIA assay and the present Immulite 2000 XPi assay yielded similar results in the clinically important concentration range (0.3-12 µg/L).
Suppression and stimulation tests are needed for diagnosing acromegaly and GH deficiency. The OGT test is most useful for diagnosis of active acromegaly, but gen-der-specific differences in cut-off values for nadir GH should be considered. Males have significantly lower nadir values than females. The effect of BMI on nadir GH in the OGTT should also be considered. Clinical follow-up studies with enough pa-tients are needed to establish nadir cut-off values (0.3-1 µg/L) that predict long-term outcome in each gender.
Although the ITT is used for diagnosing GH deficiency, according to our studies the ITT is not an optimal test for diagnosing GH deficiency in adults. The risk for false positive results is very high. Our results emphasize that the guidelines in consen-sus statements must be clinically validated before adopting them into routine use. The GHRH+ARG stimulation test is better for diagnosis of GH deficiency. Males have lower peak GH concentrations than females. GHD patients can be reliably identified when using BMI- and gender-specific cut-offs. Reference values for obese subjects should be established. The presently used BMI-specific GH cut-off values in males are too high. Using the Immulite 2000 XPi assay, the cut-off is the 2.5 per-centile (9.4 µg/L) in the group with normal BMI (n=36) and is 3.5 µg/L in the over-weight group (n=26). We must remember that in cases with hypothalamic causes of GHD (e.g. irradiation), the GHRH+ARG test may give false normal results as GHRH stimulates the pituitary directly.
We could not establish decision limits for suppression and stimulation tests in over-weight and obese subjects. However, our results indicated that the ITT cannot be considered the gold standard test for diagnosing GH deficiency in adults. Further-more, the decision limits for the OGT and GHRH+ARG tests recommended in consensus statements are not optimal. Both BMI and gender should be considered for evaluation of test results. Our results also show that assay specificity is a critical characteristic when measuring GH and establishing reference values. Establishment of reference and cut-off values is a long-term and laborious process. Therefore, it
69
is highly desirable that the laboratory does not change the assay method based on short-term savings.
7. New laboratory diagnostics of GH diseases in the near future
Soluble alpha-klotho (sKlotho) has been shown to correlate positively with IGF-1 and GH concentrations. It is synthesized mainly in the kidney, the choroid plexus in the brain, the pituitary, and the parathyroid gland. However, further clinical stu-dies are required to define its clinical usefulness in the diagnosis and follow up of acromegaly (Coopmans et al. 2020).
Macimorelin, a ghrelin receptor agonist, has been suggested as a new stimulant for diagnosing adult GHD. Advantages of this test include oral administration, greater reproducibility than other stimulation tests, and minimal side effects. In 2017 it was approved as a diagnostic test for GHD in adults in the USA and Europe (Klaus et al. 2020). However, further studies are needed before adopting to this test into clinical use.

70
SUMMARY AND CONCLUSIONS
In the 1990s, the shift from polyclonal to monoclonal antibodies and new stan-dard led to increased between-method variation of GH concentrations. Initially, the effects of these changes were not properly reported even if the consequences for diagnosis and follow up of GH diseases had been recognized in external qu-ality assessments and clinical studies, including studies I to IV and other studies (Bidlingmaier et al. 1991; Pokrajac et al. 2007; Arafat et al. 2008). The current GH standard consists of recombinant 22-kDa GH (IS 98/574) that has been assigned of a biopotency 3.0 IU/mg (Clemmons 2011).
The OGTT has been used for decades in the diagnosis of acromegaly. However, with more sensitive GH assays, nadir GH during OGTT has decreased from 5 µg/L to between 0.3 to 1 µg/L (Melmed and Fagin 1987; Katznelson et al. 2014).
According to the first consensus statement in 1998, the ITT has been considered the gold standard for diagnosing adult GHD, although there are concerns about repro-ducibility and side effects. Surprisingly, a cut-off of 3 µg/L for the ITT in diagnosing adult GH deficiency has been included in the consensus statements, although the procedure and calibration of GH assays have changed (Molitch et al. 2011). The GHRH+ARG test was considered to be the most promising alternative to the ITT in the consensus of 1998 (Growth Hormone Research Society 1998) and BMI-related cut-offs were introduced in the consensus of 2007 (Ho and GH Deficiency Consen-sus Workshop Participants 2007).
The following results were observed on the basis of the present work:
1. Study I showed that there was a significant variation between GH results of dif-ferent manufacturers in Finnish GH EQA at the beginning of 1998. A marked har-monization occurred in methodology, calibration, and conversion factors between the participating laboratories from 1998 to 2003. By the year 2003, all assays were calibrated against the standard WHO IS 80/505 and measured specifically or pre-dominantly the 22-kDa form of GH. The EQA of GH suggested that each assay manufacturer needs to provide exact information on basic characteristics, such as the isoforms detected by their GH assay, and the effects of changes in the assay procedure. There was also a need for assay-specific reference values.
2. While the Spectria RIA assay (Orion Diagnostica) and the two immunometric assays, AutoDELFIA (PerkinElmer) and Immulite 2000 (Siemens), showed good cor-relation between each other, the GH concentrations differed significantly between assays. Despite using the same international standard for GH (WHO IS 80/505), the Immulite 2000 gave on average 1.3- to 1.4-fold higher values than the AutoDELFIA. The Orion RIA method (WHO IRP 66/217), which uses polyclonal antibodies, was insensitive for measuring low GH concentrations <2 µg/L (Study II).
71
3. In the OGTT, control men had significantly lower nadir GH values than women, suggesting that different cut-off values for men and women are necessary. With the consensus cut-off limit (1 µg/L), more treated acromegaly patients (n=71) were classified as being in remission by the AutoDELFIA (68% women and 85% men) than by the Immulite assay (55% and 82%, respectively). Thus, the cut-off values for the diagnosis and follow up of GH diseases, which are mentioned in consensus statements and guidelines, cannot be adopted without validation with the GH assay used (Study II).
4. Our study suggested that the ITT is not a reliable test for GHD. Almost half of apparently healthy adults have peak GH values <3 µg/L, which is the cut-off for GHD recommended in the consensus statement of 2011. This cut-off value was established by older methods. In our studies, many control subjects (41-30%) were classified as having GHD even when using lower cut-offs (2.5-1.5 µg/L). These re-sults were obtained with the AutoDELFIA assay, but similar results (31-17%) were obtained with the Immulite 2000 assay (Study III).
5. In the GHRH+ARG test using the AutoDELFIA GH assay, all control women had a normal GH response when using the BMI-related consensus cut-offs (11.5 µg/L, BMI<25 kg/m2; 8.0 µg/L, 25-30 kg/m2; 4.2 µg/L, ≥30 kg/m2). However, 13/65 (20%) control men had a GH peak value below the BMI-specific cut-off values. Thus, not only BMI but also gender should be considered when establishing reference values.
6. The Immulite 2000 XPi assay, which is calibrated against the latest WHO IS 98/574, yielded sufficiently similar GH results as the AutoDELFIA assay, which was calibrated against IS 80/505. The AutoDELFIA assay was specific for 22-kDa GH, but the Immulite 2000 XPi assay also measures the 20-kDa GH form. There are differences in the antibodies used between assays. By using the Immulite 2000 XPi assay in the GHRH+ARG test, all women were classified as GH sufficient (11.9-116 µg/L), but 14/65 (22%) control men had a GH peak value below the BMI-specific cut-off values. The GHRH+ARG test with two assays classified GH deficiency pa-tients (n=33) identically; only one young woman had a peak GH value above the cut-off limit by both assays (Study IV).
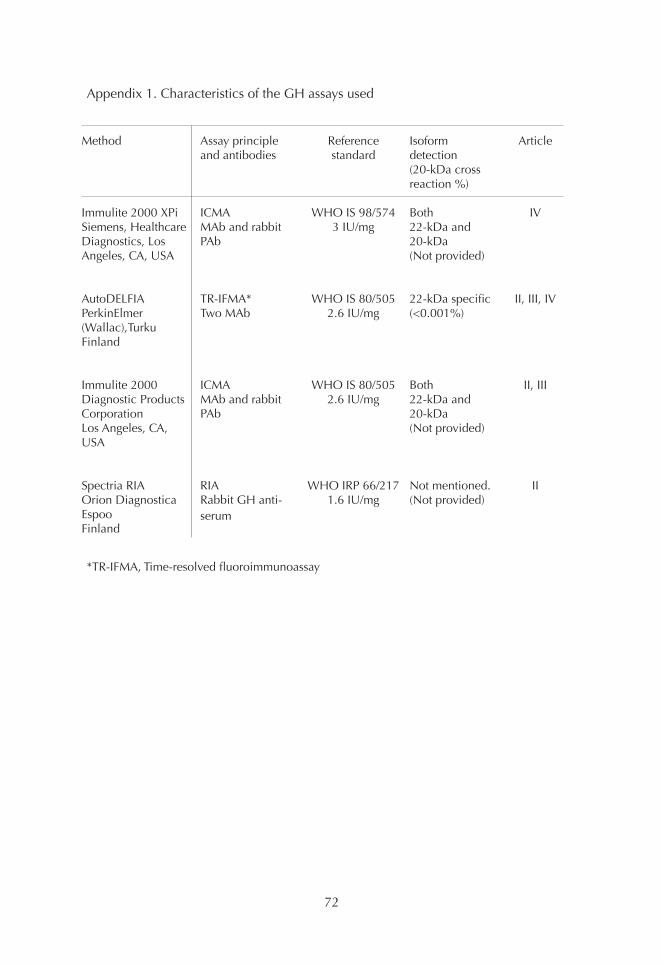
72
Appendix 1. Characteristics of the GH assays used
Method
Immulite 2000 XPiSiemens, Healthcare Diagnostics, Los Angeles, CA, USA
AutoDELFIAPerkinElmer(Wallac),TurkuFinland
Immulite 2000Diagnostic Products Corporation Los Angeles, CA, USA
Spectria RIAOrion DiagnosticaEspooFinland
Article
IV
II, III, IV
II, III
II
Isoformdetection (20-kDa cross reaction %)
Both22-kDa and20-kDa(Not provided)
22-kDa specific(<0.001%)
Both22-kDa and20-kDa(Not provided)
Not mentioned.(Not provided)
Reference standard
WHO IS 98/5743 IU/mg
WHO IS 80/5052.6 IU/mg
WHO IS 80/5052.6 IU/mg
WHO IRP 66/2171.6 IU/mg
Assay principle and antibodies
ICMAMAb and rabbit PAb
TR-IFMA*Two MAb
ICMAMAb and rabbit PAb
RIARabbit GH anti-serum
*TR-IFMA, Time-resolved fluoroimmunoassay
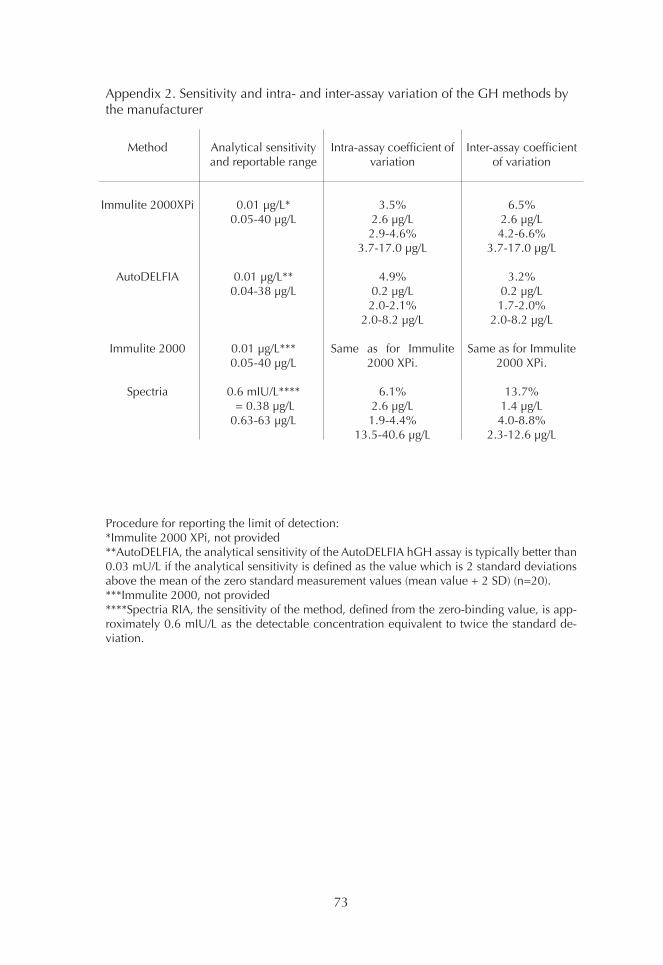
73
Appendix 2. Sensitivity and intra- and inter-assay variation of the GH methods by the manufacturer
Procedure for reporting the limit of detection:*Immulite 2000 XPi, not provided**AutoDELFIA, the analytical sensitivity of the AutoDELFIA hGH assay is typically better than 0.03 mU/L if the analytical sensitivity is defined as the value which is 2 standard deviations above the mean of the zero standard measurement values (mean value + 2 SD) (n=20).***Immulite 2000, not provided****Spectria RIA, the sensitivity of the method, defined from the zero-binding value, is app-roximately 0.6 mIU/L as the detectable concentration equivalent to twice the standard de-viation.
Method
Immulite 2000XPi
AutoDELFIA
Immulite 2000
Spectria
Inter-assay coefficient of variation
6.5%2.6 µg/L4.2-6.6%
3.7-17.0 µg/L
3.2%0.2 µg/L1.7-2.0%
2.0-8.2 µg/L
Same as for Immulite 2000 XPi.
13.7%1.4 µg/L4.0-8.8%
2.3-12.6 µg/L
Intra-assay coefficient of variation
3.5%2.6 µg/L2.9-4.6%
3.7-17.0 µg/L
4.9%0.2 µg/L2.0-2.1%
2.0-8.2 µg/L
Same as for Immulite 2000 XPi.
6.1%2.6 µg/L1.9-4.4%
13.5-40.6 µg/L
Analytical sensitivityand reportable range
0.01 µg/L*0.05-40 µg/L
0.01 µg/L**0.04-38 µg/L
0.01 µg/L***0.05-40 µg/L
0.6 mIU/L**** = 0.38 µg/L0.63-63 µg/L
74
ACKNOWLEDGEMENTS
This study was carried out at the Department of Clinical Chemistry and Haemato-logy, University of Helsinki and Diagnostic Center, Helsinki University Hospital. I want to thank Professor Kari Pulkki and Docent Chief physician Lotta Joutsi-Korho-nen for their encouraging support.
Professor emeritus Ulf-Håkan Stenman and Professor Esa Hämäläinen were the su-pervisors of this thesis. I am most grateful to them for their help, advice, and valua-ble criticism throughout this work over many years. I really appreciate and admire their wide knowledge of clinical chemistry.
I am deeply grateful to Docent Pertti Mörsky (Study I). He was the first person who introduced me to laboratory work, and that was in Tampere University Hospital Laboratory. I thank also production manager Ulla Tiikkainen at Labquality for her contribution (Study I).
I express my deepest gratitude to Professor emeritus Matti Välimäki and Docent Tuula Pekkarinen (Studies II-IV), as this study would not have been possible without their help, patients, and healthy controls. I appreciate their generous support. They always had time to answer my many questions.
My heartfelt thanks to Henrik Alfthan, PhD for drawing the Figures of article IV, providing the layout of this thesis, and for advice and continuous help over the decades.
Many special thanks go to the official reviewers, Docent Tapani Ebeling and Docent Pertti Koskinen. Their careful review, constructive criticism, and valuable comments greatly helped to improve this thesis.
I express my gratitude to Professor emeritus Timo Sane, Docent Ritva Kauppinen-Mä-kelin, Docent Camilla Schalin-Jäntti, and Docent Lasse Uotila for collaboration. I am very grateful to Docent Tuula Pekkarinen and Docent Camilla Schalin-Jäntti and their other colleagues who supervised the dynamic tests in the Endocrinology Clinic at Meilahti hospital.
I am also thankful for Ms Marketta Halinen, Ms Päivi Karpakka, and Ms Helena Ranta-aho for performing dynamic tests and Ms Leena Lehikoinen for taking care of the laboratory samples.
I am grateful for the all medical laboratory technologists for performing the analy-ses carefully and precisely in the HUSLAB laboratory in the Women’s Clinic and in Ulf-Håkan Stenman’s laboratory in Biomedicum. I warmly thank the whole staff of those laboratories for their kindness, support, and many discussions over the decades.
I thank my thesis committee members, Docent Ursula Turpeinen and Leena Lind-stedt, PhD for their support during this long journey.
75
I thank Tero Vahlberg for statistical analysis and Derek Ho for revising the language of this thesis. I am grateful that they always gave me exact answers for my many questions.
I thank Tiina Vierjoki from PerkinElmer Finland, and the staff of Siemens Healthine-ers Finland for collaboration in routine laboratory testing.
I thank PerkinElmer for supplying the GH reagents used in this study (Study II). This study was supported by grants from the Finska Läkaresällskapet, Research Funding of Helsinki University Central Hospital, and Foundation for Promoting Laboratory Medicine.
Finally, I want to thank my friend, psychiatrist Leena who repeated several times: “Do not think about the past or the future, think about the growth hormone!”
Helsinki, June 2021
76
REFERENCES
Acromegaly Therapy Consensus Development Panel. Consensus statement: benefits versus risks of medical therapy for acromegaly. Am J Med 97: 468-473, 1994.
Agustsson TT, Baldvinsdottir T, Jonasson JG, Olafsdottir E, Steinthorsdottir V, Sigurds-son G, Thorsson AV, Carroll PV, Korbonits M and Benediktsson R. The epidemiology of pituitary adenomas in Iceland, 1955-2012: a nationwide population-based study. Eur J Endocrinol 173: 655-664, 2015.
Aimaretti G, Baffoni C, Bellone S, Di Vito L, Corneli G, Arvat E, Benso L, Camanni F and Ghigo E. Retesting young adults with childhood-onset growth hormone (GH) deficiency with GH-releasing-hormone-plus-arginine test. J Clin Endocrinol Metab 85: 3693-3699, 2000a.
Aimaretti G, Baffoni C, DiVito L, Bellone S, Grottoli S, Maccario M, Arvat E, Ca-manni F and Ghigo E. Comparisons among old and new provocative tests of GH secretion in 178 normal adults. Eur J Endocrinol 142: 347-352, 2000b.
Aimaretti G, Corneli G, Baldelli R, Di Somma C, Gasco V, Durante C, Ausiello L, Rovere S, Grottoli S, Tamburrano G and Ghigo E. Diagnostic reliability of a single IGF-I measurement in 237 adults with total anterior hypopituitarism and severe GH deficiency. Clin Endocrinol (Oxf) 59: 56-61, 2003.
Aimaretti G, Corneli G, Razzore P, Bellone S, Baffoni C, Arvat E, Camanni F and Ghigo E. Comparison between insulin-induced hypoglycemia and growth hormo-ne (GH)-releasing hormone + arginine as provocative tests for the diagnosis of GH deficiency in adults. J Clin Endocrinol Metab 83: 615-1618, 1998a.
Aimaretti G, Corneli G, Razzore P, Bellone S, Baffoni C, Bellone J, Camanni F and Ghigo E. Usefulness of IGF-I assay for the diagnosis of GH deficiency in adults. J Endocrinol Invest 21: 506-511, 1998b.
Alba-Roth J, Müller OA, Schopohl J and von Werder K. Arginine stimulates growth hormone secretion by suppressing endogenous somatostatin secretion. J Clin Endo-crinol Metab 67: 1186-1189, 1988.
Alexander L, Appleton D, Hall R, Ross WM and Wilkinson R. Epidemiology of acro-megaly in the Newcastle region. Clin Endocrinol (Oxf) 12: 71-79, 1980.
Arafat AM, Möhlig M, Weickert MO, Perschel FH, Purschwitz J, Spranger J, Stras-burger CJ, Schöfl C and Pfeiffer AF. Growth hormone response during oral glucose tolerance test: the impact of assay method on the estimation of reference values in patients with acromegaly and in healthy controls, and the role of gender, age, and body mass index. J Clin Endocrinol Metab 93: 1254-1262, 2008.
77
Arafat AM, Müller L, Möhlig M, Mayr B, Kremenevskaya N, Pfeiffer AF, Buchfelder M and Schöfl C. Comparison of oral glucose tolerance test (OGTT) 100 g with OGTT 75 g for evaluation of acromegalic patients and the impact of gender on test reproducibility. Clin Endocrinol (Oxf) 75: 685-691, 2011.
Arosio M, Reimondo G, Malchiodi E, Berchialla P, Borraccino A, De Marinis L, Pi-vonello R, Grottoli S, Losa M, Cannavò S, Minuto F, Montini M, Bondanelli M, De Menis E, Martini C, Angeletti G, Velardo A, Peri A, Faustini-Fustini M, Tita P, Pigliaru F, Borretta G, Scaroni C, Bazzoni N, Bianchi A, Appetecchia M, Cavagnini F, Lom-bardi G, Ghigo E, Beck-Peccoz P, Colao A, Terzolo M and Italian Study Group of Acromegaly. Predictors of morbidity and mortality in acromegaly: an Italian survey. Eur J Endocrinol 167: 189-198, 2012.
Attanasio AF, Howell S, Bates PC, Blum WF, Frewer P, Quigley C and Shalet SM. Confirmation of severe GH deficiency after final height in patients diagnosed as GH deficient during childhood. Clin Endocrinol (Oxf) 56: 503-507, 2002.
Bancos I, Algeciras-Schimnich A, Woodmansee WW, Cullinane AK, Donato LJ, Nippoldt TB, Natt N and Erickson D. Determination of nadir growth hormone con-centration cut-offs in patients with acromegaly. Endocr Pract 19: 937-945, 2013.
Bangham DR, Gaines Das RE and Schulster D. The International Standard for Hu-man Growth Hormone for Bioassay: calibration and characterization by internatio-nal collaborative study. Mol Cell Endocrinol 42: 269-282, 1985.
Bates AS, Evans AJ, Jones P and Clayton RN. Assessment of GH status in adults with GH deficiency using serum growth hormone, serum insulin-like growth factor-I and urinary growth hormone excretion. Clin Endocrinol (Oxf) 42: 425-430, 1995.
Bates AS, Van’t Hoff W, Jones JM and Clayton RN. An audit of outcome of treatment in acromegaly. Q J Med 86: 293-299, 1993.
Baumann G. Growth hormone heterogeneity: genes, isohormones, variants, and binding proteins. Endocr Rev 12: 424-449, 1991.
Baumann GP. Growth hormone isoforms. Growth Horm IGF Res 19: 4: 333-340, 2009.
Baumann G, Shaw MA and Amburn K. Regulation of plasma growth hormone-bin-ding proteins in health and disease. Metabolism 38: 7: 683-689, 1989.
Bidlingmaier F, Geilenkeuser WJ, Kruse R and Röhle G. Our experience with qu-ality control in current growth hormone assays. Horm Res 36 Suppl 1: 1-4, 1991.
Bidlingmaier M and Freda PU. Measurement of human growth hormone by im-munoassays: current status, unsolved problems and clinical consequences. Growth Horm IGF Res 20: 19-25, 2010.
78
Bidlingmaier M, Friedrich N, Emeny RT, Spranger J, Wolthers OD, Roswall J, Körner A, Obermayer-Pietsch B, Hübener C, Dahlgren J, Frystyk J, Pfeiffer AF, Doering A, Bielohuby M, Wallaschofski H and Arafat AM. Reference intervals for insulin-like growth factor-1 (igf-i) from birth to senescence: results from a multicenter study using a new automated chemiluminescence IGF-I immunoassay conforming to recent international recommendations. J Clin Endocrinol Metab 99: 1712-1721, 2014.
Biller BM, Samuels MH, Zagar A, Cook DM, Arafah BM, Bonert V, Stavrou S, Klein-berg DL, Chipman JJ and Hartman ML. Sensitivity and specificity of six tests for the diagnosis of adult GH deficiency. J Clin Endocrinol Metab 87: 2067-2079, 2002.
Boguszewski CL, Hynsjö L, Johannsson G, Bengtsson BA and Carlsson LM. 22-kD growth hormone exclusion assay: a new approach to measurement of non-22-kD growth hormone isoforms in human blood. Eur J Endocrinol 135: 573-582, 1996.
Bonert VS, Elashoff JD, Barnett P and Melmed S. Body mass index determines evo-ked growth hormone (GH) responsiveness in normal healthy male subjects: diag-nostic caveat for adult GH deficiency. J Clin Endocrinol Metab 89: 3397-3401, 2004.
Borm K, Slawik M, Beuschlein F, Seiler L, Flohr F, Berg A, Koenig A and Reincke M. Low-dose glucose infusion after achieving critical hypoglycemia during insulin tolerance testing: effects on time of hypoglycemia, neuroendocrine stress response and patient’s discomfort in a pilot study. Eur J Endocrinol 153: 521-526, 2005.
Brabant G and Wallaschofski H. Normal levels of serum IGF-I: determinants and validity of current reference ranges. Pituitary 10: 129-133, 2007.
Bristow AF and Jespersen AM. The Second International Standard for somatropin (recombinant DNA-derived human growth hormone): preparation and calibration in an international collaborative study. Biologicals 29: 97-106, 2001.
Burton T, Le Nestour E, Neary M and Ludlam WH. Incidence and prevalence of acromegaly in a large US health plan database. Pituitary 19: 262-267, 2016.
Carmichael JD, Bonert VS, Mirocha JM and Melmed S. The utility of oral glucose to-lerance testing for diagnosis and assessment of treatment outcomes in 166 patients with acromegaly. J Clin Endocrinol Metab 94: 523-527, 2009.
Carmichael JD, Danoff A, Milani D, Roubenoff R, Lesser ML, Livote E, Reitz RE, Ferris S and Kleinberg DL. GH peak response to GHRH-arginine: relationship to in-sulin resistance and other cardiovascular risk factors in a population of adults aged 50-90. Clin Endocrinol (Oxf) 65: 169-177, 2006.

79
Carroll PV, Christ ER, Bengtsson BA, Carlsson L, Christiansen JS, Clemmons D, Hintz R, Ho K, Laron Z, Sizonenko P, Sönksen PH, Tanaka T and Thorne M. Growth hormone deficiency in adulthood and the effects of growth hormone replacement: a review. Growth Hormone Research Society Scientific Committee. J Clin Endocri-nol Metab 83: 382-395, 1998.
Celniker AC, Chen AB, Wert RM Jr and Sherman BM. Variability in the quantitation of circulating growth hormone using commercial immunoassays. J Clin Endocrinol Metab 68: 469-476, 1989.
Chaler EA, Ballerini G, Lazzati JM, Maceiras M, Frusti M, Bergada I, Rivarola MA, Belgorosky A and Ropelato G. Cut-off values of serum growth hormone (GH) in pharmacological stimulation tests (PhT) evaluated in short-statured children using a chemiluminescent immunometric assay (ICMA) calibrated with the International Recombinant Human GH Standard 98/574. Clin Chem Lab Med 51: 95-7, 2013.
Chanson P, Arnoux A, Mavromati M, Brailly-Tabard S, Massart C, Young J, Piketty ML, Souberbielle JC and VARIETE Investigators. Reference Values for IGF-I Serum Concentrations: Comparison of Six Immunoassays. J Clin Endocrinol Metab 101: 3450-3458, 2016.
Chanson P, Cailleux-Bounacer A, Kuhn JM, Weryha G, Chabre O, Borson-Chazot F, Dubois S, Vincent-Dejean C, Brue T, Fedou C, Bresson JL, Demolis P and Souber-bielle JC. Comparative validation of the growth hormone-releasing hormone and arginine test for the diagnosis of adult growth hormone deficiency using a growth hormone assay conforming to recent international recommendations. J Clin Endo-crinol Metab 95: 684-3692, 2010.
Chanson P, Salenave S, Kamenicky P, Cazabat L and Young J. Pituitary tumours: acromegaly. Best Pract Res Clin Endocrinol Metab 23: 555-574, 2009.
Chapman IM, Hartman ML, Straume M, Johnson ML, Veldhuis JD and Thorner MO. Enhanced sensitivity growth hormone (GH) chemiluminescence assay reveals lower postglucose nadir GH concentrations in men than women. J Clin Endocrinol Metab 78: 1312-1319, 1994.
Clasey JL, Weltman A, Patrie J, Weltman JY, Pezzoli S, Bouchard C, Thorner MO and Hartman ML. Abdominal visceral fat and fasting insulin are important predictors of 24-hour GH release independent of age, gender, and other physiological factors. J Clin Endocrinol Metab 86: 3845-3852, 2001.
Clayton PE, Cuneo RC, Juul A, Monson JP, Shalet SM, Tauber M and European So-ciety of Paediatric Endocrinology. Consensus statement on the management of the GH-treated adolescent in the transition to adult care. Eur J Endocrinol 152: 165-170, 2005.
80
Clemmons DR. The diagnosis and treatment of growth hormone deficiency in adults. Curr Opin Endocrinol Diabetes Obes 17: 377-383, 2010.
Clemmons DR. Consensus statement on the standardization and evaluation of growth hormone and insulin-like growth factor assays. Clin Chem 57: 555-559, 2011.
Clemmons DR, Van Wyk JJ, Ridgway EC, Kliman B, Kjellberg RN and Underwood LE. Evaluation of acromegaly by radioimmunoassay of somatomedin-C. N Engl J Med 301: 1138-1142, 1979.
Colao A, Amato G, Pedroncelli AM, Baldelli R, Grottoli S, Gasco V, Petretta M, Ca-rella C, Pagani G, Tambura G and Lombardi G. Gender- and age-related differences in the endocrine parameters of acromegaly. J Endocrinol Invest 25: 532-538, 2002a.
Colao A, Di Somma C, Salerno M, Spinelli L, Orio F and Lombardi G. The cardio-vascular risk of GH-deficient adolescents. J Clin Endocrinol Metab 87: 3650-3655, 2002b.
Colao A, Di Somma C, Savastano S, Rota F, Savanelli MC, Aimaretti G and Lom-bardi G. A reappraisal of diagnosing GH deficiency in adults: role of gender, age, waist circumference, and body mass index. J Clin Endocrinol Metab 94: 4414-4422, 2009.
Colao A, Ferone D, Marzullo P and Lombardi G. Systemic complications of acro-megaly: epidemiology, pathogenesis, and management. Endocr Rev 25: 102-152, 2004.
Colao A, Pivonello R, Auriemma RS, Grasso LF, Galdiero M, Pivonello C, Lombardi G and Savastano S. Growth hormone nadir during oral glucose load depends on waist circumference, gender and age: normative data in 231 healthy subjects. Clin Endocrinol (Oxf) 74: 234-240, 2011.
Cook DM, Yuen KC, Biller BM, Kemp SF, Vance ML and American Association of Clinical Endocrinologists. American Association of Clinical Endocrinologists medi-cal guidelines for clinical practice for growth hormone use in growth hormone-de-ficient adults and transition patients - 2009 update. Endocr Pract 15 Suppl 2: 1-29, 2009.
Coopmans EC, El-Sayed N, Frystyk J, Magnusson NE, Jørgensen JOL, van der Lely AJ, Janssen JAMJL, Muhammad A and Neggers SJCMM. Soluble Klotho: a possible predictor of quality of life in acromegaly patients. Endocrine 69: 165-174, 2020.
Cordero RA and Barkan AL. Current diagnosis of acromegaly. Rev Endocr Metab Disord 9: 13-19, 2008.
Corneli G, Di Somma C, Baldelli R, Rovere S, Gasco V, Croce CG, Grottoli S, Mac-cario M, Colao A, Lombardi G, Ghigo E, Camanni F and Aimaretti G. The cut-off limits of the GH response to GH-releasing hormone-arginine test related to body mass index. Eur J Endocrinol 153: 257-264, 2005.

81
Costa AC, Rossi A, Martinelli CE Jr, Machado HR and Moreira AC. Assessment of disease activity in treated acromegalic patients using a sensitive GH assay: should we achieve strict normal GH levels for a biochemical cure? J Clin Endocrinol Metab 87: 3142-3147, 2002.
Cuneo RC, Salomon F, McGauley GA and Sonksen PH. The growth hormone defi-ciency syndrome in adults. Clin Endocrinol (Oxf) 37: 387-397, 1992.
Cushing H. III. Partial hypophysectomy for acromegaly: with remarks on the func-tion of the hypophysis. Ann Surg 50: 1002-1017, 1909.
Cuttler L. The regulation of growth hormone secretion. Endocrinol Metab Clin North Am 25: 541-571, 1996.
D’Arcy R, Courtney CH, Graham U, Hunter S, McCance DR and Mullan K. Twenty-four-hour growth hormone profiling in the assessment of acromegaly. Endocrinol Diabetes Metab 1: e00007, 2017.
Darzy KH, Aimaretti G, Wieringa G, Gattamaneni HR, Ghigo E and Shalet SM. The usefulness of the combined growth hormone (GH)-releasing hormone and arginine stimulation test in the diagnosis of radiation-induced GH deficiency is dependent on the post-irradiation time interval. J Clin Endocrinol Metab 88: 95-102, 2003.
de Herder WW. The History of Acromegaly. Neuroendocrinology 103: 7-17, 2016.
De Marinis L, Mancini A, Bianchi A, Gentilella R, Valle D, Giampietro A, Zuppi P, Anile C, Maira G and Giustina A. Preoperative growth hormone response to thy-rotropin-releasing hormone and oral glucose tolerance test in acromegaly: a retro-spective evaluation of 50 patients. Metabolism 51: 616-621, 2002.
Dehkhoda F, Lee CMM, Medina J and Brooks AJ. The Growth Hormone Receptor: Mechanism of Receptor Activation, Cell Signaling, and Physiological Aspects. Front Endocrinol (Lausanne) 9: 35, 2018.
Dekkers OM, Biermasz NR, Pereira AM, Romijn JA and Vandenbroucke JP. Mortali-ty in acromegaly: a metaanalysis. J Clin Endocrinol Metab 93: 61-67, 2008.
Deutschbein T, Bidlingmaier M, Schopohl J, Strasburger CJ and Petersenn S. Anthro-pometric factors have significant influence on the outcome of the GHRH-arginine test: establishment of normative data for an automated immunoassay specifically measuring 22 kDa human growth hormone. Eur J Endocrinol 176: 273-281, 2017.
Dimaraki EV, Jaffe CA, DeMott-Friberg R, Chandler WF and Barkan AL. Acromegaly with apparently normal GH secretion: implications for diagnosis and follow-up. J Clin Endocrinol Metab 87: 3537-3542, 2002.
Dobrashian RD, O’Halloran DJ, Hunt A, Beardwell CG and Shalet SM. Relations-hips between insulin-like growth factor-1 levels and growth hormone concentra-tions during diurnal profiles and following oral glucose in acromegaly. Clin Endo-crinol (Oxf) 38: 589-593, 1993.
82
Dreismann L, Schweizer R, Blumenstock G, Weber K and Binder G. Evaluation of the GHRH-arginine retest for young adolescents with childhood-onset GH deficien-cy. Growth Horm IGF Res 27: 28-32, 2016.
Duncan E and Wass JA. Investigation protocol: acromegaly and its investigation. Clin Endocrinol (Oxf) 50: 285-293, 1999.
Ebdrup L, Fisker S, Sørensen HH, Ranke MB and Ørskov H. Variety in growth hor-mone determinations due to use of different immunoassays and to the interference of growth hormone-binding protein. Horm Res 51 Suppl 1: 20-26, 1999.
Elias PC, Lugao HB, Pereira MC, Machado HR, Castro M and Moreira AC. Discor-dant nadir GH after oral glucose and IGF-I levels on treated acromegaly: refining the biochemical markers of mild disease activity. Horm Metab Res 42: 50-55, 2010.
Endert E, van Rooden M, Fliers E, Prummel MF and Wiersinga WM. Establishment of reference values for endocrine tests - part V: acromegaly. Neth J Med 64: 230-235, 2006.
Esposito D, Ragnarsson O, Granfeldt D, Marlow T, Johannsson G and Olsson DS. Decreasing mortality and changes in treatment patterns in patients with acromegaly from a nationwide study. Eur J Endocrinol 178: 459-469, 2018.
Evans MJ, Livesey JH, Ellis MJ and Yandle TG. Effect of anticoagulants and storage temperatures on stability of plasma and serum hormones. Clin Biochem 34: 107-112, 2001.
Ezzat S, Forster MJ, Berchtold P, Redelmeier DA, Boerlin V and Harris AG. Acrome-galy. Clinical and biochemical features in 500 patients. Medicine (Baltimore) 73: 233-240, 1994.
Faria AC, Bekenstein LW, Booth RA Jr, Vaccaro VA, Asplin CM, Veldhuis JD, Thorner MO and Evans WS. Pulsatile growth hormone release in normal women during the menstrual cycle. Clin Endocrinol (Oxf) 36: 591-596, 1992.
Feelders RA, Bidlingmaier M, Strasburger CJ, Janssen JA, Uitterlinden P, Hofland LJ, Lamberts SW, van der Lely AJ and de Herder WW. Postoperative evaluation of patients with acromegaly: clinical significance and timing of oral glucose tolerance testing and measurement of (free) insulin-like growth factor I, acid-labile subunit, and growth hormone-binding protein levels. J Clin Endocrinol Metab 90: 6480-6489, 2005.
Felder RA, Holl RW, Martha P Jr, Bauler G, Hellman P, Wills MR and Thorner MO. Influence of matrix on concentrations of somatotropin measured in serum with commercial immunoradiometric assays. Clin Chem 35: 1423-1426, 1989.
Finkelstein JW, Roffwarg HP, Boyar RM, Kream J and Hellman L. Age-related change in the twenty-four-hour spontaneous secretion of growth hormone. J Clin Endocri-nol Metab 35: 665-670, 1972.
83
Fish HR, Chernow B and O’Brian JT. Endocrine and neurophysiologic responses of the pituitary to insulin-induced hypoglycemia: a review. Metabolism 35: 763-780, 1986.
Fisker S. Physiology and pathophysiology of growth hormone-binding protein: methodological and clinical aspects. Growth Horm IGF Res 16: 1-28, 2006.
Fisker S, Ebdrup L and Ørskov H. Influence of growth hormone binding protein on growth hormone estimation in different immunoassays. Scand J Clin Lab Invest 58: 373-381, 1998a.
Fisker S, Jørgensen JO, Ørskov H and Christiansen JS. L-arginine and insulin-tole-rance tests in the diagnosis of adult growth hormone deficiency: influence of con-founding factors. Clin Endocrinol (Oxf) 48: 109-115, 1998b.
Fisker S, Jørgensen JO, Vahl N, Ørskov H and Christiansen JS. Impact of gender and androgen status on IGF-I levels in normal and GH-deficient adults. Eur J Endocrinol 141: 601-608, 1999.
Frantz AG and Rabkin MT. Effects of estrogen and sex difference on secretion of human growth hormone. J Clin Endocrinol Metab 25: 1470-1480, 1965.
Freda PU. Current concepts in the biochemical assessment of the patient with acro-megaly. Growth Horm IGF Res 13: 171-184, 2003.
Freda PU. Monitoring of acromegaly: what should be performed when GH and IGF-1 levels are discrepant? Clin Endocrinol (Oxf) 71: 166-170, 2009.
Freda PU, Landman RE, Sundeen RE and Post KD. Gender and age in the biochemi-cal assessment of cure of acromegaly. Pituitary 4: 163-171, 2001.
Freda PU, Nuruzzaman AT, Reyes CM, Sundeen RE and Post KD. Significance of ”abnormal” nadir growth hormone levels after oral glucose in postoperative pa-tients with acromegaly in remission with normal insulin-like growth factor-I levels. J Clin Endocrinol Metab 89: 495-500, 2004.
Freda PU, Post KD, Powell JS and Wardlaw SL. Evaluation of disease status with sensitive measures of growth hormone secretion in 60 postoperative patients with acromegaly. J Clin Endocrinol Metab 83: 3808-3816, 1998.
Freda PU, Reyes CM, Nuruzzaman AT, Sundeen RE and Bruce JN. Basal and glu-cose-suppressed GH levels less than 1 microg/L in newly diagnosed acromegaly. Pituitary 6: 175-180, 2003.
Friend KE, Hartman ML, Pezzoli SS, Clasey JL and Thorner MO. Both oral and trans-dermal estrogen increase growth hormone release in postmenopausal women - a clinical research center study. J Clin Endocrinol Metab 81: 2250-2256, 1996.
84
Frystyk J, Freda P and Clemmons DR. The current status of IGF-I assays - a 2009 update. Growth Horm IGF Res 20: 8-18, 2010.
Furlanetto RW, Underwood LE, Van Wyk JJ and D’Ercole AJ. Estimation of somato-medin-C levels in normals and patients with pituitary disease by radioimmunoas-say. J Clin Invest 60: 648-657, 1977.
Gharib H, Cook DM, Saenger PH, Bengtsson BA, Feld S, Nippoldt TB, Rodbard HW, Seibel JA, Vance ML, Zimmerman D and American Association of Clinical Endocrinologists Growth Hormone Task Force. American Association of Clinical Endocrinologists medical guidelines for clinical practice for growth hormone use in adults and children - 2003 update. Endocr Pract 9: 64-76, 2003.
Ghigo E, Aimaretti G, Gianotti L, Bellone J, Arvat E and Camanni F. New approach to the diagnosis of growth hormone deficiency in adults. Eur J Endocrinol 134: 352-356, 1996.
Giavoli C, Libe R, Corbetta S, Ferrante E, Lania A, Arosio M, Spada A and Beck-Pec-coz P. Effect of recombinant human growth hormone (GH) replacement on the hy-pothalamic-pituitary-adrenal axis in adult GH-deficient patients. J Clin Endocrinol Metab 89: 5397-5401, 2004.
Giustina A, Barkan A, Casanueva FF, Cavagnini F, Frohman L, Ho K, Veldhuis J, Wass J, Von Werder K and Melmed S. Criteria for cure of acromegaly: a consensus statement. J Clin Endocrinol Metab 85: 526-529, 2000.
Giustina A, Chanson P, Bronstein MD, Klibanski A, Lamberts S, Casanueva FF, Trai-ner P, Ghigo E, Ho K, Melmed S and Acromegaly Consensus Group. A consensus on criteria for cure of acromegaly. J Clin Endocrinol Metab 95: 3141-3148, 2010.
Giustina A and Veldhuis JD. Pathophysiology of the neuroregulation of growth hor-mone secretion in experimental animals and the human. Endocr Rev 19: 717-797, 1998.
Gleeson HK, Gattamaneni HR, Smethurst L, Brennan BM and Shalet SM. Reassess-ment of growth hormone status is required at final height in children treated with growth hormone replacement after radiation therapy. J Clin Endocrinol Metab 89: 662-666, 2004.
Glick SM, Roth J, Yalow RS and Berson SA. Immunoassay of Human Growth Hor-mone in Plasma. Nature 199: 784-787, 1963.
Gomez JM, Maravall FJ, Gomez N, Navarro MA, Casamitjana R and Soler J. Inte-ractions between serum leptin, the insulin-like growth factor-I system, and sex, age, anthropometric and body composition variables in a healthy population randomly selected. Clin Endocrinol (Oxf) 58: 213-219, 2003.
Granada ML, Sanmarti A, Lucas A, Salinas I, Carrascosa A, Foz M and Audi L. As-say-dependent results of immunoassayable spontaneous 24-hour growth hormone secretion in short children. Acta Paediatr Scand Suppl 370: 63-70, 1990.

85
Granada ML, Ulied A, Casanueva FF, Pico A, Lucas T, Torres E and Sanmarti A. Serum IGF-I measured by four different immunoassays in patients with adult GH deficiency or acromegaly and in a control population. Clin Endocrinol (Oxf) 68: 942-950, 2008.
Grottoli S, Razzore P, Gaia D, Gasperi M, Giusti M, Colao A, Ciccarelli E, Gasco V, Martino E, Ghigo E and Camanni F. Three-hour spontaneous GH secretion profile is as reliable as oral glucose tolerance test for the diagnosis of acromegaly. J Endocri-nol Invest 26: 123-127, 2003.
Growth Hormone Research Society. Consensus guidelines for the diagnosis and treatment of adults with growth hormone deficiency: summary statement of the Growth Hormone Research Society Workshop on Adult Growth Hormone Defi-ciency. J Clin Endocrinol Metab 83: 379-381, 1998.
Growth Hormone Research Society and Pituitary Society. Biochemical assessment and long-term monitoring in patients with acromegaly: statement from a joint consensus conference of the Growth Hormone Research Society and the Pituitary Society. J Clin Endocrinol Metab 89: 3099-3102, 2004.
Gullu S, Keles H, Delibasi T, Tonyukuk V, Kamel N and Erdogan G. Remission cri-teria for the follow-up of patients with acromegaly. Eur J Endocrinol 150: 465-471, 2004.
Hall K, Hilding A and Thoren M. Determinants of circulating insulin-like growth factor-I. J Endocrinol Invest 22: 5 Suppl: 48-57, 1999.
Hannon AM, Thompson CJ and Sherlock M. Diabetes in patients with acromegaly. Curr Diab Rep 17: 8, 2017.
Hansen TK, Fisker S, Hansen B, Sørensen HH, Christiansen JS, Jørgensen JO and Ørskov H. Impact of GHBP interference on estimates of GH and GH pharmacoki-netics. Clin Endocrinol (Oxf) 57: 779-786, 2002.
Hanssen KF. Immunoreactive growth hormone in human urine. Acta Endocrinol (Copenh) 71: 665-676, 1972.
Hartman ML, Crowe BJ, Biller BM, Ho KK, Clemmons DR, Chipman JJ, HyposCCS Advisory Board and U.S. HypoCCS Study Group. Which patients do not require a GH stimulation test for the diagnosis of adult GH deficiency? J Clin Endocrinol Metab 87: 477-485, 2002.
Hartman ML, Veldhuis JD and Thorner MO. Normal control of growth hormone secretion. Horm Res 40: 37-47, 1993.
Hashimoto Y, Ikeda I, Ikeda M, Takahashi Y, Hosaka M, Uchida H, Kono N, Fukui H, Makino T and Honjo M. Construction of a specific and sensitive sandwich enzyme immunoassay for 20 kDa human growth hormone. J Immunol Methods 221: 77-85, 1998.
86
Hattori N, Shimatsu A, Kato Y, Koshiyama H, Ishikawa Y, Assadian H, Tanoh T, Na-gao M and Imura H. Growth hormone responses to oral glucose loading measu-red by highly sensitive enzyme immunoassay in normal subjects and patients with glucose intolerance and acromegaly. J Clin Endocrinol Metab 70: 771-776, 1990.
Hilding A, Hall K, Wivall-Helleryd IL, Sääf M, Melin AL and Thoren M. Serum levels of insulin-like growth factor I in 152 patients with growth hormone deficiency, aged 19-82 years, in relation to those in healthy subjects. J Clin Endocrinol Metab 84: 2013-2019, 1999.
Ho KK and 2007 GH Deficiency Consensus Workshop Participants. Consensus gui-delines for the diagnosis and treatment of adults with GH deficiency II: a statement of the GH Research Society in association with the European Society for Pediatric Endocrinology, Lawson Wilkins Society, European Society of Endocrinology, Japan Endocrine Society, and Endocrine Society of Australia. Eur J Endocrinol 157: 695-700, 2007.
Ho KY, Evans WS, Blizzard RM, Veldhuis JD, Merriam GR, Samojlik E, Furlanetto R, Rogol AD, Kaiser DL and Thorner MO. Effects of sex and age on the 24-hour profile of growth hormone secretion in man: importance of endogenous estradiol concen-trations. J Clin Endocrinol Metab 64: 51-58, 1987.
Ho KY and Weissberger AJ. Characterization of 24-hour growth hormone secretion in acromegaly: implications for diagnosis and therapy. Clin Endocrinol (Oxf) 41: 75-83, 1994.
Hoeck HC, Vestergaard P, Jakobsen PE and Laurberg P. Test of growth hormone se-cretion in adults: poor reproducibility of the insulin tolerance test. Eur J Endocrinol 133: 305-312, 1995.
Hoffman DM, O’Sullivan AJ, Baxter RC and Ho KK. Diagnosis of growth-hormone deficiency in adults. Lancet 343: 1064-1068, 1994.
Holdaway IM, Bolland MJ and Gamble GD. A meta-analysis of the effect of lowering serum levels of GH and IGF-I on mortality in acromegaly. Eur J Endocrinol 159: 89-95, 2008.
Holdaway IM, Rajasoorya RC and Gamble GD. Factors influencing mortality in acromegaly. J Clin Endocrinol Metab 89: 667-674, 2004.
Hoskuldsdottir GT, Fjalldal SB and Sigurjonsdottir HA. The incidence and preva-lence of acromegaly, a nationwide study from 1955 through 2013. Pituitary 18: 803-807, 2015.
Iranmanesh A, Lizarralde G and Veldhuis JD. Age and relative adiposity are specific negative determinants of the frequency and amplitude of growth hormone (GH) se-cretory bursts and the half-life of endogenous GH in healthy men. J Clin Endocrinol Metab 73: 1081-1088, 1991.
87
Jan T, Shaw MA and Baumann G. Effects of growth hormone-binding proteins on se-rum growth hormone measurements. J Clin Endocrinol Metab 72: 387-391, 1991.
Jansson C, Boguszewski C, Rosberg S, Carlsson L and Albertsson-Wikland K. Growth hormone (GH) assays: influence of standard preparations, GH isoforms, as-say characteristics, and GH-binding protein. Clin Chem 43: 6 Pt 1: 950-956, 1997.
Jones SL, Trainer PJ, Perry L, Wass JA, Bessser GM and Grossman A. An audit of the insulin tolerance test in adult subjects in an acute investigation unit over one year. Clin Endocrinol (Oxf) 41: 123-128, 1994.
Jørgensen JO, Christensen JJ, Vestergaard E, Fisker S, Ovesen P and Christiansen JS. Sex steroids and the growth hormone/insulin-like growth factor-I axis in adults. Horm Res 64 Suppl 2: 37-40, 2005.
Jørgensen JO, Pedersen SA, Thuesen L, Jørgensen J, Ingemann-Hansen T, Skakke-baek NE and Christiansen JS. Beneficial effects of growth hormone treatment in GH-deficient adults. Lancet 1: 1221-1225, 1989.
Juul A. Serum levels of insulin-like growth factor I and its binding proteins in health and disease. Growth Horm IGF Res 13: 113-170, 2003.
Kalavalapalli S, Reid H, Kane J, Buckler H, Trainer P and Heald AH. Silent growth hormone secreting pituitary adenomas: IGF-1 is not sufficient to exclude growth hormone excess. Ann Clin Biochem 44: 89-93, 2007.
Kanakis GA, Chrisoulidou A, Bargiota A, Efstathiadou ZA, Papanastasiou L, Theo-doropoulou A, Tigas SK, Vassiliadi DA, Tsagarakis S and Alevizaki M. The ongoing challenge of discrepant growth hormone and insulin-like growth factor I results in the evaluation of treated acromegalic patients: a systematic review and meta-analy-sis. Clin Endocrinol (Oxf) 85: 681-688, 2016.
Katznelson L, Atkinson JL, Cook DM, Ezzat SZ, Hamrahian AH, Miller KK and Ame-rican Association of Clinical Endocrinologists. American Association of Clinical En-docrinologists medical guidelines for clinical practice for the diagnosis and treat-ment of acromegaly - 2011 update. Endocr Pract 17 Suppl 4: 1-44, 2011.
Katznelson L, Laws ER Jr, Melmed S, Molitch ME, Murad MH, Utz A, Wass JA and Endocrine Society. Acromegaly: an endocrine society clinical practice guideline. J Clin Endocrinol Metab 99: 3933-3951, 2014.
Kauppinen-Mäkelin R, Sane T, Reunanen A, Välimäki MJ, Niskanen L, Markkanen H, Löyttyniemi E, Ebeling T, Jaatinen P, Laine H, Nuutila P, Salmela P, Salmi J, Sten-man UH, Viikari J and Voutilainen E. A nationwide survey of mortality in acromega-ly. J Clin Endocrinol Metab 90: 4081-4086, 2005.
Ketelslegers JM, Maiter D, Maes M, Underwood LE and Thissen JP. Nutritional re-gulation of insulin-like growth factor-I. Metabolism 44: 10 Suppl 4: 50-57, 1995.
88
Kim EH, Oh MC, Lee EJ and Kim SH. Predicting long-term remission by measuring immediate postoperative growth hormone levels and oral glucose tolerance test in acromegaly. Neurosurgery 70: 1106-13; discussion 1113, 2012.
Klaus B, Sachse R, Ammer N, Kelepouris N and Ostrow V. Safety, tolerability, phar-macokinetics, and pharmacodynamics of macimorelin in healthy adults: Results of a single-dose, randomized controlled study. Growth Horm IGF Res 52: 101321, 2020.
Koch TK, Berg BO, De Armond SJ and Gravina RF. Creutzfeldt-Jakob disease in a young adult with idiopathic hypopituitarism. Possible relation to the administration of cadaveric human growth hormone. N Engl J Med 313: 731-733, 1985.
Kojima M and Kangawa K. Ghrelin: structure and function. Physiol Rev 85: 495-522, 2005.
Kopchick JJ, Berryman DE, Puri V, Lee KY and Jørgensen JOL. The effects of growth hormone on adipose tissue: old observations, new mechanisms. Nat Rev Endocri-nol 16: 135-146, 2020.
Kopelman PG, Noonan K, Goulton R and Forrest AJ. Impaired growth hormone response to growth hormone releasing factor and insulin-hypoglycaemia in obesity. Clin Endocrinol (Oxf) 23: 87-94, 1985.
Krieger MD, Couldwell WT and Weiss MH. Assessment of long-term remission of acromegaly following surgery. J Neurosurg 98: 719-724, 2003.
Lange M, Svendsen OL, Skakkebaek NE, Müller J, Juul A, Schmiegelow M and Feldt-Rasmussen U. An audit of the insulin-tolerance test in 255 patients with pitu-itary disease. Eur J Endocrinol 147: 41-47, 2002.
Laron Z. Laron syndrome (primary growth hormone resistance or insensitivity): the personal experience 1958-2003. J Clin Endocrinol Metab 89: 1031-1044, 2004.
Lavrentaki A, Paluzzi A, Wass JA and Karavitaki N. Epidemiology of acromegaly: review of population studies. Pituitary 20: 4-9, 2017
Léger J, Reverchon C, Porquet D, Noel M and Czernichow P. The wide variation in urinary excretion of human growth hormone in normal growing and growth hor-mone-deficient children limits its clinical usefulness. Horm Res 44: 57-63, 1995.
Leung KC, Howe C, Gui LY, Trout G, Veldhuis JD and Ho KK. Physiological and pharmacological regulation of 20-kDa growth hormone. Am J Physiol Endocrinol Metab 283: 836-843, 2002.
Leung KC, Johannsson G, Leong GM and Ho KK. Estrogen regulation of growth hormone action. Endocr Rev 25: 693-721, 2004.
89
Lewis UJ, Dunn JT, Bonewald LF, Seavey BK and Vanderlaan WP. A naturally oc-curring structural variant of human growth hormone. J Biol Chem 253: 2679-2687, 1978.
Li CH and Dixon JS. Human pituitary growth hormone. XXXII. The primary structure of the hormone: revision. Arch Biochem Biophys 146: 233-236, 1971.
Li CH and Papkoff H. Preparation and properties of growth hormone from human and monkey pituitary glands. Science 124: 1293-1294, 1956.
Lima GAB, Gadelha MR, Strasburger CJ and Wu Z. Serum levels of 20K-hGH and 22K-hGH isoforms in acromegalic patients. Front Horm Res 38: 87-93, 2010.
Lissett CA, Jönsson P, Monson JP, Shalet SM and KIMS International Board. Determi-nants of IGF-I status in a large cohort of growth hormone-deficient (GHD) subjects: the role of timing of onset of GHD. Clin Endocrinol (Oxf) 59: 773-778, 2003.
Maccario M, Gauna C, Procopio M, Di Vito L, Rossetto R, Oleandri SE, Grottoli S, Ganzaroli C, Aimaretti G and Ghigo E. Assessment of GH/IGF-I axis in obesity by evaluation of IGF-I levels and the GH response to GHRH+arginine test. J Endocrinol Invest 22: 424-429, 1999.
Maccario M, Valetto MR, Savio P, Aimaretti G, Baffoni C, Procopio M, Grottoli S, Oleandri SE, Arvat E and Ghigo E. Maximal secretory capacity of somatotrope cells in obesity: comparison with GH deficiency. Int J Obes Relat Metab Disord 21: 27-32, 1997.
Maione L and Chanson P. National acromegaly registries. Best Pract Res Clin Endo-crinol Metab 33: 101264, 2019.
Manolopoulou J, Alami Y, Petersenn S, Schopohl J, Wu Z, Strasburger CJ and Bid-lingmaier M. Automated 22-kD growth hormone-specific assay without interferen-ce from Pegvisomant. Clin Chem 58: 1446-1456, 2012.
Martha PM Jr, Gorman KM, Blizzard RM, Rogol AD and Veldhuis JD. Endogenous growth hormone secretion and clearance rates in normal boys, as determined by deconvolution analysis: relationship to age, pubertal status, and body mass. J Clin Endocrinol Metab 74: 336-344, 1992.
Marzullo P, Di Somma C, Pratt KL, Khosravi J, Diamandis A, Lombardi G, Colao A and Rosenfeld RG. Usefulness of different biochemical markers of the insulin-like growth factor (IGF) family in diagnosing growth hormone excess and deficiency in adults. J Clin Endocrinol Metab 86: 3001-3008, 2001.
Massart C and Poirier JY. Serum insulin-like growth factor-I measurement in the fol-low-up of treated acromegaly: comparison of four immunoassays. Clin Chim Acta 373: 176-179, 2006.
90
Meazza C, Albertini R, Pagani S, Sessa N, Laarej K, Falcone R, Bozzola E, Calcaterra V and Bozzola M. Diagnosis of growth hormone deficiency is affected by calibra-tors used in GH immunoassays. Horm Metab Res 44: 900-903, 2012.
Melmed S. Acromegaly pathogenesis and treatment. J Clin Invest 119: 3189-3202, 2009.
Melmed S. Idiopathic adult growth hormone deficiency. J Clin Endocrinol Metab 98: 2187-2197, 2013.
Melmed S, Bronstein MD, Chanson P, Klibanski A, Casanueva FF, Wass JAH, St-rasburger CJ, Luger A, Clemmons DR and Giustina A. A Consensus Statement on acromegaly therapeutic outcomes. Nat Rev Endocrinol 14: 552-561, 2018.
Melmed S, Casanueva F, Cavagnini F, Chanson P, Frohman LA, Gaillard R, Ghigo E, Ho K, Jaquet P, Kleinberg D, Lamberts S, Laws E, Lombardi G, Sheppard MC, Thorner M, Vance ML, Wass JA and Giustina A. Consensus statement: medical ma-nagement of acromegaly. Eur J Endocrinol 153: 737-740, 2005.
Melmed S, Colao A, Barkan A, Molitch M, Grossman AB, Kleinberg D, Clemmons D, Chanson P, Laws E, Schlechte J, Vance ML, Ho K, Giustina A and Acromegaly Consensus Group. Guidelines for acromegaly management: an update. J Clin Endo-crinol Metab 94: 1509-1517, 2009.
Melmed S and Fagin JA. Acromegaly update - etiology, diagnosis and management. West J Med 146: 328-336, 1987.
Melmed S, Jackson I, Kleinberg D and Klibanski A. Current treatment guidelines for acromegaly. J Clin Endocrinol Metab 83: 2646-2652, 1998.
Mercado M, Espinosa de los Monteros AL, Sosa E, Cheng S, Mendoza V, Hernández I, Sandoval C, Guinto G and Molina M. Clinical-biochemical correlations in acro-megaly at diagnosis and the real prevalence of biochemically discordant disease. Horm Res 62: 293-299, 2004.
Mercado M, Gonzalez B, Vargas G, Ramirez C, de los Monteros AL, Sosa E, Jervis P, Roldan P, Mendoza V, López-Félix B and Guinto G. Successful mortality reduction and control of comorbidities in patients with acromegaly followed at a highly spe-cialized multidisciplinary clinic. J Clin Endocrinol Metab 99: 12: 4438-4446, 2014.
Mestrón A, Webb SM, Astorga R, Benito P, Catalá M, Gaztambide S, Gómez JM, Halperin I, Lucas-Morante T, Moreno B, Obiols G, de Pablos P, Páramo C, Picó A, Torres E, Varela C, Vázquez JA, Zamora J, Albareda M and Gilabert M. Epidemiolo-gy, clinical characteristics, outcome, morbidity and mortality in acromegaly based on the Spanish Acromegaly Registry (Registro Espanol de Acromegalia, REA). Eur J Endocrinol 151: 439-446, 2004.
Milani D, Carmichael JD, Welkowitz J, Ferris S, Reitz RE, Danoff A and Kleinberg DL. Variability and reliability of single serum IGF-I measurements: impact on deter-mining predictability of risk ratios in disease development. J Clin Endocrinol Metab 89: 2271-2274, 2004.
91
Molitch ME, Clemmons DR, Malozowski S, Merriam GR, Shalet SM, Vance ML, for The Endocrine Society’s Clinical Guidelines Subcommittee. Evaluation and treat-ment of adult growth hormone deficiency: an Endocrine Society Clinical Practice Guideline. J Clin Endocrinol Metab 91: 1621-1634, 2006.
Molitch ME, Clemmons DR, Malozowski S, Merriam GR, Vance ML and Endocrine Society. Evaluation and treatment of adult growth hormone deficiency: an Endo-crine Society clinical practice guideline. J Clin Endocrinol Metab 96: 1587-1609, 2011.
Mukherjee A and Shalet SM. The value of IGF1 estimation in adults with GH defi-ciency. Eur J Endocrinol 161 Suppl 1: S33-9, 2009.
Müller A, Scholz M, Blankenstein O, Binder G, Pfäffle R, Körner A, Kiess W, Heider A, Bidlingmaier M, Thiery J and Kratzsch J. Harmonization of growth hormone me-asurements with different immunoassays by data adjustment. Clin Chem Lab Med 49: 1135-1142, 2011.
Nicolson A, Toogood AA, Rahim A and Shalet SM. The prevalence of severe growth hormone deficiency in adults who received growth hormone replacement in child-hood [see comment. Clin Endocrinol (Oxf) 44: 311-316, 1996.
Paisley AN, Hayden K, Ellis A, Anderson J, Wieringa G and Trainer PJ. Pegvisomant interference in GH assays results in underestimation of GH levels. Eur J Endocrinol 156: 315-319, 2007.
Pappachan JM, Raskauskiene D, Kutty VR and Clayton RN. Excess mortality associ-ated with hypopituitarism in adults: a meta-analysis of observational studies. J Clin Endocrinol Metab 100: 1405-1411, 2015.
Parker ML, Hammond JM and Daughaday WH. The arginine provocative test: an aid in the diagnosis of hyposomatotropism. J Clin Endocrinol Metab 27: 1129-1136, 1967.
Pekic S, Doknic M, Miljic D, Joksimovic M, Glodic J, Djurovic M, Dieguez C, Casa-nueva F and Popovic V. Ghrelin test for the assessment of GH status in successfully treated patients with acromegaly. Eur J Endocrinol 154: 659-666, 2006.
Pfeifer M, Kanc K, Verhovec R and Kocijancic A. Reproducibility of the insulin tole-rance test (ITT) for assessment of growth hormone and cortisol secretion in normal and hypopituitary adult men. Clin Endocrinol (Oxf) 54: 17-22, 2001.
Pokrajac A, Wark G, Ellis AR, Wear J, Wieringa GE and Trainer PJ. Variation in GH and IGF-I assays limits the applicability of international consensus criteria to local practice. Clin Endocrinol (Oxf) 67: 65-70, 2007.
Popii V and Baumann G. Laboratory measurement of growth hormone. Clin Chim Acta 350: 1-16, 2004.
92
Porretti S, Giavoli C, Ronchi C, Lombardi G, Zaccaria M, Valle D, Arosio M and Beck-Peccoz P. Recombinant human GH replacement therapy and thyroid function in a large group of adult GH-deficient patients: when does L-T(4) therapy become mandatory? J Clin Endocrinol Metab 87: 5: 2042-2045, 2002.
Qu XD, Gaw Gonzalo IT, Al Sayed MY, Cohan P, Christenson PD, Swerdloff RS, Kel-ly DF and Wang C. Influence of body mass index and gender on growth hormone (GH) responses to GH-releasing hormone plus arginine and insulin tolerance tests. J Clin Endocrinol Metab 90: 1563-1569, 2005.
Raben MS. Growth hormone. 2. Clinical use of human growth hormone. N Engl J Med 266: 82-6 concl, 1962.
Rahim A, Toogood AA and Shalet SM. The assessment of growth hormone status in normal young adult males using a variety of provocative agents. Clin Endocrinol (Oxf) 45: 557-562, 1996.
Rasmussen MH, Hvidberg A, Juul A, Main KM, Gotfredsen A, Skakkebaek NE and Hilsted J. Massive weight loss restores 24-hour growth hormone release profiles and serum insulin-like growth factor-I levels in obese subjects. J Clin Endocrinol Metab 80: 1407-1415, 1995.
Regal M, Páramo C, Sierra SM and Garcia-Mayor RV. Prevalence and incidence of hypopituitarism in an adult Caucasian population in northwestern Spain. Clin Endocrinol (Oxf) 55: 735-740, 2001.
Reiter EO, Morris AH, MacGillivray MH and Weber D. Variable estimates of serum growth hormone concentrations by different radioassay systems. J Clin Endocrinol Metab 66: 68-71, 1988.
Ribeiro de Oliveira Longo Schweizer J, Ribeiro-Oliveira A Jr and Bidlingmaier M. Growth hormone: isoforms, clinical aspects and assays interference. Clin Diabetes Endocrinol 4: 18-018-0068-1. eCollection 2018, 2018.
Ribeiro-Oliveira A Jr, Faje AT and Barkan AL. Limited utility of oral glucose tole-rance test in biochemically active acromegaly. Eur J Endocrinol 164: 17-22, 2011.
Ritvonen E, Löyttyniemi E, Jaatinen P, Ebeling T, Moilanen L, Nuutila P, Kauppi-nen-Mäkelin R and Schalin-Jäntti C. Mortality in acromegaly: a 20-year follow-up study. Endocr Relat Cancer 23: 469-480, 2016.
Roelfsema F and Veldhuis JD. Growth hormone dynamics in healthy adults are re-lated to age and sex and strongly dependent on body mass index. Neuroendocrino-logy 103: 335-344, 2016.
Ronchi CL, Arosio M, Rizzo E, Lania AG, Beck-Peccoz P and Spada A. Adequacy of current postglucose GH nadir limit (<1 µg/l) to define long-lasting remission of acromegalic disease. Clin Endocrinol (Oxf) 66: 538-542, 2007.

93
Ronchi CL, Varca V, Giavoli C, Epaminonda P, Beck-Peccoz P, Spada A and Arosio M. Long-term evaluation of postoperative acromegalic patients in remission with previous and newly proposed criteria. J Clin Endocrinol Metab 90: 1377-1382, 2005.
Rosario PW and Calsolari MR. Laboratory investigation of acromegaly: is basal or random GH > 0.4 microg/L in the presence of normal serum IGF-1 an important result? Arch Endocrinol Metab 59: 54-58, 2015.
Rosario PW and Furtado MS. Growth hormone after oral glucose overload: revision of reference values in normal subjects. Arq Bras Endocrinol Metabol 52: 1139-1144, 2008.
Rosario PW, Salles DS, Bessa B and Furtado MS. Nadir growth hormone after oral glucose overload in obese subjects. Arq Bras Endocrinol Metabol 54: 507-509, 2010.
Roth J, Glick SM, Yalow RS and Berson SA. Secretion of human growth hormone: physiologic and experimental modification. Metabolism 12: 577-579, 1963.
Rudman D, Kutner MH, Rogers CM, Lubin MF, Fleming GA and Bain RP. Impaired growth hormone secretion in the adult population: relation to age and adiposity. J Clin Invest 67: 5: 1361-1369, 1981.
Salmon WD Jr and Daughaday WH. A hormonally controlled serum factor which stimulates sulfate incorporation by cartilage in vitro. J Lab Clin Med 49: 825-836, 1957.
Salomon F, Cuneo RC, Hesp R and Sønksen PH. The effects of treatment with re-combinant human growth hormone on body composition and metabolism in adults with growth hormone deficiency. N Engl J Med 321: 1797-1803, 1989.
Sata A and Ho KK. Growth hormone measurements in the diagnosis and monitoring of acromegaly. Pituitary 10: 165-172, 2007.
Scacchi M, Pincelli AI and Cavagnini F. Growth hormone in obesity. Int J Obes Relat Metab Disord 23: 260-271, 1999.
Schilbach K, Gar C, Lechner A, Nicolay SS, Schwerdt L, Haenelt M, Dal J, Jørgen-sen JL, Störmann S, Schopohl J and Bidlingmaier M. Determinants of the growth hormone nadir during oral glucose tolerance test in adults. Eur J Endocrinol 181: 55-67, 2019.
Schneider HJ, Saller B, Klotsche J, März W, Erwa W, Wittchen HU and Stalla GK. Opposite associations of age-dependent insulin-like growth factor-I standard devi-ation scores with nutritional state in normal weight and obese subjects. Eur J Endo-crinol 154: 699-706, 2006.
94
Serri O, Beauregard C and Hardy J. Long-term biochemical status and disease-re-lated morbidity in 53 postoperative patients with acromegaly. J Clin Endocrinol Metab 89: 658-661, 2004.
Seth J, Ellis A and Al-Sadie R. Serum growth hormone measurements in clinical practice: An audit of performance from the UK National External Quality Assess-ment scheme. Horm Res 51 Suppl 1: 13-19, 1999.
Shah A, Stanhope R and Matthew D. Hazards of pharmacological tests of growth hormone secretion in childhood. BMJ 304: 173-174, 1992.
Shalet SM, Toogood A, Rahim A and Brennan BM. The diagnosis of growth hormone deficiency in children and adults. Endocr Rev 19: 203-223, 1998.
Sheaves R. A history of acromegaly. Pituitary 2: 7-28, 1999.
Sherlock M, Ayuk J, Tomlinson JW, Toogood AA, Aragon-Alonso A, Sheppard MC, Bates AS and Stewart PM. Mortality in patients with pituitary disease. Endocr Rev 31: 301-342, 2010.
Shibasaki T, Hotta M, Masuda A, Imaki T, Obara N, Demura H, Ling N and Shizume K. Plasma GH responses to GHRH and insulin-induced hypoglycemia in man. J Clin Endocrinol Metab 60: 1265-1267, 1985.
Stewart PM, Smith S, Seth J, Stewart SE, Cole D and Edwards CR. Normal growth hormone response to the 75 g oral glucose tolerance test measured by immunora-diometric assay. Ann Clin Biochem 26 (Pt 2): 205-206, 1989.
Stochholm K, Gravholt CH, Laursen T, Jørgensen JO, Laurberg P, Andersen M, Kris-tensen LØ, Feldt-Rasmussen U, Christiansen JS, Frydenberg M and Green A. Inci-dence of GH deficiency – a nationwide study. Eur J Endocrinol 155: 61-71, 2006.
Strasburger CJ. Laboratory assessment of GH. Growth Horm IGF Res 8 Suppl A: 41-46, 1998.
Svensson J, Johannsson G and Bengtsson BÅ. Insulin-like growth factor-I in growth hormone-deficient adults: relationship to population-based normal values, body composition and insulin tolerance test. Clin Endocrinol (Oxf) 46: 579-586, 1997.
Tanaka T, Tachibana K, Shimatsu A, Katsumata N, Tsushima T, Hizuka N, Fujieda K, Yokoya S and Irie M. A nationwide attempt to standardize growth hormone assays. Horm Res 64 Suppl 2: 6-11, 2005.
Toogood AA, Beardwell CG and Shalet SM. The severity of growth hormone defi-ciency in adults with pituitary disease is related to the degree of hypopituitarism. Clin Endocrinol (Oxf) 41: 511-516, 1994.
Trainer PJ. Editorial: acromegaly - consensus, what consensus? J Clin Endocrinol Metab 87: 3534-3536, 2002.
95
Trainer PJ, Barth J, Sturgeon C and Wieringaon G. Consensus statement on the stan-dardisation of GH assays. Eur J Endocrinol 155: 1-2, 2006.
Trainer PJ, Drake WM, Katznelson L, Freda PU, Herman-Bonert V, van der Lely AJ, Dimaraki EV, Stewart PM, Friend KE, Vance ML, Besser GM, Scarlett JA, Thorner MO, Parkinson C, Klibanski A, Powell JS, Barkan AL, Sheppard MC, Malsonado M, Rose DR, Clemmons DR, Johannsson G, Bengtsson BA, Stavrou S, Kleinberg DL, Cook DM, Phillips LS, Bidlingmaier M, Strasburger CJ, Hackett S, Zib K, Bennett WF and Davis RJ. Treatment of acromegaly with the growth hormone-receptor antago-nist pegvisomant. N Engl J Med 342: 1171-1177, 2000.
Underwood LE, Attie KM, Baptista J, and the Genentech Collaborative Study Group. Growth hormone (GH) dose-response in young adults with childhood-onset GH deficiency: a two-year, multicenter, multiple-dose, placebo-controlled study. J Clin Endocrinol Metab 88: 5273-5280, 2003.
Vahl N, Jørgensen JO, Skjaerbaek C, Veldhuis JD, Ørskov H and Christiansen JS. Abdominal adiposity rather than age and sex predicts mass and regularity of GH secretion in healthy adults. Am J Physiol 272: 1108-1116, 1997.
Valetto MR, Bellone J, Baffoni C, Savio P, Aimaretti G, Gianotti L, Arvat E, Camanni F and Ghigo E. Reproducibility of the growth hormone response to stimulation with growth hormone-releasing hormone plus arginine during lifespan. Eur J Endocrinol 135: 568-572, 1996.
van den Berg G, Veldhuis JD, Frölich M and Roelfsema F. An amplitude-specific divergence in the pulsatile mode of growth hormone (GH) secretion underlies the gender difference in mean GH concentrations in men and premenopausal women. J Clin Endocrinol Metab 81: 2460-2467, 1996.
Veldhuis JD, Iranmanesh A, Ho KK, Waters MJ, Johnson ML and Lizarralde G. Dual defects in pulsatile growth hormone secretion and clearance subserve the hyposo-matotropism of obesity in man. J Clin Endocrinol Metab 72: 51-59, 1991.
Verrua E, Filopanti M, Ronchi CL, Olgiati L, Ferrante E, Giavoli C, Sala E, Mantovani G, Arosio M, Beck-Peccoz P, Lania AG and Spada A. GH response to oral glucose tolerance test: a comparison between patients with acromegaly and other pituitary disorders. J Clin Endocrinol Metab 96: 83-88, 2011.
Vierhapper H, Heinze G, Gessl A, Exner M and Bieglmayr C. Use of the oral gluco-se tolerance test to define remission in acromegaly. Metabolism 52: 181-185, 2003.
Wagner IV, Paetzold C, Gausche R, Vogel M, Koerner A, Thiery J, Arsene CG, Henri-on A, Guettler B, Keller E, Kiess W, Pfaeffle R and Kratzsch J. Clinical evidence-ba-sed cut-offs limits for GH stimulation tests in children with a backup of results with reference to mass spectrometry. Eur J Endocrinol 171: 389-397, 2014.

96
Wass JA. Acromegaly: treatment after 100 years. BMJ 307: 1505-1506, 1993.
Wieringa GE, Sturgeon CM and Trainer PJ. The harmonisation of growth hormone measurements: taking the next steps. Clin Chim Acta 432: 68-71, 2014.
Williams T, Berelowitz M, Joffe SN, Thorner MO, Rivier J, Vale W and Frohman LA. Impaired growth hormone responses to growth hormone-releasing factor in obesity. A pituitary defect reversed with weight reduction. N Engl J Med 311: 1403-1407, 1984.
Wood P. Growth hormone: its measurement and the need for assay harmonization. Ann Clin Biochem 38: 471-482, 2001.
Wright AD, Hill DM, Lowy C and Fraser TR. Mortality in acromegaly. Q J Med 39: 1-16, 1970.
Yuen KC, Tritos NA, Samson SL, Hoffman AR and Katznelson L. American Associ-ation of Clinical Endocrinologists and American College of Endocrinology Disease State Clinical Review: Update on growth hormone stimulation testing and proposed revised cut-point for the glucagon stimulation test in the diagnosis of adult growth hormone deficiency. Endocr Pract 22: 1235-1244, 2016.
Zadik Z, Chalew SA, McCarter RJ Jr, Meistas M and Kowarski AA. The influence of age on the 24-hour integrated concentration of growth hormone in normal indivi-duals. J Clin Endocrinol Metab 60: 513-516, 1985.

97
ORIGINAL PUBLICATIONS

98