growth in means-tested programs and tax credits for … budget office cbo growth in means-tested...
TRANSCRIPT

0
1
2
3
4
5
0
1
2
3
4
5
Nutrition, Housing, and Education
Cash Assistance
Health Care
Federal Spending on Major Means-Tested Programs and Tax Credits, by Category
1972 1977 1982 1987 1992 1997 2002 2007 2012
Percentage of GDP
CONGRESS OF THE UNITED STATESCONGRESSIONAL BUDGET OFFICE
CBOGrowth in
Means-Tested Programs and Tax Credits for
Low-Income Households
FEBRUARY 2013
CBO
Notes
Unless otherwise indicated, figures for government spending in this report are presented in 2012 dollars to remove the effects of inflation. The Congressional Budget Office adjusted nominal amounts for inflation using the price index for personal consumption expenditures, which is calculated by the Bureau of Economic Analysis.
Because this report focuses on benefits going to low-income people, estimates of spending and participation for the earned income tax credit, the child tax credit, and the premium assis-tance tax credit (which will be available starting in 2014) include only the refundable portions of those credits—that is, the amounts that are paid to tax filers because they exceed the filers’ income tax liabilities (and, in the case of the earned income and premium assistance tax credits, certain other liabilities reported on tax returns).
Numbers in the text, tables, and figures may not add up to totals because of rounding.
Pub. No. 4504
Contents
Summary 1
An Overview of Means-Tested Programs and Tax Credits 4
Sources of Past Growth in Means-Tested Programs and Tax Credits 5
Increased Participation 6
Increased Spending per Participant 7
Past Growth in Specific Programs and Tax Credits 7
BOX: THE DISTRIBUTION OF FEDERAL SPENDING ON MEANS-TESTED PROGRAMS AND TAX CREDITS BY HOUSEHOLD INCOME 8
Means-Tested Health Care Programs 8
Means-Tested Cash Assistance Programs and Tax Credits 13
Means-Tested Nutrition, Housing, and Education Programs 18
Projections for the Next Decade 22
Means-Tested Health Care Programs and Premium Assistance Tax Credits 22
Means-Tested Cash Assistance Programs and Tax Credits 24
Means-Tested Nutrition and Education Programs 24
Appendix A: Data on Means-Tested Programs and Tax Credits 25
Appendix B: Interpreting Information About Participation and Spending per Participant 29
List of Tables and Figures 30
About This Document 31
CBO

Growth in Means-Tested Programs and Tax Credits for Low-Income Households
SummaryThe federal government devotes roughly one-sixth of its spending to 10 major means-tested programs and tax credits, which provide cash payments or assistance in obtaining health care, food, housing, or education to people with relatively low income or few assets. Those programs and credits consist of the following:
Medicaid,
The low-income subsidy (LIS) for Part D of Medicare (the part of Medicare that provides prescription drug benefits),
The refundable portion of the earned income tax credit (EITC),
The refundable portion of the child tax credit (CTC),
Supplemental Security Income (SSI),
Temporary Assistance for Needy Families (TANF),
The Supplemental Nutrition Assistance Program (SNAP, formerly called the Food Stamp program),
Child nutrition programs,
Housing assistance programs, and
The Federal Pell Grant Program.
In 2012, federal spending on those programs and tax credits totaled $588 billion. (Certain larger federal bene-fit programs, such as Social Security and Medicare, are not considered means-tested programs because they are not limited to people with specific amounts of income or assets.)
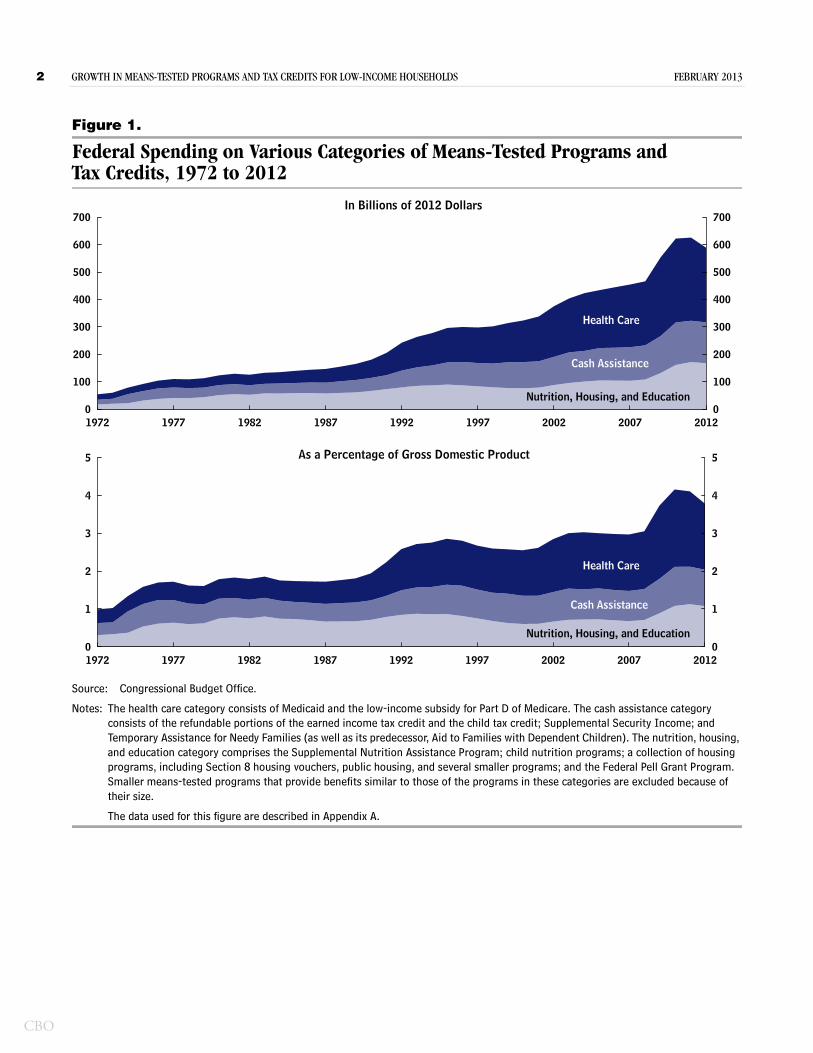
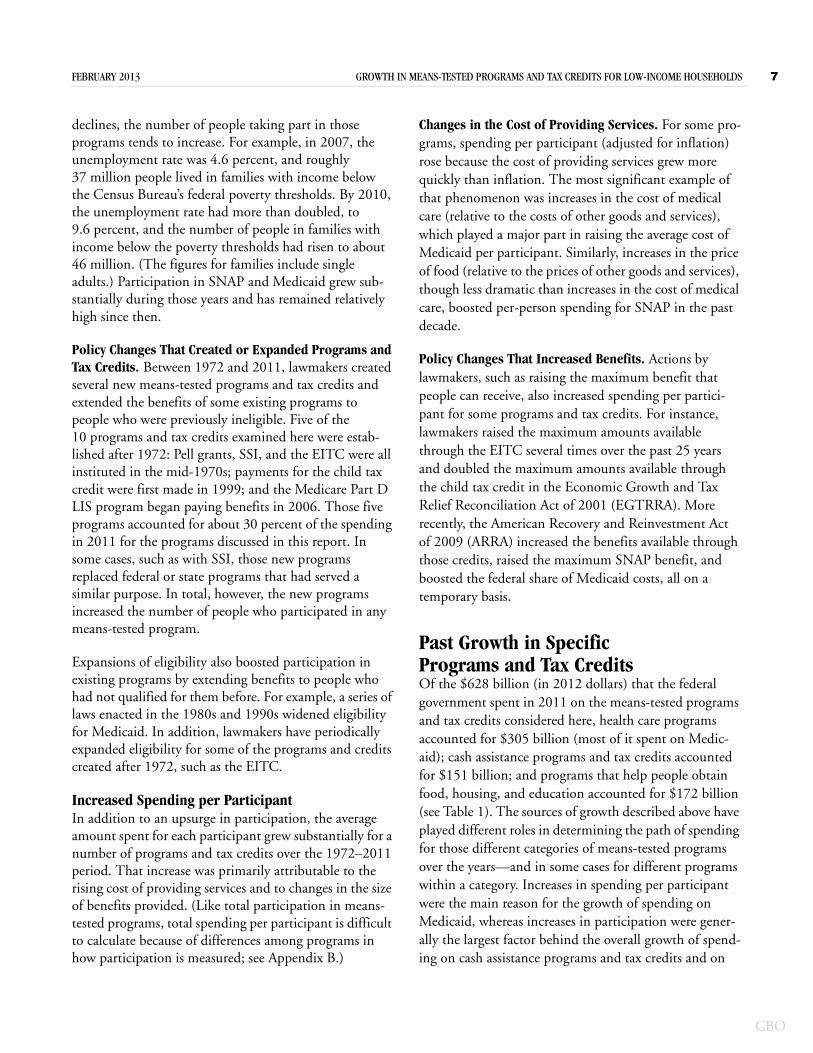
Total federal spending on those 10 programs (adjusted to exclude the effects of inflation) rose more than tenfold—or by an average of about 6 percent a year—in the four decades since 1972 (when only half of the programs existed).1 As a share of the economy, federal spending on those programs grew from 1 percent to almost 4 percent of gross domestic product (GDP) over that period (see Figure 1).
Medicaid accounted for more than 40 percent of the federal spending on those programs in 2012, followed in size by SNAP. A decade from now, Medicaid will account for an even larger share of spending on those programs, the Congressional Budget Office (CBO) projects. A new means-tested program—federal subsidies to help low- and moderate-income people buy health insurance through insurance exchanges, which will begin in 2014—will be the second-largest means-tested program in 2023, CBO estimates.
What Caused Total Spending on Means-Tested Programs and Tax Credits to Rise Over the Past 40 Years? Two broad factors were responsible for the growth of spending on means-tested programs and tax credits between 1972 and 2011: increases in the number of people participating in those programs and increases in spending per participant. (This discussion focuses on the 40-year period ending in 2011 because that is the most recent year for which data on the number of participants are available for those programs.) Both of those increases were themselves the result of multiple factors. For
1. For ease of presentation, this report frequently uses the term “programs” to encompass both the spending programs and the tax credits.
CBO
2 GROWTH IN MEANS-TESTED PROGRAMS AND TAX CREDITS FOR LOW-INCOME HOUSEHOLDS FEBRUARY 2013
CBO
Figure 1.
Federal Spending on Various Categories of Means-Tested Programs and Tax Credits, 1972 to 2012
Source: Congressional Budget Office.
Notes: The health care category consists of Medicaid and the low-income subsidy for Part D of Medicare. The cash assistance category consists of the refundable portions of the earned income tax credit and the child tax credit; Supplemental Security Income; and Temporary Assistance for Needy Families (as well as its predecessor, Aid to Families with Dependent Children). The nutrition, housing, and education category comprises the Supplemental Nutrition Assistance Program; child nutrition programs; a collection of housing programs, including Section 8 housing vouchers, public housing, and several smaller programs; and the Federal Pell Grant Program. Smaller means-tested programs that provide benefits similar to those of the programs in these categories are excluded because of their size.
The data used for this figure are described in Appendix A.
1972 1977 1982 1987 1992 1997 2002 2007 20120
100
200
300
400
500
600
700
0
100
200
300
400
500
600
700
Health Care
Cash Assistance
Nutrition, Housing, and Education
1972 1977 1982 1987 1992 1997 2002 2007 20120
1
2
3
4
5
0
1
2
3
4
5
Health Care
Cash Assistance
Nutrition, Housing, and Education
In Billions of 2012 Dollars
As a Percentage of Gross Domestic Product

FEBRUARY 2013 GROWTH IN MEANS-TESTED PROGRAMS AND TAX CREDITS FOR LOW-INCOME HOUSEHOLDS 3
example, the rise in participation stemmed from three important causes:
Population growth (the U.S. population increased by almost 50 percent during that period),
Changes in economic conditions (particularly the recession that occurred from 2007 to 2009 and the weak recovery that followed it), and
Actions by lawmakers to create new means-tested programs and tax credits and to expand eligibility for some existing ones.
Increases in spending per participant resulted mainly from two factors:
Growth in the cost of providing assistance (such as rising costs for medical care), and
Actions by lawmakers to provide more generous benefits (such as increases in SNAP benefits).
What Caused the Growth of Specific Categories of Means-Tested Programs and Tax Credits?Roughly half of the total growth in spending between 1972 and 2011 on the means-tested programs and tax credits examined in this report came from increases in spending for health care programs—Medicaid and, to a far lesser extent, subsidies to help low-income people pay for prescription drugs under Part D of Medicare. Spend-ing for such programs grew about 15-fold over the 1972–2011 period: from $20 billion to $305 billion. (Those and other dollar amounts for program spending in this report are presented in 2012 dollars to remove the effects of inflation.) The main reason for that growth—which averaged about 7 percent a year above the rate of inflation—was increased spending per participant. Had the amount of spending per participant in Medicaid remained unchanged between 1972 and 2011, total spending on the health care programs examined here would have been about $88 billion in 2011, or less than one-third of the actual amount.
Growth in each of two other broad categories of means-tested programs and tax credits—programs that provide cash assistance and programs that help people obtain food, housing, or education—was about equally responsi-ble for the other half of the total increase in spending over
the 1972–2011 period on the programs included in this study:
Spending on cash assistance programs and tax credits (the largest of which is the refundable portion of the EITC) rose from $18 billion in 1972 to $151 billion in 2011—that is, by nearly 6 percent a year above the rate of inflation.
Spending on programs that help people afford food, housing, or education (the largest of which is SNAP) rose from $17 billion to $172 billion—that is, by about 6 percent per year above the rate of inflation.
Unlike growth in spending for health care programs (pri-marily Medicaid), which stemmed mainly from greater spending per participant, growth in spending for those other programs resulted primarily from increases in the number of participants.
How Much Will Means-Tested Programs and Tax Credits Cost Over the Next Decade?If current laws that govern the means-tested programs and tax credits examined in this report do not change, total spending on those programs will grow faster than inflation over the next decade, CBO projects. However, changes in spending will vary among programs.
Spending on means-tested health care programs is pro-jected to more than double, from $272 billion in 2012 to $624 billion in 2023 (adjusted for inflation), an average annual increase of 8 percent above the rate of inflation. That rise reflects expected growth in the cost of providing medical care; it also reflects expanded eligibility for assis-tance and new types of assistance to be provided under the Affordable Care Act (ACA).2 The ACA will not only make more people eligible for Medicaid but also allow many low- and moderate-income people who do not qualify for Medicaid to purchase federally subsidized health care coverage. Subsidizing that non-Medicaid coverage through cost-sharing subsidies and the refund-able portion of a new premium assistance tax credit is projected to cost $109 billion (in 2012 dollars) in 2023.
In contrast to spending on health care programs, total spending on the cash assistance programs and tax credits
2. The Affordable Care Act comprises the Patient Protection and Affordable Care Act and the health care provisions of the Health Care and Education Reconciliation Act of 2010.
CBO

4 GROWTH IN MEANS-TESTED PROGRAMS AND TAX CREDITS FOR LOW-INCOME HOUSEHOLDS FEBRUARY 2013
CBO
examined here is projected to fall over the next decade—from $148 billion in 2012 to $137 billion in 2023 (adjusted for inflation). That expected decline mainly stems from changes to the earned income and child tax credits that are scheduled to occur under current law.
CBO also estimates that spending on the nutrition and education programs discussed here will decline in the next 10 years, partly because spending on SNAP is pro-jected to drop substantially as the economy continues to recover. (Unlike the other programs included in this study, the housing assistance programs rely on annual appropriations for all of their funding. In this report, CBO has not projected the size of those appropriations, which will depend on future actions by lawmakers.)3
An Overview of Means-Tested Programs and Tax CreditsThe federal government has many programs and tax credits that are designed specifically to help people who have relatively low income or few assets. Such means-tested programs and credits—some of which are adminis-tered jointly with the states—help the people who receive benefits obtain goods or services that they might not otherwise be able to afford. For instance, SNAP enables recipients to purchase more food, Medicaid provides people with health care coverage, and Pell grants make postsecondary education more affordable for students.
The amount of money that the federal government spends annually on each means-tested program and tax credit depends on how the program or tax provision is designed. Spending for some programs, such as Medicaid and the refundable portions of tax credits, is open-ended. For example, people may enroll in Medicaid if they meet the eligibility criteria established by their state, and as people enroll and consume health care, the federal gov-ernment has a legal obligation to pay a share of those benefits (the share varies from state to state). In contrast, a set amount is appropriated for SNAP annually. The amount appropriated each year is intended to cover the cost of providing benefits to all people who apply for the program and are eligible; it includes a reserve to cover unexpected costs. But if the appropriated amount does
3. For another recent analysis of means-tested programs and tax credits, see Gene Falk, Low-Income Assistance Programs: Trends in Federal Spending, Report for Congress R41823 (Congressional Research Service, June 13, 2012).
not cover those costs, either lawmakers must provide additional funds or the Department of Agriculture must reduce benefits. Other programs, such as housing assis-tance, receive appropriations that are not intended to cover the cost of providing benefits to everyone who applies and is eligible. Lawmakers furnish a specific amount of money for such programs each year, and if it runs out, no further benefits are provided in that year.
In this analysis, CBO focuses on the federal government’s major means-tested programs and tax credits, which it groups into three categories:
Health care programs—Medicaid; the low-income subsidy for Part D of Medicare (which covers pre-scription drugs); and, beginning in 2014, assistance for low- and moderate-income people who purchase health insurance through the new insurance exchanges.
Cash assistance programs and refundable tax credits—The refundable portions of the earned income tax credit and the child tax credit; Supplemental Security Income; and Temporary Assistance for Needy Families (as well as its predecessor, Aid to Families with Dependent Children).
Nutrition, housing, and education assistance programs—The Supplemental Nutrition Assistance Program; child nutrition programs, including the National School Lunch Program and the School Breakfast Program; a collection of housing assistance programs, including assistance authorized under section 8 of the United States Housing Act of 1937; and the Federal Pell Grant Program.
Federal spending on those means-tested programs and tax credits totaled $588 billion in 2012 (see Figure 2). That amount—roughly one-sixth of federal spending—was more than the government spent on Medicare in 2012 and less than it spent on Social Security or defense.
This study discusses the factors that have affected spend-ing on those means-tested programs and analyzes trends in spending for each of them over the past 40 years (the period that CBO typically looks at when comparing bud-get projections with historical spending and revenues). The study also examines the projected path of spending for most of those programs over the coming decade if current laws remain in place.

FEBRUARY 2013 GROWTH IN MEANS-TESTED PROGRAMS AND TAX CREDITS FOR LOW-INCOME HOUSEHOLDS 5
Figure 2.
Federal Spending on Selected Means-Tested Programs and Tax Credits, 2012(Billions of dollars)
Source: Congressional Budget Office.
Note: The data used for this figure are described in Appendix A.
Medicaid
251
Health Care
$272 Billion
MedicarePart DLow-IncomeSubsidy
Earned Income Tax Credit
SupplementalSecurity Income
Child TaxCredit
Temporary Assistance forNeedy Families
CashAssistance
$148 Billion
SupplementalNutritionAssistanceProgram
HousingAssistance
Pell GrantsChildNutrition
Nutrition,Housing, and
Education
$168 Billion
21
54 50 28 17
80 18 36 34
Many other federal programs and parts of the tax system that improve people’s well-being are not included in this analysis. For example, social insurance and other govern-ment assistance programs that are not means-tested—such as Social Security, Medicare, and unemployment insurance—are not considered in this report. Such pro-grams are classified as means-tested only if they directly target assistance toward low-income people. Some pro-grams instead provide assistance to groups of people among whom poverty is common, such as Native Americans or students at schools that draw heavily from low-income families. Those programs are not considered in this analysis.
This report also does not address features of the federal tax system that provide significant financial assistance for the acquisition of goods and services (such as housing and health care) but that mainly benefit people with relatively high income. Those features—which include exclusions from taxable income, itemized deductions, and preferential tax rates on capital gains and dividends—
can resemble government spending programs by provid-ing financial assistance for specific activities, entities, or groups of people. However, because they are not targeted toward low-income people, they are not included in this report.4
Sources of Past Growth in Means-Tested Programs and Tax CreditsFederal spending on means-tested programs and tax cred-its has grown throughout the past four decades. Adjusted to remove the effects of inflation, total spending on the programs and credits included in this analysis rose from $55 billion in 1972 (when just 5 of the 10 programs existed) to $628 billion in 2011, before declining to $588 billion in 2012, largely because a temporary
4. For more information about such tax expenditures, see Congressional Budget Office, The Budget and Economic Outlook: Fiscal Years 2012 to 2022 (January 2012), pp. 93–96, www.cbo.gov/publication/42905.
CBO

6 GROWTH IN MEANS-TESTED PROGRAMS AND TAX CREDITS FOR LOW-INCOME HOUSEHOLDS FEBRUARY 2013
CBO
Table 1.
Federal Spending on Various Categories of Means-Tested Programs and Tax Credits, Selected Years
Source: Congressional Budget Office.
Notes: The health care category consists of Medicaid and the low-income subsidy for Part D of Medicare. The cash assistance category consists of the refundable portions of the earned income tax credit and the child tax credit; Supplemental Security Income; and Temporary Assistance for Needy Families (as well as its predecessor, Aid to Families with Dependent Children). The nutrition, housing, and education category comprises the Supplemental Nutrition Assistance Program; child nutrition programs; a collection of housing programs, including Section 8 housing vouchers, public housing, and several smaller programs; and the Federal Pell Grant Program. Smaller means-tested programs that provide benefits similar to those of the programs in these categories are excluded because of their size.
The data shown here are described in Appendix A.
Health Care 20 82 305 272Cash Assistance 18 51 151 148Nutrition, Housing, and Education 17 73 172 168___ ____ ____ ____
Total 55 206 628 588
Health Care 0.4 0.9 2.0 1.7Cash Assistance 0.3 0.6 1.0 1.0Nutrition, Housing, and Education 0.3 0.8 1.1 1.1___ ____ ____ ____
Total 1.0 2.2 4.1 3.8
2012
In Billions of 2012 Dollars
As a Percentage of Gross Domestic Product
1972 1991 2011
increase in the federal government’s share of Medicaid costs expired in June 2011 (see Table 1). As spending on those programs increased, so did the amount of benefits they provided to low-income people. (For a discussion of how the benefits of means-tested programs are distrib-uted among people with different incomes, see Box 1 on page 8.)
The growth in total spending for means-tested programs and tax credits over the past four decades resulted from an increase in the number of people participating in such programs as well as from a rise in the amount of spending per participant. This section outlines the major factors that caused those developments; the next section provides details for individual programs. (The analysis focuses on the 40-year period ending in 2011, the most recent year for which data on the number of participants are available for those programs.)
Increased ParticipationFor most of the programs and tax credits, the number of people receiving benefits grew substantially between 1972 and 2011 because of such factors as population growth,
economic downturns, or policy changes that expanded the programs and credits or added new ones. (Calculating the total number of participants in all programs is diffi-cult, however. Participation is measured differently in different programs, as explained in Appendix B, and a person can receive benefits from multiple means-tested programs at the same time.)
Changes in the Size of the Population. The number of people living in the United States rose by 49 percent during the 1972–2011 period, from 210 million to 312 million. As the population grew, so did the number of people participating in means-tested programs. However, participation in the programs and tax credits examined here tended to increase much faster than the population did. For instance, participation in Medicaid and SNAP more than tripled between 1972 and 2011 (to 53 million and 45 million, respectively, from 17 million and 11 million).
Changes in Economic Conditions. Many means-tested programs are open to anyone who meets the eligibility criteria; thus, if economic conditions worsen and income
FEBRUARY 2013 GROWTH IN MEANS-TESTED PROGRAMS AND TAX CREDITS FOR LOW-INCOME HOUSEHOLDS 7
declines, the number of people taking part in those programs tends to increase. For example, in 2007, the unemployment rate was 4.6 percent, and roughly 37 million people lived in families with income below the Census Bureau’s federal poverty thresholds. By 2010, the unemployment rate had more than doubled, to 9.6 percent, and the number of people in families with income below the poverty thresholds had risen to about 46 million. (The figures for families include single adults.) Participation in SNAP and Medicaid grew sub-stantially during those years and has remained relatively high since then.
Policy Changes That Created or Expanded Programs and Tax Credits. Between 1972 and 2011, lawmakers created several new means-tested programs and tax credits and extended the benefits of some existing programs to people who were previously ineligible. Five of the 10 programs and tax credits examined here were estab-lished after 1972: Pell grants, SSI, and the EITC were all instituted in the mid-1970s; payments for the child tax credit were first made in 1999; and the Medicare Part D LIS program began paying benefits in 2006. Those five programs accounted for about 30 percent of the spending in 2011 for the programs discussed in this report. In some cases, such as with SSI, those new programs replaced federal or state programs that had served a similar purpose. In total, however, the new programs increased the number of people who participated in any means-tested program.
Expansions of eligibility also boosted participation in existing programs by extending benefits to people who had not qualified for them before. For example, a series of laws enacted in the 1980s and 1990s widened eligibility for Medicaid. In addition, lawmakers have periodically expanded eligibility for some of the programs and credits created after 1972, such as the EITC.
Increased Spending per ParticipantIn addition to an upsurge in participation, the average amount spent for each participant grew substantially for a number of programs and tax credits over the 1972–2011 period. That increase was primarily attributable to the rising cost of providing services and to changes in the size of benefits provided. (Like total participation in means-tested programs, total spending per participant is difficult to calculate because of differences among programs in how participation is measured; see Appendix B.)
Changes in the Cost of Providing Services. For some pro-grams, spending per participant (adjusted for inflation) rose because the cost of providing services grew more quickly than inflation. The most significant example of that phenomenon was increases in the cost of medical care (relative to the costs of other goods and services), which played a major part in raising the average cost of Medicaid per participant. Similarly, increases in the price of food (relative to the prices of other goods and services), though less dramatic than increases in the cost of medical care, boosted per-person spending for SNAP in the past decade.
Policy Changes That Increased Benefits. Actions by lawmakers, such as raising the maximum benefit that people can receive, also increased spending per partici-pant for some programs and tax credits. For instance, lawmakers raised the maximum amounts available through the EITC several times over the past 25 years and doubled the maximum amounts available through the child tax credit in the Economic Growth and Tax Relief Reconciliation Act of 2001 (EGTRRA). More recently, the American Recovery and Reinvestment Act of 2009 (ARRA) increased the benefits available through those credits, raised the maximum SNAP benefit, and boosted the federal share of Medicaid costs, all on a temporary basis.
Past Growth in Specific Programs and Tax CreditsOf the $628 billion (in 2012 dollars) that the federal government spent in 2011 on the means-tested programs and tax credits considered here, health care programs accounted for $305 billion (most of it spent on Medic-aid); cash assistance programs and tax credits accounted for $151 billion; and programs that help people obtain food, housing, and education accounted for $172 billion (see Table 1). The sources of growth described above have played different roles in determining the path of spending for those different categories of means-tested programs over the years—and in some cases for different programs within a category. Increases in spending per participant were the main reason for the growth of spending on Medicaid, whereas increases in participation were gener-ally the largest factor behind the overall growth of spend-ing on cash assistance programs and tax credits and on
CBO

8 GROWTH IN MEANS-TESTED PROGRAMS AND TAX CREDITS FOR LOW-INCOME HOUSEHOLDS FEBRUARY 2013
CBO
Continued
Box 1.
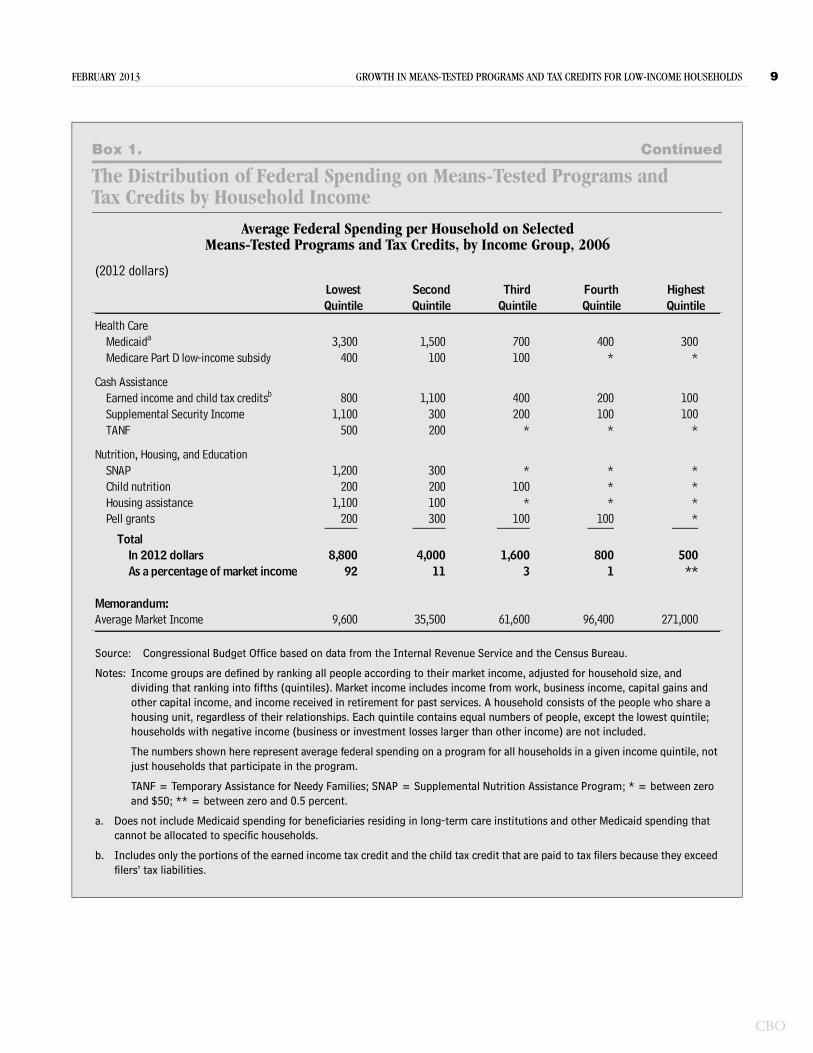
The Distribution of Federal Spending on Means-Tested Programs and Tax Credits by Household IncomeFederal spending on the means-tested programs and tax credits examined in this study provides various types of support to households. To examine how that support differs among households at different income levels, the Congressional Budget Office estimated how the federal government’s total spending on those programs in 2006—about $440 billion (in 2012 dollars)—was allocated among households in five income groups (or quintiles), ranked according to an annual measure of market income.1 (The distribu-tional analysis focuses on 2006 because, when the analysis began, that was the most recent year for which necessary data were available from the Internal Revenue Service’s Statistics of Income Division.)
On average, the federal government gave decreasing amounts of means-tested support to households higher up on the income scale. That support averaged $8,800 for households in the lowest income quintile, $4,000 for those in the next-to-lowest quintile, and $1,600 for households in the middle quintile (see the table at right).2 The largest source of means-tested spending per household for each of the income groups was Medicaid.
Not only was the amount of federal means-tested support largest for the lowest-income households, but that spending amounted to the greatest share of market income for such households. Federal spend-ing on means-tested programs and tax credits boosted average income by 92 percent for households in the lowest income quintile and by 3 percent for households in the middle quintile.
For most of the programs examined in this report, average spending per household tended to decline as income increased—partly because fewer people in the higher income quintiles were eligible for benefits, and partly because among those eligible, benefits tended to be lower for people with higher income.3 For the earned income and child tax credits, however, com-bined spending on the refundable portions of the two credits was largest for households with income in the next-to-lowest quintile. Households without income are ineligible for those credits, and the amount of the earned income tax credit initially increases with earn-ings and then remains steady at the maximum benefit before starting to decline as earnings grow further.
1. Market income includes income from work, business income, capital gains and other capital income, and income received in retirement for past services.
2. The table presents average income and spending amounts for the five income groups. Within each group, income and benefits received vary considerably, but this analysis does not examine that variation.
3. High-income households are shown as receiving means-tested assistance for several reasons. Some households have income that varies over the course of a year, and they may qualify for benefits when their monthly income is low, even though their annual income is high. In addition, some people who qualify for benefits on the basis of their own low income live in high-income households. Also, the data include some misreporting of income, program participation, and benefit amounts.
nutrition, housing, and education programs.5 (The data used for this analysis, which come from various sources and differ in many ways, are described in Appendix A.)
5. Growth in participation and growth in spending per participant interact in ways that push program spending higher than it would be without such interactions. The interaction between those factors can be identified separately, or, as in this analysis, equal portions of the interaction can be attributed to each factor.
Means-Tested Health Care ProgramsThe government provides health insurance coverage to low-income people through Medicaid. It also provides prescription drug benefits to low-income beneficiaries of the Medicare program through the low-income subsidy in Part D of Medicare. Total spending on those means-tested programs increased from $20 billion (0.4 percent of GDP) in 1972 to $305 billion (2.0 percent of GDP)
FEBRUARY 2013 GROWTH IN MEANS-TESTED PROGRAMS AND TAX CREDITS FOR LOW-INCOME HOUSEHOLDS 9
Box 1. Continued
The Distribution of Federal Spending on Means-Tested Programs and Tax Credits by Household Income
Average Federal Spending per Household on SelectedMeans-Tested Programs and Tax Credits, by Income Group, 2006
(2012 dollars)
Source: Congressional Budget Office based on data from the Internal Revenue Service and the Census Bureau.
Notes: Income groups are defined by ranking all people according to their market income, adjusted for household size, and dividing that ranking into fifths (quintiles). Market income includes income from work, business income, capital gains and other capital income, and income received in retirement for past services. A household consists of the people who share a housing unit, regardless of their relationships. Each quintile contains equal numbers of people, except the lowest quintile; households with negative income (business or investment losses larger than other income) are not included.
The numbers shown here represent average federal spending on a program for all households in a given income quintile, not just households that participate in the program.
TANF = Temporary Assistance for Needy Families; SNAP = Supplemental Nutrition Assistance Program; * = between zero and $50; ** = between zero and 0.5 percent.
a. Does not include Medicaid spending for beneficiaries residing in long-term care institutions and other Medicaid spending that cannot be allocated to specific households.
b. Includes only the portions of the earned income tax credit and the child tax credit that are paid to tax filers because they exceed filers’ tax liabilities.
3,300 1,500 700 400 300400 100 100 * *
800 1,100 400 200 1001,100 300 200 100 100
500 200 * * *
1,200 300 * * *200 200 100 * *
1,100 100 * * *200 300 100 100 *_____ _____ _____ ____ ____
Total In 2012 dollars 8,800 4,000 1,600 800 500As a percentage of market income 92 11 3 1 **
Average Market Income 9,600 35,500 61,600 96,400 271,000
Pell grantsHousing assistance
Supplemental Security IncomeEarned income and child tax creditsb
Nutrition, Housing, and EducationSNAPChild nutrition
Health CareMedicaida
Medicare Part D low-income subsidy
Cash Assistance
TANF
Lowest Second Third Fourth HighestQuintile Quintile Quintile Quintile Quintile
Memorandum:
CBO
10 GROWTH IN MEANS-TESTED PROGRAMS AND TAX CREDITS FOR LOW-INCOME HOUSEHOLDS FEBRUARY 2013
CBO
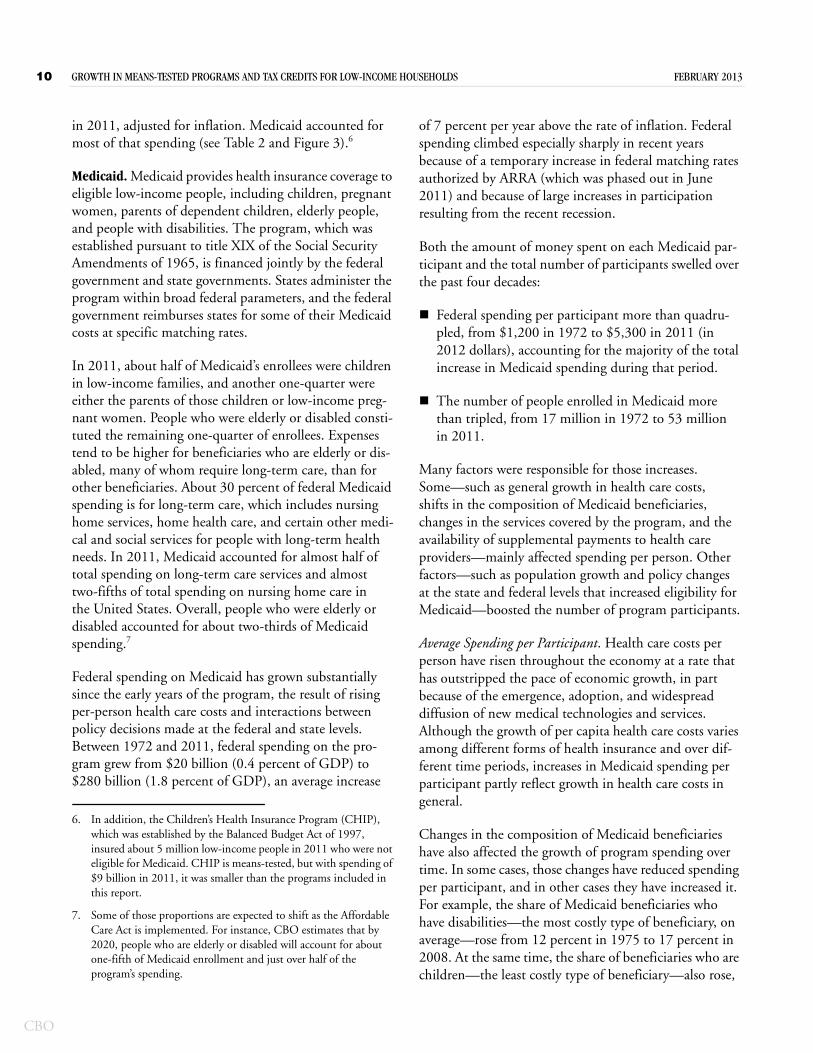
in 2011, adjusted for inflation. Medicaid accounted for most of that spending (see Table 2 and Figure 3).6
Medicaid. Medicaid provides health insurance coverage to eligible low-income people, including children, pregnant women, parents of dependent children, elderly people, and people with disabilities. The program, which was established pursuant to title XIX of the Social Security Amendments of 1965, is financed jointly by the federal government and state governments. States administer the program within broad federal parameters, and the federal government reimburses states for some of their Medicaid costs at specific matching rates.
In 2011, about half of Medicaid’s enrollees were children in low-income families, and another one-quarter were either the parents of those children or low-income preg-nant women. People who were elderly or disabled consti-tuted the remaining one-quarter of enrollees. Expenses tend to be higher for beneficiaries who are elderly or dis-abled, many of whom require long-term care, than for other beneficiaries. About 30 percent of federal Medicaid spending is for long-term care, which includes nursing home services, home health care, and certain other medi-cal and social services for people with long-term health needs. In 2011, Medicaid accounted for almost half of total spending on long-term care services and almost two-fifths of total spending on nursing home care in the United States. Overall, people who were elderly or disabled accounted for about two-thirds of Medicaid spending.7
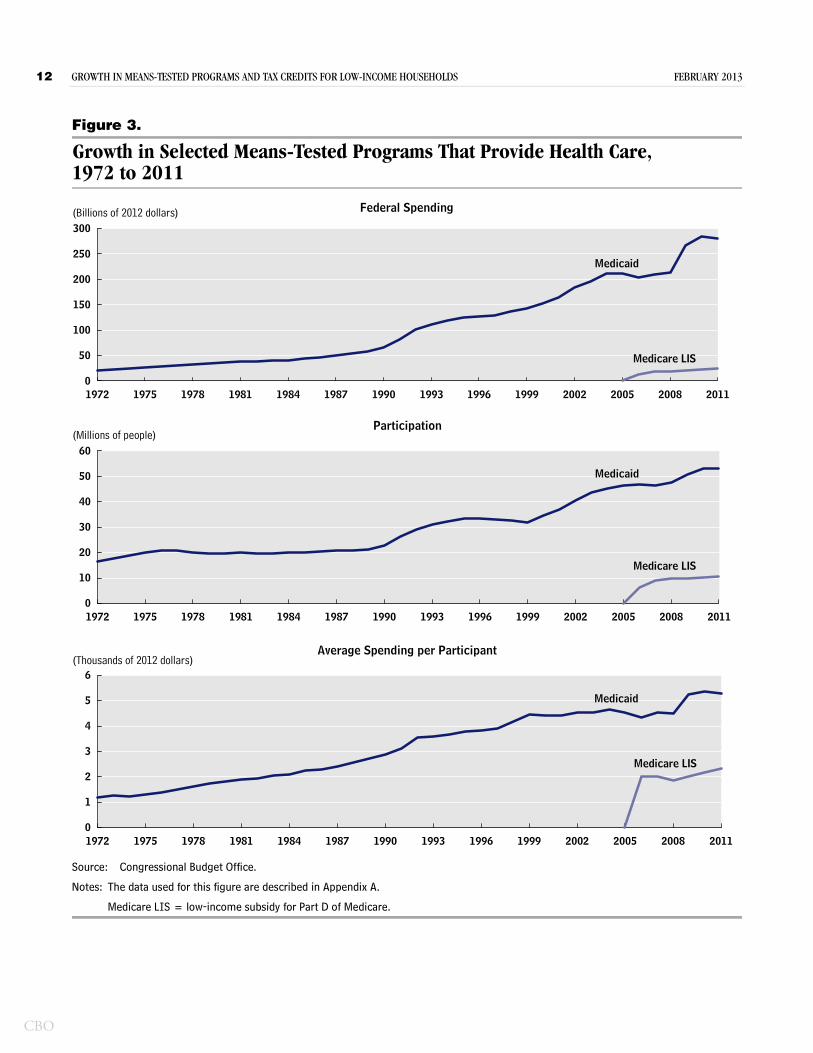
Federal spending on Medicaid has grown substantially since the early years of the program, the result of rising per-person health care costs and interactions between policy decisions made at the federal and state levels. Between 1972 and 2011, federal spending on the pro-gram grew from $20 billion (0.4 percent of GDP) to $280 billion (1.8 percent of GDP), an average increase
6. In addition, the Children’s Health Insurance Program (CHIP), which was established by the Balanced Budget Act of 1997, insured about 5 million low-income people in 2011 who were not eligible for Medicaid. CHIP is means-tested, but with spending of $9 billion in 2011, it was smaller than the programs included in this report.
7. Some of those proportions are expected to shift as the Affordable Care Act is implemented. For instance, CBO estimates that by 2020, people who are elderly or disabled will account for about one-fifth of Medicaid enrollment and just over half of the program’s spending.
of 7 percent per year above the rate of inflation. Federal spending climbed especially sharply in recent years because of a temporary increase in federal matching rates authorized by ARRA (which was phased out in June 2011) and because of large increases in participation resulting from the recent recession.
Both the amount of money spent on each Medicaid par-ticipant and the total number of participants swelled over the past four decades:
Federal spending per participant more than quadru-pled, from $1,200 in 1972 to $5,300 in 2011 (in 2012 dollars), accounting for the majority of the total increase in Medicaid spending during that period.
The number of people enrolled in Medicaid more than tripled, from 17 million in 1972 to 53 million in 2011.
Many factors were responsible for those increases. Some—such as general growth in health care costs, shifts in the composition of Medicaid beneficiaries, changes in the services covered by the program, and the availability of supplemental payments to health care providers—mainly affected spending per person. Other factors—such as population growth and policy changes at the state and federal levels that increased eligibility for Medicaid—boosted the number of program participants.
Average Spending per Participant. Health care costs per person have risen throughout the economy at a rate that has outstripped the pace of economic growth, in part because of the emergence, adoption, and widespread diffusion of new medical technologies and services. Although the growth of per capita health care costs varies among different forms of health insurance and over dif-ferent time periods, increases in Medicaid spending per participant partly reflect growth in health care costs in general.
Changes in the composition of Medicaid beneficiaries have also affected the growth of program spending over time. In some cases, those changes have reduced spending per participant, and in other cases they have increased it. For example, the share of Medicaid beneficiaries who have disabilities—the most costly type of beneficiary, on average—rose from 12 percent in 1975 to 17 percent in 2008. At the same time, the share of beneficiaries who are children—the least costly type of beneficiary—also rose,
FEBRUARY 2013 GROWTH IN MEANS-TESTED PROGRAMS AND TAX CREDITS FOR LOW-INCOME HOUSEHOLDS 11
Table 2.
Federal Spending on and Participation in Selected Means-Tested Programs That Provide Health Care, Selected Years
Source: Congressional Budget Office.
Notes: Benefits under the low-income subsidy for Part D of Medicare were first paid in 2006.
The data shown here are described in Appendix A.
a. The cost of benefits differs substantially among groups of Medicaid participants. In 2010, for example, average spending per enrollee was $10,200 for people under age 65 with disabilities, $9,500 for people age 65 or older, $2,400 for nondisabled adults under age 65, and $1,800 for nondisabled children.
Federal SpendingBillions of 2012 dollars 20 82 280Percentage of gross domestic product 0.4 0.9 1.8
Participation Millions of people 16.5 26.3 53.2Percentage of U.S. residents 7.9 10.4 17.0
Average Spending per Participant (2012 dollars)a 1,200 3,100 5,300
Federal SpendingBillions of 2012 dollars 0 0 25Percentage of gross domestic product 0 0 0.2
Participation Millions of people 0 0 10.6Percentage of U.S. residents 0 0 3.4
Average Spending per Participant (2012 dollars) 0 0 2,300
Medicaid
Medicare Part D Low-Income Subsidy
1972 1991 2011
from 48 percent in 1975 to 51 percent in 2008. (Data on the composition of Medicaid beneficiaries are not available for the full 1972–2011 period.)
In addition, policy changes have expanded the services that Medicaid covers. Over the years, modifications to federal law have required states to cover more services and have allowed states to be reimbursed for more optional benefits. Many states have responded by adding benefits to their programs. States have also been permitted to offer special services, through waivers of federal program requirements, to subgroups of the eligible population. Such waivers have been used, for instance, to expand home- and community-based long-term care services for people who meet Medicaid’s criteria for nursing home care. (States are allowed to cap the number of participants in such waiver programs, because more elderly and dis-abled people may seek those services than would have sought nursing home care.)8
States have also had increasing opportunities to receive federal matching funds for supplemental payments to health care providers. Most of those payments—such as ones made to hospitals that provide disproportionate shares of Medicaid services and uncompensated care, relative to other hospitals—did not exist in 1972. In 2012, such supplemental payments made up about 9 percent of Medicaid spending.
Number of Participants. The U.S. population grew by 49 percent between 1972 and 2011, which accounts for
8. Some changes to covered services have also had the effect of increasing Medicaid enrollment. As services that targeted particu-lar populations were added, enrollment among those populations increased. Other policy changes extended new benefits to new populations. For example, the Medicare Catastrophic Coverage Act of 1988 was the first of several laws that required state Medic-aid programs to pay the cost-sharing amounts—and in some cases the Medicare premiums—of low-income Medicare beneficiaries.
CBO
12 GROWTH IN MEANS-TESTED PROGRAMS AND TAX CREDITS FOR LOW-INCOME HOUSEHOLDS FEBRUARY 2013
CBO
Figure 3.
Growth in Selected Means-Tested Programs That Provide Health Care, 1972 to 2011
Source: Congressional Budget Office.
Notes: The data used for this figure are described in Appendix A.
Medicare LIS = low-income subsidy for Part D of Medicare.
1972 1975 1978 1981 1984 1987 1990 1993 1996 1999 2002 2005 2008 20110
50
100
150
200
250
300
Medicaid
Medicare LIS
Federal Spending(Billions of 2012 dollars)
1972 1975 1978 1981 1984 1987 1990 1993 1996 1999 2002 2005 2008 20110
10
20
30
40
50
60
1972 1975 1978 1981 1984 1987 1990 1993 1996 1999 2002 2005 2008 20110
1
2
3
4
5
6
Participation
Average Spending per Participant
(Millions of people)
(Thousands of 2012 dollars)
Medicare LIS
Medicare LIS
Medicaid
Medicaid
FEBRUARY 2013 GROWTH IN MEANS-TESTED PROGRAMS AND TAX CREDITS FOR LOW-INCOME HOUSEHOLDS 13
some of the more-than-threefold increase in the number of Medicaid participants during that time. More impor-tant, the share of the population receiving Medicaid benefits more than doubled over that period—from 8 percent to 17 percent—mostly because of expansions in eligibility for the program. When Medicaid began, participating states were required to cover only people (with a few exceptions) who were eligible for benefits under certain cash assistance programs, such as Aid to Families with Dependent Children, the predecessor to TANF. Beyond those groups, states could cover a limited number of optional populations that were not eligible for cash assistance, including some children from low-income families and certain people who had high medical expenses relative to their income. Over the years, federal law was modified repeatedly to expand eligibility, either automatically or at the discretion of the states. For instance, a series of laws enacted in the 1980s and early 1990s extended Medicaid coverage to additional preg-nant women and children from low-income families who were ineligible for cash assistance.
In addition, states have taken advantage of opportunities to convert programs that they had previously financed entirely with their own funds into programs for which they could claim federal matching payments under Medicaid. As one example, the federal share of Medicaid spending on mental health services and hospitals has increased substantially over the years. States that had funded most of those services themselves gradually shifted the delivery of mental health services in such a way as to become eligible for Medicaid reimbursement, enabling them to receive federal matching payments for those expenditures.9
Medicare Part D Low-Income Subsidy. Medicare is the federal government’s health insurance program for people age 65 and older (and for younger people with certain disabilities); Part D is the portion of Medicare that covers prescription drugs. Medicare as a whole is not limited to low-income people, but the low-income subsidy offered through Part D (also known as the Extra Help program or LIS) is means-tested. It subsidizes prescription drug benefits for Medicare beneficiaries whose household
9. See, for example, Richard G. Frank, Howard H. Goldman, and Michael Hogan, “Medicaid and Mental Health: Be Careful What You Ask For,” Health Affairs, vol. 22, no. 1 (January 2003), pp. 101–113, http://dx.doi.org/10.1377/hlthaff.22.1.101.
income is no more than 150 percent of the federal pov-erty guidelines and whose assets do not exceed certain thresholds.10 Like the rest of Part D, the low-income subsidy was authorized by the Medicare Prescription Drug, Improvement, and Modernization Act of 2003. Before that law was enacted, many low-income Medicare beneficiaries received prescription drug coverage through Medicaid.
In 2007, the first full fiscal year that the program was in operation, LIS benefits were paid to 9 million recipients at a cost of $18 billion—or an average of $2,000 per par-ticipant. Both participation and spending per participant increased gradually over the next four years. In 2011, roughly $25 billion in LIS benefits were distributed to 10.6 million people, for an average cost of $2,300 per participant.
Means-Tested Cash Assistance Programs and Tax CreditsFour of the programs and tax credits examined in this study provide cash payments to people with low income. The refundable portions of the earned income tax credit and child tax credit subsidize the earnings of workers with low earnings; Supplemental Security Income provides assistance to disabled or elderly people; and Temporary Assistance for Needy Families is a source of cash assistance to families with low income. Combined spending on those programs rose from $18 billion in 1972 to $151 billion in 2011, or from 0.3 percent to 1.0 percent of GDP, an average annual increase that was almost 6 percent above the rate of inflation (see Table 3 and Figure 4). Growth in the two tax credits over the past 20 years was responsible for the majority of that increase. (The EITC and CTC are refundable tax credits, meaning that if the amount of credit for which someone is eligible exceeds his or her tax liabilities, the taxpayer receives the excess as a payment. In this analysis, CBO’s estimates of spending and participation for those tax credits apply
10. The federal poverty guidelines issued by the Department of Health and Human Services, which are used to determine eligibility for various programs, differ slightly from the poverty thresholds issued by the Census Bureau, which are used mainly for statistical purposes (such as determining the number of people liv-ing in poverty). For a family of two, eligibility for LIS required a family income of less than about $22,000 in 2011; for more infor-mation, see Congressional Budget Office, Spending Patterns for Prescription Drugs Under Medicare Part D (December 2011), www.cbo.gov/publication/42692.
CBO

14 GROWTH IN MEANS-TESTED PROGRAMS AND TAX CREDITS FOR LOW-INCOME HOUSEHOLDS FEBRUARY 2013
CBO
Table 3.
Federal Spending on and Participation in Selected Means-Tested Programs and Tax Credits That Provide Cash Assistance, Selected Years
Source: Congressional Budget Office.
Notes: The Supplemental Security Income program began paying benefits in 1974, the earned income tax credit in 1976, and the child tax credit in 1999.
The data shown here are described in Appendix A.
AFDC = Aid to Families with Dependent Children; TANF = Temporary Assistance for Needy Families.
a. Numbers for the tax credits consist only of amounts that are paid to tax filers because they exceed filers’ tax liabilities. (In addition to those payments, the tax credits reduce federal revenues by lowering the amount that tax filers owe. For the earned income tax credit, those reductions were zero in 1972, $2 billion in 1991, and $5 billion in 2011; for the child tax credit, they were zero in 1972 and 1991 and $29 billion in 2011.)
b. Comprehensive data on participation and spending per participant are not available for TANF.
Federal SpendingBillions of 2012 dollars 0 8 55Percentage of gross domestic product 0 0.1 0.4
Participation Millions of tax filers 0 8.7 25.2Percentage of all tax filers 0 7.6 17.7
Average Spending per Participant (2012 dollars) 0 900 2,200
Federal SpendingBillions of 2012 dollars 0 23 49Percentage of gross domestic product 0 0.2 0.3
Participation Millions of people 0 4.5 7.8Percentage of U.S. residents 0 1.8 2.5
Average Spending per Participant (2012 dollars) 0 5,000 6,300
Federal SpendingBillions of 2012 dollars 0 0 28Percentage of gross domestic product 0 0 0.2
Participation Millions of tax filers 0 0 21.0Percentage of all tax filers 0 0 14.7
0 0 1,300
Federal SpendingBillions of 2012 dollars 18 20 18Percentage of gross domestic product 0.3 0.2 0.1
Average Spending per Participant (2012 dollars)
Child Tax Credita
AFDC/TANFb
Supplemental Security Income
Earned Income Tax Credita
1972 1991 2011

FEBRUARY 2013 GROWTH IN MEANS-TESTED PROGRAMS AND TAX CREDITS FOR LOW-INCOME HOUSEHOLDS 15
Figure 4.
Growth in Selected Means-Tested Programs and Tax Credits That Provide Cash Assistance, 1972 to 2011
Source: Congressional Budget Office.
Notes: The data used for this figure are described in Appendix A.
AFDC = Aid to Families with Dependent Children; TANF = Temporary Assistance for Needy Families.
a. Numbers for the tax credits consist only of amounts that are paid to tax filers because they exceed filers’ tax liabilities.
b. For the Supplemental Security Income program, participation is measured as the number of people who receive benefits. For the tax credits, participation is measured as the number of tax-filing units that receive refundable credits. (Such units can contain more than one person.) Comprehensive data on participation and spending per participant are not available for TANF.
1972 1975 1978 1981 1984 1987 1990 1993 1996 1999 2002 2005 2008 20110
10
20
30
40
50
60
Federal Spending(Billions of 2012 dollars)
1972 1975 1978 1981 1984 1987 1990 1993 1996 1999 2002 2005 2008 20110
5
10
15
20
25
30
1972 1975 1978 1981 1984 1987 1990 1993 1996 1999 2002 2005 2008 20110
1
2
3
4
5
6
7
Participationb
Average Spending per Participantb
(Millions of participants)
(Thousands of 2012 dollars)
AFDC/TANF
Earned Income Tax Credita
SupplementalSecurity Income
Child Tax Credita
Child Tax Credit
Earned Income Tax Credit
SupplementalSecurity Income
Child Tax Credita
Supplemental Security Income
Earned Income Tax Credita
CBO
16 GROWTH IN MEANS-TESTED PROGRAMS AND TAX CREDITS FOR LOW-INCOME HOUSEHOLDS FEBRUARY 2013
CBO
only to such payments, which are usually called the refundable portions of the credits.)11
Earned Income Tax Credit. The EITC provides cash assis-tance through the federal income tax system to tax filers on the basis of their family size and earnings. The credit is not available to tax filers without earnings. It increases with people’s earnings, up to a maximum credit amount for a given family size. The credit remains at that maxi-mum size as earnings rise, until, at a certain amount of earnings, the credit begins to decrease. When earnings reach specific thresholds, tax filers are no longer eligible for the EITC. In 2012, those thresholds ranged from $13,980 for a single worker without children to $50,270 for a married couple with three or more children.
The first EITC payments were made in 1976. Spending on the refundable portion of the credit remained rela-tively small through the 1980s; in 1991, it totaled $8 billion (0.1 percent of GDP). By 2011, when nearly one-fifth of tax filers claimed the refundable EITC, that spending had risen to $55 billion (0.4 percent of GDP). The average EITC payment in that year was $2,200. (The nonrefundable portion of the EITC, which is not included in this analysis, reduced federal revenues by $5 billion in 2011.)
Most of the growth in EITC spending after 1976 stemmed from policy changes that increased the maxi-mum credit and the range of income over which the EITC is available. The maximum credit was raised for all families with children in the 1980s and 1990s; and since 2000, lawmakers have expanded the credit for married couples filing joint tax returns (in both EGTRRA and ARRA) and for families with three or more children (in ARRA). Largely because of those changes, both the per-centage of tax filers receiving EITC payments and the average amount of those payments more than tripled between 1976 and 2011. The total number of people filing tax returns also rose during that period, but that increase accounted for a relatively small portion of the growth in EITC spending.
Supplemental Security Income. SSI was established by the Social Security Amendments of 1972 and began paying benefits in 1974 to low-income people who were age 65 or older, blind, or disabled. SSI was designed to
11. For more information about those and other tax credits, see Congressional Budget Office, Refundable Tax Credits (January 2013), www.cbo.gov/publication/43767.
replace a wide range of earlier federally supported pro-grams run by the states that provided cash assistance to low-income people who were elderly, blind, or disabled. The maximum monthly SSI benefit in 2012 was $698 for an individual and $1,048 for a couple. People receive the maximum benefit only if they have no more than minimal income from other specified sources. If they do have other income, such as more than $65 a month in wages or $20 in Social Security benefits, their SSI benefits are reduced.12 In addition to low income, SSI applicants must have assets below certain thresholds to qualify for the program. In 2011, 70 percent of SSI par-ticipants were blind or disabled adults younger than 65, 16 percent were blind or disabled children, and 14 per-cent were people age 65 or older.
Federal spending on the SSI program has risen gradually over the years, from $16 billion in 1975 to $49 billion in 2011, an average annual increase of about 3 percent above the rate of inflation. Roughly 60 percent of that rise is attributable to increases in participation; the rest resulted from growth in spending per participant.
The number of people receiving SSI benefits doubled between 1975 and 2011, from 3.9 million to 7.8 million. About half of the increase in participation can be attributed to population growth, but the share of the population participating in the program also rose, from 1.8 percent in 1975 to 2.5 percent in 2011. In particular, the percentages of disabled children and disabled adults under age 65 who participated in SSI grew. One reason is that the 1990 Supreme Court ruling in Sullivan v. Zebley allowed children to qualify for SSI on the basis of functional limitations rather than specific medical diagnoses, which increased the percentage of disabled children eligible for the program.13 The share of non-elderly adults eligible for SSI rose in part because the Social Security Disability Reform Act of 1984 loosened standards for defining disability. In addition, outreach efforts in the early 1990s to increase awareness of the pro-gram probably raised the percentage of disabled children and nonelderly disabled adults participating in SSI. By contrast, the share of people age 65 or older who were
12. SSI benefits are not reduced for the receipt of in-kind benefits, such as nutrition, housing, or education assistance. For more information about the SSI program and options for changing it, see Congressional Budget Office, Supplemental Security Income: An Overview (December 2012), www.cbo.gov/publication/43759.
13. 493 U.S. 521, 541 (1990).
FEBRUARY 2013 GROWTH IN MEANS-TESTED PROGRAMS AND TAX CREDITS FOR LOW-INCOME HOUSEHOLDS 17
eligible for and ultimately received SSI benefits declined between 1975 and 2011, mainly because people in that age range have become more likely to have Social Security benefits that are high enough to make them ineligible for SSI. In recent years, the recession and slow recovery have lowered income and thus made more disabled people eligible to receive SSI benefits.
Spending per SSI participant rose by 57 percent between 1975 and 2011, from $4,000 to $6,300 (after adjustment for inflation). Part of the reason is that the inflation measure that CBO used for that adjustment, the personal consumption expenditures (PCE) price index, grows more slowly than the measure used to increase SSI pay-ments each year.14 In addition, the Omnibus Budget Reconciliation Act of 1990 specified that SSI benefits would no longer be reduced if someone received an EITC payment.
Child Tax Credit. The CTC allows families to claim a tax credit of up to $1,000 for each child under 17 years old. In 2011, the refundable portion of the credit went almost entirely to families with income below $50,000. The reason is that families with higher income typically owe enough federal income tax that the entire CTC goes to offset the amount they owe, with nothing left over to be paid to the tax filer. In 2011, spending on the refundable portion of the CTC totaled $28 billion. (The nonrefundable portion lowered people’s total income tax liabilities—and thus federal revenues—by $29 billion in 2011, but only 30 percent of that went to tax filers with income below $50,000.) Like the EITC, the refundable portion of the child tax credit is not available to families without earnings.
The CTC was created by the Taxpayer Relief Act of 1997 and has been expanded several times since then. Initially, the refundable portion of the credit was available only to families with three or more children and only as an offset to their share of payroll taxes that had not been offset by the EITC. The CTC provided a maximum benefit of
14. By law, the maximum monthly SSI benefit increases with the cost of living as measured by the consumer price index for urban wage earners and clerical workers (CPI-W). In converting dollar amounts to 2012 dollars to remove the effects of inflation for this analysis, CBO measured inflation using the PCE price index, which accounts more fully than the CPI-W does for consumers’ ability to purchase cheaper goods when they become available. Neither the PCE price index nor the CPI-W specifically measures the cost of living for disabled or elderly people.
$400 per child (rising to $500 in 1999). A series of legislative changes, beginning with EGTRRA in 2001, extended the refundable portion of the credit to families with one or two children and raised the maximum bene-fit to $1,000 per child. As a result, spending on the refundable part of the CTC increased from $1 billion in 2001 to $28 billion in 2011, as the share of tax filers receiving a payment because of the credit grew from 1 percent to 15 percent.
The average CTC payment hovered around $1,000 from 2001 to 2011. That stability was the result of two countervailing trends. On the one hand, the tax filers who became newly eligible for the CTC during that period had fewer than three children and thus received smaller credits, on average. On the other hand, the expanded refundability of the credit and the increase in the maximum benefit per child substantially boosted the average amount spent on filers with three or more children.
Temporary Assistance for Needy Families. TANF pro-vides cash and other forms of assistance to some families with little or no income. It was created by the Personal Responsibility and Work Opportunity Reconciliation Act of 1996 (PRWORA) as a successor to the Aid to Families with Dependent Children program (AFDC), which began in 1935. Like AFDC, TANF makes monthly cash payments to low-income families at a level determined by state-specific formulas and is administered by state agen-cies. TANF differs from its predecessor in various ways, however. In particular, whereas AFDC allowed families to receive assistance for as long as they were otherwise eligi-ble, TANF imposes a five-year lifetime limit on benefits. In addition, TANF has a much greater emphasis than AFDC did on encouraging recipients to work. Reflecting that emphasis, less than 50 percent of TANF spending goes to cash assistance. The rest pays for various services for low-income families with children, including child care, transportation to work, and other types of work-related assistance. (Some participants in TANF receive work-support services but not cash payments.)
Between 1972 and 1996, spending on the AFDC pro-gram rose from $18 billion to $21 billion (in 2012 dol-lars).15 That growth was slower than the growth of the
15. Spending figures for AFDC include funding for two AFDC-related programs that were also replaced by TANF: Emergency Assistance to Needy Families, and Job Opportunities and Basic Skills Training.
CBO

18 GROWTH IN MEANS-TESTED PROGRAMS AND TAX CREDITS FOR LOW-INCOME HOUSEHOLDS FEBRUARY 2013
CBO
economy; consequently, AFDC spending declined from 0.3 percent of GDP to 0.2 percent over that period. Under PRWORA, states had to transition from AFDC to TANF by July 1997. Since 1998, the primary source of federal funding for TANF has been state family assistance grants, which have amounted to about $16 billion a year. Inflation-adjusted spending on TANF has been fairly sta-ble since the late 1990s. By 2011, it equaled 0.1 percent of GDP.16
As a rising share of spending went toward work support and other services, the number of people receiving cash assistance through TANF declined. When the AFDC program ended, 13 million people were recipients of cash assistance; in 2011, TANF provided cash payments to about 4 million people. (Data on the number of people receiving other forms of assistance from TANF are not available.)
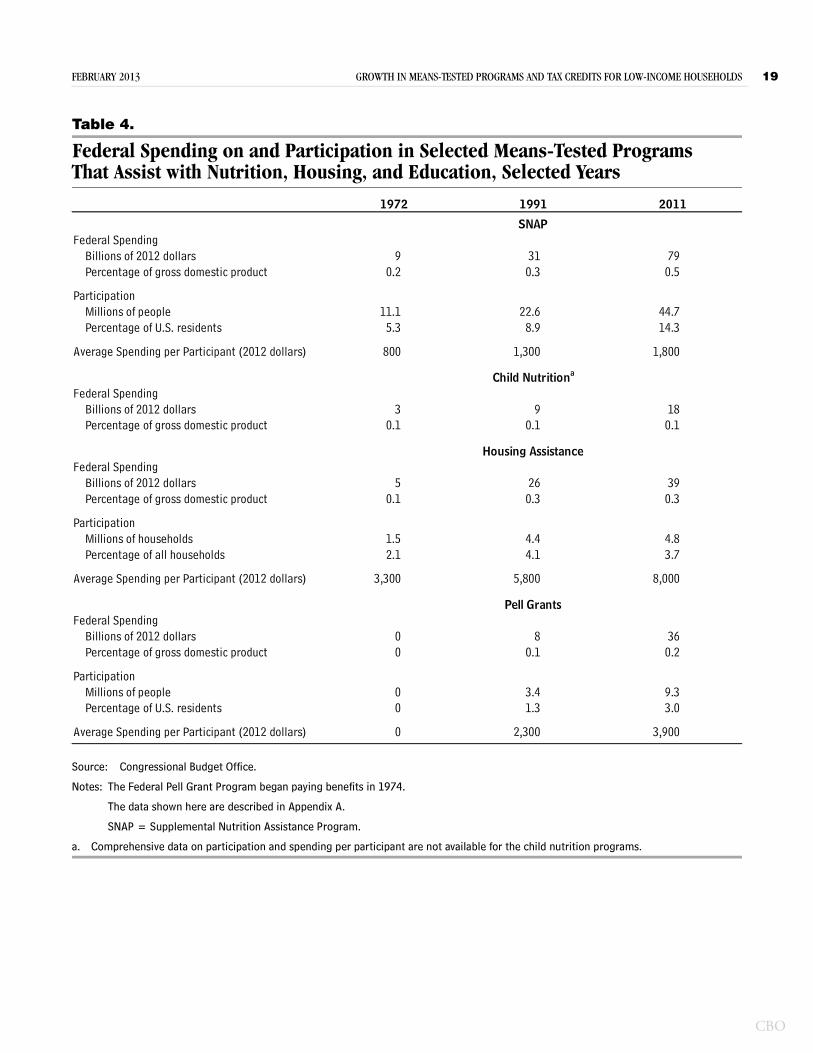
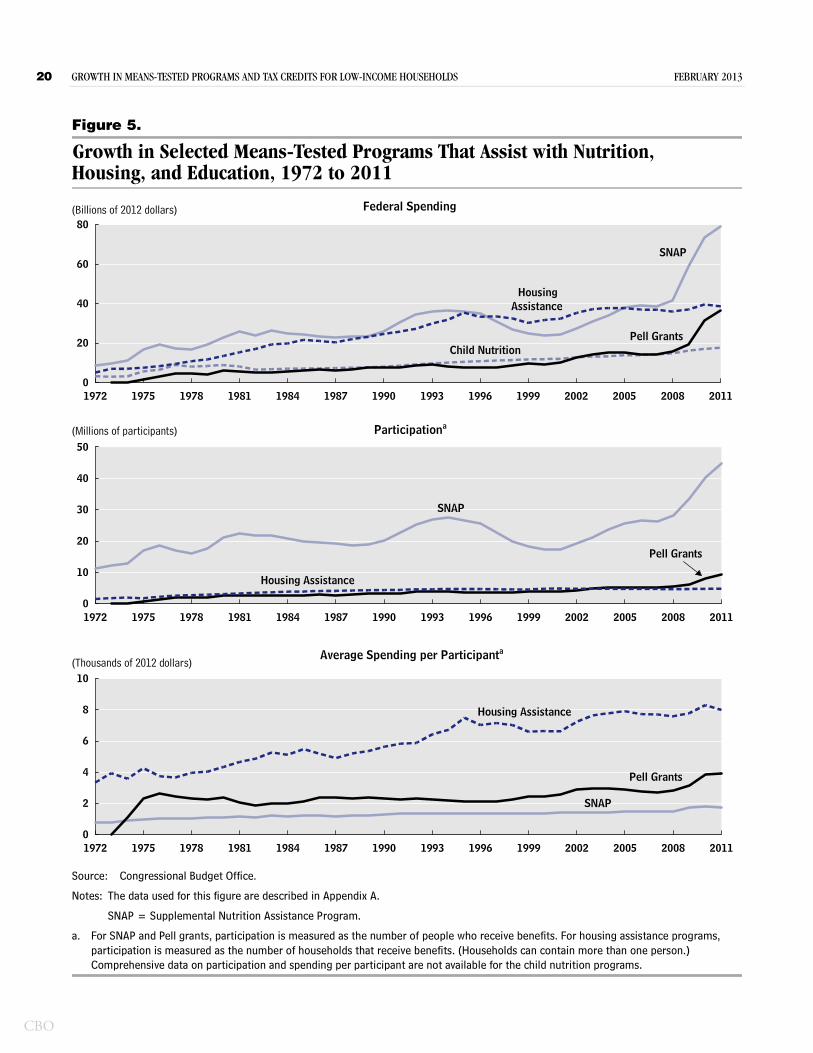
Means-Tested Nutrition, Housing, and Education ProgramsThe other programs included in this analysis help people obtain food, housing, and education. They consist of SNAP, child nutrition programs (such as the National School Lunch Program and the School Breakfast Pro-gram), various programs that subsidize the cost of housing for low-income people, and the Federal Pell Grant Program. Combined spending on those programs rose from $17 billion (0.3 percent of GDP) in 1972 to $172 billion (1.1 percent of GDP) in 2011 (see Table 4)—an average annual increase of about 6 percent above the rate of inflation. Approximately 40 percent of that increase came from growth in spending on SNAP and Pell grants since 2007 (see Figure 5).
Supplemental Nutrition Assistance Program. SNAP, for-merly called the Food Stamp program, provides benefits to households with low income to help them purchase food.17 Versions of the program have been in place since 1939. People now receive SNAP benefits through an elec-tronic benefit transfer card that they use to buy approved
16. Funding for the program each year is set by law. The statutory authorization for TANF expired in 2010, and the program has been maintained through a series of short-term extensions since then.
17. For a more complete discussion of the program and options for changing it, see Congressional Budget Office, The Supplemental Nutrition Assistance Program (April 2012), www.cbo.gov/publication/43173.
food at participating stores. In 2010, about three out of four households that received SNAP benefits included a child, someone age 60 or older, or a disabled person. SNAP recipients generally live in households with very low income—an average of about $9,000 in 2010.
Over the 1972–2011 period, spending on SNAP increased from $9 billion (0.2 percent of GDP) to $79 billion (0.5 percent of GDP). A rising participation rate and higher spending per participant were the major reasons—accounting for 44 percent and 37 percent of that increase, respectively. Population growth accounted for the other 19 percent of the increase in spending over that period.
The participation rate (the percentage of U.S. residents taking part in SNAP) grew from 5 percent in 1972 to 14 percent in 2011. The rise in participation was particu-larly rapid in the past decade, both before and after the recent recession began. The number of people receiving SNAP benefits increased by almost 40 percent between fiscal years 2002 and 2007 and even more rapidly, by about 60 percent, between fiscal years 2008 and 2011. Between 2002 and 2007, greater participation mainly resulted from outreach initiatives, including efforts to increase awareness of SNAP and streamline the applica-tion process. The faster rise between 2008 and 2011 occurred primarily because of poor economic conditions, although outreach efforts continued to play a role.
Average spending per SNAP participant increased from $800 to $1,800 over the 1972–2011 period, in part because SNAP benefits rise as the cost of food does and because lawmakers have changed the formula for deter-mining the amount of benefits several times in the past 40 years. Through most of that period, per-person spend-ing grew steadily, reaching about $1,500 in 2008. The following year, largely because of temporarily higher ben-efit amounts enacted in ARRA, benefits increased to roughly $1,800 per recipient; they remained near that amount through 2011.
Child Nutrition Programs. A collection of federal pro-grams provide free or reduced-price meals, generally in schools, to children from low-income families. Those child nutrition programs include the National School Lunch Program and the School Breakfast Program, which offer meals to low-income students in kindergarten through 12th grade. Smaller child nutrition programs
FEBRUARY 2013 GROWTH IN MEANS-TESTED PROGRAMS AND TAX CREDITS FOR LOW-INCOME HOUSEHOLDS 19
Table 4.
Federal Spending on and Participation in Selected Means-Tested Programs That Assist with Nutrition, Housing, and Education, Selected Years
Source: Congressional Budget Office.
Notes: The Federal Pell Grant Program began paying benefits in 1974.
The data shown here are described in Appendix A.
SNAP = Supplemental Nutrition Assistance Program.
a. Comprehensive data on participation and spending per participant are not available for the child nutrition programs.
Federal SpendingBillions of 2012 dollars 9 31 79Percentage of gross domestic product 0.2 0.3 0.5
ParticipationMillions of people 11.1 22.6 44.7Percentage of U.S. residents 5.3 8.9 14.3
Average Spending per Participant (2012 dollars) 800 1,300 1,800
Federal SpendingBillions of 2012 dollars 3 9 18Percentage of gross domestic product 0.1 0.1 0.1
Federal SpendingBillions of 2012 dollars 5 26 39Percentage of gross domestic product 0.1 0.3 0.3
ParticipationMillions of households 1.5 4.4 4.8Percentage of all households 2.1 4.1 3.7
Average Spending per Participant (2012 dollars) 3,300 5,800 8,000
Federal SpendingBillions of 2012 dollars 0 8 36Percentage of gross domestic product 0 0.1 0.2
ParticipationMillions of people 0 3.4 9.3Percentage of U.S. residents 0 1.3 3.0
Average Spending per Participant (2012 dollars) 0 2,300 3,900
Child Nutritiona
Pell Grants
Housing Assistance
SNAP
1972 1991 2011
CBO
20 GROWTH IN MEANS-TESTED PROGRAMS AND TAX CREDITS FOR LOW-INCOME HOUSEHOLDS FEBRUARY 2013
CBO
Figure 5.
Growth in Selected Means-Tested Programs That Assist with Nutrition, Housing, and Education, 1972 to 2011
Source: Congressional Budget Office.
Notes: The data used for this figure are described in Appendix A.
SNAP = Supplemental Nutrition Assistance Program.
a. For SNAP and Pell grants, participation is measured as the number of people who receive benefits. For housing assistance programs, participation is measured as the number of households that receive benefits. (Households can contain more than one person.) Comprehensive data on participation and spending per participant are not available for the child nutrition programs.
1972 1975 1978 1981 1984 1987 1990 1993 1996 1999 2002 2005 2008 20110
20
40
60
80
Federal Spending(Billions of 2012 dollars)
1972 1975 1978 1981 1984 1987 1990 1993 1996 1999 2002 2005 2008 20110
10
20
30
40
50
1972 1975 1978 1981 1984 1987 1990 1993 1996 1999 2002 2005 2008 20110
2
4
6
8
10
Participationa
Average Spending per Participanta
(Millions of participants)
(Thousands of 2012 dollars)
SNAP
Child NutritionPell Grants
HousingAssistance
SNAP
Pell Grants
Housing Assistance
SNAP
Pell Grants
Housing Assistance

FEBRUARY 2013 GROWTH IN MEANS-TESTED PROGRAMS AND TAX CREDITS FOR LOW-INCOME HOUSEHOLDS 21
provide meals to children in day care or to students after school or during the summer. Federal programs of those types have existed since the 1930s but have varied in size and scope over time.18
Total spending on child nutrition programs grew from $3 billion in 1972 to $9 billion in 1991 and $18 billion in 2011. As a share of GDP, spending doubled—from 0.06 percent of GDP in 1972 to 0.12 percent in 2011. That growth was slower and more consistent than the growth of spending on SNAP. For example, whereas spending on SNAP shot up during the recession that began in December 2007, spending on child nutrition programs increased only modestly (see the top panel of Figure 5).
Total participation in child nutrition programs is difficult to measure because an unknown number of children take part in more than one program—for example, many children who participate in the School Breakfast Program also participate in the National School Lunch Program. For that reason, CBO could not calculate the extent to which the increase in total spending on child nutrition programs sprang from population growth, changes in participation, or changes in spending per participant.
Housing Programs. Several federal programs provide housing assistance to families with low income. The largest programs were authorized under section 8 of the United States Housing Act of 1937 and help people with their rent. Section 8 subsidies can take the form of vouch-ers that recipients can use with any landlord or specific units that are set aside for eligible recipients. In addition to the Section 8 programs, the largest of the other federal housing programs considered here subsidize capital and operating expenses for the construction of housing for low-income residents.19
Spending on housing assistance grew much more quickly during the first 20 years of the 1972–2011 period than during the second 20 years. Between 1972 and 1991, spending on housing assistance programs increased fivefold, from $5 billion to $26 billion (adjusted for
18. See Gordon W. Gunderson, The National School Lunch Program: Background and Development (Department of Agriculture, 1971), www.fns.usda.gov/cnd/lunch/AboutLunch/ProgramHistory.htm.
19. For more information about housing assistance programs, see Congressional Budget Office, An Overview of Federal Support for Housing (November 2009), www.cbo.gov/publication/41219.
inflation). Both the participation rate and spending per participant roughly doubled during that period. Between 1991 and 2011, spending on means-tested housing pro-grams grew much more slowly, by about 50 percent, and remained roughly constant as a share of GDP. The growth of spending during that period was caused mostly by rising spending per participant—the amount spent per subsidized household increased from $5,800 in 1991 to $8,000 in 2011. Program participation grew only slightly during that period when measured as the number of sub-sidized households and fell modestly when measured as the percentage of households receiving assistance (see Table 4).
The share of the population that benefits from housing programs is noticeably smaller than the share that bene-fits from some of the other means-tested programs included in this analysis. In 2011, 4 percent of house-holds participated in federal housing assistance programs, compared with about 17 percent of the population for Medicaid, 18 percent of tax filers for the EITC, and 14 percent of the population for SNAP. The availability of subsidized housing depends largely on the amount of federal funding that the housing assistance programs receive, which is determined annually through the appro-priation process. Despite the relatively small percentage of the population that those programs serve, spending on them has been substantial—totaling $39 billion in 2011—because they provide a large amount of assistance per household receiving help.
Federal Pell Grant Program. Pell grants were established in 1972 and help fund tuition and expenses for post-secondary students from low-income families. Unlike federal student loans, Pell grants do not need to be repaid. The maximum Pell grant has varied over the years; in 2011, it was $5,550. Grant amounts are partly based on a student’s family income; different calculations are used for dependent students, independent students, and independent students with their own dependents. Holding other factors constant, students from families with lower income receive larger Pell grants. In 2010, about 75 percent of Pell grant recipients had family income of $30,000 or less.
The first Pell grants were awarded in 1974, but the pro-gram took several years to ramp up. By 1977, it had 1.9 million recipients. Between 1977 and 2011, spending on the program grew from $5 billion to $36 billion. Sev-enty percent of that growth occurred over the last four
CBO
22 GROWTH IN MEANS-TESTED PROGRAMS AND TAX CREDITS FOR LOW-INCOME HOUSEHOLDS FEBRUARY 2013
CBO
years of the period, as the number of Pell grant recipients increased from 5.2 million in 2007 to 9.3 million in 2011.
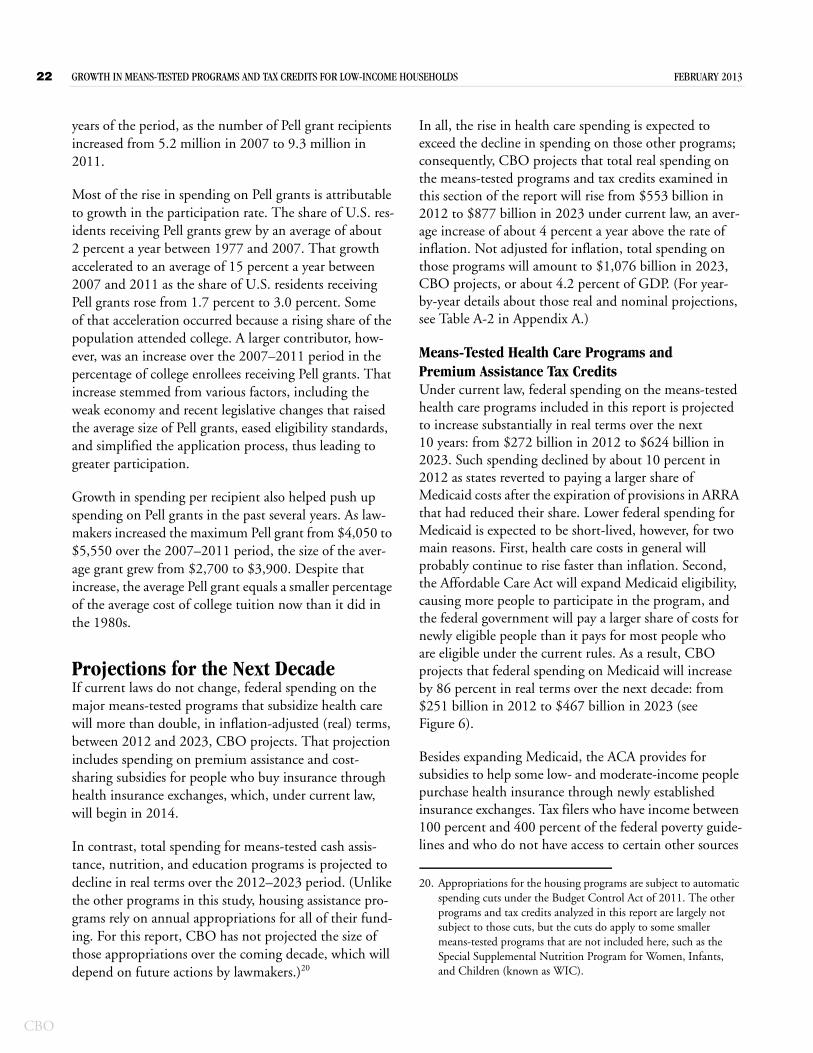
Most of the rise in spending on Pell grants is attributable to growth in the participation rate. The share of U.S. res-idents receiving Pell grants grew by an average of about 2 percent a year between 1977 and 2007. That growth accelerated to an average of 15 percent a year between 2007 and 2011 as the share of U.S. residents receiving Pell grants rose from 1.7 percent to 3.0 percent. Some of that acceleration occurred because a rising share of the population attended college. A larger contributor, how-ever, was an increase over the 2007–2011 period in the percentage of college enrollees receiving Pell grants. That increase stemmed from various factors, including the weak economy and recent legislative changes that raised the average size of Pell grants, eased eligibility standards, and simplified the application process, thus leading to greater participation.
Growth in spending per recipient also helped push up spending on Pell grants in the past several years. As law-makers increased the maximum Pell grant from $4,050 to $5,550 over the 2007–2011 period, the size of the aver-age grant grew from $2,700 to $3,900. Despite that increase, the average Pell grant equals a smaller percentage of the average cost of college tuition now than it did in the 1980s.
Projections for the Next DecadeIf current laws do not change, federal spending on the major means-tested programs that subsidize health care will more than double, in inflation-adjusted (real) terms, between 2012 and 2023, CBO projects. That projection includes spending on premium assistance and cost-sharing subsidies for people who buy insurance through health insurance exchanges, which, under current law, will begin in 2014.
In contrast, total spending for means-tested cash assis-tance, nutrition, and education programs is projected to decline in real terms over the 2012–2023 period. (Unlike the other programs in this study, housing assistance pro-grams rely on annual appropriations for all of their fund-ing. For this report, CBO has not projected the size of those appropriations over the coming decade, which will depend on future actions by lawmakers.)20
In all, the rise in health care spending is expected to exceed the decline in spending on those other programs; consequently, CBO projects that total real spending on the means-tested programs and tax credits examined in this section of the report will rise from $553 billion in 2012 to $877 billion in 2023 under current law, an aver-age increase of about 4 percent a year above the rate of inflation. Not adjusted for inflation, total spending on those programs will amount to $1,076 billion in 2023, CBO projects, or about 4.2 percent of GDP. (For year-by-year details about those real and nominal projections, see Table A-2 in Appendix A.)
Means-Tested Health Care Programs and Premium Assistance Tax CreditsUnder current law, federal spending on the means-tested health care programs included in this report is projected to increase substantially in real terms over the next 10 years: from $272 billion in 2012 to $624 billion in 2023. Such spending declined by about 10 percent in 2012 as states reverted to paying a larger share of Medicaid costs after the expiration of provisions in ARRA that had reduced their share. Lower federal spending for Medicaid is expected to be short-lived, however, for two main reasons. First, health care costs in general will probably continue to rise faster than inflation. Second, the Affordable Care Act will expand Medicaid eligibility, causing more people to participate in the program, and the federal government will pay a larger share of costs for newly eligible people than it pays for most people who are eligible under the current rules. As a result, CBO projects that federal spending on Medicaid will increase by 86 percent in real terms over the next decade: from $251 billion in 2012 to $467 billion in 2023 (see Figure 6).
Besides expanding Medicaid, the ACA provides for subsidies to help some low- and moderate-income people purchase health insurance through newly established insurance exchanges. Tax filers who have income between 100 percent and 400 percent of the federal poverty guide-lines and who do not have access to certain other sources
20. Appropriations for the housing programs are subject to automatic spending cuts under the Budget Control Act of 2011. The other programs and tax credits analyzed in this report are largely not subject to those cuts, but the cuts do apply to some smaller means-tested programs that are not included here, such as the Special Supplemental Nutrition Program for Women, Infants, and Children (known as WIC).

FEBRUARY 2013 GROWTH IN MEANS-TESTED PROGRAMS AND TAX CREDITS FOR LOW-INCOME HOUSEHOLDS 23
Figure 6.
Federal Spending on Selected Means-Tested Programs and Tax Credits, 2000 to 2023(Billions of 2012 dollars)
2000 2003 2006 2009 2012 2015 2018 20210
100
200
300
400
500Health Care
Medicaid
Medicare Part D
Low-Income Subsidy
Insurance Exchange
Subsidiesa
Actual Projected
Source: Congressional Budget Office.
Notes: Numbers for tax credits consist only of amounts that are paid to tax filers because they exceed filers’ tax liabilities. (In addition to those payments, the tax credits reduce fed-eral revenues by lowering the amount that taxpayers owe.)
Housing assistance programs, which are included in the his-torical analyses in this report, rely on annual appropriations for all of their funding. CBO has not projected the size of those appropriations, which will depend on future actions by lawmakers, so those programs are not included here.
The data used for this figure are described in Appendix A.
TANF = Temporary Assistance for Needy Families; SNAP = Supplemental Nutrition Assistance Program.
a. Subsidies for health insurance purchased through insurance exchanges, which are due to start operating in 2014, consist of refundable tax credits for premium assistance and subsidies to reduce the share of out-of-pocket costs paid by enrollees.
2000 2003 2006 2009 2012 2015 2018 20210
20
40
60
80
100
2000 2003 2006 2009 2012 2015 2018 20210
20
40
60
80
100
Cash Assistance
Nutrition and Education
SNAP
SupplementalSecurity Income
TANF
Earned IncomeTax Credit
Child Tax Credit
Child Nutrition
Pell Grants
Actual Projected
Actual Projected
of health insurance will receive a premium assistance tax subsidies are expected to go to people with income below
credit when they buy health insurance through the exchanges. They may also receive cost-sharing subsidies, which will cover some of the out-of-pocket payments they make for health care.21 Most of those exchange21. For CBO’s most recent estimates of the costs of subsidies provided under the ACA, see Congressional Budget Office, The Budget and Economic Outlook: Fiscal Years 2013 to 2023 (February 2013), Appendix A, www.cbo.gov/publication/43907.
200 percent of the poverty guidelines. That subsidy pro-gram is designed so that eligible people with relatively low income will receive greater benefits than those with higher income.
The health insurance exchanges are scheduled to begin operating in 2014, at which point spending on exchange subsidies—the refundable portion of the premium assis-tance tax credit and the cost-sharing subsidies—will
CBO

24 GROWTH IN MEANS-TESTED PROGRAMS AND TAX CREDITS FOR LOW-INCOME HOUSEHOLDS FEBRUARY 2013
CBO
amount to $18 billion (in 2012 dollars), CBO projects. (In addition, the nonrefundable portion of the tax credit is projected to reduce federal revenues by $6 billion in 2014.) Participation in the exchanges is expected to ramp up quickly over the following years, bringing spending to $87 billion (in 2012 dollars) by 2017. Spending is pro-jected to grow more slowly thereafter in real terms, reach-ing $109 billion in 2023. (The nonrefundable portion of the tax credit is projected to reduce federal revenues by $29 billion in 2023.) At that point, exchange subsidies would be the federal government’s second-largest means-tested program, after Medicaid.
Escalating spending for prescription drugs is expected to boost spending on the low-income subsidy for Medicare Part D, which is projected to more than double in real terms by 2023. Rising participation, because of the aging of the population, is also expected to contribute to the growth of spending for LIS.
Means-Tested Cash Assistance Programs and Tax CreditsSpending on cash assistance for disabled or elderly people through the SSI program is projected to increase from $50 billion in 2012 to $56 billion in 2023. That real increase in spending reflects population growth and the resulting boost in the number of SSI beneficiaries.
The amount of cash assistance available to low-income people who are not disabled or elderly is projected to decline over the next 10 years. Under current law, CBO projects, total real spending on the EITC, CTC, and
TANF will fall from $98 billion in 2012 to $80 billion in 2023. Most of that drop involves spending on the two tax credits, because provisions of ARRA that have temporar-ily expanded the credits are set to expire in 2018. Largely because of that scheduled expiration, real spending on the tax credits is projected to fall from $82 billion in 2018 to $69 billion in 2019. The projected decline in real spend-ing on cash assistance also reflects the assumption that TANF will continue to be funded at its current level of $17 billion without adjustments for inflation.
Means-Tested Nutrition and Education ProgramsSpending on means-tested nutrition assistance programs is projected to fall in real terms from $99 billion in 2012 to $83 billion in 2023. That overall decline reflects two different trends: a projected decrease in spending on SNAP and an increase in spending on child nutrition programs. Participation in SNAP is sensitive to economic conditions; hence, participation is expected to fall after 2013 as the economy improves, causing real spending on SNAP to decline from $80 billion in 2012 to $59 billion in 2023. Spending on child nutrition programs has risen steadily in real terms for the past four decades and is expected to continue to do so, reaching $24 billion in 2023, compared with $18 billion in 2012.
Spending on Pell grants depends on the amount that lawmakers set for the maximum grant each year. If that maximum stays at its current amount, spending for the program will be roughly the same in 2023 as in 2012, adjusted for inflation. Under those circumstances, the number of recipients would increase slightly.
Appendix A: Data on Means-Tested Programs and Tax Credits
The data used for this analysis come from a variety of sources and differ in numerous ways (see Table A-1). Those data share several general features, however:
They cover only outlays by the federal government, although states have also spent large amounts on Medicaid, Aid to Families with Dependent Children (AFDC), Temporary Assistance for Needy Families (TANF), and Supplemental Security Income (SSI) over the years.
Federal spending on administrative costs is included in the data for Medicaid, insurance exchange subsidies, AFDC, TANF, the Supplemental Nutrition Assistance Program, child nutrition programs, and housing assistance programs.
Spending and participation are generally reported for the federal fiscal year (which begins on October 1) in which the outlays are made, with the following exceptions:
• Data for SSI for 1974 to 1983 are reported on a calendar year basis.
• Data for the earned income and child tax credits are reported for the fiscal year in which tax returns are due.
• Data for Pell grants are reported by the academic year for which the grants are awarded (which begins on July 1 of the preceding calendar year).
Participation is generally measured as an average over the course of a fiscal year.
The spending figures for 2012 to 2023 in this analysis come from the Congressional Budget Office’s February 2013 baseline, which was published in The Budget and Economic Outlook: Fiscal Years 2013 to 2023. The projec-tions in that report are shown in nominal dollars; for the purposes of this analysis, they were adjusted for inflation and shown in 2012 dollars. In addition, for some of the programs and tax credits, those projections were adjusted to exclude shifts in the timing of certain payments and, in the case of the earned income and child tax credits, to be consistent with the historical data used for this analysis (see Table A-2).
CBO

26 GROWTH IN MEANS-TESTED PROGRAMS AND TAX CREDITS FOR LOW-INCOME HOUSEHOLDS FEBRUARY 2013
CBO
Table A-1.
Sources of Historical Data for This Analysis
Source: Congressional Budget Office.
Program Source NotesHealth Care
Medicaid Spending for 1987 through 2011: Treasury Department. Additional data: Centers for Medicare & Medicaid Services, Medicaid Financial Management Reports (various years), the Medicaid Statistical Information System, and Form HCFA-2082 filings.
The tallies of participants include recipients in Puerto Rico and the U.S. Virgin Islands; the numbers for 2009 to 2011 are preliminary.
Medicare Part D Low-Income Subsidy
Unpublished tabulations from the Centers for Medicare & Medicaid Services.
Annual spending is based on 12 monthly payments, although 11 to 13 payment dates may fall within a year.
Cash AssistanceEarned Income and Child Tax Credits
Internal Revenue Service, Statistics of Income: Individual Income Tax Returns, Publication 1304 (various years).
Eligibility for the tax credits is determined on a calendar year basis. Participation and spending are attributed to the following fiscal year because that is when most tax refunds are claimed.
Supplemental Security Income
Social Security Administration, SSI Monthly Statistics (various months), and Annual Statistical Supplement (1985).
For 1974 to 1983, spending is reported on a calendar year basis, and participation is tallied in December. For 1984 to 2011, spending is reported on a fiscal year basis, and participation is measured as a monthly average over the course of the fiscal year. Annual spending is based on 12 monthly payments, although 11 to 13 payment dates may fall within a year.
Aid to Families with Dependent Children (AFDC) and Temporary Assistance for Needy Families (TANF)
For 2009 and earlier: House Committee on Ways and Means, Green Book (2011 and 1996). For 2010 and 2011: Department of Health and Human Services, Administration for Children & Families, online archives of data and reports for TANF, http://archive.acf.hhs.gov/programs/ofa/data-reports/index.htm.
Spending figures for AFDC include funding for two AFDC-related programs that were also replaced by TANF: Emergency Assistance to Needy Families, and Job Opportunities and Basic Skills Training.
Nutrition, Housing, and EducationSupplemental Nutrition Assistance Program (SNAP) and Child Nutrition Programs
For spending: Office of Management and Budget, Budget of the U.S. Government, Fiscal Year 2013 (February 2012). For participation in SNAP: Department of Agriculture, “Supplemental Nutrition Assistance Program Participation and Costs” (December 7, 2012), www.fns.usda.gov/pd/SNAPsummary.htm.
Child nutrition programs include the National School Lunch Program, the School Breakfast Program, the Child and Adult Care Food Program, and four smaller programs.
Housing Assistance Programs
Department of Housing and Urban Development, Annotated Tables for the 2001 Budget (2001); and Congressional Research Service, Overview of Federal Housing Assistance Programs and Policy (2011).
Programs considered include rental assistance (mostly Section 8) and assistance for capital and operating expenses for public housing.
Federal Pell Grant Program
Department of Education, 2010–2011 Federal Pell Grant Program End-of-Year Report (2012).
Data are reported by the academic year for which the grants are awarded.

APPENDIX A GROWTH IN MEANS-TESTED PROGRAMS AND TAX CREDITS FOR LOW-INCOME HOUSEHOLDS 27
Table A-2.
Projected Federal Spending on Selected Means-Tested Programs and Tax Credits in Real and Nominal Dollars(By fiscal year)
ContinuedSource: Congressional Budget Office.
Note: Projections in nominal dollars reflect the value of the dollar in the year in which the spending is projected to occur and thus include the effects of inflation. Projections in real dollars reflect the value of the dollar in 2012 and thus exclude the effects of inflation. To calculate the amounts in real dollars, CBO adjusted the nominal amounts for inflation using the price index for personal consumption expenditures, which is calculated by the Bureau of Economic Analysis. The projections incorporate the assumption that current laws generally remain unchanged.
a. These amounts differ from CBO’s baseline projections because they are based on 12 monthly payments per year, although 11 to 13 payments may be made within a year, depending on the calendar.
b. These are the amounts that underlie the numbers reported in Table 1-3 of CBO’s Budget and Economic Outlook: Fiscal Years 2013 to 2023; the amounts shown in that table include the portion of exchange subsidies recorded as outlays in the federal budget and grants to help states establish insurance exchanges, but they exclude the portion of exchange subsidies that are recorded as revenues.
c. Numbers for tax credits consist only of amounts that are paid to tax filers because they exceed filers’ tax liabilities.
d. To be consistent with the historical analysis presented in this report, these amounts are projected from historical data in the Internal Revenue Service’s Statistics of Income database. They differ from CBO’s baseline projections, which are based on amounts reported in the Treasury Department’s Monthly Treasury Statement.
e. These amounts differ from CBO’s baseline projections, as shown in Table 1-3 of The Budget and Economic Outlook: Fiscal Years 2013 to 2023, because they exclude adjustments stemming from the recovery of overpayments to beneficiaries and are based on 12 monthly
Actual, 2012 2013 2014 2015 2016 2017 2018 2019 2020 2021 2022 2023
MedicaidBillions of real (2012) dollars 251 262 288 316 348 367 381 396 413 429 446 467Billions of nominal dollars 251 265 297 331 372 399 422 449 476 505 536 572
Medicare Part D Low-Income Subsidy
Billions of real (2012) dollars 21 23 25 26 29 31 33 36 39 42 45 49Billions of nominal dollarsa 21 23 25 28 30 34 37 41 45 49 54 60
Insurance Exchange SubsidiesBillions of real (2012) dollars 0 0 18 39 69 87 96 98 99 104 106 109Billions of nominal dollarsb 0 0 19 41 74 95 106 111 115 122 128 134
Earned Income and Child Tax Creditsc
Billions of real (2012) dollars 81 84 86 86 85 83 82 69 68 67 67 66Billions of nominal dollarsd 81 85 88 90 90 91 91 78 79 79 80 81
Supplemental Security IncomeBillions of real (2012) dollars 50 52 52 53 53 54 54 54 55 55 56 56Billions of nominal dollarse 50 52 54 56 57 59 60 62 63 65 67 69
FamiliesBillions of real (2012) dollars 17 17 17 17 16 16 16 15 15 15 14 14Billions of nominal dollars 17 17 17 17 17 17 17 17 17 17 17 17
Temporary Assistance for Needy
Health Care
Cash Assistance
payments per year, although 11 to 13 payments may actually be made within a year, depending on the calendar.
CBO

28 GROWTH IN MEANS-TESTED PROGRAMS AND TAX CREDITS FOR LOW-INCOME HOUSEHOLDS FEBRUARY 2013
CBO
Table A-2. Continued
Projected Federal Spending on Selected Means-Tested Programs and Tax Credits in Real and Nominal Dollars(By fiscal year)
f. These amounts differ from CBO’s baseline projections, as shown in Table 1-3 of The Budget and Economic Outlook: Fiscal Years 2013 to 2023, because the projections in that table include the Senior Farmers’ Market Nutrition Program and the Strengthening Markets, Income, and Supply account.
g. These amounts consist of both mandatory and discretionary spending for Pell grants and reflect the assumption that future maximum discretionary award levels will remain at $4,860, as set in the most recent appropriation act; they are shown by the academic year for which the grants are awarded, which begins on July 1 of the preceding calendar year.
Actual, 2012 2013 2014 2015 2016 2017 2018 2019 2020 2021 2022 2023
Supplemental Nutrition
Billions of real (2012) dollars 80 81 77 75 74 72 69 66 64 62 61 59Billions of nominal dollars 80 82 80 79 79 78 76 75 74 73 73 73
Child Nutrition ProgramsBillions of real (2012) dollars 18 19 20 20 21 21 22 22 22 23 23 24Billions of nominal dollarsf 18 20 21 21 22 23 24 25 26 27 28 29
Federal Pell Grant Programg
Billions of real (2012) dollars 34 32 32 33 33 34 35 34 34 34 34 33Billions of nominal dollars 34 33 33 34 36 37 38 39 39 40 40 41
Nutrition and Education
Assistance Program

Appendix B: Interpreting Information About
Participation and Spending per Participant
In general, the participation figures given for various means-tested programs and tax credits in this report rep-resent the average number of recipients per month in a particular year. “Participant” means different things in different programs, however. For Medicaid, the Medicare Part D low-income subsidy, the Supplemental Nutrition Assistance Program (SNAP), Supplemental Security Income, and Pell grants, the number of participants is the number of individuals who receive benefits. (That figure is lower than the number of people who are eligible for a program.) For the earned income and child tax credits, the number of participants is the number of tax-filing units (as measured by tax returns) that receive refundable credits. Tax-filing units can include more than one per-son. For housing assistance programs, the number of par-ticipants is the number of households receiving benefits, as approximated by the number of subsidized units avail-able to households. (Households can also include more than one person.) For Temporary Assistance for Needy Families (TANF) or the child nutrition programs, avail-able data do not provide a reliable measure of the number of participants.
Several caveats apply to the information about participa-tion and spending per participant that the Congressional Budget Office (CBO) used for this analysis:
The number of participants in each program or tax credit cannot be added together to estimate the total
number of people participating in at least one of the programs, because some people receive benefits from more than one program at a given time.1
Figures for average spending per participant in various programs cannot be added together to estimate how much a typical participant receives in means-tested benefits over the course of a year, because very few people participate in all of the programs included in this report.
Average spending per participant does not represent the benefit amount that every recipient receives. Even within a program, benefits generally differ among participants. For example, Medicaid spending per par-ticipant is much higher for people who are elderly, dis-abled, or pregnant than it is for nondisabled children or for working-age adults who are not disabled or pregnant.
1. In an analysis of Medicaid, SNAP, TANF, and the Children’s Health Insurance Program (which is not included in this report), CBO determined that about 45 percent of the low-income fami-lies who received assistance from at least one of those programs participated in multiple programs, although only about 3 percent of them participated in all four programs. See Congressional Bud-get Office, Effective Marginal Tax Rates for Low- and Moderate-Income Workers (November 2012), www.cbo.gov/publication/43709.
CBO

30 GROWTH IN MEANS-TESTED PROGRAMS AND TAX CREDITS FOR LOW-INCOME HOUSEHOLDS FEBRUARY 2013
CBO
List of Tables and Figures
Tables
1. Federal Spending on Various Categories of Means-Tested Programs and Tax Credits, Selected Years 6
2. Federal Spending on and Participation in Selected Means-Tested Programs That Provide Health Care, Selected Years 11
3. Federal Spending on and Participation in Selected Means-Tested Programs and Tax Credits That Provide Cash Assistance, Selected Years 14
4. Federal Spending on and Participation in Selected Means-Tested Programs That Assist with Nutrition, Housing, and Education, Selected Years 19
A-1. Sources of Historical Data for This Analysis 26
A-2. Projected Federal Spending on Selected Means-Tested Programs and Tax Credits in Real and Nominal Dollars 27
Figures
1. Federal Spending on Various Categories of Means-Tested Programs and Tax Credits, 1972 to 2012 2
2. Federal Spending on Selected Means-Tested Programs and Tax Credits, 2012 5
3. Growth in Selected Means-Tested Programs That Provide Health Care, 1972 to 2011 12
4. Growth in Selected Means-Tested Programs and Tax Credits That Provide Cash Assistance, 1972 to 2011 15
5. Growth in Selected Means-Tested Programs That Assist with Nutrition, Housing, and Education, 1972 to 2011 20
6. Federal Spending on Selected Means-Tested Programs and Tax Credits, 2000 to 2023 23

FEBRUARY 2013 GROWTH IN MEANS-TESTED PROGRAMS AND TAX CREDITS FOR LOW-INCOME HOUSEHOLDS 31
About This Document
This report was prepared at the request of the Ranking Member of the Senate Committee on the Budget. In keeping with the Congressional Budget Office’s (CBO’s) mandate to provide objective, impartial analysis, the report makes no recommendations.
William Carrington, Molly Dahl, and Justin Falk of CBO’s Microeconomic Studies Division wrote the report under the general supervision of Joseph Kile and Chad Shirley. At CBO, Nabeel Alsalam, Linda Bilheimer, Kirstin Blom, Chad Chirico, Kathleen FitzGerald, Holly Harvey, Jean Hearne, Janet Holtzblatt, Justin Humphrey, Sarah Masi, Noah Meyerson, Jonathan Morancy, Vi Nguyen, Sam Papenfuss, Kevin Perese, David Rafferty, Kurt Seibert, Emily Stern, Rob Stewart, David Weiner, and Rebecca Yip provided projections of program spending or useful comments on various drafts of the report.
Janet Currie of Princeton University, Gene Falk of the Congressional Research Service, and Diana Furchtgott-Roth of the Manhattan Institute also offered helpful comments. The assistance of external reviewers implies no responsibility for the final product, which rests solely with CBO.
Christian Howlett edited the report, and Maureen Costantino and Jeanine Rees prepared it for publication. An electronic version is available on CBO’s Web site (www.cbo.gov).
Douglas W. Elmendorf Director
February 2013
CBO