growth monitoring and assessment 6th nationwide anthropological survey of children and adolescents...
TRANSCRIPT

GROWTH MONITORING AND ASSESSMENT
6th Nationwide Anthropological Survey of Children and Adolescents 2001
Bláha P.*, Vignerová J.**
*Faculty of Science, Charles University, Prague
**National Institute of Public Health, Prague
Czech Republic

• Apart from genetic determinants, growth of an individual is to a great extent influenced by external factors (familly backround, socio-economics conditions of the society, health care system, social system etc.).
FENOTYP OF AN INDIVIDUAL =FENOTYP OF AN INDIVIDUAL = GENETIC FACTORS + ENVIRONMENTAL FACTORS +
INTERACTION BETWEEN GENETIC AND ENVIRONMENTAL FACTORS
FAMILYFAMILYENVIRONMENTENVIRONMENT
HEALTH,HEALTH,GROWTHGROWTH
SESSES
PHYSICALPHYSICALENVIRONMENTENVIRONMENT STRESSSTRESS
Flinn M.V., England B.G., American Journal of Physical Anthropology, 1997

Material I.
• 1895: Measurements of 100.000 school children - Czech physician and anthropologist Matiegka (Matiegka J., 1927, Somatology of school children. Nakl. ČSAV a umění, Praha.) – He founded tradition of Nationwide Anthropological Surveys.
• 1800-1809: Mean heights and s.d. in military boarding-school children born between 1800-1809 (in Bohemia and Moravia), recorded in Vienna (Komlos J: Patterns of children’s growth in East-central Europe in the eighteenth century. Annals of Human Biology, 1986, Volume 13, No. 1, pp. 33 - 48.)

Material I: NATIONWIDE ANTHROPOLOGICAL
SURVEYS IN CR
• Every ten years - 1951, 1961, 1971, 1981, 1991, 2001
• Number of children per survey:
80.000 – 100.000 (3 to 5 % of the population of given age)
• Age: 0 to 19 years
Praha

NATIONWIDE ANTHROPOLOGICAL SURVEYS IN CR (1951 to 2001)
• Preschool children: in clinics, by instructed health professionals, mainly paeditricians.
• School children: teachers, provided with detailed written instructions.
• Anthropological measurements: height, body weight, circumferences of the head, arm, waist and hip – Martin Saller method.
• Questionnaires for children: dietary habits, sports activity, TV watching and PC games.
• Questionnaires for parents: parental height, weight, educational level, number of children in the family, breastfeeding and health status of their child.
METHODS
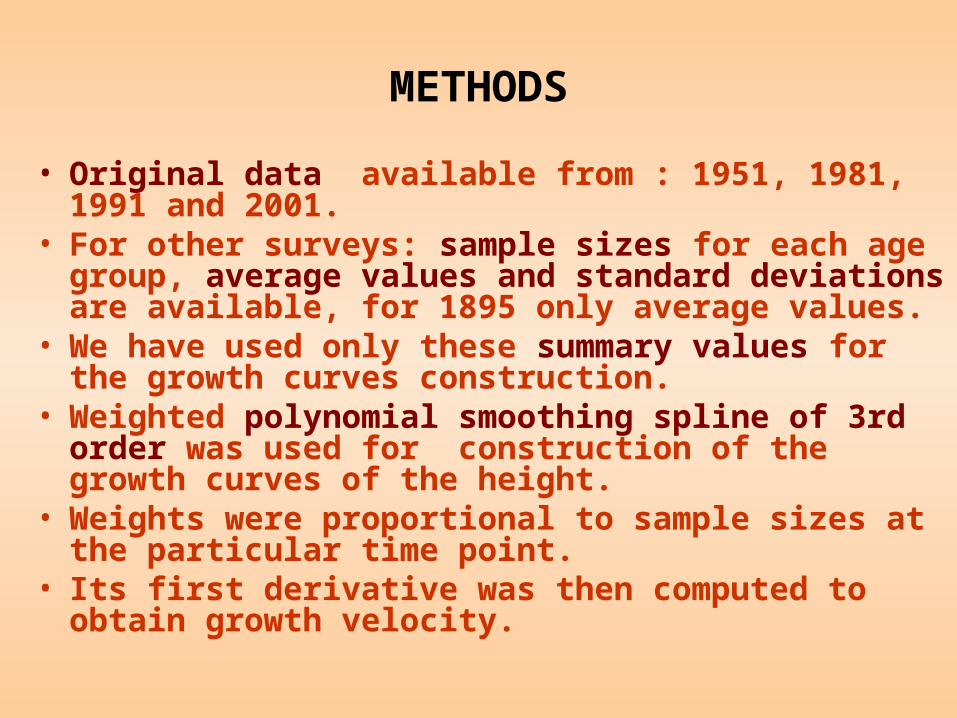
• Original data available from : 1951, 1981, 1991 and 2001.
• For other surveys: sample sizes for each age group, average values and standard deviations are available, for 1895 only average values.
• We have used only these summary values for the growth curves construction.
• Weighted polynomial smoothing spline of 3rd order was used for construction of the growth curves of the height.
• Weights were proportional to sample sizes at the particular time point.
• Its first derivative was then computed to obtain growth velocity.
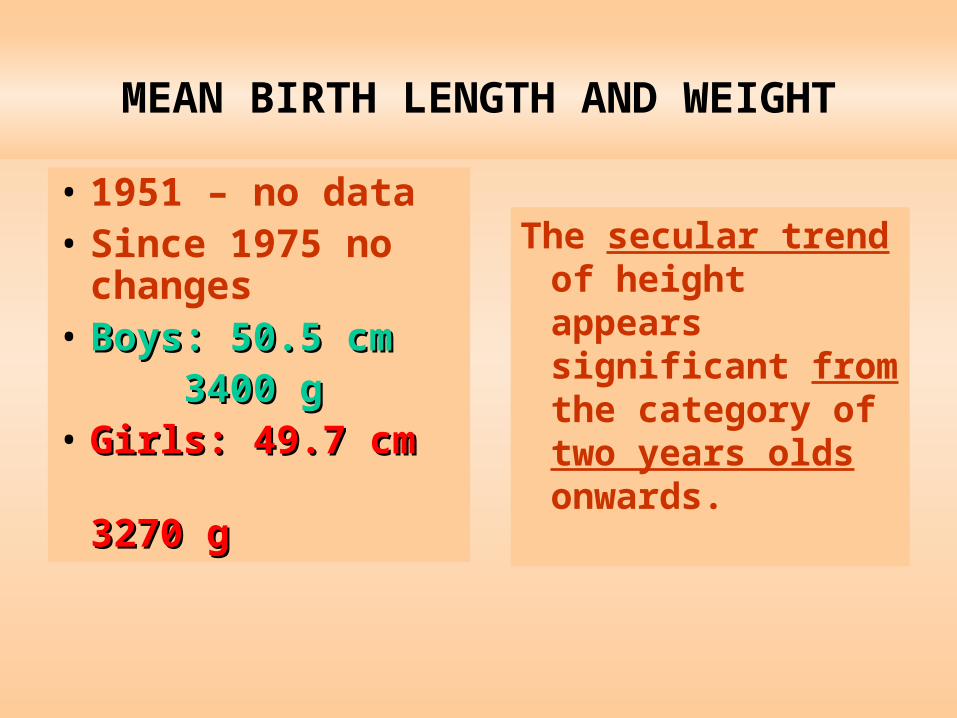
• 1951 – no data• Since 1975 no
changes• Boys: 50.5 cmBoys: 50.5 cm
3400 g3400 g• Girls: 49.7 cmGirls: 49.7 cm 3270 g3270 g
MEAN BIRTH LENGTH AND WEIGHT
The secular trend of height appears significant from the category of two years olds onwards.

SECULAR TREND OF HEIGHTGrowth curves
Boys
80
100
120
140
160
180
200
4 6 8 10 12 14 16 18Age years
cm
20011991198119711961195118951800-09
Girls
80
100
120
140
160
180
200
4 6 8 10 12 14 16 18Age years
cm
2001199119811971196119511895

-2
-1,5
-1
-0,5
0
0,5
1
1,5
2
2 3 4 5 6 7 8 9 10 11 12 13 14 15 16 17 18
Age years
Z-score
195119711991WHO20011895
-2
-1,5
-1
-0,5
0
0,5
1
1,5
2
2 3 4 5 6 7 8 9 10 11 12 13 14 15 16 17 18
Age years
Z-score
195119711991WHO20021895
BOYS GIRLS
Z-SCORE ACCORDING WHO REFERENCE VALUES
Height
Adult height: 1951 - 172.4 (s.d. 6.6)2001 - 180.4 (s.d. 7.0) dif. 8.0 cm
Adult height: 1951 - 161.0 (s.d. 5.6)2001 - 167.2 (s.d. 6.4) dif. 6.1 cm
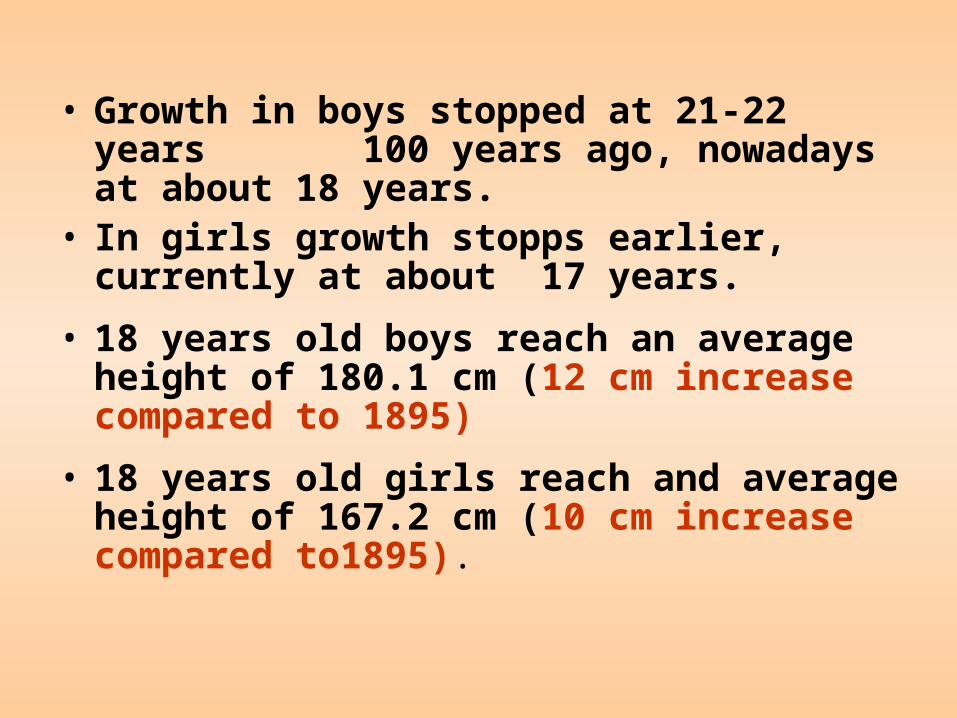
• Growth in boys stopped at 21-22 years 100 years ago, nowadays at about 18 years.
• In girls growth stopps earlier, currently at about 17 years.
• 18 years old boys reach an average height of 180.1 cm (12 cm increase compared to 1895)
• 18 years old girls reach and average height of 167.2 cm (10 cm increase compared to1895).
6 8 10 12 14 16
34
56
7
boysgirls
11,15
Age years
13,327,16
7,87
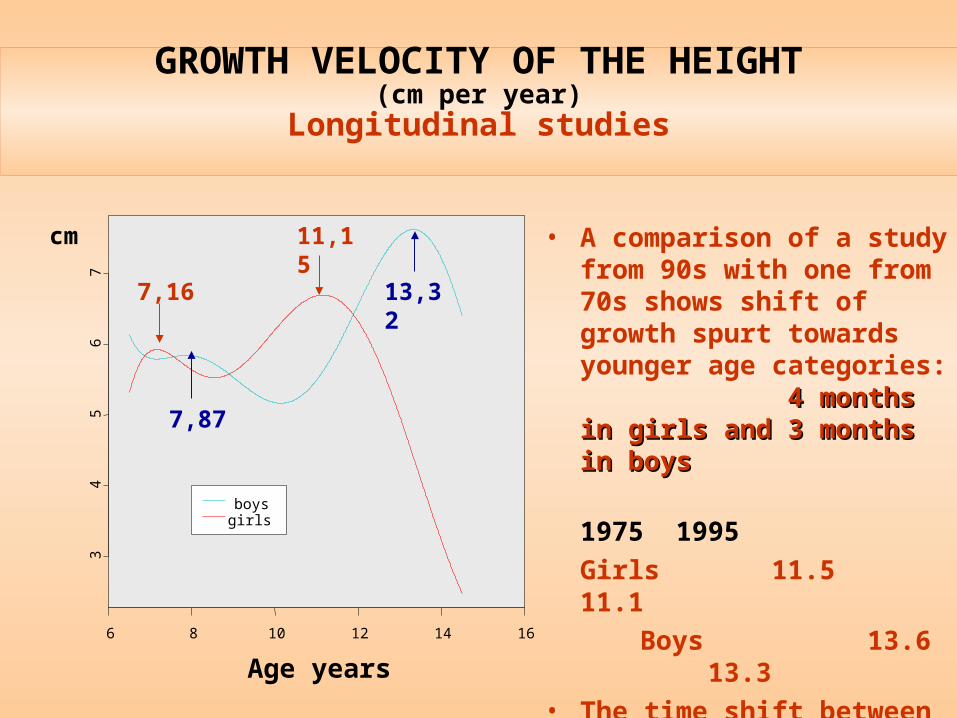
cm • A comparison of a study from 90s with one from 70s shows shift of growth spurt towards younger age categories: 4 months4 months in girls and in girls and 3 months3 months in boysin boys
1975 1995
Girls 11.5 11.1
Boys 13.6 13.3
• The time shift between boys and girls in the onset of adolescent growth spurt is almost 2 years.
GROWTH VELOCITY OF THE HEIGHT(cm per year)
Longitudinal studies

00.10.20.30.40.50.60.70.80.9
1
10 11 12 13 14 15 16 17
Age years
Pro
bal
ity
Girls
Boys
Number: GIRLS: 12.837 BOYS: 9.645
Mean age of menarche:
(50 % YES, 50 % NO)1991: 13.00 years2001: 13.01 years
Mean age of voice-breaking:
1991: 14.50 years2001: 13.84 years
Corresponds with shifting of secular trend of height
AGE OF MENARCHE AND VOICE-BREAKING1991, 2001
Logistic regression
0.01 y.
0.66 y.
BOYS GIRLS
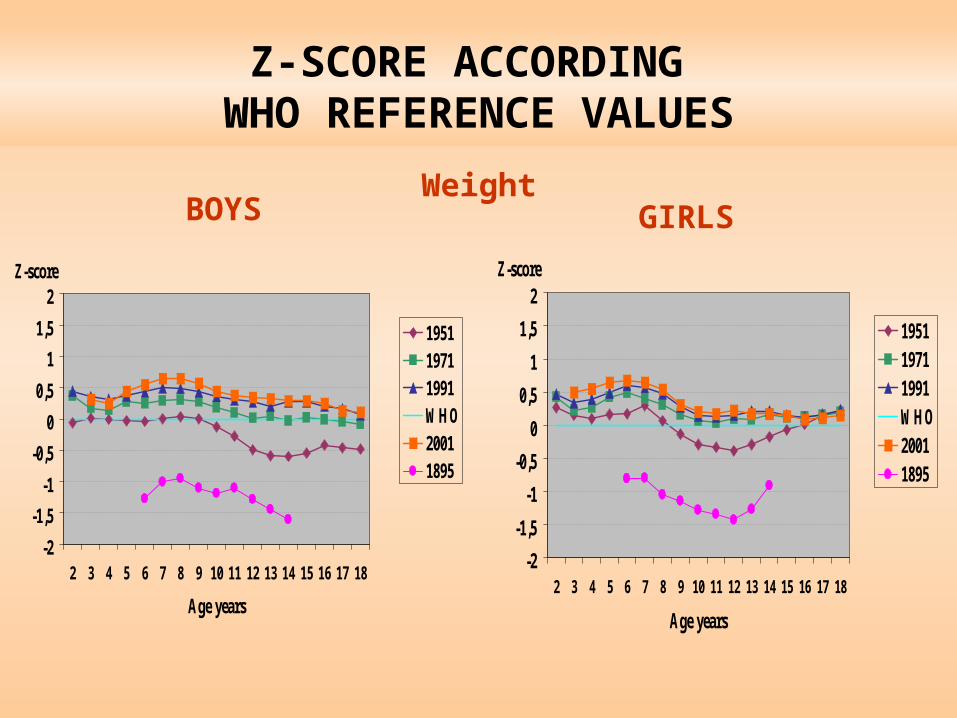
-2
-1,5
-1
-0,5
0
0,5
1
1,5
2
2 3 4 5 6 7 8 9 10 11 12 13 14 15 16 17 18
Age years
Z-score
195119711991WHO20011895
-2
-1,5
-1
-0,5
0
0,5
1
1,5
2
2 3 4 5 6 7 8 9 10 11 12 13 14 15 16 17 18
Age years
Z-score
195119711991WHO20011895
Z-SCORE ACCORDING WHO REFERENCE VALUES
Weight

0102030405060708090
100 110 120 130 140 150 160 170
cm
kg
97
75
50
25
3
BOYS
0102030405060708090
100 110 120 130 140 150 160 170
cm
kg
97
75
50
25
3
GIRLS
WEIGHT-HEIGHT RATIO Empirical percentile charts
1951, 2001
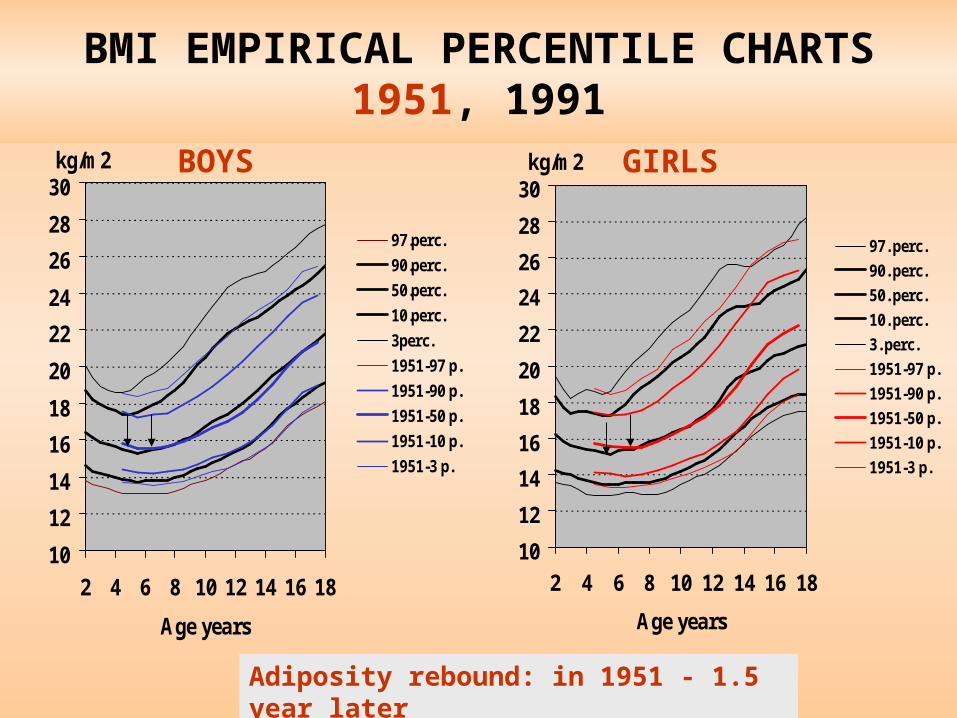
BMI EMPIRICAL CENTILE CHARTS1951, 1991
10
12
14
16
18
20
22
24
26
28
30
2 4 6 8 10 12 14 16 18
Age years
kg/m2
97.perc.
90.perc.
50.perc.
10.perc.
3perc.
1951-97 p.
1951-90 p.
1951-50 p.
1951-10 p.
1951-3 p.
10
12
14
16
18
20
22
24
26
28
30
2 4 6 8 10 12 14 16 18
Age years
kg/m2
97. perc.
90. perc.
50. perc.
10. perc.
3. perc.
1951-97 p.
1951-90 p.
1951-50 p.
1951-10 p.
1951-3 p.
BOYS GIRLS
BMI EMPIRICAL PERCENTILE CHARTS1951, 1991
Adiposity rebound: in 1951 - 1.5 year later
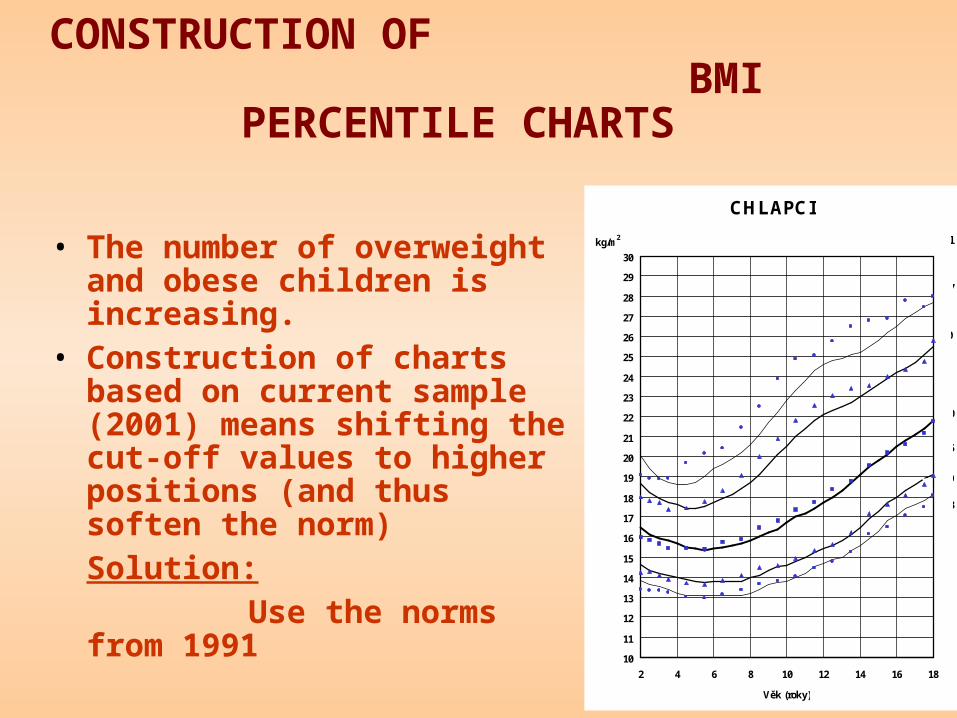
CONSTRUCTION OF BMI PERCENTILE CHARTS
• The number of overweight and obese children is increasing.
• Construction of charts based on current sample (2001) means shifting the cut-off values to higher positions (and thus soften the norm)Solution: Use the norms from 1991
CHLAPCI
10
11
12
13
14
15
16
17
18
19
20
21
22
23
24
25
26
27
28
29
30
2 4 6 8 10 12 14 16 18
Věk (roky)
kg/m2
97
50
25
10
3
90
Percentil
© Grant IGA MZ ČR NJ/6792-3/2001, SZÚ
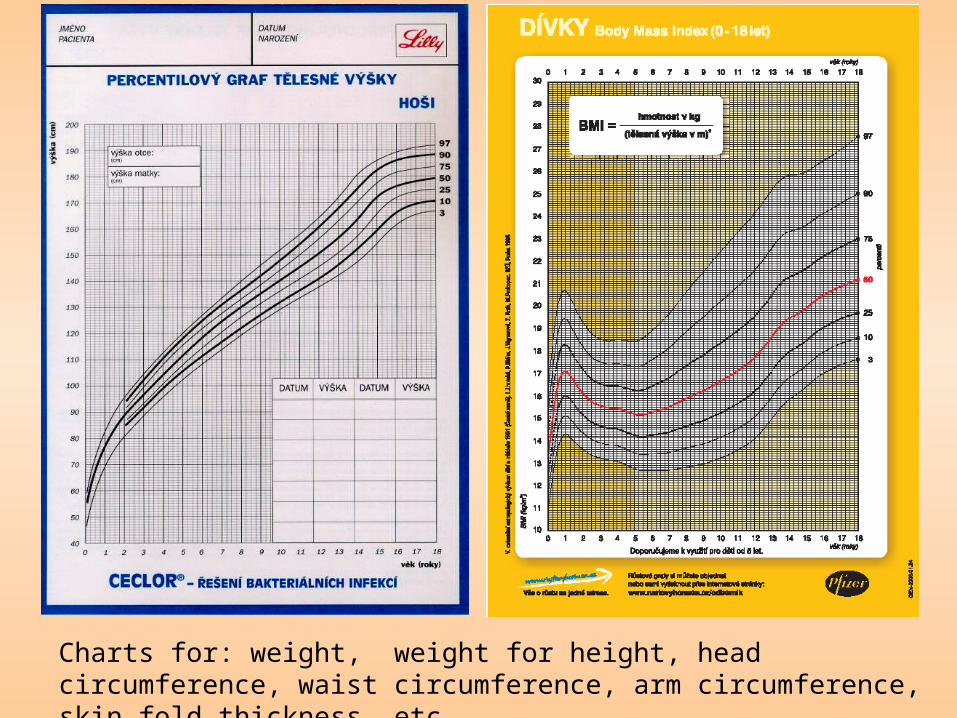
Charts for: weight, weight for height, head circumference, waist circumference, arm circumference, skin fold thickness, etc.
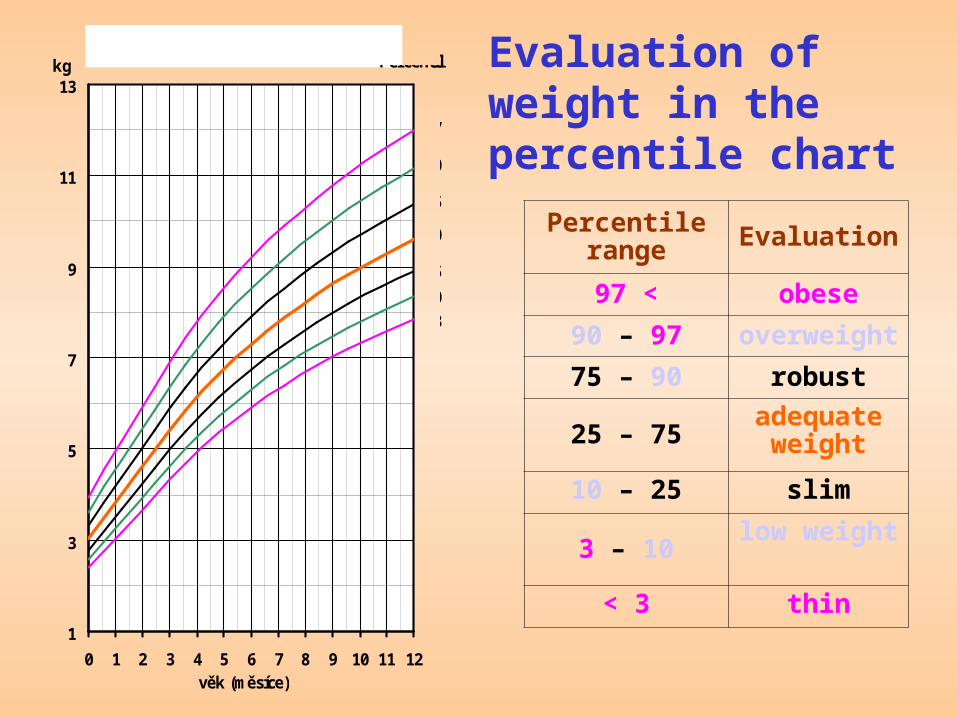
Evaluation of weight in the percentile chart
Percentile range Evaluation
97 < obese
90 – 97 overweight
75 – 90 robust
25 – 75adequate
weight
10 – 25 slim
3 – 10low weight
< 3 thin1
3
5
7
9
11
13
0 1 2 3 4 5 6 7 8 9 10 11 12věk (měsíce)
kgHMOTNOST, dívky
Percentil
97
50
3
90
75
25
10
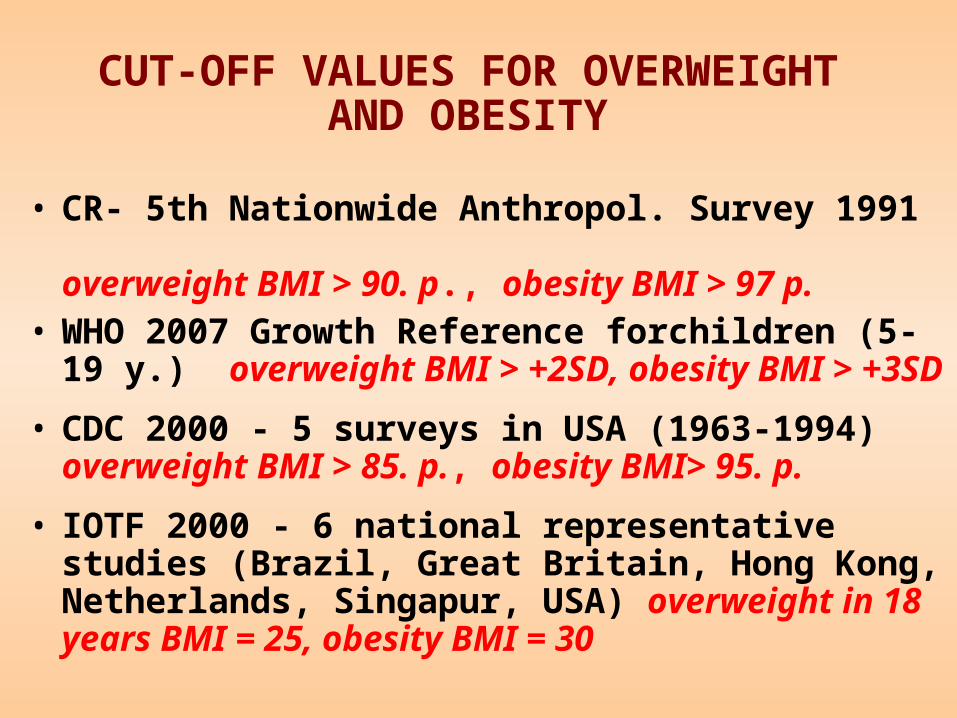
CUT-OFF VALUES FOR OVERWEIGHT AND OBESITY
• CR- 5th Nationwide Anthropol. Survey 1991 overweight BMI > 90. p., obesity BMI > 97 p.
• WHO 2007 Growth Reference forchildren (5-19 y.) overweight BMI > +2SD, obesity BMI > +3SD
• CDC 2000 - 5 surveys in USA (1963-1994) overweight BMI > 85. p., obesity BMI> 95. p.
• IOTF 2000 - 6 national representative studies (Brazil, Great Britain, Hong Kong, Netherlands, Singapur, USA) overweight in 18 years BMI = 25, obesity BMI = 30
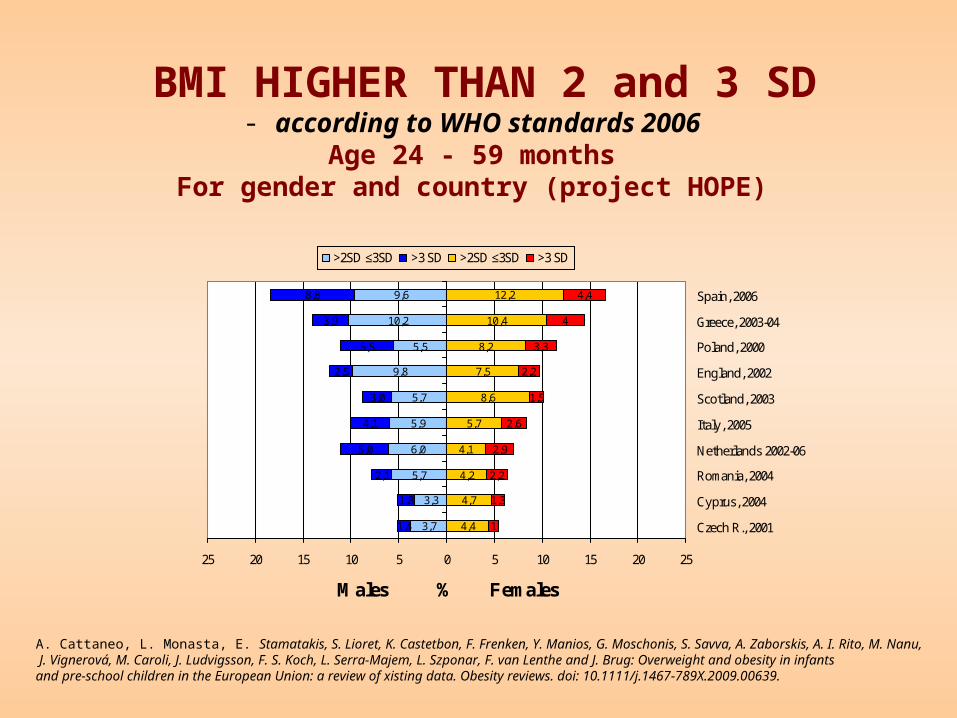
BMI HIGHER THAN 2 and 3 SD - according to WHO standards 2006
Age 24 - 59 monthsFor gender and country (project HOPE)
4,4
4,7
4,2
4,1
5,7
8,6
7,5
8,2
10,4
12,2
1
1,3
2,2
2,9
2,6
1,5
2,2
3,3
4
4,4
3,7
3,3
5,7
6,0
5,9
5,7
9,8
5,5
10,2
9,6
1,4
1,8
2,1
5,0
4,1
3,0
2,5
5,5
3,9
8,8
25 20 15 10 5 0 5 10 15 20 25
Czech R., 2001
Cyprus, 2004
Romania, 2004
Netherlands 2002-06
Italy, 2005
Scotland, 2003
England, 2002
Poland, 2000
Greece, 2003-04
Spain, 2006
Males % Females
>2SD ≤3SD >3 SD >2SD ≤3SD >3 SD
A. Cattaneo, L. Monasta, E. Stamatakis, S. Lioret, K. Castetbon, F. Frenken, Y. Manios, G. Moschonis, S. Savva, A. Zaborskis, A. I. Rito, M. Nanu, J. Vignerová, M. Caroli, J. Ludvigsson, F. S. Koch, L. Serra-Majem, L. Szponar, F. van Lenthe and J. Brug: Overweight and obesity in infantsand pre-school children in the European Union: a review of xisting data. Obesity reviews. doi: 10.1111/j.1467-789X.2009.00639.
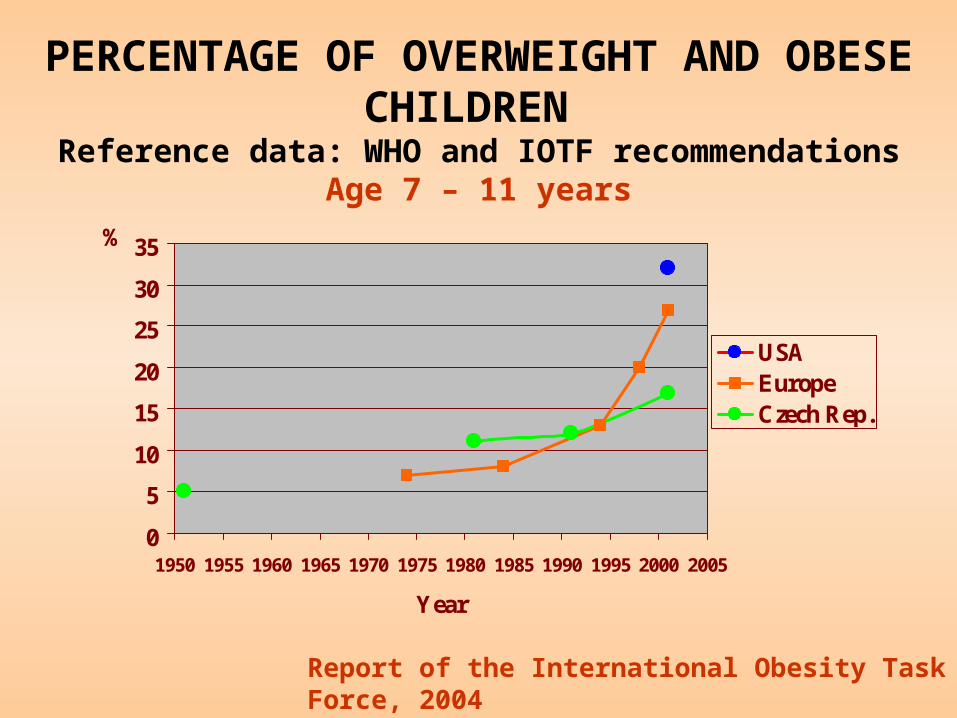
PERCENTAGE OF OVERWEIGHT AND OBESE CHILDREN
Reference data: WHO and IOTF recommendationsAge 7 – 11 years
0
5
10
15
20
25
30
35
1950 1955 1960 1965 1970 1975 1980 1985 1990 1995 2000 2005
Year
%
USAEuropeCzech Rep.
Report of the International Obesity Task Force, 2004

PREVALENCE OF OVERWEIGHT ANF OBESITY IN 7 YEARS OLD BOYS 2008
COSI study (WHO 2007)
0%
20%
40%
60%
80%
100%
1951 1981 1991 2001 2008
Obezita
Nadváha
Normální
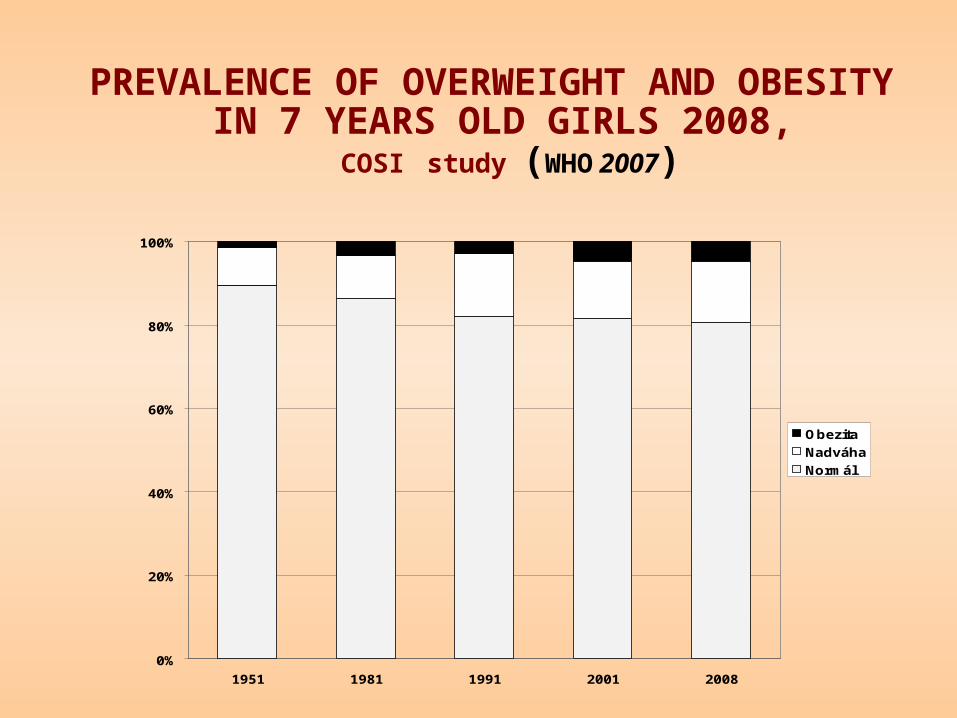
PREVALENCE OF OVERWEIGHT AND OBESITY IN 7 YEARS OLD GIRLS 2008,
COSI study (WHO 2007)
0%
20%
40%
60%
80%
100%
1951 1981 1991 2001 2008
Obezita
Nadváha
Normál
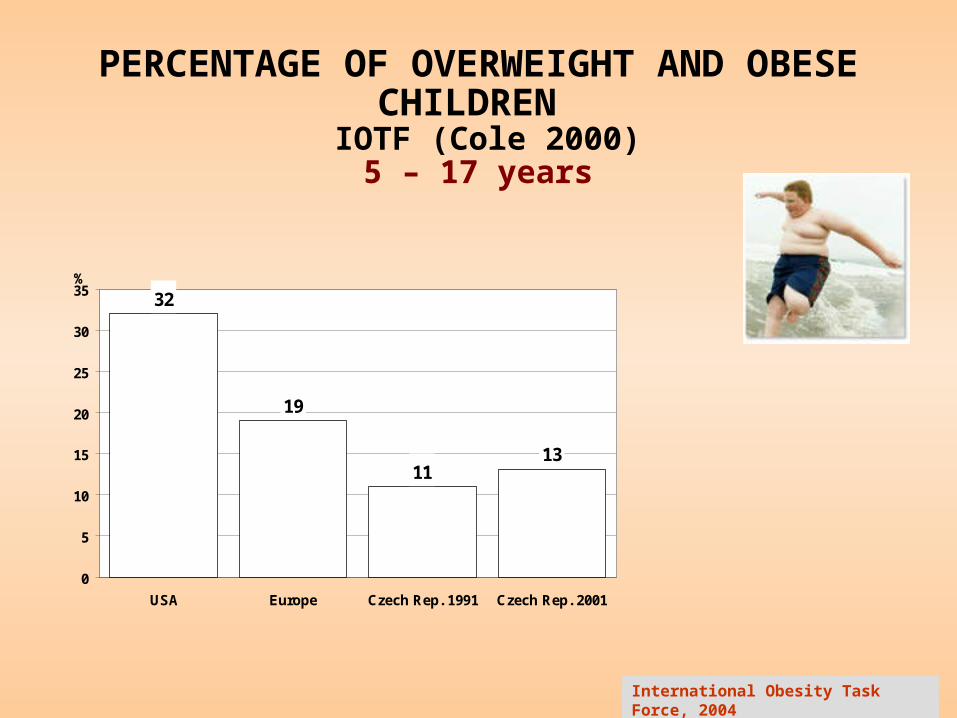
PERCENTAGE OF OVERWEIGHT AND OBESE CHILDREN
IOTF (Cole 2000) 5 – 17 years
International Obesity Task Force, 2004
32
19
1113
0
5
10
15
20
25
30
35
USA Europe Czech Rep. 1991 Czech Rep. 2001
%
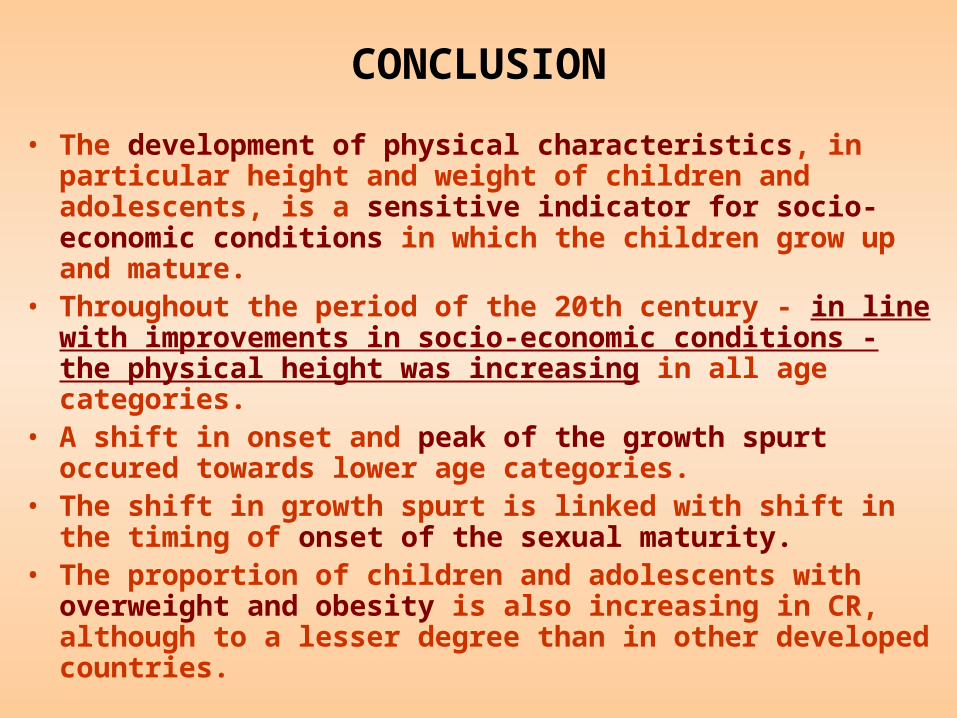
CONCLUSION
• The development of physical characteristics, in particular height and weight of children and adolescents, is a sensitive indicator for socio-economic conditions in which the children grow up and mature.
• Throughout the period of the 20th century - in line with improvements in socio-economic conditions - the physical height was increasing in all age categories.
• A shift in onset and peak of the growth spurt occured towards lower age categories.
• The shift in growth spurt is linked with shift in the timing of onset of the sexual maturity.
• The proportion of children and adolescents with overweight and obesity is also increasing in CR, although to a lesser degree than in other developed countries.