growth strategies and product performance: a …
TRANSCRIPT
GROWTH STRATEGIES AND PRODUCT PERFORMANCE: A CASE OF M-PESA
Kioko, M., Wasike, S., & Ndiao, O.
The Strategic Journal of Business & Change Management. ISSN 2312-9492 (Online) 2414-8970 (Print). www.strategicjournals.com
Page: - 272 -
Vol. 6, Iss. 3, pp 272- 288, August 1, 2019. www.strategicjournals.com, ©Strategic Journals
GROWTH STRATEGIES AND PRODUCT PERFORMANCE: A CASE OF M-PESA
Kioko, M.1* & Wasike, S.,2 & Ndiao, O.3 1*MBA Candidate, School of Business, Catholic University of Eastern Africa [CUEA], Kenya
2,3 Ph.D., Catholic University of Eastern Africa [CUEA], Kenya
Accepted: July 27, 2019
ABSTRACT
The purpose of this study was to establish the growth strategies that Safaricom Limited Company had
implemented for M-PESA service and the impact on its performance. The specific objectives of the study were
to understand the impact of market penetration, market development, product development and
diversification strategies on M-PESA’s performance as measured by market share and revenue growth. The
study design used a combination of descriptive and correlational research using survey method for data
collection. The target population for the research was 160 senior and middle management staff at Safaricom
Limited, Head Quarter offices. A sample size of 114 respondents was drawn from this population using
stratified random sampling method. The study mainly used primary data collected using self-administered
questionnaires, and secondary data was collected from published industry reports and Safaricom annual
reports. The data was analyzed using both descriptive and inferential statistics. Descriptive statistics were
used to summarize data while inferential statistics, specifically multiple linear regressions were used to
determine the relationship between growth strategies and product performance. The data was analyzed
using SPSS analysis software and was used to determine findings of the research and draw conclusions for
the study. The study findings established that the four growth strategies of market penetration, product
development, market development and diversification strategies had been applied by Safaricom Limited for
M-PESA service. The regression model showed a statistically significant positive relationship between growth
strategies and product performance. However further regression analysis to determine coefficients of each of
the growth strategies found that, only two of these strategies, product development and market
development had a statistically significant impact on product performance. The remaining two growth
strategies of market penetration and diversification had negligible effect on product performance. The study
further recommended adoption of growth strategies for products guided by the product life cycle stage and
market conditions to optimize use of organization resources for targeted growth.
Key Words: Market Penetration, Market Development, Product Development, Diversification, M-PESA
CITATION: Kioko, M., Wasike, S., & Ndiao, O. (2019). Growth strategies and product performance: a case of
M-PESA. The Strategic Journal of Business & Change Management, 6 (3), 272 – 288.
The Strategic Journal of Business & Change Management. ISSN 2312-9492 (Online) 2414-8970 (Print). www.strategicjournals.com
Page: 273
INTRODUCTION
A company’s strategy comprises of large-scale plans
designed to meet its long-term objectives (Pearce II
& Robinson, Jr., 2009). Performance measurement
as claimed by Letza (1996), provides the means of
control to achieve the objectives required, to fulfill
a company’s objectives (as cited in McAdam &
Bailie, 2002). Growth strategies are concerned with
growing the size and viability of a business over
time through either internal investment or external
investment (Harrison & St. John, 2001). Different
firms adopt different strategies, and this is
influenced by both internal and external factors,
major factors include firm and industry factors
(Kariuki, Awino, & Ogutu, 2011); this in turn results
in differences in performance across different firms.
The mobile money market in Kenya has been in
existence since 2006, competing firms in the market
include mobile phone service providers as well as
banks. M-PESA is a mobile money service owned by
Safaricom Ltd, the leading mobile phone service
provider in Kenya and is the market leader in
mobile money at 81% market share
(Communications Authority of Kenya, 2018). This
study seeks to analyze the influence of growth
strategies by Kenya’s leading mobile money service
M-PESA, on its performance as measured by market
share and revenue growth.
According to Harrison & St. John (2001), growth
strategies are business level strategies that
determine allocation of resources within a business
to achieve growth and that determine changes in
business scope that are compatible with growth
and the strategic direction of a business i.e.
products and markets. Internal growth strategies
seek to use a company’s existing resources and
capabilities to drive growth and profitability for the
firm and are market penetration, market
development and product development strategies.
Market penetration seeks to increase a firm’s
market share in an existing market, with its existing
products through tactics such as advertising,
promotions and sales efforts.
According to Kaplan and Norton (2004), an
organization’s strategy describes how it intends to
create value for its shareholders, customers and
citizens. The measurement of strategy objectives
should therefore focus on how the organization
seeks to create long-term value. The balanced score
card is a management tool that was developed by
Kaplan and Norton that evaluates business
performance from four perspectives: financial
performance, customer knowledge and satisfaction,
internal business processes and learning and
growth. The financial perspective looks at
performance from shareholders’ perspective and
includes financial measures such as shareholder
value, revenue growth, profitability and return on
investment (ROI). The customer perspective
measures the value proposition a firm offers its
customers and includes measures such as market
share, customer satisfaction, customer retention
and customer acquisition.
M-PESA is a mobile money transfer service
operated by Safaricom, the leading mobile network
operator in Kenya. M-PESA operates a system of
low-value electronic accounts held by the mobile
network operator, Safaricom, and accessed by its
subscribers from their mobile phones through a
Subscriber Identification Module (SIM) resident
application. According to Hughes & Lonie (2007) the
initial concept of M-PESA was to create a mobile
platform that would facilitate simple financial
transactions, allowing customers to repay small
loans using a basic mobile feature phone.
Statement of the problem
Extensive research has been done by GSMA mobile
money for the unbanked, on success factors for
mobile money deployments. GSMA (2016) study on
success factors for mobile money services identified
provider led characteristics, regulatory environment
and country factors that influence successful mobile
money deployments. Factors identified in this
research that contribute to successful mobile
money services include first mover advantage,
existing firm market share, level of investment by
firm, organization structure, enabling regulatory
The Strategic Journal of Business & Change Management. ISSN 2312-9492 (Online) 2414-8970 (Print). www.strategicjournals.com
Page: 274
environment, low country GDP (Gross Domestic
Product) per capita, high population density and
low citizen levels of formal financial account
ownership.
Levin (2012) study on organizational design to
succeed in mobile money identified key factors in
organization design that influence the success of
mobile money deployments. The organization
design factors identified in the study were creation
of an independent mobile financial service business
unit reporting to the CEO during initial launch stage,
creating a dedicated sales and distribution team for
mobile money, mobile money key performance
indicators (KPI) must be in place not only for the
mobile money team but also for senior executives
and organization design must evolve with changes
in mobile money market.
Muthiora (2015) study on enabling mobile policies
in Kenya, identified factors in the regulatory
environment that contribute to success of mobile
money services. The financial regulator, the Central
Bank of Kenya, was identified as having played an
important role in providing an enabling regulatory
environment including providing incentives for
service providers to invest and avoiding overly
prescriptive and burdensome requirements, to
encourage innovation and growth as well as
preserve the integrity of the financial sector. The
regulatory framework for mobile money has
evolved over time, the National Payment Systems
Regulations was established in 2014 to address
emerging mobile money market issues such as
competition, interoperability, consumer protection
and governance.
These previous research studies on mobile money
performance have mainly analyzed external
environmental factors and firm factors that
contribute to successful mobile money deployment.
There was a knowledge gap, in studies that
analyzed the influence of growth strategies on
mobile money performance. This was the gap that
this study sought to fill by analyzing the influence of
growth strategies on M-PESA’s performance as
measured by market share and revenue growth.
Research objectives
To determine the influence of market
penetration strategy on M-PESA performance;
To establish the influence of product
development strategy on M-PESA performance;
To assess the influence of market development
strategy on M-PESA performance;
To establish the influence of diversification
strategy on M-PESA performance.
LITERATURE REVIEW
Review of Theories
Resource-based theory
The resource-based theory views a firm’s
performance primarily as a function of a firm’s
ability to utilize its resources. A firm’s resources
include all assets, capabilities, organizational
processes, firm attributes and information and
knowledge controlled by a firm, that enable the
firm to create and implement strategies that
improve its efficiency and effectiveness (Daft, 1983,
as cited in Barney, 1991). According to Barney
(1991), for a firm to achieve sustainable competitive
advantage, a firm’s resources, need to be valuable,
rare, not easily imitated, and not easily substituted.
Valuable resources can be used to exploit
opportunities and neutralize threats in the
marketplace while rare resources are not easily
available to competitors. To formulate strategy, an
organization must appraise the potential of its
resources and capabilities to give it a competitive
advantage and financial returns. Finally, a firm
selects a strategy that matches its resources and
capabilities to the opportunities in the marketplace.
Contingency theory
The contingency theory posits that the most
profitable firms are those that develop the best fit
with the environment. According to Galbraith and
Nathanson (1978), the contingency theory states
that there is no one best way of organizing a firm.
The choice of organization form, based on
situational differences, makes a difference in the
economic perfomance of a firm. These situational
attributes have been analyzed by several
The Strategic Journal of Business & Change Management. ISSN 2312-9492 (Online) 2414-8970 (Print). www.strategicjournals.com
Page: 275
contingency theorists. Burns and Stalker (1961)
proposed that the rate of change in the
environment, determined the structure of an
organization. Firms in industries with high rate of
change in technology and markets adopted organic
structures that were decentralized, had ambiguous
roles and high levels of lateral communication.
Open systems theory
A system is defined as a recognizable whole,
consisting of components connected in an
organized structure, these components interact
with each other (Waring,1996 as cited in Chikere &
Nwoka, 2015). The open system theory focusses on
the interchange between an organization and its
environment. Organizations do not exist in a
vacuum and depend on the external environment
which consists of the industry they belong to, the
economic system and the society (Weihrich et al,
2008 as cited in Chikere & Nwoka, 2015). The
organization receives inputs from the environment
such as raw materials and labour and transforms
them into outputs which it exports back to the
environment for sale, and through feedback it
adjusts itself, to meet the requirements of its
customers, and hence secure its survival (Chikere &
Nwoka, 2015).
Ansoff Matrix
The Ansoff product/market growth matrix is a
strategic planning tool that provides a framework
for generating four basic alternative directions for
product and market growth strategies. There are
four growth strategies that may be pursued by an
organization: market penetration, product
development, market development and
diversification. The choice of strategy depends on
the selection of product and market mix. Market
penetration looks at a combination of marketing
existing products to existing markets, market
development involves marketing existing products
to new markets, product development looks at
marketing new products to existing markets and
diversification broadly involves developing new
products to serve new markets.
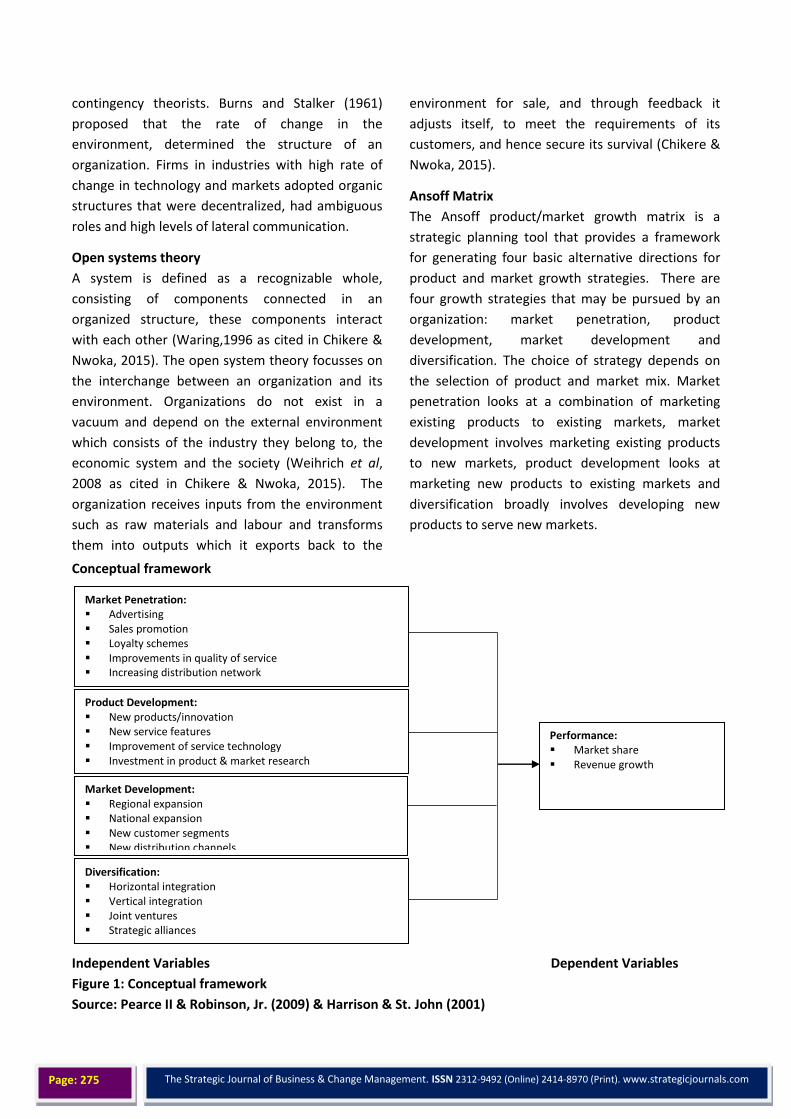
Conceptual framework
Independent Variables Dependent Variables
Figure 1: Conceptual framework
Source: Pearce II & Robinson, Jr. (2009) & Harrison & St. John (2001)
Market Penetration: Advertising Sales promotion Loyalty schemes Improvements in quality of service Increasing distribution network
Market Development: Regional expansion National expansion New customer segments New distribution channels
Product Development: New products/innovation New service features Improvement of service technology Investment in product & market research
Diversification: Horizontal integration Vertical integration Joint ventures Strategic alliances
Performance: Market share Revenue growth
The Strategic Journal of Business & Change Management. ISSN 2312-9492 (Online) 2414-8970 (Print). www.strategicjournals.com
Page: 276
Empirical Review
Various research studies have been done to
understand the effect of strategy on an
organization’s performance. Gitu (2013) did a study
on Safaricom M-PESA strategies in enhancing
mobile money transfer in Kenya. The purpose of the
study was to determine the strategies that M-PESA
has deployed to enhance mobile money transfer in
Kenya. The research design of the study was a case
study, using qualitative research interview guides.
The target population for the study was middle
level managers at Safaricom and analysis of the
information collected was done using content
analysis. The results of the research found that
Safaricom has deployed the three generic strategies
of differentiation, low cost strategy and market
focus strategies to advance M-PESA in the Kenyan
market. Differentiation had been achieved through
product development initiatives, low cost
leadership through outsourcing distribution to
agent networks to reduce operational costs and
market focus strategy had been deployed through
targeting the unbanked market segment with M-
PESA.
Yegon (2015) did a study on organizational growth
strategies adopted by Safaricom Kenya Ltd’. The
purpose of the study was to review organizational
strategies adopted by Safaricom Kenya Ltd. The
qualitative research used a case study design
through in-depth interviews with top managers at
Safaricom and was analyzed using content analysis.
The results of the research found that growth
strategies that have been deployed by Safaricom
included new product development through mobile
banking products such as M-SHWARI and KCB M-
PESA, which have contributed to their
differentiation. Diversification has been achieved
through entry into the mobile money industry
through M-PESA and entry into the internet
industry through mobile and fixed internet.
Obonyo (2015), did a study on growth strategies
and performance of Safaricom Limited in Kenya.
The purpose of the study was to identify growth
strategies used by Safaricom and to establish how
these strategies impact on the performance of
Safaricom. The research study design was a case
study and findings were analyzed using content
analysis. The results of the research found that the
strategies deployed by Safaricom were product
innovation strategy, product cost-leadership and
market diversification through acquisition of data
network operators to gain entry to the internet
market.
Njoroge (2012) did a study on international growth
Strategies for M-PESA business adopted by
Safaricom Kenya Ltd. The objective of the study was
to determine growth strategies deployed by
Safaricom to enter international markets. The study
took on a case study design, with primary data
being collected using face-to-face interviews and
analyzed using content analysis. The results of the
study showed that M-PESA used market
development strategies to launch and grow M-PESA
into international markets such as the UK market
through international mobile money transfer
services.
METHODOLOGY
The research design for the study was a
combination of descriptive and correlational
research. Descriptive research is used to provide
answers to ‘what’ research problems and was used
to establish the growth strategies that were
implemented for M-PESA. The target population for
the study comprised of senior and middle-level
managers based at Safaricom Headquarter offices
who were typically involved in crafting and
implementing the mobile money strategies.
According to Safaricom annual report (2012. Pg.
27), the number of senior managers at Safaricom
were estimated to be 34 while the middle-level
managers were estimated to be 126 managers. The
study drew a representative sample from this target
population. The research method applied for the
study was the survey method using structured
questionnaires. The sampling method that was used
for the study was stratified random sampling.
The Strategic Journal of Business & Change Management. ISSN 2312-9492 (Online) 2414-8970 (Print). www.strategicjournals.com
Page: 277
Primary data collection was done using survey
research. Secondary data was collected from
published reports on mobile money including
industry reports and Safaricom annual reports. Data
analysis was done using both descriptive and
inferential statistics. To realize these outcomes, the
study used SPSS tool to undertake the analysis.
Multiple linear regression was used to determine
the strength of the relationship between the
independent variables and the dependent variable.
Y = α1 + β1X1 + β2 X2 + β3 X3 + β4 X4 + ε
Y = the dependent variable
Xi = the independent variables
α = the Y-intercept parameter in the equation,
when X = 0
β = the slope (the change in Y for everyone unit
change in X)
ε = the error term.
RESULTS
Descriptive Statistics
Descriptive data was used to establish the extent to
which the growth strategies of market penetration,
market development, product development and
diversification were implemented by Safaricom Ltd.
for the M-PESA service. A five-point Likert scale was
used in the questionnaires for respondents to rate
the degree of agreement or disagreement with
statements that described the various growth
strategies as applied by Safaricom limited for M-
PESA as well as rate their combined effect on M-
PESA’s performance as measured by market share
and revenue. The five-point Likert scale was
constructed as follows: 1 Strongly disagree, 2
Disagree, 3 Neither agree nor disagree, 4 Agree and
5 Strongly agree. The data was analysed by use of
descriptive statistics such as frequencies,
percentages, mean values, and standard deviations
that allowed the study to determine the status of
assessed attributes which were presented in tables.
Market Penetration Strategies for M-PESA
The study considered the respondents views
regarding the status of market penetration
strategies applied for M-PESA by Safaricom Ltd. The
respondents were asked to rate the market
penetration strategies on a five-point Likert scale
and the outcomes of this undertaking were
presented in Table 1.
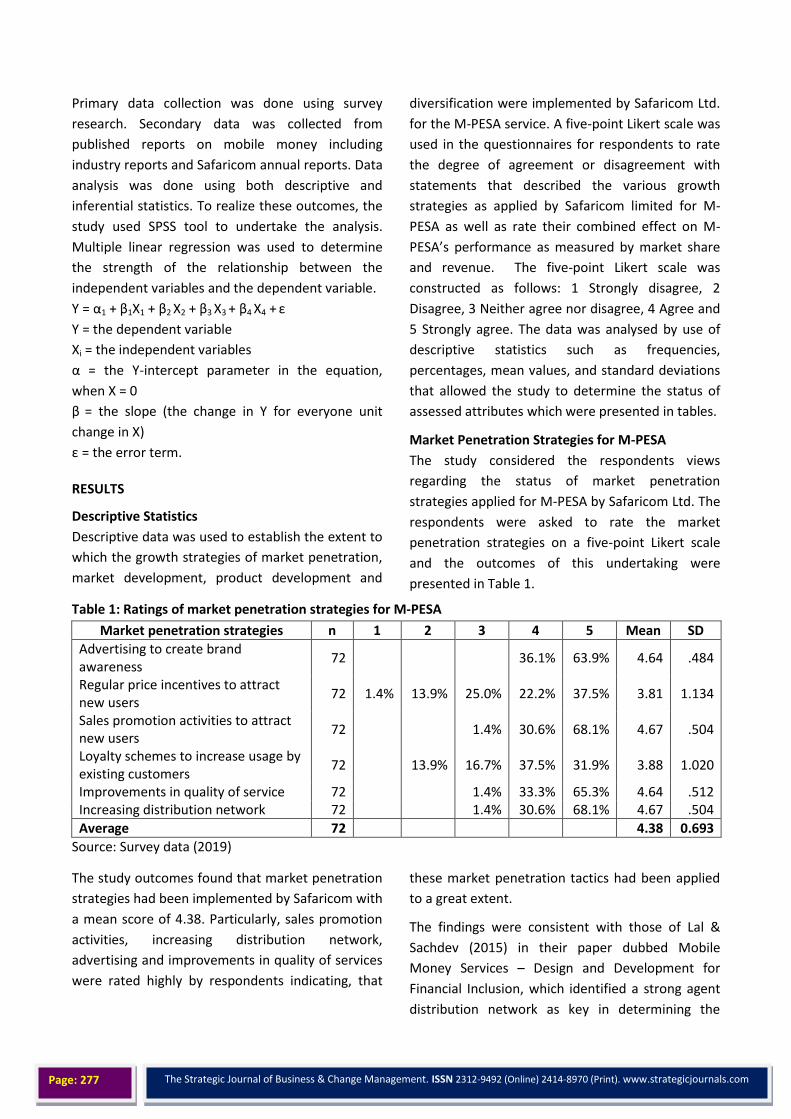
Table 1: Ratings of market penetration strategies for M-PESA
Market penetration strategies n 1 2 3 4 5 Mean SD
Advertising to create brand awareness
72 36.1% 63.9% 4.64 .484
Regular price incentives to attract new users
72 1.4% 13.9% 25.0% 22.2% 37.5% 3.81 1.134
Sales promotion activities to attract new users
72 1.4% 30.6% 68.1% 4.67 .504
Loyalty schemes to increase usage by existing customers
72 13.9% 16.7% 37.5% 31.9% 3.88 1.020
Improvements in quality of service 72 1.4% 33.3% 65.3% 4.64 .512 Increasing distribution network 72 1.4% 30.6% 68.1% 4.67 .504
Average 72 4.38 0.693
Source: Survey data (2019)
The study outcomes found that market penetration
strategies had been implemented by Safaricom with
a mean score of 4.38. Particularly, sales promotion
activities, increasing distribution network,
advertising and improvements in quality of services
were rated highly by respondents indicating, that
these market penetration tactics had been applied
to a great extent.
The findings were consistent with those of Lal &
Sachdev (2015) in their paper dubbed Mobile
Money Services – Design and Development for
Financial Inclusion, which identified a strong agent
distribution network as key in determining the

The Strategic Journal of Business & Change Management. ISSN 2312-9492 (Online) 2414-8970 (Print). www.strategicjournals.com
Page: 278
success of a mobile money service. Mobile money
products that are quickly able to build a strong
distribution network acquire a first mover
advantage in markets with few competitors. Agent
networks are the primary channels in which
customers first interact with mobile money services
and are usually located near target customers for
convenience.
Safaricom Annual Report (2017) documents some
market penetration initiatives of M-PESA service
since its launch in 2007 to include increase in
distribution network year-on -year to over 130,000
agents in 2017
Market Development Strategies for M-PESA
The study analyzed the level of application of
market development strategies for M-PESA service
by Safaricom Limited. This was achieved by
enquiring from respondents their rating of various
market development strategies as applied by
Safaricom Ltd for M-PESA service. The outcomes of
this assessment were presented in Table 2.
Table 2: Ratings of market development strategies for M-PESA
Market Development Strategies n 1 2 3 4 5 Mean SD
Regional expansion into new markets 72 2.8% 38.9% 33.3% 25.0% 3.81 .850 National expansion into new markets 72 1.4% 18.1% 30.6% 50.0% 4.29 .813 Advertising in new media channels 72 2.8% 5.6% 43.1% 48.6% 4.38 .721 New distribution channels 72 11.1% 33.3% 55.6% 4.44 .690 Targeting new customer segments 72 6.9% 36.1% 56.9% 4.50 .628
Average 4.28 .740
Source: Survey data (2019)
The observations presented in Table 2 showed the
ratings of market development strategies by the
management team where it was observed that
majority of the respondents had highly rated four of
the market development strategies except ‘regional
expansion into new markets’, which most of the
respondents rated as average. At an overall level,
the mean average rating for market development
strategies was at 4.28, an indication that market
development strategies have been implemented for
M-PESA service.
The findings of the study resonated with those of
Gitu (2013) who found that Safaricom Limited had
applied market development strategies to advance
M-PESA mobile money transfer service in Kenya by
targeting an under-served market segment of the
unbanked population in Kenya. This unbanked
segment of the population had difficulty accessing
formal financial services, and therefore M-PESA
service was targeted to this customer segment to
serve their financial access needs.
The Safaricom Annual Report (2017) documents the
various M-PESA market development initiatives
since its launch in March 2017 and include entry
into mobile savings and loans market through M-
SHWARI (since 2012) and KCB M-PESA (since 2015)
mobile banking services in partnership with CBA
bank and KCB bank respectively. The FinAccess
Household Survey (2019) findings attributed the
growth in formal financial inclusion in Kenya from
26.7% in 2006 to 82.9% in 2019 to the growth of
mobile money, government initiatives and support
and developments in information and
communication technology (ICT).
Other market development initiatives included
expansion into international mobile money transfer
market through partnership with Western Union to
facilitate international money transfer to markets
such as the UK (Safaricom, 2017).
Product Development Strategies for M-PESA
A review of product development strategies for M-
PESA services at Safaricom Ltd. was undertaken
where various product development strategies
were rated on a five- point Likert scale. The
outcomes were as presented in Table 3.
The Strategic Journal of Business & Change Management. ISSN 2312-9492 (Online) 2414-8970 (Print). www.strategicjournals.com
Page: 279
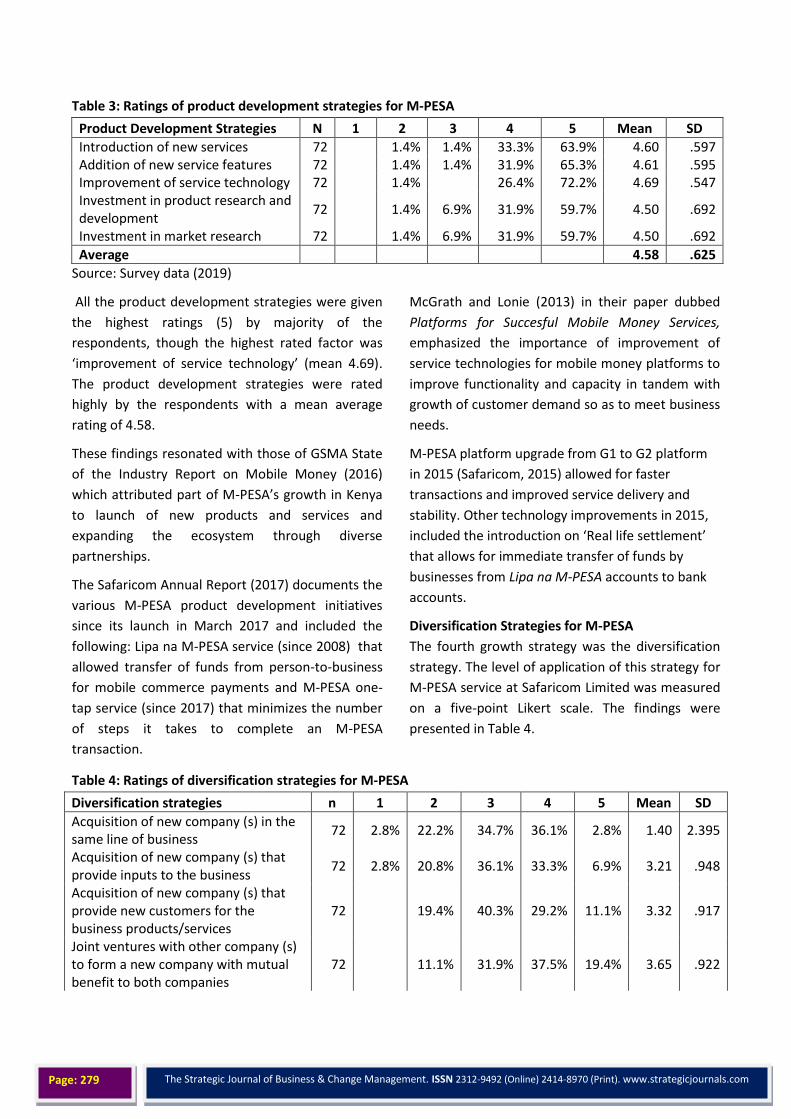
Table 3: Ratings of product development strategies for M-PESA
Product Development Strategies N 1 2 3 4 5 Mean SD
Introduction of new services 72 1.4% 1.4% 33.3% 63.9% 4.60 .597 Addition of new service features 72 1.4% 1.4% 31.9% 65.3% 4.61 .595 Improvement of service technology 72 1.4% 26.4% 72.2% 4.69 .547 Investment in product research and development
72 1.4% 6.9% 31.9% 59.7% 4.50 .692
Investment in market research 72 1.4% 6.9% 31.9% 59.7% 4.50 .692
Average 4.58 .625
Source: Survey data (2019)
All the product development strategies were given
the highest ratings (5) by majority of the
respondents, though the highest rated factor was
‘improvement of service technology’ (mean 4.69).
The product development strategies were rated
highly by the respondents with a mean average
rating of 4.58.
These findings resonated with those of GSMA State
of the Industry Report on Mobile Money (2016)
which attributed part of M-PESA’s growth in Kenya
to launch of new products and services and
expanding the ecosystem through diverse
partnerships.
The Safaricom Annual Report (2017) documents the
various M-PESA product development initiatives
since its launch in March 2017 and included the
following: Lipa na M-PESA service (since 2008) that
allowed transfer of funds from person-to-business
for mobile commerce payments and M-PESA one-
tap service (since 2017) that minimizes the number
of steps it takes to complete an M-PESA
transaction.
McGrath and Lonie (2013) in their paper dubbed
Platforms for Succesful Mobile Money Services,
emphasized the importance of improvement of
service technologies for mobile money platforms to
improve functionality and capacity in tandem with
growth of customer demand so as to meet business
needs.
M-PESA platform upgrade from G1 to G2 platform
in 2015 (Safaricom, 2015) allowed for faster
transactions and improved service delivery and
stability. Other technology improvements in 2015,
included the introduction on ‘Real life settlement’
that allows for immediate transfer of funds by
businesses from Lipa na M-PESA accounts to bank
accounts.
Diversification Strategies for M-PESA
The fourth growth strategy was the diversification
strategy. The level of application of this strategy for
M-PESA service at Safaricom Limited was measured
on a five-point Likert scale. The findings were
presented in Table 4.
Table 4: Ratings of diversification strategies for M-PESA
Diversification strategies n 1 2 3 4 5 Mean SD
Acquisition of new company (s) in the same line of business
72 2.8% 22.2% 34.7% 36.1% 2.8% 1.40 2.395
Acquisition of new company (s) that provide inputs to the business
72 2.8% 20.8% 36.1% 33.3% 6.9% 3.21 .948
Acquisition of new company (s) that provide new customers for the business products/services
72 19.4% 40.3% 29.2% 11.1% 3.32 .917
Joint ventures with other company (s) to form a new company with mutual benefit to both companies
72 11.1% 31.9% 37.5% 19.4% 3.65 .922
The Strategic Journal of Business & Change Management. ISSN 2312-9492 (Online) 2414-8970 (Print). www.strategicjournals.com
Page: 280
Strategic alliance with other company (s) to gain access to new customers or market segments
72 2.8% 29.2% 50.0% 18.1% 3.83 .751
Average 3.08 1.187
Source: Survey data (2019)
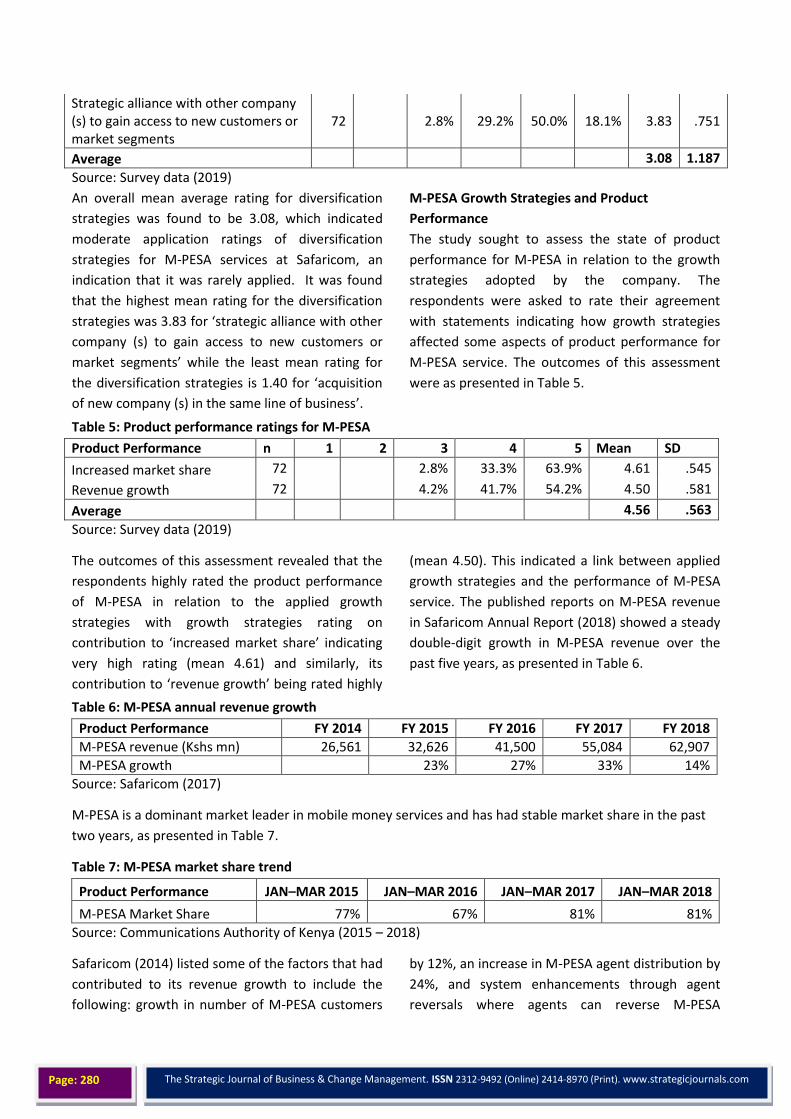
An overall mean average rating for diversification
strategies was found to be 3.08, which indicated
moderate application ratings of diversification
strategies for M-PESA services at Safaricom, an
indication that it was rarely applied. It was found
that the highest mean rating for the diversification
strategies was 3.83 for ‘strategic alliance with other
company (s) to gain access to new customers or
market segments’ while the least mean rating for
the diversification strategies is 1.40 for ‘acquisition
of new company (s) in the same line of business’.
M-PESA Growth Strategies and Product
Performance
The study sought to assess the state of product
performance for M-PESA in relation to the growth
strategies adopted by the company. The
respondents were asked to rate their agreement
with statements indicating how growth strategies
affected some aspects of product performance for
M-PESA service. The outcomes of this assessment
were as presented in Table 5.
Table 5: Product performance ratings for M-PESA
Product Performance n 1 2 3 4 5 Mean SD
Increased market share 72 2.8% 33.3% 63.9% 4.61 .545
Revenue growth 72 4.2% 41.7% 54.2% 4.50 .581
Average 4.56 .563
Source: Survey data (2019)
The outcomes of this assessment revealed that the
respondents highly rated the product performance
of M-PESA in relation to the applied growth
strategies with growth strategies rating on
contribution to ‘increased market share’ indicating
very high rating (mean 4.61) and similarly, its
contribution to ‘revenue growth’ being rated highly
(mean 4.50). This indicated a link between applied
growth strategies and the performance of M-PESA
service. The published reports on M-PESA revenue
in Safaricom Annual Report (2018) showed a steady
double-digit growth in M-PESA revenue over the
past five years, as presented in Table 6.
Table 6: M-PESA annual revenue growth
Product Performance FY 2014 FY 2015 FY 2016 FY 2017 FY 2018
M-PESA revenue (Kshs mn) 26,561 32,626 41,500 55,084 62,907
M-PESA growth 23% 27% 33% 14%
Source: Safaricom (2017)
M-PESA is a dominant market leader in mobile money services and has had stable market share in the past
two years, as presented in Table 7.
Table 7: M-PESA market share trend
Product Performance JAN–MAR 2015 JAN–MAR 2016 JAN–MAR 2017 JAN–MAR 2018
M-PESA Market Share 77% 67% 81% 81%
Source: Communications Authority of Kenya (2015 – 2018)
Safaricom (2014) listed some of the factors that had
contributed to its revenue growth to include the
following: growth in number of M-PESA customers
by 12%, an increase in M-PESA agent distribution by
24%, and system enhancements through agent
reversals where agents can reverse M-PESA
The Strategic Journal of Business & Change Management. ISSN 2312-9492 (Online) 2414-8970 (Print). www.strategicjournals.com
Page: 281
payments made to the wrong number. Key M-PESA
services listed in the report include Lipa na M-PESA,
M-SHWARI, Bank to M-PESA, Lipa Kodi, salary
disbursements, utility payments, airtime purchase
and cashless distribution for companies. A system
upgrade in 2014 to Application Programmable
Interface (API), resulted in near real time processing
of transactions, improving efficiencies in business
transactions such as salary disbursement and
receiving payments through M-PESA.
Safaricom (2015) attributed the growth in M-PESA
revenue to several factors including growth in Lipa
na M-PESA revenue through increase in number of
merchants on the service. Other services on M-
PESA listed as having contributed to revenue
growth included paybill, bulk payments, dividend
payments, international money transfer services,
M-SHWARI and KCB M-PESA. Market penetration
strategies such as increase in distribution by
increase in M-PESA agent outlets by 6% in 2015,
had resulted in growth of revenue and an increase
in number of M-PESA customers by a 14% increase
in number of 30-day active M-PESA customers.
Safaricom (2016) documents factors that
contributed to growth in M-PESA revenue in 2016
to include the following: Growth by 19.8% in M-
PESA 30-day active customers, 17.5% growth in M-
PESA agent distribution, growth in Lipa na M-PESA
payments by 74%, growth in international money
transfer service by 64% and increased uptake of
savings and loans services M-SHWARI and KCB M-
PESA. Product development improvements in M-
PESA platform technology through application
programming interfaces (API), allowed for third
party applications to plug into M-PESA to facilitate:
automated payment receipt processing, automated
payment disbursements and automated payment
reversals.
Safaricom (2017) lists several M-PESA product
development initiatives that have been rolled out
including a new easy to use menu that consolidates
M-SHWARI and KCB M-PESA, M-PESA statements,
pay bill services and real time settlement for
merchants. API functionality enables developers to
integrate M-PESA into their applications and
websites for ease of payment and M-PESA one-
touch feature reduces the number of steps for an
M-PESA transaction.
Safaricom (2018) lists several M-PESA market
development initiatives to include an partnership
with PayPal to allow M-PESA customers to transfer
money between M-PESA and PayPal mobile wallets
opening M-PESA up to the international mobile
commerce market.
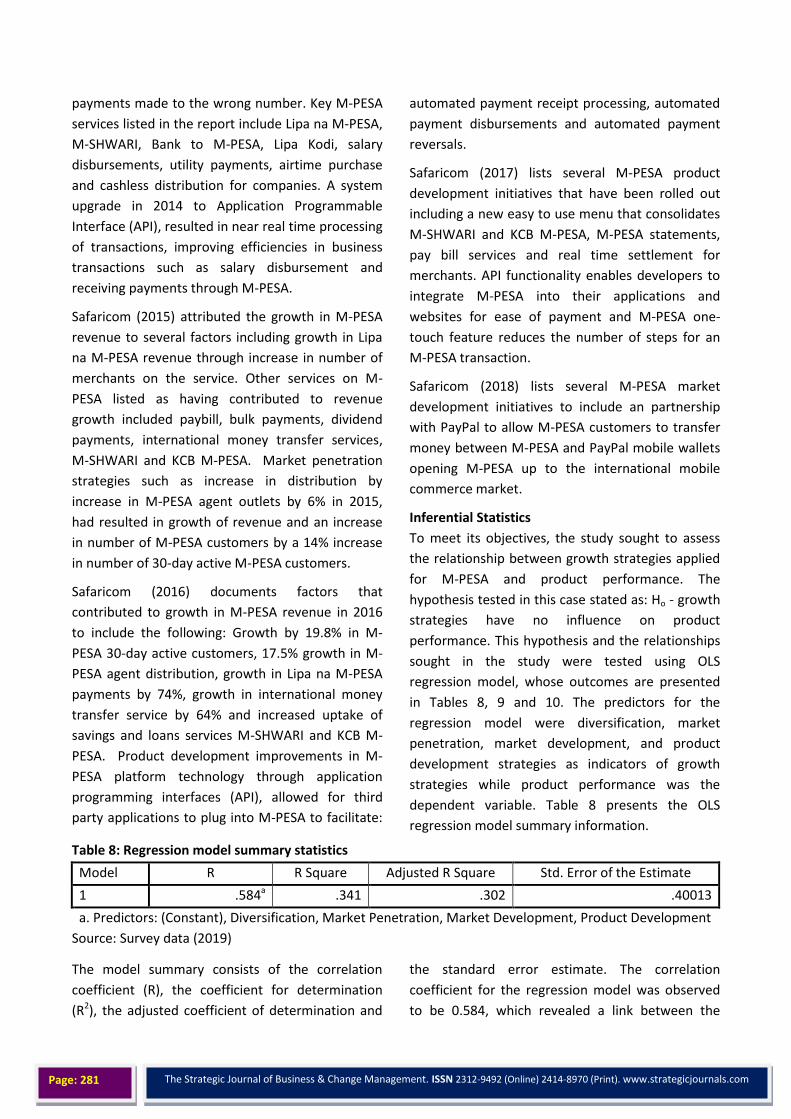
Inferential Statistics
To meet its objectives, the study sought to assess
the relationship between growth strategies applied
for M-PESA and product performance. The
hypothesis tested in this case stated as: Ho - growth
strategies have no influence on product
performance. This hypothesis and the relationships
sought in the study were tested using OLS
regression model, whose outcomes are presented
in Tables 8, 9 and 10. The predictors for the
regression model were diversification, market
penetration, market development, and product
development strategies as indicators of growth
strategies while product performance was the
dependent variable. Table 8 presents the OLS
regression model summary information.
Table 8: Regression model summary statistics
Model R R Square Adjusted R Square Std. Error of the Estimate
1 .584a .341 .302 .40013
a. Predictors: (Constant), Diversification, Market Penetration, Market Development, Product Development
Source: Survey data (2019)
The model summary consists of the correlation
coefficient (R), the coefficient for determination
(R2), the adjusted coefficient of determination and
the standard error estimate. The correlation
coefficient for the regression model was observed
to be 0.584, which revealed a link between the
The Strategic Journal of Business & Change Management. ISSN 2312-9492 (Online) 2414-8970 (Print). www.strategicjournals.com
Page: 282
study variables showing that the dependent and
independent variables have a relationship with each
other. The coefficient of determination was
observed to be 0.341 (R2= 0.341), which indicates
that the four independent variables, diversification,
market penetration, market development, and
product development strategies, can explain 34.1%
of the variability in the dependent variable of
product performance, the rest of the variability can
be explained by other variables not in this model.
Therefore, quite a significant proportion of product
performance is linked to the growth strategies
adopted.
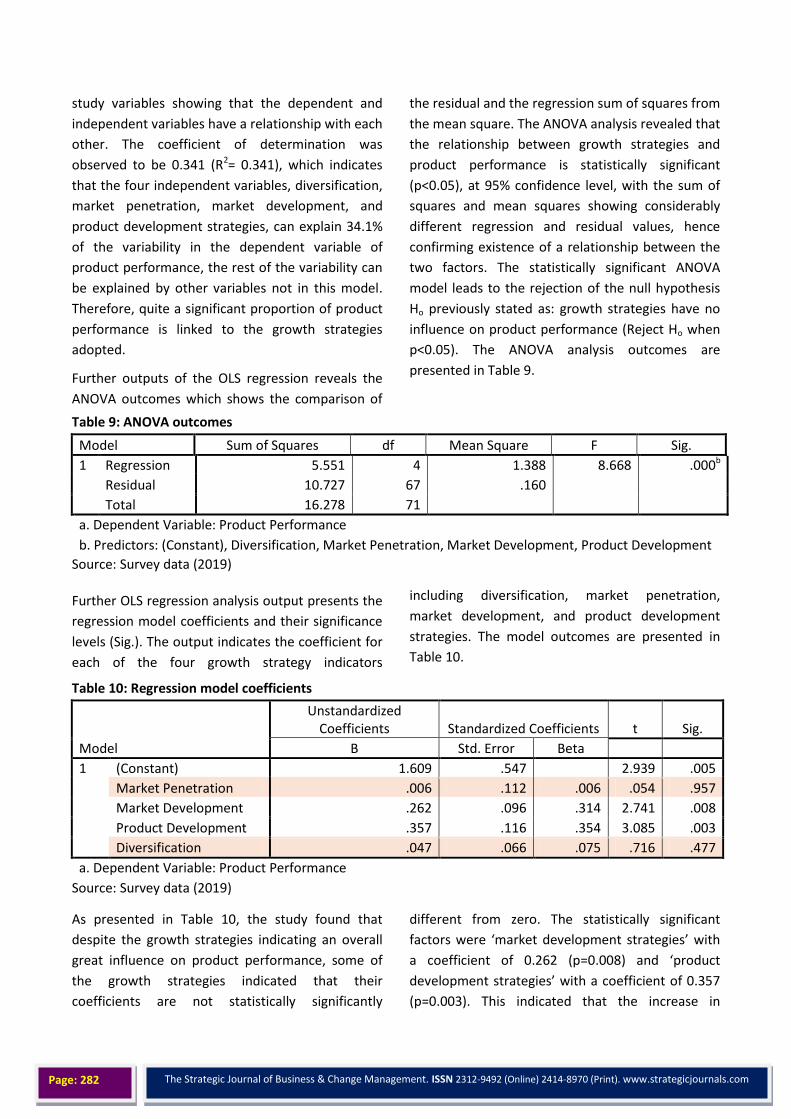
Further outputs of the OLS regression reveals the
ANOVA outcomes which shows the comparison of
the residual and the regression sum of squares from
the mean square. The ANOVA analysis revealed that
the relationship between growth strategies and
product performance is statistically significant
(p<0.05), at 95% confidence level, with the sum of
squares and mean squares showing considerably
different regression and residual values, hence
confirming existence of a relationship between the
two factors. The statistically significant ANOVA
model leads to the rejection of the null hypothesis
Ho previously stated as: growth strategies have no
influence on product performance (Reject Ho when
p<0.05). The ANOVA analysis outcomes are
presented in Table 9.
Table 9: ANOVA outcomes
Model Sum of Squares df Mean Square F Sig.
1 Regression 5.551 4 1.388 8.668 .000b
Residual 10.727 67 .160
Total 16.278 71
a. Dependent Variable: Product Performance
b. Predictors: (Constant), Diversification, Market Penetration, Market Development, Product Development
Source: Survey data (2019)
Further OLS regression analysis output presents the
regression model coefficients and their significance
levels (Sig.). The output indicates the coefficient for
each of the four growth strategy indicators
including diversification, market penetration,
market development, and product development
strategies. The model outcomes are presented in
Table 10.
Table 10: Regression model coefficients
Model
Unstandardized Coefficients Standardized Coefficients t Sig.
B Std. Error Beta
1 (Constant) 1.609 .547 2.939 .005
Market Penetration .006 .112 .006 .054 .957
Market Development .262 .096 .314 2.741 .008
Product Development .357 .116 .354 3.085 .003
Diversification .047 .066 .075 .716 .477
a. Dependent Variable: Product Performance
Source: Survey data (2019)
As presented in Table 10, the study found that
despite the growth strategies indicating an overall
great influence on product performance, some of
the growth strategies indicated that their
coefficients are not statistically significantly
different from zero. The statistically significant
factors were ‘market development strategies’ with
a coefficient of 0.262 (p=0.008) and ‘product
development strategies’ with a coefficient of 0.357
(p=0.003). This indicated that the increase in
The Strategic Journal of Business & Change Management. ISSN 2312-9492 (Online) 2414-8970 (Print). www.strategicjournals.com
Page: 283
market development strategies by 1 unit would
result in 0.262 unit increase in performance.
Likewise, 1 unit increase in product development
strategies would result in 0.357 unit increase in
performance. However, two of the factors, ‘market
penetration strategies’ with a coefficient of 0.06
(p=0.957) and ‘diversification strategies’ with a
coefficient of 0.047 (p=0.477) were found to be
non-statistically significantly different from zero
coefficients, an indication that they have negligible
contribution in the model. Therefore, the regression
model can be reconfigured as:
Y = α1 + β1X1 + β2 X2 + β3 X3 + β4X4 +ε
PP = 1.609 + 0.006 MP +0.262 MD + 0.357 PD +
0.047DV (where PP is product performance, MP is
market penetration, MD is market development
strategies, PD is product development strategies
and DV is diversification strategies).
The regression analysis therefore revealed that two
of the growth strategies, market penetration and
diversification strategies have negligible effect on
product performance, but the product development
and market development strategies have a
significant effect on product performance.
CONCLUSION
The study offered an empirical assessment of the
relationship between growth strategies and product
performance to address identified research gaps.
The study was anchored on the concepts of Igor
Ansoff’s broad concept of growth strategy which is
operationalized into the market penetration,
market development, product development, and
diversification strategies. The study concluded that
Safaricom Ltd, the largest Telecommunication
Company in the East African region, had applied the
four growth strategies of market development,
market penetration, product development and
diversification strategies for M-PESA service to
enhance its performance.
The study further found that although all the four
growth strategies were deployed for M-PESA
service, only two of these growth strategies, market
development and product development strategies,
were found to have statistically significant impact
on product performance. The study further
observed that the remaining two growth strategies
of market penetration and diversification have no
significant influence on product performance as the
factors were found to have non-statistically
significant coefficients within the regression model.
The study therefore concludes that growth
strategies have a positive significant effect on
product performance of M-PESA especially, product
development and market development strategies.
RECOMMENDATIONS
The study findings were that although the four
growth strategies were implemented for M-PESA,
only two of these, market development and
product development had a significant impact on
the performance of M-PESA. The researcher
recommends choice of growth strategies by
organizations based on the product life cycle stage
of a product or service and prevailing market
conditions to maximize product performance
results through targeted growth strategy
implementation. The study findings also identified
the two growth strategies of market development
and product development as being relevant
strategies to deploy when a product or service is at
maturity stage of the product life cycle as these
strategies maximize financial performance while
defending market share. These strategies help to
bring in new customers for a product or service
through entry into new markets, customer
segments and channels in the case of market
development and provide added value for
customers through introduction of new products
and improvement of service features, in the case of
product development.
Suggestion for Further Research
There is opportunity to investigate growth
strategies of bank-led mobile money products such
as Equitel led by Equity bank, to determine their
impact on product performance. This would be
useful in determining similarities and differences in
choice of growth strategies and impact of growth
The Strategic Journal of Business & Change Management. ISSN 2312-9492 (Online) 2414-8970 (Print). www.strategicjournals.com
Page: 284
strategies on product performance. This is due to
the structural differences in operation between
mobile network operator-led mobile money
services and bank-led mobile money services. Other
suggested research would be to investigate
Safaricom Limited’s growth strategies to advance
M-PESA service in neighboring countries such as
Tanzania to determine similarities and differences
in implementation of growth strategies across
different countries and the impact on product
performance. The researcher also suggested
studying a combination of various factors that
influence organization performance such as
strategy, firm factors and environmental factors for
the mobile money market to determine which of
these factors, have the greatest impact on
organizational performance.
REFERENCES
Adams, G. R., & Schvaneveldt, J. D. (1985). Understanding Research Methods. White Plains, New York:
Longman.
Ansoff, H. I. (1965). Corporate strategy: An analytic approach to business policy for growth and expansion.
New York, NY: McGraw-Hill.
Barney, J. (1991). Firm resources and sustained competitive advantage. Journal of Management, 17(1), 99 -
120. doi:https://journals.sagepub.com /doi/pdf/10.1177/014920639101700108
Baruch, Y. & Holtom B.C. (2008). Survey response rate levels and trends in organizational research. Human
Relations 61(8); DOI: 10.1177/ 0018726708094863
Bless, C., & Smith H. C. (2000). Fundamentals of social research methods: An African perspective. Lusaka:
Juta Education (PTY) Ltd.
Borg, W. R., & Gall, M. D. (1989). Educational research: An introduction. White Plains, New York: Longman.
Brown, W. B., & Moberg, D. J. (1980). Organization theory and management: A macro approach. New York:
John Wiley & Sons, Inc.
Capital Business. (2010, Feb 17th). M-PESA wins Kenya a global award. Capital Business. Retrieved from
https://www.capitalfm.co.ke/business/2010 /02/mpesa-wins-kenya-a-global-award/
Chikere, C. C., & Nwoka, J. (2015, September). The systems theory of management in modern day
organizations - A study of Aldgate Congress Resort Limited Port Harcout. International Journal of
Scientific and Research Publications, 5(9), 2250 - 3153. Retrieved from
http://www.ijsrp.org/research-paper-0915/ijsrp-p4554.pdf
Cohen, L., Manion, L., & Morrison, K. (2007). Research methods in education (6th ed.). New York, NY:
Routledge. Retrieved from http://gtu.ge/Agro-Lib/RESEARCH%20METHOD%20COHEN%20ok.pdf
Cole, G. (2004). Management theory and practice (6th ed.). Hampshire, England: Cengage Learning Services.
Communications Authority of Kenya. (2018). Third quarter sector statistics report for the financial year
2017/2018 (1st January - 31st March 2018). Retrieved from Communications Authority of Kenya:
https://ca.go.ke/wp-content/uploads /2018/07/Sector-Statistics-Report-Q3-2017-18-2.pdf
Communications Authority of Kenya. (2018, October - December). Second quarter sector statistics report for
the financial year 2018/2019. Retrieved from https://ca.go.ke/wp-content/uploads/2019/03/Sector-
Statistics-Report-Q2-2018-19.pdf
Connor, T. (2002, June 25). The resource-based view of strategy and its value to practising managers.
Strategic change, 11, 307 - 316. doi:10.002/jsc.593
The Strategic Journal of Business & Change Management. ISSN 2312-9492 (Online) 2414-8970 (Print). www.strategicjournals.com
Page: 285
Delice, A. (2010). The sampling issues in quantitative research. Retrieved from
https://files.eric.ed.gov/fulltext/EJ919871.pdf
Dess, G. G., Lumpkin, G. T., & Eisner, A. B. (2008). Strategic management text and cases (4th ed.). New York,
NY: McGraw-Hill/Irwin.
Etori, M. (2013, November). Business growth strategies and organization performance in Chase Bank
Limited. Retrieved from http://erepository.uonbi.ac.ke/
bitstream/handle/11295/59351/Etori_Business%20growth%20strategies%20and%20organization%2
0performance%20in%20chase%20bank%20limited.pdf?sequence=3&isAllowed=y
Galbraith, J. R., & Nathanson, D. A. (1978). Strategy implementation: The role of structure and process.
Minnesota: West publishing company.
Gamble, J. E., & Thompson, Jr., A. A. (2011). Essentials of strategic management: The quest for competitive
advantage (2nd ed.). New York, NY: McGraw-Hill Irwin.
Gitu, A. W. (2013, November). An investigation of Safaricom M-PESA strategies in enhancing mobile money
transfer services in Kenya. Retrieved from
http://erepository.uonbi.ac.ke/bitstream/handle/11295/59108/Gitu_An%20Investigation%20Of%20
Safaricom%20Mpesa%20Strategies%20In%20Enhancing%20Mobile%20Money%20Transfer%20Servi
ces%20in%20Kenya.pdf?sequence=3&isAllowed=y
Gliem J.A. & Gliem R., (2003). Calculating, Interpreting and Reporting Chronbach’s Alpha Reliability
Coefficient for Likert Type Scales. Proceedings of the Mid-West Research to Practice Conference in
Adult Continuing Community Edducation, pp 82-88, Ohio State University, Ohio.
Grant, R. M. (2010). Contemporary strategy analysis text and cases (7th ed.). West Sussex, England: Wiley
Publishers.
GSMA. (2016). State of the industry report on mobile money: Decade edition 2006 -2016. Retrieved from
https://www.gsma.com/mobilefordevelopment/wp-content/uploads/2017/03/GSMA_State-of-the-
Industry-Report-on-Mobile-Money_2016.pdf
GSMA. (2016, November). Success factors for mobile money services: A quantitative asssesment of success
factors. Retrieved from https://www.gsmaintelligence
.com/research/?file=923539C02F5D39174BA09C6851EFC25A&download
Hair,Jr., J. F., Wolfinbarger, M. F., Ortinau, D. J., & Bush, R. P. (2010). Essentials of marketing research (2nd
ed.). New York, NY: McGraw-Hill Irwin.
Harrison, J. S., & St. John, C. H. (2001). Foundations in strategic management (2nd ed.). Cincinatti, Ohio:
South Western College Publishing.
Henry, A. E. (2011). Understanding strategic management (2nd ed.). New York, NY: Oxford University Press.
Hughes, N., & Lonie, S. (2007, Winter/Spring). M-PESA: Mobile money for the "unbanked" turning cell phones
into 24 hour tellers in Kenya. Innovations: Technology, Governance, Globalization, 2(1-2), 63 - 81.
doi:https://doi.org /10.1162/itgg.2007.2.1-2.63
Iacobucci, D., & Churchill, Jr., G. A. (2010). Marketing research methodological foundations (10th ed.).
Canada: South-Western, Cengage Learning.
International Finance Corporation. (n.d.). M-Money channel distribution case - Kenya: Safaricom M-PESA.
Retrieved from
https://www.ifc.org/wps/wcm/connect/4e64a80049585fd9a13ab519583b6d16/tool+6.7.+case+stu
dy+-+m-pesa+kenya+.pdf?mod=ajperes
The Strategic Journal of Business & Change Management. ISSN 2312-9492 (Online) 2414-8970 (Print). www.strategicjournals.com
Page: 286
Israel, G. D. (2003, June). Determining sample size. Retrieved from
https://www.tarleton.edu/academicassessment/documents/Samplesize.pdf
Johnson, G., & Scholes, K. (1997). Exploring corporate strategy (4th ed.). Hemel Hempstead, Hertfordshire:
Prentice Hall.
Johnson, G., Scholes, K., & Whittington, R. (2008). Exploring corporate strategy (8th ed.). Harlow, England:
Pearson Education Limited.
Jones, R. G., & George, M. J. (2011). Essentials of contemporary management. New York, NY: McGraw-Hill
Irwin.
Kaplan, R. S., & Norton, D. P. (2004). Strategy maps: Converting intangible assets into tangible outcomes.
Boston, MA: Harvard Business School Publishing Corporation.
Kariuki, P. M., Awino, B. D., & Ogutu, D. (2011). Effect of firm level factors, firm strategy, business
environment on firm performance. Retrieved from
http://erepository.uonbi.ac.ke/bitstream/handle/11295/9853/aibuma2011_submission_49%20
Kiprono, Y. R. (2015, November). Organizational growth strategies adopted by Safaricom Kenya Ltd.
Retrieved from http://erepository.uonbi.ac.ke/
bitstream/handle/11295/94035/Yegon_Organizational%20growth%20strategies%20adopted%20by
%20safaricom.pdf?sequence=3
Klein, M. (2011, February 21st). Mobile money in 2006 and 2016. Retrieved from
http://blogs.worldbank.org/psd/mobile-money-in-2006-and-2016
Kraaijenbrink, J., Spender, J., & Groen, A. (2010, March 18th). The resource-based view: a review and
assesment of its critiques. Retrieved from https://mpra.ub.uni-
muenchen.de/21442/2/MPRA_paper_21442.pdf
Lal, R., & Sachdev, I. (2015, July). Mobile money services: Design and development for financial inclusion.
Retrieved from https://www.hbs.edu/faculty/Publication %20Files/15-083_e7db671b-12b2-47e7-
9692-31808ee92bf1.pdf
Levin, P. (2012). Organizational design to succeed in mobile money. Retrieved from
https://www.gsma.com/mobilefordevelopment/wp-content/uploads/2012
/10/2012_MMU_Organisational-design-to-succeed-in-mobile-money.pdf
Lina, R. K. (2016, October). Growth strategies and performance of large oil companies in Kenya. Retrieved
from http://erepository.uonbi.ac.ke/bitstream/handle/
11295/99317/Kyalo%20Rixion_Growth%20Strategies%20and%20Performance%20of%20Large%20Oi
l%20Companies%20in%20Kenya.pdf?sequence=1&isAllowed=y
Machuki, M. M. (2012, January). Relationship between internal growth strategies and perfomance in selected
banks in Nairobi. Retrieved from https://ir-library.ku.ac.ke/handle/123456789/6312
Mas, I., Radcliffe, D., & Bill & Melinda Gates Foundation. (2010, March). Mobile payments go viral: M-PESA in
Kenya. Retrieved from http://documents.
worldbank.org/curated/en/638851468048259219/pdf/543380WP0M1PES1BOX0349405B01PUBLIC1
McAdam, R., & Bailie, B. (2002). Business performance measures and alignment impact on strategy: The role
of business improvement models. International Journal of Operations & Production Management,
22(9), 972 - 996. doi:https://doi.org/10.1108/01443570210440492
The Strategic Journal of Business & Change Management. ISSN 2312-9492 (Online) 2414-8970 (Print). www.strategicjournals.com
Page: 287
Miller, D. (2003). An assymetry-based view of advantage: Towards an attainable sustainability. Strategic
Management Journal, 24, 961 - 976. doi:10.1002/smj.316
Muchele, N., & Kombo, H. (2019). Effect of growth strategies on the performance of food manufacturing
firms in Nairobi County, Kenya. European Journal of Business and Management, 11(15).
doi:10.7176/EJBM
Mugenda, O, M, & Mugenda, A, .G. (2003). Research Methods. Quantitative and Qualitative Approaches,
ACTS Press: Nairobi.
Murali, C. Sarv, D. & David, P. (2007). International diversification and firm performance: Role of information
technology investments. Journal of World Business: 42, 184–197
Murigi, N. N. (2010, November). Growth strategies adopted by top 100 SMEs in ICT in Kenya. Retrieved from
https://pdfs.semanticscholar.org/ e481/56c8d7818bff1891c09654005818f752142c.pdf
Muthiora, B. (2015). Enabling mobile money policies in Kenya: Fostering a digital financial revolution.
Retrieved from https://www.gsma.com/mobilefordevelopment/wp-content/uploads/2015
/02/2015_MMU_Enabling-Mobile-Money-Policies-in-Kenya.pdf
Mutuma, P. (2013, November). An investigation of the effects of expansion strategies on performance of
commercial banks in Kenya: A case of banks in tier one. Retrieved from
https://pdfs.semanticscholar.org/33f8/321918c b3b58e4a13e17de7eae6008aa23d4.pdf
Mwangi, E. W., & Gakobo, J. (2018, July). Growth strategies and perfromance of selected milk processing
companies in Kenya. International Journal of Contemporary Aspects in Strategic Management, 2(1),
158 - 172. Retrieved from http://www.ijcab.org/wp-content/uploads/2018/07/IJCASM. 2018.45.pdf
Mwania, W. N. (2017, November). The relationship between growth strategy and performance of
commercial banks in Kenya. Retrieved from
http://erepository.uonbi.ac.ke:8080/xmlui/bitstream/handle/11295/102631/Mwania%2CWinfred_T
he%20Relationship%20Between%20Growth%20Strategy%20and%20Performance%20of%20Comme
rcial%20Banks%20in%20Kenya.pdf?sequence=1&isAllowed=y
Mwau, P.,Oloko, M., & Muturi, W. (2016). The Influence of Market Development Strategy on Performance of
Firms within the Insurance Industry in Kenya. International Journal of Advanced Engineering and
Management Research, 1(2), 111-150
Naghavi, N., Shulist, J., Cole, S., Kendall, J., & Xiong, W. (2016, November). Success factors for mobile money
services: a quantitative assesment of success factors. Retrieved from
https://www.gsmaintelligence.com/research/?file=923539
C02F5D39174BA09C6851EFC25A&download
Njoroge, J. W. (2012, October). International growth strategies for M-PESA business adopted by Safaricom
Kenya Ltd. Retrieved from
http://erepository.uonbi.ac.ke/bitstream/handle/11295/13512/Njoroge_International%20growth%2
0strategies%20for%20Mpesa%20business%20adopted%20by%20Safaricom%20Kenya%20Ltd.pdf?se
quence=3
Obonyo, M. A. (2015, September). Growth strategies and performance of safaricom limited in Kenya.
Retrieved from http://erepository.uonbi.ac.ke/bitstream/
handle/11295/94947/Obonyo_Growth%20Strategies%20and%20Performance%20of%20Safaricom%
20Limited%20in%20Kenya.pdf?sequence=3
The Strategic Journal of Business & Change Management. ISSN 2312-9492 (Online) 2414-8970 (Print). www.strategicjournals.com
Page: 288
Parnell, J. A. (2006). Strategic management: Theory and practice (2nd ed.). Cincinatti, Ohio: Atomic Dog
Publishing.
Pearce II, J. A., & Robinson, Jr., R. B. (2009). Strategic management: Formulation, implementation and
control (11th ed.). New York, NY: McGraw-Hill/Irwin.
Penicaud, C. (2012). State of the industry: Results from the 2012 Global Mobile Money Adoption Survey.
Retrieved from https://www.gsma.com/mobilefor development/wp-
content/uploads/2013/02/MMU_State_of_industry.pdf
Pitts, R. A., & Lei, D. (2000). Strategic management: Building and sustaining competitive advantage (2nd ed.).
Cincinatti, Ohio: South-Western College Publishing.
Proudly Made in Africa. (2014, June). M-PESA: The Safaricom story - case study. Retrieved from
http://www.proudlymadeinafrica.org/images/uploads/docs/M-
Pesa_CaseStudy_June14_synopsis.pdf
Robbins, S. P. (1990). Organization theory: Structure, design and applications (3rd ed.). Englewood Cliffs,
New Jersey: Prentice Hall Inc.
Safaricom. (2014). Safaricom limited annual report 2014. Retrieved from Safaricom:
https://www.safaricom.co.ke/images/Downloads/Resources_Downloads/annual_report_2014.pdf
Safaricom. (2015). Safaricom limited annual report 2015. Retrieved from Safaricom:
https://www.safaricom.co.ke/images/Downloads/Resources_Downloads/annual _report_2015.pdf
Safaricom. (2016). Safaricom limited annual report 2016. Retrieved from Safaricom:
https://www.safaricom.co.ke/images/Downloads/Resources_Downloads/Safaricom_Limited_2016_
Annual_Report.pdf
Safaricom. (2017). Safaricom annual report and financial statements 2017. Retrieved from Safaricom:
https://www.safaricom.co.ke/images/Downloads/Resources_
Downloads/Safaricom_2017_Annual_Report.pdf
Safaricom. (2018). Safaricom annual report and financial statements 2018. Retrieved from Safaricom:
https://www.safaricom.co.ke/images/Downloads/Safaricom_ annual_report_070818.pdf
Thompson, A. A., Peteraf, M. A., Gamble, J. E., & Strickland III, A. J. (2012). Crafting and executing strategy:
The quest for competitive advantage, concepts and cases. New York, NY: McGraw-Hill Irwin.
University of Pittsburgh. (2018, July 30). Nonprofit Strategic management theories. Retrieved from University
of Pittsburgh: https://pitt.libguides.com/c.php ?g=12116&p=64795
Yesho, S. C. (2017). The effect of growth strategies on the performance of small and medium enterprises in
Kenya: A case of the Good Food Company. Retrieved from
http://erepo.usiu.ac.ke/bitstream/handle/11732/3455/Sabrina%20Cherotich%20Yesho%20Thesis%2
0.pdf?sequence=1&isAllowed=y
Zikmund, W. G. (1988). Business research methods (2nd ed.). New York, NY: The Dryden Press.
Zinbarg R.E, Yovel I., & Li W., (2005). Chronbach’s alpha, Revelle’s Beta, and McDonald’s Omega h: their
relations with each other and two alternative conceptualizations of reliability. Psychometrika, 70(1),
123-133