growth without governance - world bank · 2003-12-01 · growth without governance daniel kaufmann...
TRANSCRIPT

Second Draft
Growth Without Governance
Daniel Kaufmann
Aart Kraay
The World Bank
May 2002
Abstract: Many countries in Latin America and the Caribbean (LAC) perform surprisingly poorly relative to their per capita incomes in cross-country comparisons of three dimensions of governance: rule of law, government effectiveness, and control of corruption. We document this regularity using a newly-updated set of worldwide governance indicators covering 175 countries for the period 2000/01. We next propose an empirical strategy which leads to the identification of i) strong positive causal effects running from better governance to higher per capita incomes, and also ii) weak and even negative causation in the opposite direction from per capita incomes to governance. We use the empirical model to interpret the complex two-way relationship between incomes and governance in LAC. Finally, we speculate as to the potential importance of elite influence and state capture in accounting for the surprising negative effects of per capita incomes on governance, and suggest priorities for actions to improve governance. ________________________ 1818 H Street, NW, Washington, DC 20433, [email protected], [email protected]. This paper has been prepared for the 5th Economia Panel Meeting, to be held at Harvard University on April 26th, 2002. We would like to thank our discussants, Lant Pritchett and Eduardo Lora, as well as Antonio Estache, Joel Hellman, Daniel Lederman, Maurice Schiff and Jaume Ventura for helpful comments, the Panel Meeting participants for their suggestions, and Massimo Mastruzzi and Erin Farnand for assistance. The views expressed here are the authors’, and do not necessarily reflect those of the World Bank, its Executive Directors, or the countries they represent. Errors are the authors’. For access to the newly-updated governance indicators, visit http://www.worldbank.org/wbi/governance/govdata2001.htm .

1
I. Introduction
There are striking differences in how countries in Latin America (LAC) fare in
terms of their performance on different measures of institutional quality or governance.
Figure 1 illustrates this by plotting the relationship between governance (on the vertical
axis) and log per capita incomes (on the horizontal axis) in a large sample of countries,
for six different dimensions of governance. Countries in LAC are labeled and highlighted
with red dots. Per capita incomes are measured in 1995, in 1985 US dollars adjusted for
differences in purchasing power, and the governance indicators refer to the period
2000/01.
In terms of the institutions of political accountability, countries in LAC fare
surprisingly well relative to the rest of the world, in the sense that a strong majority of
countries in the region lie above the simple OLS regression line of the Voice and
Accountability measure on per capita incomes. In contrast, most countries in LAC fare
surprisingly poorly on three other dimensions of governance (Government Effectiveness,
Rule of Law, and Control of Corruption). Finally, for the last two dimensions of
governance we consider (Political Stability and Regulatory Quality), countries in LAC are
fairly evenly distributed above and below the ordinary least squares regression line.
Table 1 summarizes these patterns by indicating the proportion of the 26 countries in the
region for which we have data that fall above and below the regression line. The last
column also reports the p-value associated with the null hypothesis of a sign test that
countries in LAC are evenly distributed above and below the regression line for the
entire sample. For the first four indicators we mention, the patterns we note are strongly
statistically significant at conventional levels – with LAC faring surprisingly well in the first
indicator (political accountability), while poorly in the following three (government
effectiveness, rule of law and control of corruption).
This paper is concerned with providing an interpretation of these patterns and
their implications for policy. In Section 2 of this paper, we briefly describe how we have
constructed the governance indicators for 2000/01 used in Figure 1 as part of an
ongoing project to measure governance worldwide, drawing on a wide variety of sources
of data on perceptions of governance and a consistent aggregation methodology. In
addition to allowing us to construct a set of governance indicators covering a very large

2
sample of countries, one useful feature of our methodology is that it allows us to
construct measures of the precision of these governance indicators. As we have found in
previous work, these standard errors associated with estimates of governance are rather
large, suggesting that simple country rankings can be misleading and underscoring the
need for caution in making comparisons of the quality of governance across countries
using this type of data.
In Section 3 of this paper we turn to an interpretation of the positive correlations
between per capita incomes and governance in Figure 1. As is well understood, this
correlation can in principle reflect some combination of (a) causal effects running from
better governance to higher per capita incomes, (b) reverse causation or feedback from
higher per capita incomes to better governance, and (c) omitted variables which improve
both governance and per capita incomes. A recent and growing literature has identified
large causal effects running from governance to per capita incomes, using deep
historical determinants of institutional quality as instruments.
Our contribution in this section of the paper is to provide evidence on the
feedback from incomes to governance, which we argue is important for a variety of
reasons. Most crudely, it sheds light on the often-heard argument that good governance
is a “luxury” that only rich countries can “afford”. More practically, if as is increasingly the
case, aid is allocated based on the quality of governance, understanding the effects of
income on governance is important in determining whether poor countries should
receive special treatment or a “governance discount” in such allocation rules. Finally, this
channel of reverse causation is important in determining the importance of “virtuous
circles” of better governance feeding higher incomes which in turn support better
governance. Despite its importance, this channel of reverse causation has not been
subject to much empirical scrutiny, at least in part because the required convincing
instruments for per capita incomes in a cross-section of countries are very scarce.
Our identification strategy does not rely on success in the search for such elusive
instruments. Rather we adopt the other (but less commonly used) textbook solution to
the problem of identification – the use of non-sample information. In particular, we show
that the information on the precision or accuracy of the governance indicators we
construct in Section 2, together with some judicious assumptions regarding the extent of

3
measurement error in per capita incomes and the importance of omitted variables, are
sufficient to identify the causal effects running from per capita incomes to governance.
Based on this empirical strategy, our rather surprising finding in this section is
that it is very difficult to find any evidence of a positive effect of incomes on the quality of
governance. Using our estimates of the (substantial) imprecision of the governance
indicators, we find that the data are consistent with a strong negative feedback from per
capita incomes to governance. The assumptions required to negate such results are
unrealistic: the only way that it would be possible to identify positive feedback from per
capita incomes to governance is if we assume that either (a) measurement error in
governance is implausibly large, and/or (b) there are important omitted variables that
drive per capita incomes and governance in opposite directions. This finding of negative
feedback from incomes to governance motivates our choice of title: “Growth Without
Governance”.
We emphasize that the empirical framework we use to identify the causal effects
running from governance to incomes and vice versa is designed to capture very long run
effects. As a result, our finding of negative feedback cannot be interpreted as implying
that rapid growth over relatively short periods such as a decade should be associated
with declines in governance. Nor can it be interpreted as implying that factors that are
good for growth in the very long run will be negatively correlated with institutional quality,
since most such variables that one can think of are likely to have substantial direct
positive effects on governance, which outweigh any negative feedback effects through
income. And of course, our finding of negative feedback from incomes to governance
does not imply a negative unconditional correlation between these two variables, since
this correlation is dominated by the strong positive effects of governance on per capita
incomes.
What we can say is that our results cast doubt on the conventional wisdom that
there are long-run “virtuous circles” from higher incomes to better governance which in
turn support higher incomes. At some level, this should not be very surprising. It is not
hard to think of a variety of reasons why entrenched elites in a country benefit from the
status quo of misgovernance and can successfully resist demands for change as
incomes rise over very long periods of time. In the last section of the paper, we discuss

4
how more detailed governance diagnostic surveys carried out by the World Bank are
helping to cast light on one such mechanism through which influential elites can resist
demands for improvement in governance – the phenomenon of “state capture” – and the
implications of this for strategies to improve governance.
II. Measuring Governance
In this section, summarizing our work in Kaufmann, Kraay and Zoido-Lobaton
(1999a,b), we describe how we organize a large set of indicators of perceptions of
governance into six clusters corresponding to six basic dimensions of governance. We
briefly describe the sources of governance data and summarize our methodology for
combining the many indicators within each cluster into aggregate governance indicators.
II.1 Governance Clusters
We construct six aggregate governance indicators, motivated by a broad
definition of governance as the traditions and institutions by which authority in a country
is exercised. This includes (1) the process by which governments are selected,
monitored and replaced, (2) the capacity of the government to effectively formulate and
implement sound policies, and (3) the respect of citizens and the state for the institutions
that govern economic and social interactions among them. Clearly, this classification of
indicators into clusters corresponding to this definition of governance is not intended to
be definitive. Rather, it reflects our own views of what constitutes a useful and interesting
organization of the data that is consistent with prevailing notions of governance.
The first two governance clusters are intended to capture the first part of our
definition of governance: the process by which those in authority and selected and
replaced. We refer to the first of these as “Voice and Accountability”, and include in it a
number of indicators measuring various aspects of the political process, civil liberties
and political rights. These indicators measure the extent to which citizens of a country
are able to participate in the selection of governments. We also include in this category
indicators measuring the independence of the media, which serves an important role in
holding monitoring those in authority and holding them accountable for their actions. The

5
second governance cluster is labeled “Political Stability”. In this index we combine
several indicators which measure perceptions of the likelihood that the government in
power will be destabilized or overthrown by possibly unconstitutional and/or violent
means, including terrorism. This index captures the idea that the quality of governance in
a country is compromised by the likelihood of wrenching changes in government, which
not only has a direct effect on the continuity of policies, but also at a deeper level
undermines the ability of all citizens to peacefully select and replace those in power.
The next two clusters summarize various indicators of the ability of the
government to formulate and implement sound policies. In “Government Effectiveness”
we combine perceptions of the quality of public service provision, the quality of the
bureaucracy, the competence of civil servants, the independence of the civil service from
political pressures, and the credibility of the government’s commitment to policies into a
single grouping. The main focus of this index is on “inputs” required for the government
to be able to produce and implement good policies and deliver public goods. The second
cluster, which we refer to as “Regulatory Quality”, is more focused on the policies
themselves. It includes measures of the incidence of market-unfriendly policies such as
price controls or inadequate bank supervision, as well as perceptions of the burdens
imposed by excessive regulation in areas such as foreign trade and business
development.
The last two clusters summarize in broad terms the respect of citizens and the
state for the institutions which govern their interactions. In “Rule of Law” we include
several indicators which measure the extent to which agents have confidence in and
abide by the rules of society. These include perceptions of the incidence of both violent
and non-violent crime, the effectiveness and predictability of the judiciary, and the
enforceability of contracts. Together, these indicators measure the success of a society
in developing an environment in which fair and predictable rules form the basis for
economic and social interactions. The final cluster, which we refer to as “Control of
Corruption”, measures perceptions of corruption, conventionally defined as the exercise
of public power for private gain. Despite this straightforward focus, the particular aspect
of corruption measured by the various sources differs somewhat, ranging from the
frequency of “additional payments to get things done,” to the effects of corruption on the
business environment, to measuring “grand corruption” in the political arena or in the

6
tendency of elite forms to engage in “state capture”. The presence of corruption is often
a manifestation of a lack of respect of both the corrupter (typically a private citizen or
firm) and the corrupted (typically a public official) for the rules which govern their
interactions, and hence represents a failure of governance according to our definition.
II.2 Sources of Governance Data
In this section we describe the set of measures of governance we have used to
construct our six composite governance indicators for 2000/01. We rely on 194 different
measures drawn from 17 different sources of subjective governance data constructed by
15 different organizations, as listed in Table 2. These sources include international
organizations, political and business risk rating agencies, think tanks, and non-
governmental organizations.1 Four of these sources are included in the 2000/01 index
for the first time, and the remaining are updates of sources included in the 1997/98
indicators.2 In this section, we provide an overview of some of the key features of these
sources. Appendix 1 of our previous paper (Kaufmann, Kraay and Zoido-Lobaton
(2002)) presents a detailed description of each of these sources.
We distinguish sources according to (1) whether they are polls of experts, or
surveys of businesspeople or citizens in general, and (2) the extent to which the sample
of countries included in the sources is representative of the world as a whole.3 The
1 For access the full data set of governance indicators, background papers, and detailed explanations on its sources, visit http://www.worldbank.org/wbi/governance/govdata2001.htm. 2 Two of the sources we refer to as “updates of existing sources” are in fact new surveys which included questions similar to those in their previous incarnations. These are the World Bank’s World Business Environment Survey which is a follow-up in the 1997 World Development Report Survey, and the Gallup Millennium Survey which we treat as a follow-up of the Gallup 50th Anniversary Survey included in our previous paper. There is also some overlap between sources. A portion of the World Bank’s Business and Enterprise Environment Survey (BPS, see http://www.worldbank.org/wbi/governance/beepsinteractive.htm) was used in the World Business Environment Survey, and we refer to the former as a distinct source only when we use questions that appeared only in the former. Also, in 1997 we used data from the Global Competitiveness Survey for Africa as a separate source. In 2000, with the exception of the questions on state capture for transition economies, its questionnaire coincided with that of the World Business Environment Survey, and we include it in the latter source. Finally, one source we used in 1997/98 is no longer published (Central European Economic Review), and so we are unable to update this source. 3 In the 1997/98 version of the governance database, our sources consisted of eight polls of experts and seven surveys, and five of our sources were classified as representative. In the

7
advantages and disadvantages of polls of experts relative to surveys of market
participants are well-known, and are discussed in our previous paper (Kaufmann, Kraay
and Zoido-Lobaton (1999b)). Briefly, the choice among these two types of governance
data involves tradeoffs in terms of cross-country comparability versus first-hand
knowledge of local conditions. Polls of experts in general are explicitly designed to
provide comparable results across countries, through elaborate benchmarking
procedures. However, their reliability depends greatly on the ability of the small group of
experts involved to provide objective and accurate assessments of the governance
dimensions being measured. In contrast, surveys typically draw on the responses of
large numbers of local respondents with direct first-hand knowledge of local conditions.
However, to the extent that ostensibly identical survey questions are interpreted
differently by respondents with different cultural and/or socioeconomic backgrounds, it
cross-country comparisons using survey responses can also be subject to response
bias.4
Sources of governance data also vary with respect to the sample of countries
they cover. A number of sources cover a very large sample of developed and developing
countries, while others cover very narrowly-focused samples of countries. Also, many of
the poorest and/or smallest countries in the world tend not to be covered by many
commercially-oriented polls because they are relatively unattractive to foreign investors.
Since there is a strong positive association across countries between governance and
per capita incomes, this difference between sources makes it difficult to compare
indicators from sources which cover sets of countries with very different income levels.
Similarly, there may be regional differences in governance which hamper comparisons
across sources. For example, it is not clear how to compare a governance rating based
only on transition economies with one based on a broad set of countries. As discussed
in a previous paper (Kaufmann, Kraay and Zoido-Lobaton (1999a)), the methodology we 2000/01 version, we have added two new surveys (the World Bank’s Business Environment and Enterprise Performance Survey of firms in transition economies (BPS), and Latinobarometro (LBO), a private survey conducted in 17 Latin American countries), and two new polls of experts (the Columbia University State Capacity Study (CUD) covering 109 countries worldwide, and the PriceWaterhouseCoopers Opacity Index (PWC) covering 35 countries). 4 For example, it is easy to see how responses to a question on the prevalence of “improper practices” can be affected by country-specific perceptions of what such practices might be. On various approaches to address differences in country-specific perceptions, see Hellman et. al. (2000) and Kaufmann and Wei (1999). One ought to note, however, that polls based on a small group of experts can also be subject to these biases, depending on location of such expertise and extent to which polling agency manages to impose common standards in responses.

8
use to construct aggregate governance indicators takes these differences in country
coverage into account as the data from individual sources are transformed into common
units for aggregation across sources. This results in a set of aggregate governance
indicators covering a very large cross-section of countries, ranging from 159 to 173
depending on the measure of governance.
II.3 Aggregation Methodology
Implicit in our organization of the data is the view that, within each cluster, each
of these indicators measures a similar underlying basic concept of governance. Given
this view, there are considerable benefits from combining these related indicators into an
aggregate governance indicator for each cluster. First, the aggregate indicators span a
much larger set of countries than any individual source, permitting comparisons of
governance across a broader set of countries than would be possible using any single
source. Second, aggregate indicators can provide more precise measures of
governance than individual indicators. Third, it is possible to construct quantitative
measures of the precision of both the aggregate governance estimates for each country,
as well as their components. This allows formal testing of hypotheses regarding cross-
country differences in governance. Moreover, in the following section we will use the
information on the precision of the governance indicators to help to identify the effects of
income on governance.
For each of these clusters, we combine the component indicators into an
aggregate governance indicator using the same methodology used to calculate our first
set of indicators, as documented in Kaufmann, Kraay and Zoido-Lobaton (1999a). We
use an unobserved components model which expresses the observed data in each
cluster as a linear function of the unobserved common component of governance, plus a
disturbance term capturing perception errors and/or sampling variation in each indicator.
In particular, we assume that we can write the observed score of country j on indicator k,
y(j,k), as a linear function of unobserved governance, g(j), and a disturbance term, ε(j,k),
as follows:
(2.1) ( )y j k g j j k( , ) (k) (k) ( ) ( , )= + ⋅ +α β ε

9
where α(k) and β(k) are unknown parameters which map unobserved governance g(j)
into the observed data y(j,k). As a choice of units, we assume that g(j) is a random
variable with mean zero and variance one. We assume that the error term has zero
mean and a variance is the same across countries, but differs across indicators, i.e.
[ ] )k()k,j(E 22εσ=ε .
Given estimates of the parameters of the model, α(k), β(k), and σ(k), we can
compute estimates of governance for each country, as well as measures of the precision
of these estimates.5 Formally, the estimate of governance for a country produced by the
unobserved components model is the mean of the distribution of unobserved
governance conditional on the K(j) observed data points for that country. This conditional
mean is the following weighted average of appropriately-rescaled scores of each of the
component indicators:
(2.2) ∑= β
α−⋅=
)j(K
1k )k()k()k,j(y
)k(w))]j(K,j(y),...,1,j(y|)j(g[E
where the weights applied to each source k,
∑=
−ε
−ε
σ+
σ= )j(K
1k
2
2
)k(1
)k()k(w , are inversely
proportional to the variance of the error term of that source. We also report the standard
deviation of this conditional distribution as an indicator of the confidence we can have in
this estimate, which is:
(2.3) 21
)j(K
1k
2)k(1))]j(K,j(y),...,1,j(y|)j(g[SD−
=
−ε
σ+= ∑ .
This standard deviation is declining in the number of individual indicators in which a
particular country appears, and is increasing in the variance of the disturbance term on
each of these indicators.
5 Estimation of this model requires some non-standard techniques to take into account the likely differences in the unobserved distribution of governance across the different samples of countries covered by representative and non-representative sources. These are documented in detail in Kaufmann, Kraay and Zoido-Lobaton (1999a).

10
The assumptions of the unobserved components model ensure that the
distribution of governance in each country is normal, conditional on the data for that
country. Therefore, these conditional means and standard deviations for each country
have a natural interpretation. For example, a useful interpretation of the reported
estimates and standard deviations for each country is to note that there is a 90%
probability that the “true” level of governance in a country is in an interval of plus or
minus 1.64 times the reported standard deviation centered on the point estimate itself.
We refer to such a range as a 90% confidence interval around the estimate of
governance for a country.6
Our choice of units for governance ensures that the estimates of governance
have a mean of zero, a standard deviation of one.7 Moreover, since we adopt the same
choice of units for governance in each period, the indicators are not informative about a
worldwide average trend in governance. However, they are informative about how
countries’ relative positions change over time. The aggregate indicators are oriented
such that higher values correspond to better governance outcomes. Table 3 reports the
point estimates of governance, the estimated standard errors, and the number of
sources by country, for each of six governance indicators, for 2000/01. For reference,
the corresponding information for the 1997/98 indicators are reported as well in the
same table.
As emphasized in our previous work, we find that the six dimensions of
governance are not very precisely measured, in the sense that the measured standard
deviations are large relative to the units in which governance is measured. We illustrate
this point in Figure 2 using the rule of law indicator. We order countries in ascending
order according to their point estimates of governance on the horizontal axis, and on the
vertical axis we plot the estimate of governance and the associated 90% confidence
interval described above. The size of these confidence intervals varies across countries,
as different countries appear in different numbers of sources with different variances. 6 This is a slight abuse of terminology, as these are not confidence intervals in the usual frequentist sense of a stochastically varying interval centered around a fixed unknown parameter. Rather, we treat governance as a random variable, and the 90% confidence interval is simply the 5th and 95th percentiles of the conditional distribution of governance given the observed data. 7 Since the estimates of governance are normally distributed, this implies that the vast majority of observations will fall between –2.5 and 2.5.

11
The resulting confidence intervals are large relative to the units in which governance is
measured. To emphasize this point, the horizontal lines in Figure 2 delineate the
quartiles of the distribution of governance estimates. Relatively few countries have 90%
confidence intervals that lie entirely within a given quartile.
From this figure, it is clear that many of the small differences in estimates of
governance across countries are not likely to be statistically significant. For many
applications, instead of merely observing the point estimates, it is therefore more useful
to focus on the range of possible governance values for each country (as summarized in
the 90% confidence intervals shown in Figure 2). For two countries at opposite ends of
the scale of governance, whose 90% confidence intervals do not overlap, it is clear that
there are in fact significant differences in governance between these two countries. For
pairs of countries that are closer together and whose 90% confidence intervals overlap
(which can also be seen in Figure 2), one should be much more circumspect about the
significance of estimated differences in governance between two such countries. The
same is true for changes over time in the governance indicator. To illustrate this, in
Figure 2, we also plot the 1997/98 estimate for each country as a solid dot. For most
countries, the 90% confidence interval around the 2000/01 score also encompasses the
governance estimate for 1997/98. This emphasizes that many (although not all) of the
changes over time in our governance indicators over this short period of time are unlikely
to be statistically significant at conventional levels.8
III. Causation from Governance to Income and from Income to Governance
In this section, we first present an empirical framework which allows us to identify
causal effects running in both directions between governance and per capita incomes.
There is a rapidly-growing literature which identifies the causation from better
governance to higher per capita incomes. Our contribution here is to propose a strategy
of using non-sample information to identify causation in the opposite direction, from per
capita incomes to governance. When we implement this strategy, we find that it is not
possible to find evidence of positive feedback from higher per capita incomes to better
8 In Kaufmann, Kraay and Zoido-Lobatón (2002) we discuss in more detail the interpretation of changes over time in the governance estimates.

12
governance outcomes, unless very implausible assumptions on this non-sample
information are made.
III.1 Identifying Causal Effects
Several papers have identified the causal effects running from better governance
to higher per capita incomes in the very long run, using instrumental variables
regressions on a cross-section of countries (Hall and Jones (1999), Kaufmann, Kraay
and Zoido-Lobaton (1999b), Acemoglu, Johnson and Robinson (2001), Easterly and
Levine (2002)). Underlying all these papers is the following empirical model:
(3.1) jjj egy +⋅β+α=
(3.2) jjjj vxyg +⋅δ+⋅γ+µ=
(3.3) jj*j wyy +=
(3.4) jj*j ugg +=
Equation (3.1) says that log per capita income (y) depends on governance (g)
and other factors outside this very parsimonious specification, (e). Under the
assumptions that (a) initial incomes in the distant past are not too different across
countries, and (b) governance does not change too much over time so that current
observed levels of governance are a reasonable proxy for their “initial” values, Equation
(3.1) can be interpreted as capturing the effects of governance on growth in the very
long run.
Equation (3.2) says that governance depends on incomes, some other observed
variable (x), and other factors outside the model (v). The dependence of governance on
incomes could be interpreted as reflecting a demand for better formal institutions in
richer and more complex environments. Institutional quality also depends on a variety of
other factors included in x, and as discussed below cross-country variation in such
variables allows us to identify the effects of governance on incomes in Equation (3.1).

13
Finally, Equations (3.3) and (3.4) simply state that observed income (y*) and observed
governance (g*) are noisy measures of actual income and governance, with
measurement error w and u respectively.
To complete the description of the model, we assume that the disturbances have
zero mean, and variances 2iσ , i=e,v,u,w. We also assume that measurement error is
classical in the sense that w and u are uncorrelated with e, v and x. We also assume
that the omitted variables in Equation (3.2) are uncorrelated with x, but may be
correlated with the omitted variables in Equation (3.1), i.e. E[e⋅v]=ρ⋅σe⋅σv . This captures
the possibility that there may be other variables outside the simple model which affect
both governance and per capita incomes. Finally, we assume that the error term in
Equation (3.1) is uncorrelated with x, which allows us to use x as an instrument to
estimate Equation (3.1).
Existing papers have focused primarily on finding the magnitude of the effect of
governance on per capita incomes, i.e. β. This can be done by estimating Equation (3.1)
by instrumental variables, using x as an instrument. The search for good instruments
has led many researchers in the direction of “deep” historical determinants of institutions.
For example, Acemoglu, Johnson and Robinson (2001) use settler mortality in the 18th
and 19th centuries as instruments, arguing that colonial powers had weak incentives to
establish the institutions of good governance in colonies where a permanent European
presence was unlikely to take root. This can be thought of as a more nuanced
interpretation of the simple instruments for colonial origin used by Hall and Jones (1999).
Another strand of the literature has emphasized the importance of natural
resource endowments in determining the development of good institutions (Engerman
and Sokoloff (1997), and a recent empirical implementation is in Easterly and Levine
(2002)). In view of the popularity of such historically-motivated instruments, we will often
use the shorthand of referring to x as “history”. These papers go to considerable lengths
to justify the validity of the assumption that x is a valid instrument in the sense that it is
strongly correlated with governance and is uncorrelated with the error term in Equation
(3.1). We do not repeat their arguments here but simply proceed under the assumption
that this is a valid instrumentation strategy, and refer the reader to these other papers for
details.

14
Our contribution in this section is to focus on Equation (3.2), which tells us about
the feedback from higher incomes to better governance, γ. This is obviously relevant for
policy. For example, should poor countries get a “governance discount” when allocating
aid based in part on the quality of their institutions? Does development itself bring about
improvements in governance without direct interventions to help build institutions? More
crudely, is good governance a “luxury” that only richer countries can afford? Finally,
identifying γ is useful because it allows us to understand the relative importance of
history versus income in determining observed levels of governance today.
In principle, one can estimate Equation (3.2) given a suitable instrument, i.e. a
variable that belongs in (3.1) but not in (3.2). In practice this is hard to do since it is
difficult to think of very convincing instruments for income – i.e. variables that are
correlated with income but have no effects on governance other than through their
effects on income. Instead we adopt the other (but less commonly used) textbook
solution to the problem of identification – the use of non-sample information. As we show
in detail in the appendix, in order to identify the effects of income on governance, i.e. γ in
Equation (3.2), we need to come up with three pieces of non-sample information – the
variance of measurement error in incomes and governance ( 2wσ and 2
uσ ), and the
correlation between the error terms in Equations (3.1) and (3.2), ρ. As we discuss below,
our assumptions about measurement error in per capita incomes will not matter much for
the results. This means that we basically need only to come up with two additional
pieces of information in order to identify the model in Equations (3.1)-(3.4). Our strategy
is to use our estimates of the standard errors associated with the governance indicators
to pin down the measurement error in governance, and then to consider a range of
plausible values for the correlation between the error terms in the two structural
equations. With these two non-sample pieces of information in hand, we have a system
of equations linking the parameters of the model with the observed sample moments in
the data, which we can solve for the remaining parameters of interest.9
9 Both Hall and Jones (1999) and Acemoglu, Johnson and Robinson (2001) use the difference between their OLS and IV estimates to make inferences about the importance of measurement error in governance. Since we have direct estimates of this measurement error, we can go one step further and use this information to estimate the feedback from per capita incomes to governance.

15
In order to develop some intuitions for the role of our assumptions about these
two key parameters, note that all the papers mentioned above find that the instrumented
estimates of the effects of governance on per capita income in Equation (3.1) are larger
than the OLS estimates of the same equation. With some manipulation of Equations
(3.1)-(3.4), one can show that this implies that:
(3.5)
σσ
⋅β⋅γ−⋅β<σσ
⋅ρ+γe
u
e
v )1(
Suppose that there is no measurement error in governance, i.e. 0u =σ and the right-
hand side of (3.5) is zero. Then the only way there can be a positive feedback from
incomes to governance, i.e. 0>γ , is if there are omitted variables in Equations (3.1) and
(3.2) that move income and governance in opposite directions, i.e. ρ<0.
In the absence of such variables, the only other way that there can be positive
feedback from incomes to governance is if there is substantial measurement error in
governance, 0u >σ . In this case, the IV estimates are larger than the OLS estimates
simply because they are eliminating the usual attenuation bias caused by measurement
error in the dependent variable.10 The key question is whether there is “enough”
measurement error in the data in order to allow for the possibility of positive feedback
from per capita incomes to governance, i.e. that γ>0. We investigate this question in the
remainder of this section.
III.2 Results
To implement this exercise, we begin by estimating Equation (3.1). We measure
per capita income using real per capita GDP from Summers and Heston Penn World
Tables Version 5.6, extended into the 1990s using constant local currency growth rates.
We measure governance using the index of rule of law discussed in the previous
section. We focus on this particular dimension of governance for two reasons. First, it
corresponds most closely to the concept of protection of property rights which has been
widely used in this literature. Second, as discussed in the introduction, this is one of the 10 Throughout we assume that the stability condition 1<β⋅γ holds.
16
dimensions of governance for which simple OLS regressions suggest that countries in
Latin America appear to do relatively poorly given their per capita incomes. Since rule of
law is highly correlated with both corruption and government effectiveness, we can view
this one dimension of governance as representative of the broader areas in which the
quality of governance appears relatively poor in LAC. Finally, we note that although it
would be interesting to implement this exercise for all of the dimensions of governance
separately, we are unable to do so without distinct instruments for each one.
Our preferred instrument for governance is the settler mortality measure
introduced by Acemoglu, Johnson and Robinson (2001). Unfortunately, it is available for
only 68 countries. However, empirically it is strongly correlated with both tropical location
(as measured by distance from the equator) and colonial origins (as measured by the
fractions of the population speaking English or a major European language). In order to
expand the size of our sample, we use these last three variables to impute the missing
values of settler mortality for all of the countries for which we have data on per capita
incomes and governance. This results in a sample of 153 countries for which we have
data on y, g, and x. We do however obtain similar results if we restrict attention to the
smaller sample of 68 countries for which the original settler mortality instrument is
available, or if we use the linguistic origins variables directly as instruments, as do Hall
and Jones (1999).
Table 4 reports the OLS and IV estimates of Equation (3.1), together with the
corresponding first-stage regression of governance on the instrument. Consistent with
the existing literature discussed above, we find a strong causal effect running from
governance to per capita incomes. The estimated coefficient of 1.37 implies that a one-
standard deviation improvement in the governance measure raises per capita incomes
nearly four-fold in the very long run. We also find the same phenomenon in the literature
that the instrumented estimate of the coefficient on per capita income is substantially
larger than the OLS estimate of 0.999.11
11 Interestingly, the bivariate scatterplot of rule of law against log per capita incomes visually suggests a nonlinear effect of governance on per capita incomes, with a weaker effect (i.e. a lower slope) in poor countries than in rich countries. While this is qualitatively true, we did not find this nonlinearity to be statistically significant. Moreover, given our pattern of IV estimates that are larger than OLS estimates, and given the weaker performance of the instrument in the first-stage regression for the poorest half of the sample, we can also not discount the possibility that the

17
Figure 3 plots the estimated effects of governance on per capita incomes (in the
top panel) and the first-stage regression (in the bottom panel), with countries in LAC
highlighted in red and labeled. When considering this causal channel from governance
to per capita incomes, the striking feature of countries in LAC is that the majority of them
lie above the instrumented regression line. In fact, we find only six out of 26 countries
below the regression line (Chile, Uruguay, Belize, Costa Rica, Guyana, and the
Dominican Republic). One interpretation of this is that most countries in LAC have been
surprisingly successful in raising living standards without the benefit of good
governance. Yet a less hopeful interpretation is that the (relatively) high income levels
observed in many countries in LAC are inherently fragile because they are unsupported
by sound institutions.12
The bottom panel of Figure 3 illustrates where countries in LAC fall in the first-
stage regression of governance on “history”. Countries in LAC are clustered surprisingly
tightly around the middle of the distribution of (in some cases imputed) settler mortality.
Only four countries stand out as having particularly inhospitable climates for settlers –
Jamaica, Haiti, Panama, and Nicaragua. Moreover, countries in LAC are scattered quite
evenly above and below the first-stage regression line, suggesting that the effect of
history on current institutions is not significantly different in LAC relative to the rest of the
world. Taken together, these two observations suggest that “bad history” alone cannot
account for the relatively low rule of law ratings for countries in LAC that we noted in the
introduction.13
difference in slopes in the two samples is simply driven by the problem of weak instruments (which would bias the IV estimates towards the OLS ones in the poor country sample). 12 This interpretation is consistent with both anecdotal and more systematic evidence that countries that are hit by large adverse shocks suffer disproportionately more if the quality of their institutions is poor. See for example Boone, Breach, Friedman and Johnson (2000) who argue that declines in asset prices during the Asian crisis were larger in countries with weak corporate governance. In light of events of recent years, it is striking for example that both Argentina and Indonesia (not shown) are substantially above the instrumented regression line in 1995, the year to which this graph refers. More systematically, Rodrik (1999) has shown that countries lacking institutions to manage social conflict suffered deeper declines in output in response to the oil shocks of the 1970s. 13 For the region as a whole, this low explanatory power of history as a determinant of misgovernance is plausible, given that these countries already had attained independence almost two centuries ago, and on the whole the colonizers did not exert the same destructive institutional influence as in some other settings (as in some parts of Africa for instance). Poignantly illustrating the limits of history in explaining the quality of governance today are the contrasting cases of

18
We now turn to our estimates of Equation (3.2), which captures the reverse
causation from income to governance, as well as the effects of history on governance.
Our estimates of the parameters of Equation (3.2) depend on our assumptions about the
three additional pieces of non-sample information required to identify this equation. We
find that our results are not very sensitive at all to our assumptions about the variance of
measurement error in per capita incomes. We therefore just assume that σw=0.2 which
implies that a 95% confidence interval for per capita income of a country runs from 50%
to 150% of observed income. Given the difficulties in measuring GDP and purchasing
power parity adjustments, this does not seem to be an implausible estimate of the extent
of measurement error.
In contrast, our estimates of the effects of income on governance depend a great
deal on our assumptions about measurement error in governance, σu, and the
correlation between the error terms in Equations (3.1) and (3.2), ρ. Table 5 presents the
range of estimates of the parameters of Equation (3.2) that we obtain, for a range of
values σu and ρ. In the top panel, we set ρ=0, and consider a range of values of
measurement error in governance. In the bottom panel, we fix the measurement error in
governance and consider a range of values of ρ.
We use the information in the standard errors of the rule of law index described
in the previous section to anchor the range of estimates for measurement error in
governance. In particular, we begin with a value of 27.0u =σ , which is the average
across countries of the standard errors obtained from the unobserved components
model used to construct the aggregate governance indicator. This captures the extent to
which the governance measure is a noisy indicator of the “true” rule of law within a
country. As we have discussed in the previous section, these standard errors are large
relative to the units in which rule of law is measured.
We then consider several higher values up to a maximum of 54.0u =σ , or twice
the initial level. One way to rationalize substantially higher measurement error such as
Argentina and Chile, two countries with historical, cultural and linguistic commonalities that have take such divergent paths in terms of institutional quality.

19
this is to note that good rule of law is just one of many dimensions of good governance
or institutional quality. Thus, the extent to which rule of law is itself an imperfect indicator
of broader notions of good governance that matter for economic growth in the very long
run can also be thought of as measurement error. A rough way to calibrate the
importance of this type of measurement error is to consider at the simple correlations (r)
of the rule of law indicator with the other five dimensions of governance discussed in the
previous section, which range from r = 0.76 (Voice and Accountability) to r = 0.93
(Government Effectiveness), and average r = 0.85 across all governance components.
Under the assumption that each of these indicators is a noisy measure of the broadest
possible concept of good governance, a straightforward calculation shows that uσ
ranges from 0.27 to 0.48.14
For the benchmark level of measurement error of 27.0u =σ (based on the actual
rule of law standard errors)we find a surprisingly large negative effect of income on
governance, with a coefficient of –1.28. To put this figure in perspective, it implies that
an exogenous doubling of per capita incomes in the very long run leads to an estimated
decline in governance of –1.28x0.7 = 0.89 or nearly one standard deviation of the
governance index. Moving across the columns in Table 5, we see that the only way we
can get an estimated positive feedback from per capita incomes to governance is if
measurement error in governance is very high, for values of 5.0u ≥σ . We also find that
the effects of history on current institutions, δ, becomes smaller in absolute value, and
the variance in the error term in Equation (3.2) becomes smaller, as measurement error
in governance becomes larger. The lower panel of Table 5 shows the effects of
assumptions regarding the correlation between the error terms in Equations (3.1) and
(3.2). The larger is this correlation (as it moves from negative to positive values), the
smaller (more negative) is the estimated magnitude of the reverse causation from
14 Suppose that i
*i ugg += , i=1,..,N are N noisy indicators of g, with 0]u[E i = , 2
i2i ]u[E σ= , and
0]uu[E ji =⋅ for all i and j. Then the correlation between any two indicators
is2j
2g
2g
2i
2g
2g
ijrσ+σ
σ⋅
σ+σ
σ= . One minus the minimum and maximum correlation across all pairs i
and j provide upper and lower bounds respectively on the ratio of the variance of measurement
error relative to the variance of the observed variable, 2i
2g
2i
σ+σσ
.

20
income to governance, and the larger (in absolute value) are the effects of history and
the variance of the error term.
The main message from Table 5 is that measurement error in governance needs
to be very large in order to admit the possibility of positive feedback from per capita
incomes to governance. We have already seen the basic intuition for this result in the
discussion of Equation (3.5) above. In the absence of measurement error in governance,
the substantially larger IV estimates of Equation (3.1) relative to the OLS estimates must
reflect the fact that the instrument is either (a) removing negative feedback from per
capita incomes to governance, and/or (b) removing the effect of omitted variables that
are uncorrelated with the instrument but that move governance and per capita incomes
in opposite directions.
Table 5 adds to this basic intuition the quantitative observation that, for all but
very high assumptions regarding measurement error in governance, there is insufficient
attenuation bias in the OLS estimates to rule out negative feedback from per capita
incomes to governance. In fact, the only way we can get positive feedback from per
capita incomes to governance is if we assume that either (a) measurement error in
governance is very large, and/or (b) there are some omitted variables that move
governance and income strongly in opposite directions – and it is hard to think of
plausible candidates for such omitted variables. Otherwise, this very standard empirical
model, together with the data we use, is inconsistent with the notion that there is positive
feedback from per capita incomes to governance.
The estimates of the other two parameters of Equation (3.2) – the effects of
history on governance, and the variance of the residual, also have interesting
interpretations. Note first that the direct effects of history on governance in Equation
(3.2) are smaller the larger we assume measurement error in governance to be. The
reason for this is as follows. We have seen that as measurement error in governance
becomes larger, the estimated feedback from per capita incomes to governance
becomes less negative as well. If this feedback effect were to become positive and
large, better values of the “history” variable only need to have small effects in order to
trigger a very powerful virtuous circle of better governance leading to higher incomes
leading to better governance, etc. Therefore, in order to match the observed correlation

21
between history and per capita incomes today, the coefficient on the history variable in
Equation (3.2) would not need to be very large.
Table 5 also shows that if we assume measurement error in governance to be
very large, the variance of the error term in Equation (3.2) becomes small. This is
because we choose this parameter to match the observed fit of the first-stage regression
of governance on history. If we assume that there is very large measurement error in the
dependent variable (governance) in Equation (3.2), then the only way we can match the
good fit of the first-stage regression is if the variances of the errors in the two structural
equations are small. Thus, if we assume that measurement error in governance is
unrealistically very large, our estimates of Equation (3.2) tell us that most of the variation
in governance is accounted for by only two variables – income and history. In contrast,
for more reasonable values of measurement error in governance, we find that income
and history play a smaller role in understanding cross-country differences in governance.
We illustrate the relative importance of income, history and other factors in
determining institutions more systematically in Figure 4, for the countries in LAC, under
the benchmark assumption that σu=0.27. Consider first the importance of history. We
have already seen in Figure 3 that countries in LAC all fall close to the mean of the world
distribution of the “history” instrument. As a result we find that the contribution of “history”
to deviations between governance in LAC and the rest of the world are small. In
contrast, the effects of income on institutions in LAC is large in absolute value for all
countries. Given our finding of negative feedback, the contribution of income levels to
governance tends to be positive in the poorer countries in LAC, and negative in the
richer countries in LAC. Finally, under the realistic benchmark assumption of the
measurement error in governance, we find a substantial unexplained component of
governance in LAC, which is roughly evenly dispersed between positive and negative
values. This means that the fact that countries in LAC tended to fall below the OLS
regression line of per capita incomes on rule of law (as discussed in the introduction)
should not be necessarily interpreted as evidence that governance in LAC is surprisingly
bad given its income level. In fact, according to this view, once we take into account the
negative effect of incomes on governance, as well as the (small) effects of history,
countries in LAC do not appear to have systematically good or bad governance relative
to the rest of the world.

22
III.3 – Interpreting Negative Feedback from Incomes to Governance
In the remainder of this section we provide some discussion and interpretation of
the rather surprising finding of negative feedback from incomes to governance. The first
point to notice is that the negative or zero feedback result is quite robust, in the sense
that the degree of measurement error required to overturn it is very large indeed. One
way to see this is to notice that if σu is equal to its high-end value of 0.54, this would
imply that the 90% confidence intervals for governance are twice as large as those
shown in Figure 2 (based on actual data). These confidence intervals based on the high-
end value are so large as to make the aggregate rule of law indicator virtually
meaningless. For example, this extent of measurement error implies that rule of law in
Mexico (which ranks near the middle of countries in LAC) is not statistically significantly
different from that in Haiti (the country with the lowest score in LAC), nor is it significantly
different from Chile (the country with the highest score in LAC). Since we do think that
the country rankings in the governance indicators are reasonably informative, we find
this degree of measurement error to be implausibly high.
Even if we take the broader interpretation of measurement error which suggests
that rule of law itself is only a proxy for more general notions of institutional quality, we
would still be forced to the conclusion that the rule of law index we use would have to be
virtually uninformative about cross-country differences in broader conceptions of
governance – a conclusion we find extreme. Finally, it is important to note that if – as is
plausible – there are omitted variables in Equations (3.1) and (3.2) which drive income
and governance in the same direction, then even larger measurement error than the
high-end ones suggested above would be needed in order to find positive feedback from
per capita incomes to governance. Put together, all of this suggests that the extent of
measurement error required to deliver positive feedback from per capita incomes to
governance is implausibly large.
The second point is that our cross-sectional empirical framework in levels of
income and governance is designed to capture the interactions between these variables
in the very long run. This means that our finding of negative feedback does not have a
short-run time-series interpretation along the lines of “rapid growth in country X in the
next 5 years is likely to worsen governance”. Nor does our finding of negative feedback

23
imply a negative unconditional cross-sectional correlation between incomes and
governance. After all, the observed positive cross-sectional correlation between levels of
incomes and governance is dominated by the strong causal effects of governance on
per capita incomes in the very long run. Rather, our finding of negative feedback says
that we should only expect to find a negative partial correlation (controlling for history)
between governance and purely exogenous factors that are associated with higher
income levels in a cross-section of countries.
But this brings us to our third point: it is difficult to observe direct evidence of this
negative feedback in the form of some variable that is positively correlated with incomes
in a cross section of countries, but is negatively correlated with governance. This is
because it is difficult to think of convincing examples of purely exogenous variables that
would affect incomes and growth in the long run but have no direct effects on
governance or institutional quality, so that their correlation with governance would purely
reflect the negative feedback. In fact, were such variables to exist, they would be natural
instruments to use to directly identify the effects of governance on per capita incomes in
Equation (3.2). But as we argued before, convincing instruments for income levels in a
cross-section of countries are scarce, and this is what motivates our indirect approach to
identifying feedback from incomes to governance. It is more likely that variables that
matter for income levels in the long run (such as favorable geographical location,
political stability, enlightened policymaking, etc.) also have direct positive effects on
institutional quality through a variety of mechanisms. As long as these direct effects are
sufficiently large, it will not be possible to observe a negative correlation between these
variables and governance driven by the (more indirect) negative feedback that we have
identified. All of this implies that, while the negative feedback we have identified is quite
robust, it is also difficult to observe directly in the form of a positive cross-sectional
correlation between some variable and income, and a negative correlation between that
same variable and institutional quality.
What then should we make of this finding of negative feedback? We think that
two implications are important. The first is rather obvious: negative feedback implies that
improvements in institutional quality or governance are unlikely to occur merely as a
consequence of economic development. As countries become richer, it is important not
to exaggerate the conventional wisdom that higher incomes lead to demands for better

24
institutional quality. In fact, there are a variety of mechanisms through which just the
opposite might occur. As long as established elites within a country reap private benefits
from the status quo of poor institutions, there is little reason to expect that higher
incomes will lead to demands for better governance. The phenomena of “crony
capitalism” in East Asia, and of “state capture” in transition economies (discussed further
below) provide vivid examples of conflict between the interests of the elite and the need
for better institutional quality.
Second, negative feedback means that we should not expect to see “virtuous
circles” from higher incomes to better institutions which in turn support higher incomes in
the very long run. This means that “small” interventions to improve institutional quality
are unlikely to be enough to make a major difference in the long run. Together, these
two implications point to the urgency of steps to improve governance in countries where
it is weak. But cross-country analysis such as this provides little guidance as to how this
should be done. In the last section of this paper, we draw on experience with
governance diagnostics within selected countries in LAC to illustrate fronts upon which
progress can be made.
IV. Improving Governance.
The first result of this paper that governance matters significantly for growth in
the very long run is not new and validates earlier such findings. The second result
suggests that governance improvements will not take place automatically as the
development process unfolds. The combination of both key results suggests that
interventions to improve governance are warranted. But these results of Equations (3.1)
and (3.2) in themselves are not very informative for policy-makers intent on formulating
and implementing specific strategies to improve governance in their countries. Indeed,
the second result of this paper that there is no positive causal effect from higher incomes
to improved governance is new, points to the importance of active interventions. In this
section we discuss how detailed country diagnostic surveys have helped to identify
specific priorities for action in countries in LAC. We also discuss how these surveys cast
light on the causes and consequences of the capture of the institutions of the state by
powerful elites, which provides an illustration of one possible mechanism through which
negative feedback might occur.
25
V.1 Governance Diagnostics
During the late nineties, the World Bank has developed empirical tools to assess
governance as an input to action programs, while at the same time generating data for
research purposes. These Governance and Anticorruption diagnostics consist of in-
depth, country-specific surveys of thousands of public service users, firms, and public
officials, in order to gather specific information about institutional vulnerabilities within a
country. These separate surveys of users of public services, firms and public officials
permit triangulation and consistency checks for the results, while probing into a broader
array of governance issues given the different units of observation. This specially
designed surveys utilize experience-based (rather than ‘opinions’/generic) type of
questions, thereby reducing the element of perceptive subjectivity, and are designed
following a broad governance and service delivery conceptual framework. Further, there
are rigorous technical specifications for carrying out the field work and the subsequent
analysis. So far, these surveys have been applied to over two dozen countries.15
In complementing the insights that can be gathered from composite governance
indicators (as presented in earlier sections) in-depth diagnostics can help provide
specific inputs for action programs at the country level by: i) unbundling governance and
corruption into more detailed and specific dimensions, and through their measurement
assessing the relative importance and prevalence of the various unbundled dimensions;
ii) assessing the quality of governance and performance of the key institutions and
agencies in the country; iii) assessing the relative importance of the costs and
consequences of various forms of misgovernance (such as through the link to poverty,
quality and extent of service delivery, etc.); iv) identifying the most important factors
affecting governance and performance (e.g. external vs. internal accountability
mechanisms, as well as issues of undue influence by the elite and state capture), and, v)
identifying priorities for action (based on the above items). In fact, a salient feature of the
15 For details on governance diagnostic instruments and country reports, visit http://www.worldbank.org/wbi/governance/tools.htm.

26
diagnostic results so far is the large variance in governance performance across
institutions within a country, as well as the large cross-country variation for the same
institution or governance dimension – even for countries which based on composite
governance indicators score similarly to each other. These findings support the rationale
of complementing the basic cross-country aggregate governance indicators with these
specific country diagnostics. Further, as we see below, the diagnostics help in providing
empirical pointers towards state capture (and undue influence of the elite) as possible
explanation for the negative reverse link from growth to governance.
An expanded variant of these in-country diagnostics are multi-country surveys of
enterprises; one such enterprise survey, the Global Competitiveness Survey (GCS),
unbundles governance and corruption, inter alia pointing to the challenge of probity in
the institutions of rule of law in LAC. As suggested in the sample of countries from the
GCS in Figure 5 , the challenge of corruption in the judiciary is even more daunting than
in public administration (or bureaucracy) in the LAC region -- in contrast with other
countries and regions, where the challenge of corruption in public administration is more
dire. This complements our emphasis on the aggregate measure of rule of law earlier in
the paper.
The large differences in the performance of the same institution across countries
is also clear from the results of the diagnostic studies, and can be illustrated by the
different relative probity and institutional quality of parliaments in the LAC region (and
others). In the surveyed countries (such as Colombia, Ecuador and others) they tend to
be rated much lower than other institutions (in contrast with a country like Cambodia for
instance, where it was rated as the best institution relative to the others). By identifying
good performers versus misgoverned institutions within a country these surveys assist in
identifying the factors behind such variance in performance across institutions within a
country and also suggest institutional priorities for action.
V.2 State Capture
In this paper’s earlier sections, we first backstopped previous findings that
governance matters significantly for growth (Equation (3.1)). Yet in studying the reverse
27
link (Equation (3.2)) we found no support for an automatic (or necessary) positive link
from higher incomes to improved governance – in fact the contrary was found to be
more likely. This begs an explanation. In this first exploration of this reverse link from
higher incomes to governance we will not advance a definitive answer for this seemingly
surprising finding. Instead we present a plausible yet admittedly initial and speculative
framework based on insights from these in-depth diagnostic surveys carried out in many
countries. These diagnostic surveys have permitted to build an understanding on some
important forces shaping misgovernance and corruption.
In particular, if the fruits of income growth largely accrue to an elite which
benefits from misgovernance and growing perverse vested interests and influence in
policy-making, then the otherwise possible positive impact of income growth on
governance (via provision of more public goods and improved public sector
management) could be negated by the effect of the elite’s negative influence. Recent in-
depth enterprise surveys provide evidence on the prevalence of state capture by elite
interests. Specifically, we build on recent research based on countries in transition,
which found that in many countries surveyed there was a high level of state capture,
defined as the undue and illicit influence of the elite in shaping the laws, policies and
regulations of the state. While nowadays there are countries where the extent of state
capture is likely to be relatively low, from an historical perspective it is evident that many
such countries did go through periods experiencing such monopolistic and often illicit
influence by the elite in its past; the influence of the “robber barons” in the United States
at the turn of the 20th century is one such illustration.
The exploratory nature of state capture as a possible hypothesis in explaining
how income growth may not be automatically converted into improved governance
argues for further research into this issue. As data becomes available in the future for a
large number of countries regarding the degree of capture by elite interests, it will be
possible to put this preliminary hypothesis through further empirical tests.
A recent specialized enterprise survey carried out in 24 post-socialist economies
in transition (BEEPS)16 provides insights on the phenomenon of “state capture”. State
16 The Business Environment and Enterprise Performance Survey (BEEPS), developed jointly by the World Bank and the EBRD, is a survey of over 4000 firms in 24 transition countries carried

28
capture is defined as illegal payments by vested interests (such as “oligarchs” or
“cronies”) in order to shape the laws, regulations and policies of the state to their narrow
interests. In its emphasis on the formulation and shaping of laws and regulations of the
state, state capture departs from the conventional view of corruption which stresses
bribery to influence the implementation of such laws and regulations.17 This survey
measured state capture by asking firms about prevalence of purchase of laws, decrees
and regulations and about the impact of the purchase of such policies, laws and
regulations by other firms on their own enterprise. In other words, the survey measured
not only the conventional types of bureaucratic/administrative corruption related to the
implementation of the laws and regulations, but also the undue and illegal influence in
shaping such laws and regulations. As stated, the results from the BEEPS survey,
carried out in late 1999, indicate that there is a high prevalence of State Capture in
transition Figure 6 illustrates the large extent of such capture in Russia and Ukraine.
The research findings indicate that ‘captor firms’ (which engage in illicit activities
to shape the state laws and regulations) do in fact derive very large benefits from such
strategies, exhibiting much higher output and investment growth than their non-captor
counterparts, controlling for other factors (Figure 7). Yet while the captor firms benefit in
terms of growth from their private purchase of law and order, the public provision of rule
of law is further undermined by these capture strategies. Indeed, the econometric
evidence suggests that public protection of property rights for the overall enterprise
sector deteriorates (Figure 8). This evidence suggests a pattern in which the enormous
gains from capture provides an insidious built-in incentive for persistence of such
capture, and at the same time the growing economic might of such powerful captors
supports increasing degrees of capture and thus of continuing and deteriorating
misgovernance.
out in late 1999-2000 that examines a wide range of interactions between firms and the state. Based on face-to-face interviews with firm managers and owners, BEEPS was designed to generate comparative measurements inter alia on corruption, state capture, lobbying, rule of law, and the quality of the business environment, which was then related via statistical analysis to specific firm characteristics and firm performance. For details, visit http://info.worldbank.org/governance/beeps/. 17 The analytical and empirical distinctions between these different forms of corruption and abuse of rule of law further suggests that unbundling the notions of corruption and governance is key for policy analysis and policy advise. For details on the research on State Capture, see Hellman, Jones and Kaufmann (2001), or visit http://www.worldbank.org/wbi/governance/wp-statecapture.htm.

29
An in-depth empirical investigation of the phenomenon of state capture for the
Latin America region has yet to take place, and is part of the upcoming research
agenda. Thus, at this stage the empirical evidence is of a select and preliminary nature,
and derived from the recent country governance diagnostics in a small number of
countries in the region. The results of these diagnostics do suggest however that the
challenge of state capture is also present in LAC. In particular, the emerging results from
diagnostics in Peru, Colombia and Honduras point to capture by influential forces
outside the state as a major governance challenge. Figure 9 illustrates the
manifestations of state capture for Peru and Colombia, based on the responses from
public officials (similar results arose from the responses from enterprises, not shown).
Indeed, both enterprises and public officials consistently point to the large extent of
capture of legal and judiciary institutions (in contrast with other institutions), while Figure
10 illustrates the type of vested interest forces behind such state capture for the case of
Peru.
Based on the results from transition economies, as well as incipient evidence
from some countries in LAC, we thus speculate as to the role of capture in explaining the
growth-without-governance puzzle: the causal link from income growth to governance is
inter alia mediated by the structure of the institution of influence in society. Specifically,
to the extent that state capture is important, the large increase in incomes will be
appropriated by the monopolistic captors, and translated into additional demand for
private ‘purchase’ of laws and regulations for their growth benefit. This in turn may
further increase the extent of capture, undue influence and cronyism, eroding
governance.
This increasing demand for capture in settings that are growing may be furthered
abetted by the fact that the ‘a la carte’ supply offer of laws, regulations and policies by
politicians to the captors is less likely to be subject to checks and balances in a growing
environment. This is because the ‘governance complacency’ (or ‘Suharto’) effect in a
growing environment, when internal and external pressures to improve governance will
be laxer. While Indonesia may have particularly exemplified this phenomenon during the
eighties and much of the nineties, it is not alone. Argentina is another extreme illustration
during much of the nineties, while Mexico has been a more nuanced example during the

30
previous ‘captured’ political era of crony capitalism. Russia during different historical
periods offers another example.
V.3 Implications for Reform
At a general level of strategy design, the empirical analysis of the governance
diagnostics provide important country-specific inputs for action and reform. In many
countries various forms of corruption as well as the particularly non-transparent
institutions are identified as priorities for change in the first phase of a governance
enhancing program. The empirical evidence linking absence of rule of law and corruption
in key institutions with poverty (and lack of access by the lower income strata to public
services) backstops giving priority to addressing misgovernance in such dimensions and
institutions (which in some countries may be customs and the police, while in others the
focus may be in the judiciary and energy sectors, for instance).
More specifically, given the prominence we ascribe to state capture and related
forms of influence by the elite in providing a plausible explanation of why growth may not
translate into improved governance, then strategies to improve governance and combat
corruption ought to specifically address such undue influence and capture. This implies a
strategy departing from conventional public sector reform which typically focuses on
internal functioning within government. Indeed, the research on state capture for
transition economies, as well as analysis of diagnostics in some LAC countries, point to
the importance of voice and external accountability mechanisms, political contestability,
and transparency reforms (including media freedom, disclosure of votes by
parliamentarians, declaration of assets by politicians, regular monitoring surveys/report
cards, etc.). In fact, the survey results from transition pointed to the importance of
alternative (and more competitive) modes of exerting voice, external accountability, and
legal-competitive influence, such as business associations.18 As seen in Figure 11 (a-c)
based on the analysis of a governance diagnostic survey for Bolivia, the in-depth country
diagnostics also provide support for pro-transparency (measuring the transparent flow of
information – including on budgets – within each institution) as well as of external
feedback/voice mechanisms in improving governance (measuring the existence of user 18 While involvement by NGOs and related civil society segments has become more prominent in recent years as agents to improve governance, the role of the competitive private sector (including associations of traders, exporters and small and medium enterprises) has been under-emphasized.

31
feedback mechanisms and the ability of the public agency to respond to such feedback)
-- while in contrast casting doubt on conventional recipes such as increasing wages or
changing internal rules or laws within public institutions. Indeed, it is reasonable to
observe that competitive voice, feedback and transparency innovations may have a
larger impact on improving governance if capture or undue influence by the elite on the
politicians and public sector is prevalent, than narrowly focused reforms in rules or
wages within public institutions alone.
In sum, strategies to improve governance in LAC are of some urgency, given that
much of the region is currently facing a governance crisis, thereby exposing the fragility
of its growth path. Furthermore, as this paper’s empirical model has suggested, growth
per se will not automatically translate into improved governance; instead discrete
interventions are required, and persistently so given the absence of virtuous circles. And
to design governance and institutional reform strategies it is important to localize know-
how, for which the in-country governance diagnostic tools can be of help in defining
specific priorities. We posit that understanding the political and economic forces shaping
policy- and law-making (which will vary from setting to setting) is key to the identification
of realistic and country-relevant strategic priorities. Where state capture prevails, the
‘governance quality’ of the growth dividend may be rather low and the vulnerability of
sustained growth prospects is thus high, necessitating specific strategies to address
such capture. Such strategies will have to depart from an overly narrow focus on
traditional improvements in the rules within public sector institutions and instead will
need to focus on promoting mechanisms of external accountability, voice and
transparency.

32
References
Acemoglu, Daron, Simon Johnson, and James A. Robinson (2001). “The Colonial
Origins of Comparative Development: An Empirical Investigation”. American Economic Review.
Aslund, Anders, Peter Boone and Simon Johnson (2001). “Escaping the Under-Reform
Trap.” IMF Staff Papers, Washington, D.C. Boone, Peter, Alasdair Breach, Eric Friedman and Simon Johnson (2000). “Corporate
Governance in the East Asian Financial Crisis”. Journal of Financial Economics. Easterly, William and Ross Levine (2002). “Tropics, Germs, and Crops: How
Endowments Influence Economic Development”. Paper Prepared for the Carnegie Rochester Conference on Public Policy.
Engerman, Stanley and Kenneth Sokoloff (1997). “Factor Endowments, Institutions, and
Differential Paths of Growth Among New World Economics: A View from Economic Historians of the United States”, in Stephen Haber, ed. “How Latin America Fell Behind: Essays on the Economic Histories of Brazil and Mexico 1800-1914”. Stanford, Stanford University Press.
Grossman, Gene and Elhanan Helpman (1994). “Protection for Sale”. American
Economic Review 84: 833-850. Hall, Robert E. and Charles Jones (1999). “Why Do Some Countries Produce So Much
More Output per Worker than Others?” Quarterly Journal of Economics 114(1): 83-116.
Hellman, Joel, Geraint Jones and Mark Schankerman (2000). “Measuring Governance,
Corruption, and State Capture: How Firms and Bureaucrats Shape the Business Environment in Transition Economies” World Bank Policy Research Working Paper 2312, Washington D. C. http://www.worldbank.org/wbi/governance/pubs/measuregov.htm.
Hellman, Joel, Geraint Jones and Daniel Kaufmann (2001). “Seize the State, Seize the
Day: State Capture, Corruption and Influence in Transition”. World Bank Policy Research Working Paper 2444, Washington. D.C. http://www.worldbank.org/wbi/governance/pubs/seizestate.htm.
Kaufmann, Daniel and Shang-jin Wei (1999). “Does ‘Grease Money’ Speed Up the
Wheels of Commerce?”. NBER Working Paper No. 7093. http://www.worldbank.org/wbi/governance/pubs/greasemoney.htm.
Kaufmann, Daniel, Aart Kraay and Pablo Zoido-Lobatón (1999). “Aggregating
Governance Indicators”. World Bank Policy Research Department Working Paper No. 2195, Washington, D.C. http://www.worldbank.org/wbi/governance/pubs/aggindicators.htm

33
Kaufmann, Daniel, Aart Kraay and Pablo Zoido-Lobatón (1999). “Governance Matters”. World Bank Policy Research Department Working Paper No. 2196, Washington, D.C. http://www.worldbank.org/wbi/governance/pubs/govmatters.htm
Kaufmann, Daniel, Aart Kraay and Pablo Zoido-Lobatón (2002). “Governance Matters II
– Updated Indicators for 2000/01”. World Bank Policy Research Department Working Paper No. 2772, Washington, D.C. http://www.worldbank.org/wbi/governance/pubs/govmatters2001.htm
Kaufmann, D., G. Mehrez, and T. Gurgur (2002): "Voice or Public Sector Management?:
An Empirical Investigation of the Determinants of Public Sector Performance Based on a Survey of Public Officials in Bolivia", World Bank Institute, draft.
Lora, Eduardo. 2000. “What Makes Reforms Likely? Timing and Sequencing of
Structural Reforms in Latin America”. Inter-American Development Bank Working Paper #424.
Rodrik, Dani (1999). “Where Did All the Growth Go? External Shocks, Social Conflict,
and Growth Collapses”. Journal of Economic Growth 4(4):385-412. World Bank Institute ‘Governance and Anticorruption (GAC) Diagnostics’, various
countries and years. http://www.worldbank.org/wbi/governance/tools.htm.

34
Appendix – Details of Identification Procedure
The reduced-form of the system (3.1) and (3.2) in terms of observables is:
(A1) ( ) ( ) jjjj1*
j uvex1g ++⋅γ+⋅δ+α⋅γ+µ⋅β⋅γ−= −
(A2) ( ) ( ) jjjj1*
j wvex1y +⋅β++⋅δ⋅β+µ⋅β+α⋅β⋅γ−= − and Equation (3.1) in terms of observables is: (A3) jjj
*j
*j wuegy +⋅β−+⋅β+α=
The model in Equations (3.1)-(3.4) has 10 unknown parameters (α, β, µ, γ, δ, ρ,
2eσ , 2
vσ , 2uσ , and 2
wσ ). In the data we have 7 independent pieces of sample information. These are the estimated intercepts, slopes and variances of the residuals of the first- and second-stage regressions that deliver the two-stage least squares estimates of the effects of governance on income in Equation (1), and in addition the estimated OLS slope coefficient from a regression of per capita income on governance.
As discussed in the text, we augment this sample information with three assumptions which pin down the values of 2
uσ (the variance of the measurement error in
governance), 2wσ (the variance of the measurement error in log per capita GDP), and ρ
(the correlation between the error terms in Equations (3.1) and (3.2)). We assume throughout that the stability condition ( ) 01 >β⋅γ− holds. Note that this places an upper
bound on the amount of feedback from per capita incomes to governance, i.e. β
<γ1
With these three assumptions in hand, we solve the remaining 7 equations linking the 7 pieces of sample information with the 7 remaining parameters as follows. The intercept and slope from the second-stage regression give us estimates of α and β. From Equation (A3), the variance of the residuals in the second-stage regression is
2w
2u
22e σ+σ⋅β+σ , which gives us an estimate of 2
eσ . Note that the restriction that 0e >σ places an upper bound on our assumptions regarding the variance of measurement error in per capita incomes and governance.
Finally, we (numerically) solve the following three equations for δ, γ, and 2vσ :
(A4) β⋅γ−
δ=π
1ˆ 1
(A5) 2u
2vve
2e
222 1
2ˆ σ+
β⋅γ−σ+σ⋅σ⋅ρ⋅γ⋅+σ⋅γ
=σ

35
(A6) 2u
2ve
2v
2e
22x
2ve
2v
2e
2x
2
OLS)1(2
)1(ˆσ⋅β⋅γ−+σ⋅σ⋅ρ⋅γ⋅+σ+σ⋅γ+σ⋅δ
σ⋅σ⋅ρ⋅β⋅γ++σ⋅β+σ⋅γ+σ⋅β⋅δ=β
where 1π̂ and 2
2σ̂ denote the slope coefficient and estimated variance of the residuals in
the first-stage regression of governance on the instrument x; OLSβ̂ denotes the slope
coefficient from and OLS regression of log per capita GDP on governance; and 2xσ is
just the variance of the instrument, x, which we estimate directly from the data. Finally, with these estimates in hand we obtain µ from the estimated intercept in the first-stage
regression, β⋅γ−α⋅γ+µ
=π1
ˆ 0 .

36
Table 1 – Governance and Per Capita Incomes in LAC
Position Relative to OLS Regression Line:
Below Above P-valueVoice and Accountability 8 18 0.05Political Stability 11 15 0.43Government Effectiveness 19 7 0.02Regulatory Quality 10 16 0.24Rule of Law 20 6 0.01Control of Corruption 20 6 0.01

37
Table 2: Sources of Governance Data, 2000/01
Country Repre- New in
Source Publication Code Type Coverage sentative 2000/01
Business Environment Risk Intelligence Business Risk Service BRI Poll 50Columbia University State Capacity Project CUD Poll 109 x xEconomist Intelligence Unit Country Risk Service EIU Poll 115 xEuropean Bank for Reconstruction and Redevelopment Transition Report EBR Poll 26Freedom House Nations in Transition FHT Poll 27Freedom House Freedom in the World FRH Poll 192 xGallup International Gallup Millennium Survey GMS Survey 60Heritage Foundation/Wallstreet Journal Economic Freedom Index HWJ Poll 161 xInstitute for Management and Development World Competitiveness Yearbook WCY Survey 49Latinobarometro Latinobarometro Surveys LBO Survey 17 xPolitical Economic Risk Consultancy Asia Intelligence PRC Survey 14Political Risk Services International Country Risk Guide PRS Poll 140 xPriceWaterhouseCoopers Opacity Index PWC Survey 35 xStandard and Poor's DRI McGraw-Hill Country Risk Review DRI Poll 111 xWorld Bank Business Enterprise Environment Survey BPS Survey 18 xWorld Bank World Business Environment Survey WBS Survey 81 xWorld Economic Forum Global Competitiveness Report GCS Survey 75

38
Table 3: Estimates of Governance
Voice and Accountability Political Stability Government Effectiveness2000/01 1997/98 2000/01 1997/98 2000/01 1997/98
Est. S.E. N Est. S.E. N Est. S.E. N Est. S.E. N Est. S.E. N Est. S.E. N
AFG AFGHANISTAN -1.64 0.39 1 -1.62 0.36 1 -2.06 0.49 1 .. .. .. -1.23 0.43 1 .. .. ..ALB ALBANIA 0.01 0.17 5 -0.13 0.21 4 -0.60 0.37 4 -1.00 0.25 4 -0.89 0.25 5 -0.65 0.29 4DZA ALGERIA -1.19 0.24 4 -1.31 0.25 3 -1.27 0.28 4 -2.42 0.30 3 -0.81 0.24 4 -1.09 0.32 3AGO ANGOLA -1.26 0.24 4 -1.00 0.25 3 -1.98 0.28 4 -1.78 0.28 4 -1.31 0.24 4 -1.39 0.24 5ARG ARGENTINA 0.57 0.23 7 0.49 0.25 4 0.55 0.22 9 0.51 0.26 5 0.18 0.18 10 0.26 0.25 6ARM ARMENIA -0.22 0.17 5 -0.18 0.21 4 -0.84 0.41 4 -0.45 0.25 4 -1.03 0.27 5 -0.65 0.29 4AUS AUSTRALIA 1.70 0.24 5 1.63 0.25 4 1.26 0.23 7 1.18 0.26 5 1.58 0.19 7 1.46 0.25 6AUT AUSTRIA 1.34 0.24 5 1.45 0.25 5 1.27 0.23 7 1.38 0.25 6 1.51 0.20 7 1.22 0.23 7AZE AZERBAIJAN -0.70 0.16 6 -0.81 0.19 5 -0.70 0.27 5 -0.36 0.23 5 -0.95 0.21 6 -0.83 0.24 5BHS BAHAMAS 1.15 0.28 2 1.13 0.29 2 0.68 0.65 1 0.37 0.41 1 1.04 0.53 1 0.47 0.77 1BHR BAHRAIN -0.96 0.24 4 -1.04 0.25 3 -0.04 0.28 4 -0.08 0.30 3 0.62 0.24 4 0.24 0.32 3BGD BANGLADESH -0.20 0.24 5 -0.01 0.25 3 -0.57 0.27 5 -0.40 0.30 3 -0.54 0.23 5 -0.56 0.32 3BRB BARBADOS 1.27 0.39 1 1.49 0.36 1 .. .. .. .. .. . . .. .. . . .. . . ..BLR BELARUS -1.04 0.17 5 -0.78 0.21 4 0.04 0.37 5 -0.37 0.25 4 -0.99 0.25 6 -0.66 0.29 4BEL BELGIUM 1.24 0.24 5 1.41 0.25 4 0.87 0.23 7 0.82 0.26 5 1.29 0.20 7 0.88 0.25 6BLZ BELIZE 1.01 0.39 2 1.23 0.36 1 0.32 0.90 1 .. .. .. 0.55 0.70 1 .. .. ..BEN BENIN 0.47 0.36 2 0.69 0.35 2 -0.72 0.63 1 -0.94 0.66 1 0.12 0.52 1 -0.07 0.56 1BTN BHUTAN -1.27 0.39 1 -1.25 0.36 1 .. .. .. .. .. . . .. .. . . .. . . ..BOL BOLIVIA 0.27 0.24 5 0.39 0.25 4 -0.61 0.28 6 -0.14 0.28 4 -0.47 0.22 6 -0.22 0.26 5BIH BOSNIA-HERZEGOVINA -0.29 0.19 4 -1.00 0.23 2 -0.01 0.84 2 -1.16 0.39 1 -0.92 0.39 3 -1.11 0.41 1BWA BOTSWANA 0.80 0.24 5 0.78 0.25 3 0.71 0.27 5 0.74 0.28 4 0.83 0.23 5 0.22 0.26 4BRA BRAZIL 0.53 0.24 6 0.58 0.25 5 0.47 0.22 8 -0.32 0.25 6 -0.27 0.18 9 -0.22 0.23 7BRN BRUNEI -0.93 0.28 2 -0.92 0.29 2 0.86 0.65 1 1.32 0.41 1 0.88 0.53 1 0.01 0.77 1BGR BULGARIA 0.59 0.16 7 0.47 0.19 5 0.37 0.26 7 0.43 0.23 5 -0.26 0.19 8 -0.81 0.24 5BFA BURKINA FASO -0.26 0.27 3 -0.21 0.29 2 -0.54 0.51 2 -0.52 0.36 2 -0.02 0.40 2 -0.06 0.32 3BDI BURUNDI -1.35 0.36 2 -1.29 0.36 1 -1.54 0.54 2 .. .. .. -1.14 0.37 2 .. .. ..KHM CAMBODIA -0.77 0.39 2 -0.91 0.36 1 -0.13 0.90 1 .. .. .. 0.34 0.70 1 .. .. ..CMR CAMEROON -0.82 0.24 5 -0.70 0.25 4 -0.13 0.29 5 -0.72 0.27 5 -0.40 0.25 5 -0.64 0.24 5CAN CANADA 1.33 0.23 7 1.39 0.25 5 1.24 0.22 9 1.03 0.25 6 1.71 0.19 9 1.72 0.23 7CPV CAPE VERDE 0.92 0.39 1 0.99 0.36 1 .. .. .. .. .. . . .. .. . . .. . . ..CAF CENTRAL AFRICAN REPUBLIC -0.59 0.39 1 -0.05 0.36 1 .. .. .. .. .. . . .. .. . . -0.75 0.51 1TCD CHAD -0.88 0.39 1 -0.85 0.35 2 .. .. .. -0.74 0.66 1 .. .. .. -0.71 0.56 1CHL CHILE 0.63 0.23 7 0.62 0.25 4 0.87 0.22 9 0.45 0.26 5 1.13 0.18 10 1.17 0.25 6CHN CHINA -1.11 0.24 6 -1.29 0.25 5 0.39 0.22 8 0.48 0.26 5 0.14 0.18 9 0.02 0.25 6COL COLOMBIA -0.41 0.23 7 -0.15 0.25 5 -1.36 0.22 9 -1.29 0.25 6 -0.38 0.18 10 -0.06 0.23 7COM COMOROS -0.35 0.39 1 0.06 0.36 1 .. .. .. .. .. . . .. .. . . .. . . ..COG CONGO -1.38 0.27 3 -0.77 0.29 3 -1.36 0.51 2 -1.83 0.37 2 -1.58 0.40 2 -0.58 0.39 3CRI COSTA RICA 1.37 0.24 5 1.35 0.25 4 1.08 0.26 6 0.91 0.27 5 0.74 0.21 6 0.55 0.29 4CIV IVORY COAST -1.19 0.25 4 -0.57 0.25 4 -0.95 0.29 4 -0.14 0.27 5 -0.81 0.25 4 -0.18 0.24 5HRV CROATIA 0.48 0.16 6 -0.23 0.19 4 0.18 0.29 5 0.41 0.24 4 0.10 0.22 6 0.15 0.26 4CUB CUBA -1.49 0.25 3 -1.46 0.25 3 0.07 0.28 4 0.19 0.30 3 -0.22 0.24 4 -0.50 0.32 3CYP CYPRUS 1.28 0.25 3 1.11 0.25 3 0.48 0.29 3 0.38 0.30 3 0.91 0.26 3 1.04 0.32 3CZE CZECH REPUBLIC 1.04 0.16 7 1.20 0.19 6 0.74 0.23 8 0.81 0.22 7 0.58 0.18 10 0.59 0.21 8DNK DENMARK 1.60 0.23 6 1.63 0.25 4 1.34 0.23 8 1.29 0.26 5 1.62 0.19 8 1.72 0.25 6DJI DJIBOUTI -0.44 0.39 1 -0.60 0.36 1 .. .. .. .. .. . . .. .. . . .. . . ..DOM DOMINICAN REPUBLIC 0.42 0.24 5 -0.08 0.25 3 0.46 0.28 6 0.12 0.34 2 -0.24 0.22 6 -0.83 0.37 2ECU ECUADOR -0.14 0.24 5 0.27 0.25 4 -0.80 0.25 7 -0.47 0.26 5 -0.94 0.20 8 -0.56 0.27 5EGY EGYPT -0.65 0.24 5 -0.67 0.25 3 0.21 0.24 7 -0.07 0.25 6 0.27 0.19 8 -0.14 0.22 6SLV EL SALVADOR 0.21 0.24 5 -0.10 0.25 3 0.62 0.30 5 -0.02 0.32 3 -0.25 0.23 5 -0.26 0.37 2GNQ EQUATORIAL GUINEA -1.30 0.39 1 -1.39 0.36 1 .. .. .. .. .. . . .. .. . . .. . . ..ERI ERITREA -1.04 0.36 2 -0.59 0.36 1 -0.38 0.63 1 .. .. .. .. .. . . .. . . ..EST ESTONIA 0.94 0.16 8 0.86 0.19 5 0.73 0.24 8 0.79 0.23 5 0.86 0.18 9 0.26 0.24 5ETH ETHIOPIA -0.85 0.27 4 -0.50 0.29 2 -0.55 0.49 3 0.14 0.36 2 -1.01 0.37 3 -0.15 0.32 3FJI FIJI 0.05 0.36 2 0.01 0.35 2 0.39 0.63 1 0.01 0.66 1 0.38 0.52 1 0.63 0.56 1FIN FINLAND 1.69 0.23 6 1.63 0.25 4 1.61 0.23 8 1.51 0.26 5 1.67 0.19 8 1.63 0.25 6FRA FRANCE 1.11 0.23 7 1.15 0.25 5 1.04 0.22 9 0.65 0.25 6 1.24 0.19 8 1.28 0.23 7GAB GABON -0.40 0.24 4 -0.31 0.25 3 -0.44 0.28 4 -0.56 0.34 2 -0.45 0.24 4 -1.13 0.37 2GMB GAMBIA -0.73 0.28 2 -0.97 0.29 2 0.49 0.65 1 0.56 0.41 1 0.41 0.53 1 0.16 0.77 1GEO GEORGIA -0.07 0.19 5 -0.25 0.23 3 -1.00 0.41 4 -0.76 0.31 3 -0.72 0.27 5 -0.51 0.30 3DEU GERMANY 1.42 0.23 7 1.46 0.25 5 1.21 0.22 9 1.32 0.25 6 1.67 0.19 8 1.41 0.23 7GHA GHANA 0.02 0.24 5 -0.43 0.25 4 -0.11 0.29 5 -0.10 0.27 5 -0.06 0.25 5 -0.29 0.22 6 Note: “Est” refers to the point estimate of governance. “S.E.” refers to the standard error. “N” refers to the number of sources in which the country appears. Governance indicators are oriented so that higher values correspond to better outcomes, on a scale from –2.5 to 2.5. These ratings are based on subjective assessments from a variety of sources, are subject to substantial margins of error as indicated, and in no way reflect the official view of the World Bank, its Executive Directors, or the countries they represent.

39
Table 3: Estimates of Governance, Cont’d
Voice and Accountability Political Stability Government Effectiveness2000/01 1997/98 2000/01 1997/98 2000/01 1997/98
Est. S.E. N Est. S.E. N Est. S.E. N Est. S.E. N Est. S.E. N Est. S.E. N
GRC GREECE 1.12 0.24 4 1.05 0.25 4 0.79 0.24 6 0.21 0.26 5 0.65 0.20 7 0.56 0.25 6GTM GUATEMALA -0.33 0.24 5 -0.56 0.25 3 -0.77 0.30 5 -0.75 0.32 3 -0.63 0.22 6 -0.23 0.37 2GIN GUINEA -0.98 0.28 2 -0.87 0.29 3 -0.99 0.65 1 -1.03 0.37 2 0.41 0.53 1 -0.03 0.51 2GNB GUINEA-BISSAU -0.87 0.27 3 -0.45 0.29 3 -1.21 0.51 2 -1.20 0.37 2 -1.48 0.40 2 -0.33 0.51 2GUY GUYANA 0.94 0.27 3 1.01 0.29 2 -0.70 0.51 2 -0.20 0.41 1 0.02 0.40 2 0.01 0.77 1HTI HAITI -0.80 0.27 4 -0.71 0.29 2 -0.38 0.49 3 -1.71 0.41 1 -1.32 0.37 3 -1.23 0.77 1HND HONDURAS -0.04 0.24 5 -0.06 0.25 3 0.25 0.30 5 -0.33 0.32 3 -0.58 0.23 5 -0.41 0.37 2HKG HONG KONG -0.33 0.24 5 0.01 0.25 6 1.13 0.25 6 0.92 0.27 5 1.10 0.21 7 1.25 0.25 6HUN HUNGARY 1.19 0.16 8 1.22 0.19 6 0.75 0.22 9 1.25 0.22 7 0.60 0.17 11 0.61 0.21 8ISL ICELAND 1.53 0.27 4 1.47 0.29 3 1.57 0.40 4 1.25 0.37 2 1.93 0.33 4 1.50 0.41 3IND INDIA 0.66 0.24 6 0.36 0.25 6 -0.05 0.22 8 -0.04 0.25 6 -0.17 0.18 9 -0.26 0.23 7IDN INDONESIA -0.40 0.24 6 -1.13 0.25 5 -1.56 0.22 8 -1.29 0.26 5 -0.50 0.18 9 -0.53 0.25 6IRN IRAN -0.36 0.24 4 -0.56 0.25 3 0.02 0.25 5 0.13 0.28 4 -0.21 0.22 5 -0.34 0.29 4IRQ IRAQ -1.93 0.24 4 -1.75 0.25 3 -1.57 0.28 4 -2.24 0.30 3 -1.41 0.24 4 -1.88 0.32 3IRL IRELAND 1.57 0.23 6 1.53 0.25 5 1.24 0.23 8 1.43 0.25 6 1.79 0.19 8 1.36 0.23 7ISR ISRAEL 0.98 0.24 5 1.06 0.25 4 -0.54 0.24 6 -0.46 0.28 4 0.87 0.20 7 0.69 0.27 5ITA ITALY 1.10 0.23 7 1.28 0.25 5 0.82 0.22 9 1.16 0.25 6 0.68 0.18 10 0.77 0.23 7JAM JAMAICA 0.78 0.25 3 0.75 0.25 4 0.35 0.33 3 -0.34 0.32 3 -0.30 0.26 3 -0.48 0.33 3JPN JAPAN 1.03 0.23 6 1.14 0.28 4 1.20 0.23 8 1.15 0.29 4 0.93 0.19 9 0.84 0.31 5JOR JORDAN 0.10 0.24 4 0.15 0.25 4 0.13 0.27 5 -0.06 0.27 5 0.42 0.22 5 0.63 0.26 5KAZ KAZAKHSTAN -0.80 0.16 7 -0.69 0.19 5 0.29 0.25 7 0.22 0.22 6 -0.61 0.19 8 -0.82 0.23 6KEN KENYA -0.68 0.24 5 -0.70 0.25 4 -0.83 0.27 5 -1.10 0.27 5 -0.76 0.22 6 -0.90 0.22 6PRK KOREA, NORTH -1.82 0.28 2 -1.79 0.29 2 0.79 0.51 2 0.37 0.41 1 -1.06 0.40 2 -0.30 0.77 1KOR KOREA, SOUTH 0.98 0.23 6 0.91 0.25 6 0.50 0.23 8 0.16 0.25 6 0.44 0.19 9 0.41 0.23 7KWT KUWAIT 0.08 0.25 3 0.00 0.25 3 0.64 0.29 3 0.68 0.30 3 0.13 0.26 3 -0.06 0.32 3KGZ KYRGYZ REPUBLIC -0.57 0.19 3 -0.35 0.23 3 -0.32 0.48 2 0.32 0.31 3 -0.61 0.31 3 -0.58 0.30 3LAO LAOS -1.05 0.36 2 -1.05 0.36 1 0.00 0.63 1 .. .. .. -0.39 0.52 1 .. .. ..LVA LATVIA 0.81 0.16 5 0.75 0.19 5 0.50 0.28 5 0.46 0.23 5 0.22 0.21 6 0.07 0.24 5LBN LEBANON -0.32 0.24 4 -0.40 0.25 3 -0.55 0.28 4 -0.25 0.30 3 -0.02 0.24 4 0.17 0.32 3LSO LESOTHO -0.15 0.39 1 -0.15 0.36 1 .. .. .. -0.82 0.61 1 .. .. .. -0.46 0.33 2LBR LIBERIA -1.04 0.27 3 -0.89 0.29 2 -0.65 0.51 2 -0.95 0.41 1 -0.94 0.40 2 -0.92 0.77 1LBY LIBYA -1.35 0.25 3 -1.35 0.25 3 -0.38 0.29 3 -1.17 0.30 3 -1.12 0.26 3 -1.32 0.32 3LTU LITHUANIA 1.00 0.16 7 0.88 0.19 5 0.29 0.26 7 0.35 0.23 5 0.26 0.19 9 0.13 0.24 5LUX LUXEMBOURG 1.41 0.27 4 1.49 0.29 3 1.48 0.43 3 1.40 0.37 2 1.86 0.41 3 1.67 0.41 3MKD MACEDONIA, FORMER YUGOSLAV REPUBLIC OF0.03 0.18 4 0.09 0.21 4 -1.45 0.37 2 -0.40 0.31 3 -0.63 0.28 3 -0.58 0.27 3MDG MADAGASCAR 0.28 0.27 4 0.31 0.29 3 -0.34 0.49 3 -0.79 0.37 2 -0.35 0.37 3 -0.29 0.39 3MWI MALAWI -0.14 0.24 5 0.06 0.25 4 0.03 0.31 4 0.04 0.29 4 -0.77 0.26 4 -0.62 0.24 5MYS MALAYSIA -0.13 0.23 7 -0.09 0.25 6 0.31 0.22 9 0.55 0.25 6 0.53 0.19 9 0.71 0.23 7MDV MALDIVES -0.81 0.39 1 -0.91 0.36 1 .. .. .. .. .. . . .. .. . . .. . . ..MLI MALI 0.32 0.27 3 0.42 0.29 3 -0.13 0.51 2 -0.29 0.37 2 -1.44 0.40 2 -0.05 0.51 2MLT MALTA 1.43 0.28 2 1.41 0.29 2 1.05 0.65 1 1.32 0.41 1 0.73 0.53 1 0.63 0.77 1MRT MAURITANIA -0.59 0.36 2 -0.97 0.36 1 -0.87 0.63 1 .. .. .. -0.66 0.52 1 .. .. ..MUS MAURITIUS 1.27 0.29 3 1.01 0.29 3 1.12 0.32 3 1.14 0.39 3 0.76 0.26 3 0.17 0.27 3MEX MEXICO 0.12 0.23 7 -0.11 0.25 5 0.06 0.22 9 -0.35 0.25 6 0.28 0.18 10 0.18 0.23 7MDA MOLDOVA 0.12 0.16 6 0.11 0.19 5 -0.29 0.27 5 -0.20 0.23 5 -1.10 0.21 6 -0.46 0.24 5MNG MONGOLIA 0.73 0.27 3 0.63 0.21 3 0.72 0.51 2 0.37 0.41 1 0.39 0.40 2 0.02 0.39 2MAR MOROCCO -0.23 0.25 3 -0.24 0.25 4 0.16 0.29 3 0.09 0.27 5 0.10 0.26 3 0.27 0.22 6MOZ MOZAMBIQUE -0.22 0.27 3 -0.17 0.29 3 0.20 0.51 2 -0.53 0.34 3 -0.49 0.40 2 -0.33 0.29 4MMR MYANMAR -1.93 0.24 4 -1.75 0.25 3 -1.20 0.28 4 -0.97 0.30 3 -1.25 0.24 4 -1.46 0.32 3NAM NAMIBIA 0.32 0.24 5 0.47 0.25 3 -0.52 0.31 4 0.71 0.31 3 0.60 0.26 4 0.04 0.26 4NPL NEPAL -0.06 0.36 2 0.05 0.36 1 -0.26 0.63 1 .. .. .. -1.04 0.52 1 .. .. ..NLD NETHERLANDS 1.61 0.23 6 1.64 0.25 4 1.48 0.23 8 1.48 0.26 5 1.84 0.19 8 2.03 0.25 6NZL NEW ZEALAND 1.59 0.24 5 1.47 0.25 4 1.21 0.24 6 1.42 0.28 4 1.27 0.21 6 1.57 0.27 5NIC NICARAGUA -0.06 0.24 5 0.07 0.25 3 0.31 0.30 5 -0.32 0.32 3 -0.73 0.23 5 -0.55 0.37 2NER NIGER 0.11 0.27 3 -0.74 0.29 2 -0.61 0.51 2 -0.76 0.41 1 -1.16 0.40 2 -1.39 0.77 1NGA NIGERIA -0.44 0.23 6 -1.23 0.25 4 -1.36 0.26 7 -1.05 0.27 5 -1.00 0.21 7 -1.32 0.22 6NOR NORWAY 1.58 0.24 5 1.67 0.25 4 1.32 0.23 7 1.41 0.26 5 1.35 0.20 7 1.67 0.25 6OMN OMAN -0.50 0.25 3 -0.57 0.25 3 1.00 0.28 4 0.91 0.30 3 0.85 0.24 4 0.90 0.32 3PAK PAKISTAN -1.43 0.24 5 -0.44 0.25 3 -0.39 0.26 6 -0.65 0.26 5 -0.48 0.22 6 -0.74 0.26 5PAN PANAMA 0.77 0.24 5 0.66 0.25 3 0.57 0.26 6 0.15 0.30 3 -0.14 0.21 6 -0.28 0.32 3PNG PAPUA NEW GUINEA -0.03 0.24 4 0.12 0.25 3 -0.48 0.28 4 -0.40 0.34 2 -0.67 0.24 4 -0.69 0.37 2 Note: “Est” refers to the point estimate of governance. “S.E.” refers to the standard error. “N” refers to the number of sources in which the country appears. Governance indicators are oriented so that higher values correspond to better outcomes, on a scale from –2.5 to 2.5. These ratings are based on subjective assessments from a variety of sources, are subject to substantial m argins of error as indicated, and in no way reflect the official view of the World Bank, its Executive Directors, or the countries they represent.

40
Table 3: Estimates of Governance, Cont’d
Voice and Accountability Political Stability Government Effectiveness2000/01 1997/98 2000/01 1997/98 2000/01 1997/98
Est. S.E. N Est. S.E. N Est. S.E. N Est. S.E. N Est. S.E. N Est. S.E. N
PRY PARAGUAY -0.70 0.24 4 -0.42 0.25 4 -0.87 0.32 4 -0.57 0.32 3 -1.20 0.26 4 -1.10 0.33 3PER PERU 0.15 0.23 6 -0.69 0.25 4 -0.23 0.24 8 -0.53 0.25 6 -0.35 0.19 9 0.17 0.24 6PHL PHILIPPINES 0.53 0.23 7 0.63 0.25 5 -0.21 0.22 9 0.27 0.26 5 0.03 0.19 9 0.13 0.25 6POL POLAND 1.21 0.16 8 1.12 0.19 6 0.69 0.22 9 0.84 0.22 7 0.27 0.17 11 0.67 0.21 8PRT PORTUGAL 1.42 0.24 5 1.48 0.25 5 1.41 0.23 7 1.39 0.25 6 0.91 0.20 7 1.15 0.23 7PRI PUERTO RICO .. .. .. .. . . .. 0.83 0.49 1 0.76 0.53 1 1.38 0.43 1 1.26 0.52 1QAT QATAR -0.54 0.25 3 -0.78 0.25 3 1.40 0.28 4 1.38 0.30 3 0.82 0.24 4 0.48 0.32 3ROM ROMANIA 0.50 0.16 7 0.29 0.19 4 -0.08 0.26 7 0.02 0.24 4 -0.54 0.19 9 -0.57 0.26 4RUS RUSSIA -0.35 0.16 8 -0.19 0.19 6 -0.41 0.22 9 -0.69 0.22 7 -0.57 0.17 11 -0.59 0.21 8RWA RWANDA -1.42 0.36 2 -1.17 0.36 1 -1.16 0.63 1 .. .. .. .. .. . . .. . . ..STP SAO TOME AND PRINCIPE 1.00 0.39 1 0.82 0.36 1 .. .. .. .. .. . . .. .. . . .. . . ..SAU SAUDI ARABIA -1.07 0.24 4 -1.10 0.25 3 0.51 0.25 5 0.24 0.28 4 0.00 0.22 5 -0.35 0.29 4SEN SENEGAL 0.12 0.24 5 -0.29 0.25 4 -0.68 0.31 4 -0.87 0.32 3 0.16 0.26 4 0.05 0.29 4SLE SIERRA LEONE -1.35 0.27 3 -1.62 0.29 2 -1.26 0.51 2 -1.52 0.41 1 -1.60 0.40 2 0.01 0.77 1SGP SINGAPORE 0.11 0.24 6 0.13 0.25 6 1.44 0.23 8 1.39 0.25 6 2.16 0.19 9 2.08 0.23 7SVK SLOVAK REPUBLIC 0.99 0.16 7 0.52 0.19 5 0.62 0.25 7 0.65 0.23 6 0.23 0.19 8 -0.03 0.22 6SVN SLOVENIA 1.07 0.16 7 1.03 0.19 4 0.87 0.24 7 1.09 0.24 4 0.70 0.19 8 0.57 0.26 4SLB SOLOMON ISLANDS 0.16 0.39 1 1.17 0.36 1 .. .. .. .. .. . . .. .. . . .. . . ..SOM SOMALIA -1.45 0.27 3 -1.69 0.29 2 -1.55 0.51 2 -1.71 0.41 1 -2.34 0.40 2 -1.70 0.77 1ZAF SOUTH AFRICA 1.17 0.23 7 0.99 0.25 5 0.07 0.22 9 -0.53 0.24 7 0.25 0.18 10 -0.01 0.21 8ESP SPAIN 1.15 0.23 7 1.36 0.25 5 1.01 0.22 9 0.58 0.25 6 1.57 0.19 9 1.60 0.23 7LKA SRI LANKA -0.23 0.24 4 -0.16 0.25 3 -1.63 0.27 5 -1.63 0.30 3 -0.44 0.22 5 -0.61 0.32 3SDN SUDAN -1.53 0.24 4 -1.50 0.25 3 -2.01 0.28 4 -1.73 0.34 2 -1.34 0.24 4 -1.70 0.37 2SUR SURINAME 0.63 0.28 2 0.28 0.29 2 0.12 0.65 1 -0.20 0.41 1 0.10 0.53 1 -0.15 0.77 1SWZ SWAZILAND -0.93 0.39 1 -0.78 0.36 1 .. .. .. -1.69 0.61 1 .. .. .. -0.47 0.33 2SWE SWEDEN 1.65 0.23 7 1.60 0.25 4 1.38 0.22 9 1.41 0.26 5 1.51 0.19 9 1.57 0.25 6CHE SWITZERLAND 1.73 0.23 6 1.68 0.25 5 1.61 0.23 8 1.69 0.25 6 1.93 0.19 8 1.99 0.23 7SYR SYRIA -1.40 0.25 3 -1.36 0.25 3 -0.28 0.28 4 0.08 0.30 3 -0.81 0.24 4 -1.18 0.32 3TWN TAIWAN 0.83 0.23 6 0.71 0.25 5 0.70 0.23 8 0.94 0.26 5 0.91 0.19 9 1.29 0.25 6TJK TAJIKISTAN -0.69 0.19 3 -1.13 0.23 2 -1.77 0.42 2 -1.86 0.33 2 -1.31 0.28 3 -1.42 0.34 2TZA TANZANIA -0.07 0.24 5 -0.28 0.25 4 -0.34 0.27 5 0.57 0.27 5 -0.43 0.23 5 -0.49 0.22 6THA THAILAND 0.37 0.24 6 0.22 0.25 6 0.21 0.23 8 0.25 0.25 6 0.10 0.19 9 0.01 0.23 7TGO TOGO -1.06 0.28 2 -1.05 0.29 3 -0.62 0.65 1 -0.91 0.37 2 -1.32 0.53 1 -0.37 0.51 2TTO TRINIDAD AND TOBAGO 0.61 0.25 4 0.95 0.25 3 0.27 0.32 4 0.32 0.34 2 0.62 0.25 4 0.52 0.37 2TUN TUNISIA -0.61 0.25 4 -0.59 0.25 3 0.82 0.27 5 0.66 0.28 4 1.30 0.23 5 0.63 0.24 5TUR TURKEY -0.55 0.23 7 -0.88 0.25 5 -0.75 0.22 9 -0.94 0.25 6 -0.15 0.18 10 -0.41 0.23 7TKM TURKMENISTAN -1.42 0.19 2 -1.45 0.23 2 0.11 0.49 1 0.00 0.33 2 -1.23 0.32 2 -1.25 0.34 2UGA UGANDA -0.79 0.24 5 -0.52 0.25 4 -1.31 0.27 5 -0.98 0.27 5 -0.32 0.23 5 -0.25 0.22 6UKR UKRAINE -0.31 0.16 6 -0.05 0.19 5 -0.59 0.25 7 -0.24 0.22 7 -0.75 0.19 8 -0.89 0.21 7ARE UNITED ARAB EMIRATES -0.51 0.25 3 -0.54 0.25 3 1.09 0.29 3 0.82 0.30 3 0.60 0.26 3 0.14 0.32 3GBR UNITED KINGDOM 1.46 0.23 7 1.51 0.25 5 1.10 0.22 9 0.92 0.25 6 1.77 0.18 10 1.97 0.23 7USA UNITED STATES 1.24 0.24 6 1.52 0.25 6 1.18 0.23 8 1.10 0.25 6 1.58 0.19 9 1.37 0.23 7URY URUGUAY 1.08 0.24 5 0.77 0.25 3 1.05 0.28 6 0.35 0.30 3 0.61 0.21 7 0.62 0.32 3UZB UZBEKISTAN -1.18 0.18 5 -1.28 0.21 4 -1.17 0.29 4 -0.33 0.27 4 -0.86 0.22 5 -1.30 0.25 4VEN VENEZUELA -0.34 0.24 5 0.15 0.25 5 -0.33 0.23 7 -0.25 0.25 6 -0.81 0.19 8 -0.85 0.23 7VNM VIETNAM -1.29 0.24 4 -1.45 0.25 4 0.44 0.24 6 0.65 0.26 5 -0.30 0.20 6 -0.30 0.26 5WTB WEST BANK 0.00 1.00 1 -0.13 0.86 1 -0.39 0.90 1 0.11 0.66 1 0.37 0.70 1 -0.09 0.56 1WSM WESTERN SAMOA .. .. .. .. . . .. . . .. .. .. .. . . .. .. . . .. . . ..YEM YEMEN -0.63 0.24 4 -0.41 0.25 3 -1.07 0.31 3 -1.47 0.34 2 -0.77 0.27 3 -0.62 0.37 2YUG YUGOSLAVIA, FEDERAL REPUBLIC-0.09 0.17 4 -0.71 0.19 4 -0.48 0.34 2 -1.42 0.26 3 -0.97 0.25 3 -0.95 0.29 3ZAR Congo, Dem. Rep. (Zaire) -1.70 0.27 3 -1.57 0.29 2 -2.59 0.38 3 -2.59 0.34 2 -1.38 0.31 3 -1.77 0.48 2ZMB ZAMBIA -0.17 0.24 5 -0.05 0.25 4 -0.42 0.27 5 0.00 0.27 5 -0.75 0.23 5 -0.40 0.22 6ZWE ZIMBABWE -0.90 0.25 4 -0.67 0.25 4 -1.25 0.28 5 -0.54 0.27 5 -1.03 0.22 5 -1.13 0.22 6 Note: “Est” refers to the point estimate of governance. “S.E.” refers to the standard error. “N” refers to the number of sources in which the country appears. Governance indicators are oriented so that higher values correspond to better outcomes, on a scale from –2.5 to 2.5. These ratings are based on subjective assessments from a variety of sources, are subject to substantial margins of error as indicated, and in no way reflect the official view of the World Bank, its Executive Directors, or the countries they represent.

41
Table 3: Estimates of Governance, Cont’d
Regulatory Quality Rule of Law Control of Corruption
2000/01 1997/98 2000/01 1997/98 2000/01 1997/98Est. S.E. N Est. S.E. N Est. S.E. N Est. S.E. N Est. S.E. N Est. S.E. N
AFG AFGHANISTAN -2.95 0.46 1 .. .. .. -2.17 0.37 1 .. . . .. -1.47 0.47 1 .. .. . .ALB ALBANIA -0.21 0.35 5 -0.70 0.26 5 -0.71 0.20 6 -0.92 0.20 6 -0.60 0.20 6 -0.99 0.23 5DZA ALGERIA -0.79 0.37 3 -1.17 0.40 3 -0.97 0.24 5 -1.10 0.28 4 -0.62 0.25 4 -0.88 0.27 3AGO ANGOLA -1.39 0.37 3 -0.71 0.29 4 -1.49 0.24 5 -1.23 0.27 5 -1.14 0.25 4 -0.86 0.22 4ARG ARGENTINA 0.25 0.27 7 0.67 0.23 5 0.22 0.18 11 0.32 0.22 7 -0.36 0.17 11 -0.27 0.20 7ARM ARMENIA -0.53 0.35 5 -0.57 0.26 5 -0.35 0.21 6 -0.15 0.20 6 -0.80 0.23 5 -0.80 0.23 5AUS AUSTRALIA 1.18 0.29 5 0.96 0.23 5 1.69 0.18 8 1.60 0.22 7 1.75 0.20 7 1.60 0.21 6AUT AUSTRIA 1.19 0.29 5 0.90 0.23 6 1.86 0.19 8 1.81 0.21 8 1.56 0.22 7 1.46 0.19 8AZE AZERBAIJAN -0.14 0.35 5 -1.00 0.26 5 -0.78 0.19 7 -0.56 0.18 7 -1.05 0.18 7 -1.00 0.19 6BHS BAHAMAS 0.73 0.54 2 0.87 0.52 2 0.85 0.43 2 0.56 0.44 2 0.74 0.65 1 0.50 0.75 1BHR BAHRAIN 0.78 0.37 3 0.75 0.40 3 0.42 0.24 5 0.66 0.28 4 0.04 0.25 4 -0.21 0.27 3BGD BANGLADESH 0.01 0.37 4 -0.16 0.40 3 -0.76 0.24 6 -0.93 0.28 4 -0.64 0.23 5 -0.29 0.27 3BRB BARBADOS 0.39 0.64 1 0.61 0.60 1 1.16 0.52 1 0.41 0.60 1 .. .. . . .. .. . .BLR BELARUS -2.28 0.37 4 -1.47 0.26 5 -0.81 0.20 7 -0.88 0.20 6 -0.06 0.21 6 -0.65 0.22 6BEL BELGIUM 0.58 0.28 6 0.79 0.23 5 1.34 0.19 8 0.80 0.22 7 1.05 0.22 7 0.67 0.20 7BLZ BELIZE 0.03 0.63 2 0.29 0.60 1 0.74 0.45 2 0.09 0.60 1 0.48 0.48 1 .. .. . .BEN BENIN 0.07 0.64 1 -0.08 0.60 2 -0.57 0.43 2 -0.42 0.45 2 .. .. . . -0.78 0.54 1BTN BHUTAN .. .. . . .. .. .. . . .. .. .. . . .. .. .. . . .. .. . .BOL BOLIVIA 0.66 0.34 5 0.88 0.39 4 -0.41 0.21 8 -0.35 0.26 5 -0.72 0.21 7 -0.44 0.23 5BIH BOSNIA-HERZEGOVINA -1.18 0.54 3 -1.26 0.30 2 -0.75 0.26 4 -1.11 0.23 3 -0.49 0.26 3 -0.35 0.46 1BWA BOTSWANA 1.02 0.37 4 0.57 0.29 4 0.68 0.24 6 0.50 0.27 5 0.89 0.23 5 0.54 0.22 4BRA BRAZIL 0.13 0.27 7 0.13 0.23 6 -0.26 0.18 10 -0.22 0.21 8 -0.02 0.17 10 0.06 0.19 8BRN BRUNEI 0.19 0.71 1 -0.08 0.72 1 1.29 0.60 1 1.25 0.55 1 -0.17 0.65 1 -0.02 0.75 1BGR BULGARIA 0.16 0.32 6 0.52 0.26 5 0.02 0.17 9 -0.15 0.18 7 -0.16 0.17 9 -0.56 0.18 7BFA BURKINA FASO 0.04 0.54 2 -0.04 0.33 3 -0.79 0.37 3 -0.35 0.43 3 -0.93 0.39 2 -0.37 0.36 2BDI BURUNDI -0.59 0.50 2 -0.85 0.60 1 -1.07 0.29 3 -0.88 0.60 1 -1.40 0.33 2 .. .. . .KHM CAMBODIA 0.24 0.63 2 -0.04 0.60 1 -0.38 0.45 2 -0.23 0.60 1 0.34 0.48 1 .. .. . .CMR CAMEROON 0.05 0.37 4 -0.16 0.29 5 -1.02 0.25 6 -1.02 0.25 6 -1.11 0.25 5 -1.10 0.21 5CAN CANADA 1.07 0.29 6 0.87 0.23 6 1.70 0.18 10 1.55 0.21 8 2.05 0.19 9 2.06 0.20 7CPV CAPE VERDE -0.41 0.64 1 -1.01 0.60 1 0.15 0.52 1 0.09 0.60 1 .. .. . . .. .. . .CAF CENTRAL AFRICAN REPUBLIC .. .. . . .. .. .. . . .. .. .. . . .. .. .. . . .. .. . .TCD CHAD -0.57 0.64 1 -0.74 0.60 2 -0.86 0.52 1 -0.83 0.45 2 .. .. . . -0.59 0.54 1CHL CHILE 1.10 0.27 7 0.90 0.23 5 1.19 0.18 11 1.09 0.22 7 1.40 0.17 11 1.03 0.20 7CHN CHINA -0.13 0.27 7 -0.07 0.23 5 -0.19 0.18 9 -0.04 0.22 7 -0.30 0.16 10 -0.29 0.16 7COL COLOMBIA 0.02 0.27 7 0.29 0.23 6 -0.77 0.18 11 -0.78 0.21 8 -0.39 0.17 11 -0.49 0.19 8COM COMOROS .. .. . . .. .. .. . . .. .. .. . . .. .. .. . . .. .. . .COG CONGO -0.76 0.54 2 -0.99 0.52 3 -1.11 0.37 3 -1.44 0.37 3 -0.49 0.39 2 -0.60 0.48 2CRI COSTA RICA 0.88 0.34 5 0.93 0.39 4 0.61 0.20 8 0.55 0.24 6 0.87 0.19 7 0.58 0.21 6CIV IVORY COAST -0.30 0.37 4 0.15 0.29 5 -0.54 0.25 5 -0.33 0.25 6 -0.71 0.26 4 -0.08 0.21 5HRV CROATIA 0.20 0.35 5 0.24 0.26 4 0.29 0.20 7 0.15 0.19 6 0.02 0.19 7 -0.46 0.20 5CUB CUBA -1.23 0.37 3 -0.87 0.40 3 -0.32 0.24 5 0.11 0.28 4 -0.12 0.25 4 0.27 0.27 3CYP CYPRUS 0.83 0.37 3 0.84 0.40 3 0.96 0.26 4 0.93 0.28 4 1.24 0.30 3 1.81 0.27 3CZE CZECH REPUBLIC 0.54 0.26 8 0.57 0.19 7 0.64 0.16 10 0.54 0.16 10 0.31 0.16 11 0.38 0.16 9DNK DENMARK 1.09 0.29 5 1.05 0.23 5 1.71 0.18 9 1.69 0.22 7 2.09 0.20 8 2.13 0.20 7DJI DJIBOUTI -0.41 0.64 1 -0.52 0.60 1 -0.19 0.52 1 -0.23 0.60 1 .. .. . . .. .. . .DOM DOMINICAN REPUBLIC 0.60 0.34 5 0.54 0.52 2 0.01 0.21 7 0.38 0.31 3 -0.20 0.22 6 -0.77 0.30 2ECU ECUADOR 0.00 0.31 6 0.38 0.39 4 -0.76 0.19 9 -0.72 0.24 6 -0.98 0.19 9 -0.82 0.24 5EGY EGYPT 0.13 0.31 6 0.12 0.23 5 0.21 0.19 8 0.13 0.23 7 -0.16 0.20 8 -0.27 0.20 6SLV EL SALVADOR 0.94 0.44 4 1.23 0.52 2 -0.65 0.24 7 -0.66 0.28 4 -0.33 0.21 6 -0.35 0.22 4GNQ EQUATORIAL GUINEA -0.90 0.64 1 -1.33 0.60 1 -1.20 0.52 1 -1.20 0.60 1 .. .. . . .. .. . .ERI ERITREA .. .. . . .. .. .. -0.43 0.60 1 .. . . .. -0.97 0.44 1 .. .. . .EST ESTONIA 1.09 0.28 7 0.74 0.26 5 0.78 0.16 10 0.51 0.18 7 0.73 0.16 10 0.59 0.18 7ETH ETHIOPIA -0.71 0.53 3 -0.03 0.33 3 -0.24 0.34 4 0.27 0.43 3 -0.40 0.32 3 -0.44 0.36 2FJI FIJI -0.41 0.64 1 -0.37 0.60 2 -0.52 0.52 1 -0.50 0.45 2 1.01 0.44 1 0.81 0.54 1FIN FINLAND 1.42 0.29 5 1.14 0.23 5 1.83 0.18 9 1.74 0.22 7 2.25 0.20 8 2.08 0.20 7FRA FRANCE 0.59 0.29 6 0.71 0.23 6 1.22 0.18 10 1.08 0.21 8 1.15 0.19 8 1.28 0.20 7GAB GABON -0.12 0.37 3 0.35 0.52 2 -0.44 0.24 5 -0.53 0.31 3 -0.58 0.25 4 -1.02 0.30 2GMB GAMBIA -0.01 0.54 2 -0.25 0.52 2 0.00 0.43 2 0.27 0.44 2 0.13 0.65 1 -0.02 0.75 1GEO GEORGIA -0.75 0.37 4 -0.85 0.27 4 -0.43 0.21 6 -0.49 0.21 5 -0.69 0.20 6 -0.74 0.24 4DEU GERMANY 1.08 0.29 6 0.89 0.23 6 1.57 0.18 10 1.48 0.21 8 1.38 0.19 8 1.62 0.19 8GHA GHANA 0.24 0.37 4 0.28 0.29 5 -0.08 0.25 6 -0.01 0.25 6 -0.28 0.25 5 -0.30 0.21 5 Note: “Est” refers to the point estim ate of governance. “S.E.” refers to the standard error. “N” refers to the number of sources in which the country appears. Governance indicators are oriented so that higher values correspond to better outcomes, on a scale from –2.5 to 2.5. These ratings are based on subjective assessments from a variety of sources, are subject to substantial margins of error as indicated, and in no way reflect the official view of the World Bank, its Executive Directors, or the countries they represent.
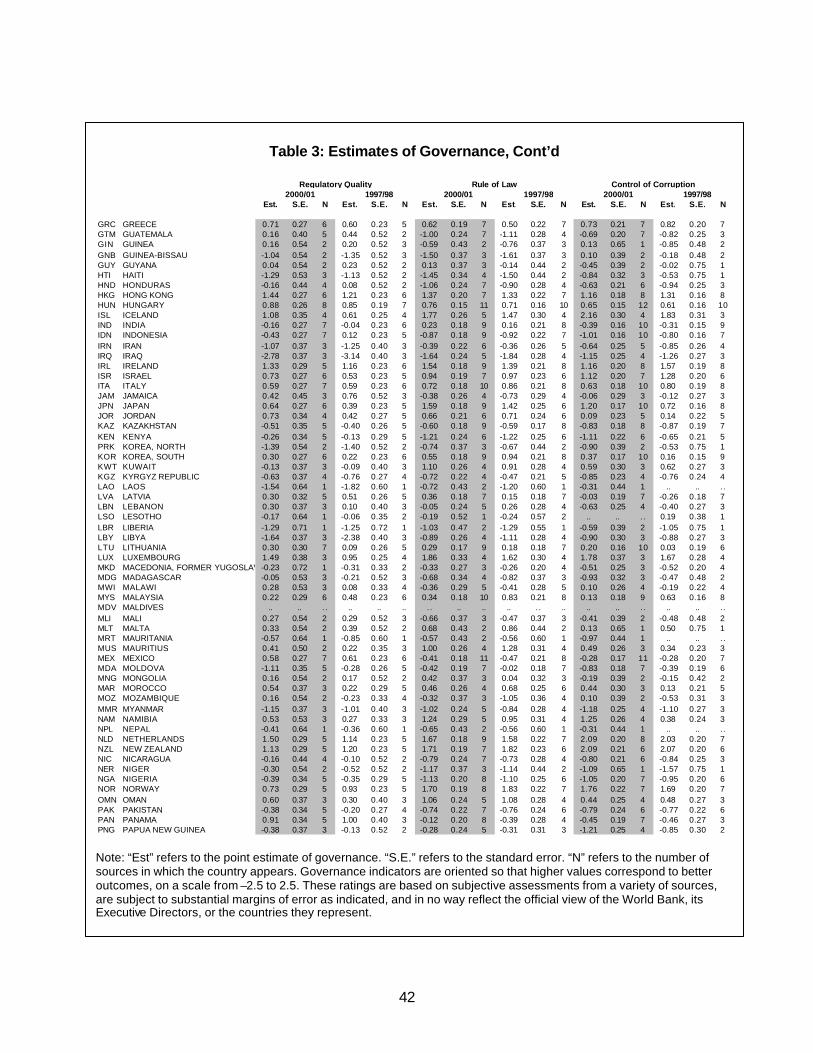
42
Table 3: Estimates of Governance, Cont’d
Regulatory Quality Rule of Law Control of Corruption
2000/01 1997/98 2000/01 1997/98 2000/01 1997/98Est. S.E. N Est. S.E. N Est. S.E. N Est. S.E. N Est. S.E. N Est. S.E. N
GRC GREECE 0.71 0.27 6 0.60 0.23 5 0.62 0.19 7 0.50 0.22 7 0.73 0.21 7 0.82 0.20 7GTM GUATEMALA 0.16 0.40 5 0.44 0.52 2 -1.00 0.24 7 -1.11 0.28 4 -0.69 0.20 7 -0.82 0.25 3GIN GUINEA 0.16 0.54 2 0.20 0.52 3 -0.59 0.43 2 -0.76 0.37 3 0.13 0.65 1 -0.85 0.48 2GNB GUINEA-BISSAU -1.04 0.54 2 -1.35 0.52 3 -1.50 0.37 3 -1.61 0.37 3 0.10 0.39 2 -0.18 0.48 2GUY GUYANA 0.04 0.54 2 0.23 0.52 2 0.13 0.37 3 -0.14 0.44 2 -0.45 0.39 2 -0.02 0.75 1HTI HAITI -1.29 0.53 3 -1.13 0.52 2 -1.45 0.34 4 -1.50 0.44 2 -0.84 0.32 3 -0.53 0.75 1HND HONDURAS -0.16 0.44 4 0.08 0.52 2 -1.06 0.24 7 -0.90 0.28 4 -0.63 0.21 6 -0.94 0.25 3HKG HONG KONG 1.44 0.27 6 1.21 0.23 6 1.37 0.20 7 1.33 0.22 7 1.16 0.18 8 1.31 0.16 8HUN HUNGARY 0.88 0.26 8 0.85 0.19 7 0.76 0.15 11 0.71 0.16 10 0.65 0.15 12 0.61 0.16 10ISL ICELAND 1.08 0.35 4 0.61 0.25 4 1.77 0.26 5 1.47 0.30 4 2.16 0.30 4 1.83 0.31 3IND INDIA -0.16 0.27 7 -0.04 0.23 6 0.23 0.18 9 0.16 0.21 8 -0.39 0.16 10 -0.31 0.15 9IDN INDONESIA -0.43 0.27 7 0.12 0.23 5 -0.87 0.18 9 -0.92 0.22 7 -1.01 0.16 10 -0.80 0.16 7IRN IRAN -1.07 0.37 3 -1.25 0.40 3 -0.39 0.22 6 -0.36 0.26 5 -0.64 0.25 5 -0.85 0.26 4IRQ IRAQ -2.78 0.37 3 -3.14 0.40 3 -1.64 0.24 5 -1.84 0.28 4 -1.15 0.25 4 -1.26 0.27 3IRL IRELAND 1.33 0.29 5 1.16 0.23 6 1.54 0.18 9 1.39 0.21 8 1.16 0.20 8 1.57 0.19 8ISR ISRAEL 0.73 0.27 6 0.53 0.23 5 0.94 0.19 7 0.97 0.23 6 1.12 0.20 7 1.28 0.20 6ITA ITALY 0.59 0.27 7 0.59 0.23 6 0.72 0.18 10 0.86 0.21 8 0.63 0.18 10 0.80 0.19 8JAM JAMAICA 0.42 0.45 3 0.76 0.52 3 -0.38 0.26 4 -0.73 0.29 4 -0.06 0.29 3 -0.12 0.27 3JPN JAPAN 0.64 0.27 6 0.39 0.23 5 1.59 0.18 9 1.42 0.25 6 1.20 0.17 10 0.72 0.16 8JOR JORDAN 0.73 0.34 4 0.42 0.27 5 0.66 0.21 6 0.71 0.24 6 0.09 0.23 5 0.14 0.22 5KAZ KAZAKHSTAN -0.51 0.35 5 -0.40 0.26 5 -0.60 0.18 9 -0.59 0.17 8 -0.83 0.18 8 -0.87 0.19 7KEN KENYA -0.26 0.34 5 -0.13 0.29 5 -1.21 0.24 6 -1.22 0.25 6 -1.11 0.22 6 -0.65 0.21 5PRK KOREA, NORTH -1.39 0.54 2 -1.40 0.52 2 -0.74 0.37 3 -0.67 0.44 2 -0.90 0.39 2 -0.53 0.75 1KOR KOREA, SOUTH 0.30 0.27 6 0.22 0.23 6 0.55 0.18 9 0.94 0.21 8 0.37 0.17 10 0.16 0.15 9KWT KUWAIT -0.13 0.37 3 -0.09 0.40 3 1.10 0.26 4 0.91 0.28 4 0.59 0.30 3 0.62 0.27 3KGZ KYRGYZ REPUBLIC -0.63 0.37 4 -0.76 0.27 4 -0.72 0.22 4 -0.47 0.21 5 -0.85 0.23 4 -0.76 0.24 4LAO LAOS -1.54 0.64 1 -1.82 0.60 1 -0.72 0.43 2 -1.20 0.60 1 -0.31 0.44 1 .. .. . .LVA LATVIA 0.30 0.32 5 0.51 0.26 5 0.36 0.18 7 0.15 0.18 7 -0.03 0.19 7 -0.26 0.18 7LBN LEBANON 0.30 0.37 3 0.10 0.40 3 -0.05 0.24 5 0.26 0.28 4 -0.63 0.25 4 -0.40 0.27 3LSO LESOTHO -0.17 0.64 1 -0.06 0.35 2 -0.19 0.52 1 -0.24 0.57 2 .. .. . . 0.19 0.38 1LBR LIBERIA -1.29 0.71 1 -1.25 0.72 1 -1.03 0.47 2 -1.29 0.55 1 -0.59 0.39 2 -1.05 0.75 1LBY LIBYA -1.64 0.37 3 -2.38 0.40 3 -0.89 0.26 4 -1.11 0.28 4 -0.90 0.30 3 -0.88 0.27 3LTU LITHUANIA 0.30 0.30 7 0.09 0.26 5 0.29 0.17 9 0.18 0.18 7 0.20 0.16 10 0.03 0.19 6LUX LUXEMBOURG 1.49 0.38 3 0.95 0.25 4 1.86 0.33 4 1.62 0.30 4 1.78 0.37 3 1.67 0.28 4MKD MACEDONIA, FORMER YUGOSLAV REPUBLIC OF-0.23 0.72 1 -0.31 0.33 2 -0.33 0.27 3 -0.26 0.20 4 -0.51 0.25 3 -0.52 0.20 4MDG MADAGASCAR -0.05 0.53 3 -0.21 0.52 3 -0.68 0.34 4 -0.82 0.37 3 -0.93 0.32 3 -0.47 0.48 2MWI MALAWI 0.28 0.53 3 0.08 0.33 4 -0.36 0.29 5 -0.41 0.28 5 0.10 0.26 4 -0.19 0.22 4MYS MALAYSIA 0.22 0.29 6 0.48 0.23 6 0.34 0.18 10 0.83 0.21 8 0.13 0.18 9 0.63 0.16 8MDV MALDIVES .. .. . . .. .. .. . . .. .. .. . . .. .. .. . . .. .. . .MLI MALI 0.27 0.54 2 0.29 0.52 3 -0.66 0.37 3 -0.47 0.37 3 -0.41 0.39 2 -0.48 0.48 2MLT MALTA 0.33 0.54 2 0.39 0.52 2 0.68 0.43 2 0.86 0.44 2 0.13 0.65 1 0.50 0.75 1MRT MAURITANIA -0.57 0.64 1 -0.85 0.60 1 -0.57 0.43 2 -0.56 0.60 1 -0.97 0.44 1 .. .. . .MUS MAURITIUS 0.41 0.50 2 0.22 0.35 3 1.00 0.26 4 1.28 0.31 4 0.49 0.26 3 0.34 0.23 3MEX MEXICO 0.58 0.27 7 0.61 0.23 6 -0.41 0.18 11 -0.47 0.21 8 -0.28 0.17 11 -0.28 0.20 7MDA MOLDOVA -1.11 0.35 5 -0.28 0.26 5 -0.42 0.19 7 -0.02 0.18 7 -0.83 0.18 7 -0.39 0.19 6MNG MONGOLIA 0.16 0.54 2 0.17 0.52 2 0.42 0.37 3 0.04 0.32 3 -0.19 0.39 2 -0.15 0.42 2MAR MOROCCO 0.54 0.37 3 0.22 0.29 5 0.46 0.26 4 0.68 0.25 6 0.44 0.30 3 0.13 0.21 5MOZ MOZAMBIQUE 0.16 0.54 2 -0.23 0.33 4 -0.32 0.37 3 -1.05 0.36 4 0.10 0.39 2 -0.53 0.31 3MMR MYANMAR -1.15 0.37 3 -1.01 0.40 3 -1.02 0.24 5 -0.84 0.28 4 -1.18 0.25 4 -1.10 0.27 3NAM NAMIBIA 0.53 0.53 3 0.27 0.33 3 1.24 0.29 5 0.95 0.31 4 1.25 0.26 4 0.38 0.24 3NPL NEPAL -0.41 0.64 1 -0.36 0.60 1 -0.65 0.43 2 -0.56 0.60 1 -0.31 0.44 1 .. .. . .NLD NETHERLANDS 1.50 0.29 5 1.14 0.23 5 1.67 0.18 9 1.58 0.22 7 2.09 0.20 8 2.03 0.20 7NZL NEW ZEALAND 1.13 0.29 5 1.20 0.23 5 1.71 0.19 7 1.82 0.23 6 2.09 0.21 6 2.07 0.20 6NIC NICARAGUA -0.16 0.44 4 -0.10 0.52 2 -0.79 0.24 7 -0.73 0.28 4 -0.80 0.21 6 -0.84 0.25 3NER NIGER -0.30 0.54 2 -0.52 0.52 2 -1.17 0.37 3 -1.14 0.44 2 -1.09 0.65 1 -1.57 0.75 1NGA NIGERIA -0.39 0.34 5 -0.35 0.29 5 -1.13 0.20 8 -1.10 0.25 6 -1.05 0.20 7 -0.95 0.20 6NOR NORWAY 0.73 0.29 5 0.93 0.23 5 1.70 0.19 8 1.83 0.22 7 1.76 0.22 7 1.69 0.20 7OMN OMAN 0.60 0.37 3 0.30 0.40 3 1.06 0.24 5 1.08 0.28 4 0.44 0.25 4 0.48 0.27 3PAK PAKISTAN -0.38 0.34 5 -0.20 0.27 4 -0.74 0.22 7 -0.76 0.24 6 -0.79 0.24 6 -0.77 0.22 6PAN PANAMA 0.91 0.34 5 1.00 0.40 3 -0.12 0.20 8 -0.39 0.28 4 -0.45 0.19 7 -0.46 0.27 3PNG PAPUA NEW GUINEA -0.38 0.37 3 -0.13 0.52 2 -0.28 0.24 5 -0.31 0.31 3 -1.21 0.25 4 -0.85 0.30 2 Note: “Est” refers to the point estimate of governance. “S.E.” refers to the standard error. “N” refers to the number of sources in which the country appears. Governance indicators are oriented so that higher values correspond to better outcomes, on a scale from –2.5 to 2.5. These ratings are based on subjective assessments from a variety of sources, are subject to substantial margins of error as indicated, and in no way reflect the official view of the World Bank, its Executive Directors, or the countries they represent.

43
Table 3: Estimates of Governance, Cont’d
Regulatory Quality Rule of Law Control of Corruption
2000/01 1997/98 2000/01 1997/98 2000/01 1997/98Est. S.E. N Est. S.E. N Est. S.E. N Est. S.E. N Est. S.E. N Est. S.E. N
PRY PARAGUAY -0.43 0.45 3 0.37 0.52 3 -0.83 0.26 6 -0.70 0.29 4 -0.97 0.24 5 -0.96 0.27 3PER PERU 0.36 0.31 6 0.67 0.27 5 -0.53 0.19 10 -0.52 0.22 7 -0.04 0.18 10 -0.20 0.21 6PHL PHILIPPINES 0.21 0.29 6 0.57 0.23 5 -0.49 0.18 10 -0.08 0.22 7 -0.49 0.17 10 -0.23 0.16 7POL POLAND 0.41 0.26 8 0.56 0.19 7 0.55 0.15 11 0.54 0.16 10 0.43 0.15 12 0.49 0.16 9PRT PORTUGAL 0.81 0.29 6 0.89 0.23 6 0.94 0.18 8 1.08 0.21 8 1.21 0.21 7 1.22 0.19 8PRI PUERTO RICO 0.93 0.46 1 0.84 0.52 1 0.99 0.37 1 0.77 0.50 1 1.18 0.47 1 1.12 0.53 1QAT QATAR 0.38 0.37 3 0.33 0.40 3 1.00 0.24 5 1.27 0.28 4 0.57 0.25 4 0.57 0.27 3ROM ROMANIA -0.28 0.30 7 0.20 0.26 4 -0.02 0.17 9 -0.09 0.19 6 -0.51 0.16 10 -0.46 0.19 6RUS RUSSIA -1.40 0.26 8 -0.30 0.19 7 -0.87 0.15 11 -0.72 0.16 10 -1.01 0.15 12 -0.62 0.16 10RWA RWANDA -0.73 0.64 1 -1.17 0.60 1 -1.17 0.43 2 -1.20 0.60 1 0.35 0.44 1 .. .. . .STP SAO TOME AND PRINCIPE .. .. . . .. .. .. . . .. .. .. . . .. .. .. . . .. .. . .SAU SAUDI ARABIA -0.11 0.37 3 -0.15 0.40 3 0.19 0.22 6 0.49 0.26 5 -0.35 0.25 5 -0.58 0.26 4SEN SENEGAL -0.38 0.53 3 -0.34 0.52 3 -0.13 0.29 5 -0.10 0.29 4 -0.39 0.26 4 -0.24 0.27 3SLE SIERRA LEONE -1.21 0.54 2 -1.50 0.52 2 -0.38 0.37 3 -0.91 0.44 2 -0.45 0.39 2 -0.02 0.75 1SGP SINGAPORE 1.82 0.27 7 1.24 0.23 6 1.85 0.18 9 1.94 0.21 8 2.13 0.17 10 1.95 0.16 8SVK SLOVAK REPUBLIC 0.27 0.28 7 0.17 0.22 6 0.36 0.17 9 0.13 0.17 8 0.23 0.17 9 0.03 0.17 7SVN SLOVENIA 0.52 0.28 7 0.53 0.26 4 0.89 0.16 9 0.83 0.19 6 1.09 0.16 9 1.02 0.21 4SLB SOLOMON ISLANDS .. .. . . .. .. .. . . .. .. .. . . .. .. .. . . .. .. . .SOM SOMALIA -1.50 0.54 2 -1.77 0.52 2 -1.29 0.37 3 -1.50 0.44 2 -1.16 0.39 2 -1.05 0.75 1ZAF SOUTH AFRICA 0.07 0.27 7 0.24 0.20 7 -0.05 0.18 10 -0.35 0.21 9 0.35 0.18 10 0.30 0.17 9ESP SPAIN 1.08 0.29 6 0.86 0.23 6 1.12 0.18 10 1.03 0.21 8 1.45 0.19 9 1.21 0.19 8LKA SRI LANKA 0.38 0.34 4 0.62 0.40 3 -0.31 0.21 6 -0.36 0.28 4 0.00 0.23 5 -0.12 0.27 3SDN SUDAN -0.41 0.37 3 -0.83 0.52 2 -1.04 0.24 5 -1.35 0.31 3 -1.24 0.25 4 -1.02 0.30 2SUR SURINAME -0.81 0.54 2 -0.59 0.52 2 -0.59 0.43 2 -0.73 0.44 2 0.13 0.65 1 -0.02 0.75 1SWZ SWAZILAND 0.23 0.64 1 0.29 0.35 2 0.15 0.52 1 -0.06 0.57 2 .. .. . . 0.01 0.38 1SWE SWEDEN 1.08 0.29 6 0.85 0.23 5 1.70 0.18 10 1.62 0.22 7 2.21 0.19 9 2.09 0.20 7CHE SWITZERLAND 1.21 0.29 5 0.88 0.23 6 1.91 0.18 9 2.00 0.21 8 1.91 0.20 8 2.07 0.19 8SYR SYRIA -0.66 0.37 3 -0.92 0.40 3 -0.52 0.24 5 -0.29 0.28 4 -0.83 0.25 4 -0.79 0.27 3TWN TAIWAN 0.73 0.27 6 0.83 0.23 5 0.75 0.18 9 0.93 0.22 7 0.53 0.17 10 0.63 0.16 8TJK TAJIKISTAN -1.46 0.38 3 -1.52 0.27 3 -1.25 0.22 4 -1.33 0.22 4 -1.08 0.24 3 -1.32 0.26 3TZA TANZANIA -0.02 0.37 4 0.18 0.29 5 0.16 0.24 6 0.16 0.25 6 -0.92 0.23 5 -0.92 0.21 5THA THAILAND 0.56 0.27 7 0.19 0.23 6 0.44 0.18 9 0.41 0.21 8 -0.46 0.17 10 -0.16 0.16 8TGO TOGO -0.99 0.54 2 -0.85 0.52 3 -0.82 0.43 2 -0.80 0.37 3 -0.48 0.65 1 -0.24 0.48 2TTO TRINIDAD AND TOBAGO 0.86 0.44 4 0.72 0.52 2 0.41 0.25 5 0.51 0.31 3 0.49 0.26 4 0.51 0.30 2TUN TUNISIA 0.81 0.37 4 0.43 0.29 4 0.81 0.24 6 0.65 0.27 5 0.86 0.23 5 0.02 0.22 4TUR TURKEY 0.04 0.27 7 0.59 0.23 6 -0.16 0.18 10 -0.01 0.21 8 -0.48 0.18 10 -0.35 0.19 8TKM TURKMENISTAN -1.73 0.38 3 -1.93 0.27 3 -1.02 0.23 3 -0.97 0.22 4 -1.12 0.27 2 -1.29 0.26 3UGA UGANDA -0.20 0.37 4 0.18 0.29 5 -0.65 0.24 6 -0.01 0.25 6 -0.92 0.23 5 -0.47 0.21 5UKR UKRAINE -1.05 0.32 6 -0.72 0.22 6 -0.63 0.17 9 -0.71 0.17 9 -0.90 0.18 9 -0.89 0.17 9ARE UNITED ARAB EMIRATES 0.39 0.37 3 0.30 0.40 3 1.12 0.26 4 0.77 0.28 4 0.13 0.30 3 -0.03 0.27 3GBR UNITED KINGDOM 1.32 0.27 7 1.21 0.23 6 1.61 0.18 10 1.69 0.21 8 1.86 0.18 10 1.71 0.19 8USA UNITED STATES 1.19 0.27 7 1.14 0.23 6 1.58 0.18 9 1.25 0.21 8 1.45 0.19 9 1.41 0.20 7URY URUGUAY 0.95 0.31 6 0.95 0.40 3 0.63 0.21 8 0.27 0.28 4 0.71 0.20 8 0.43 0.25 4UZB UZBEKISTAN -1.17 0.37 4 -1.40 0.27 4 -0.71 0.20 6 -0.87 0.19 6 -0.66 0.20 5 -0.96 0.19 5VEN VENEZUELA -0.30 0.27 7 0.09 0.23 6 -0.81 0.18 9 -0.66 0.21 8 -0.59 0.19 9 -0.72 0.20 7VNM VIETNAM -0.50 0.34 4 -0.46 0.27 4 -0.57 0.19 7 -0.44 0.24 6 -0.76 0.19 7 -0.33 0.17 6WTB WEST BANK 0.49 0.96 1 -0.16 0.98 1 0.30 0.68 1 1.22 0.56 1 0.68 0.48 1 0.36 0.54 1WSM WESTERN SAMOA 0.23 0.64 1 .. .. .. 0.49 0.52 1 .. . . .. .. .. . . .. .. . .YEM YEMEN -0.30 0.54 2 -0.52 0.52 2 -1.12 0.31 4 -1.01 0.31 3 -0.70 0.29 3 -0.85 0.30 2YUG YUGOSLAVIA, FEDERAL REPUBLIC-0.70 0.71 1 -1.54 0.72 1 -0.94 0.25 3 -0.81 0.20 4 -1.04 0.24 3 -0.99 0.20 5ZAR Congo, Dem. Rep. (Zaire) -2.87 0.37 3 -2.34 0.40 3 -2.09 0.27 4 -2.15 0.35 3 -1.24 0.32 3 -1.56 0.48 2ZMB ZAMBIA 0.49 0.37 4 0.25 0.29 5 -0.39 0.24 6 -0.40 0.25 6 -0.87 0.23 5 -0.61 0.21 5ZWE ZIMBABWE -1.66 0.34 5 -0.34 0.23 6 -0.94 0.21 6 -0.15 0.23 7 -1.08 0.23 5 -0.32 0.18 7 Note: “Est” refers to the point estimate of governance. “S.E.” refers to the standard error. “N” refers to the number of sources in which the country appears. Governance indicators are oriented so that higher values correspond to better outcomes, on a scale from –2.5 to 2.5. These ratings are based on subjective assessments from a variety of sources, are subject to substantial margins of error as indicated, and in no way reflect the official view of the World Bank, its Executive Directors, or the countries they represent.

44
Table 4 – Regression Results
OLS IV First-Stage
Dependent Variable ln(Per Capita GDP) ln(Per Capita GDP) Governance
Intercept 7.867 7.845 2.445(0.051) (0.058) (0.284)
Governance 0.999 1.370(0.055) (0.095)
Imputed Settler Mortality -0.547(0.064)
SD(Residuals) 0.630 0.820 0.741
# Observations 153 153 153R-Squared 0.69 0.69 0.37
Table 5 – Identifying the Effects of Income on Governance
ρ=0σu= 0.27 0.30 0.35 0.40 0.45 0.50 0.54
γ -1.28 -1.15 -0.90 -0.62 -0.29 0.07 0.39δ -1.51 -1.41 -1.22 -1.01 -0.77 -0.49 -0.25σv 1.68 1.56 1.35 1.10 0.81 0.49 0.21
σu=0.27ρ= -0.20 -0.10 0.00 0.10 0.20
γ -0.48 -0.78 -1.28 -2.27 -5.32δ -0.90 -1.14 -1.51 -2.25 -4.54σv 1.03 1.27 1.68 2.51 5.14

45
Figure 1 – Governance and Per Capita Incomes in LAC
Voice and Accountability
ARG
BHSBLZ
BOL
BRACHL
COL
CRI
DOM
ECU
GTM
GUY
HND
HTI
JAM
MEX
NIC
PAN
PER
PRY
SLV
SUR TTO
URY
VEN
y = 0.5336x - 4.1189R
2 = 0.43
-2.5
-2
-1.5
-1
-0.5
0
0.5
1
1.5
2
5 5.5 6 6.5 7 7.5 8 8.5 9 9.5 10
ln(Real Per Capita GDP at PPP, 1996)
Go
vern
ance
Ind
icat
or
Political Stability
ARGBHS
BLZ
BOL
BRA
CHL
COL
CRI
DOM
ECUGTMGUY
HND
HTI
JAM
MEX
NIC
PAN
PER
PRY
SLV
SURTTO
URY
VEN
y = 0.6089x - 4.8066R2 = 0.5792
-3
-2.5
-2
-1.5
-1
-0.5
0
0.5
1
1.5
2
5 5.5 6 6.5 7 7.5 8 8.5 9 9.5 10
ln(Real Per Capita GDP at PPP, 1996)
Go
vern
ance
Ind
icat
or
Note: The governance ratings on the vertical axis are based on subjective assessments from a variety of sources, are subject to substantial margins of error, and in no way reflect the official view of the World Bank, its Executive Directors, or the countries they represent.

46
Figure 1, cont’d – Governance and Per Capita Incomes in LAC
Government Effectiveness
ARG
BHS
BLZ
BOLBRA
CHL
COL
CRI
DOM
ECU
GTM
GUY
HND
HTI
JAM
MEX
NIC
PANPER
PRY
SLV
SUR
TTOURY
VEN
y = 0.6815x - 5.3762R
2 = 0.6666
-3
-2.5
-2
-1.5
-1
-0.5
0
0.5
1
1.5
2
2.5
5 5.5 6 6.5 7 7.5 8 8.5 9 9.5 10
ln(Real Per Capita GDP at PPP, 1996)
Go
vern
ance
Ind
icat
or
Regulatory Quality
ARG
BHS
BLZ
BOL
BRA
CHL
COL
CRIDOM
ECUGTM
GUYHND
HTI
JAMMEX
NIC
PAN
PER
PRY
SLV
SUR
TTOURY
VEN
y = 0.4846x - 3.7531R2 = 0.4677
-4
-3
-2
-1
0
1
2
3
5 5.5 6 6.5 7 7.5 8 8.5 9 9.5 10
ln(Real Per Capita GDP at PPP, 1996)
Go
vern
ance
Ind
icat
or
Note: The governance ratings on the vertical axis are based on subjective assessments from a variety of sources, are subject to substantial margins of error, and in no way reflect the official view of the World Bank, its Executive Directors, or the countries they represent.

47
Figure 1, cont’d – Governance and Per Capita Incomes in LAC
Rule of Law
ARG
BHSBLZ
BOLBRA
CHL
COL
CRI
DOM
ECU
GTM
GUY
HND
HTI
JAM MEX
NIC
PAN
PER
PRYSLV SUR
TTO
URY
VEN
y = 0.6851x - 5.3668R
2 = 0.6889
-2.5
-2
-1.5
-1
-0.5
0
0.5
1
1.5
2
2.5
5 5.5 6 6.5 7 7.5 8 8.5 9 9.5 10
ln(Real Per Capita GDP at PPP, 1996)
Go
vern
ance
Ind
icat
or
Control of Corruption
ARG
BHS
BLZ
BOL
BRA
CHL
COL
CRI
DOM
ECU
GTM
GUYHND
HTI
JAM
MEX
NIC
PAN
PER
PRY
SLV
SUR
TTO
URY
VEN
y = 0.6482x - 5.106R
2 = 0.5963
-2
-1.5
-1
-0.5
0
0.5
1
1.5
2
2.5
5 5.5 6 6.5 7 7.5 8 8.5 9 9.5 10
ln(Real Per Capita GDP at PPP, 1996)
Go
vern
ance
Ind
icat
or
Note: The governance ratings on the vertical axis are based on subjective assessments from a variety of sources, are subject to substantial margins of error, and in no way reflect the official view of the World Bank, its Executive Directors, or the countries they represent.

48
Figure 2: Imprecision of Estimates of Governance
Rule of Law 2000/01(1997/98 Values Indicated as Dots)
-2.5
-2
-1.5
-1
-0.5
0
0.5
1
1.5
2
2.5
AFG
AG
O
KEN
NG
A
HN
D
MM
ZW
E
IDN
BLR AZE BIH
KG
Z
ML
I
UK
R
BEN
PER
GA
B
ME
X
KH
M
AR
M
LKA
CH
N
SEN
LBN
BG
R
TZA
IND
MY
S
MN
G
WS
GR
C
BW
A
TW
BH
S
CY
P
OM
N
BR
B
BR
N
DE
U
NLD
NO
R
FIN
CH
E
Note: This graph shows estimates of the indicated dimension of governance (on the vertical axis) for all countries for which data is available (on the horizontal axis) for 2000/01. The vertical bars show the statistically-likely range of values of governance for each country, with the midpoint of each bar corresponding to the best single estimate. The length of these bars varies with the amount of information available for each country, and the extent to which information from different sources correspond with each other. Estimates of governance for 1997/98 are indicated as dots. Selected countries are indicated on the horizontal axis. As emphasized in the text, the ranking of countries along the horizontal axis is subject to significant margins of error, and this ordering in no way reflects the official view of the World Bank, its Executive Directors, or the countries they represent.

49
Figure 3: Causal Effects of Governance on Per Capita Incomes
IV Regression of Per Capita Income on Governance
VEN
URY
TTO
SUR
SLVPRYPER
PAN
NIC
MEX
JAM
HTI
HNDGUY
GTM
ECU
DOM
CRICOL
CHL
BRA
BOL
BLZ
BHS
ARG
5
5.5
6
6.5
7
7.5
8
8.5
9
9.5
10
-2 -1.5 -1 -0.5 0 0.5 1 1.5 2
Governance 2000/01
log(
Rea
l Per
Cap
ita G
DP
)
First-Stage Regression of Governance on History
VEN
URY
TTO
SUR SLV
PRY
PER
PAN
NIC
MEX JAM
HTI
HND
GUY
GTM
ECU
DOM
CUB
CRI
COL
CHL
BRABOL
BLZBHS
ARG
y = -0.5365x + 2.3335
R2 = 0.3186
-2.5
-2
-1.5
-1
-0.5
0
0.5
1
1.5
2
2.5
2 3 4 5 6 7 8
log(Settler Mortality)
Gov
erna
nce
2000
/01
Note: The bold (solid) line in the top panel represent the IV and OLS regression lines respectively. The governance ratings are based on subjective assessments from a variety of sources, are subject to substantial margins of error, and in no way reflect the official view of the World Bank, its Executive Directors, or the countries they represent.

50
Figure 4 – Determinants of Governance in LAC
-4 -3 -2 -1 0 1 2 3 4
VEN
VCT
URY
TTO
SUR
SLV
PRY
PER
PAN
NIC
MEX
KNA
JAM
HTI
HND
GUY
GTM
ECU
DOM
DMA
CRI
COL
CHL
BRA
BOL
BLZ
BHS
ARG
Governance Index
IncomeHistoryOther
Note: The governance ratings on the vertical axis are based on subjective assessments from a variety of sources, are subject to substantial margins of error, and in no way reflect the official view of the World Bank, its Executive Directors, or the countries they represent.

51
Fig. 6: Measuring State Capture in Transition
0
5
10
15
20
25
30
35
40
45
Proportion of firms affected by capture of..
Russia Ukraine
ParliamentaryVotes
PresidentialAdministrativeDecreesCivil courtDecrees
Source: J. Hellman, G. Jones, D. Kaufmann. 2000. “Seize the State, Seize the Day: State Capture, Corruption and Influence in Transition” World Bank Policy Research Working Paper 2444.
Fig. 8: Judicial and Administrative Corruption(View of the Firm, GCS 2000)
1
4
7
EcuadorBoliv
ia Peru
VenezuelaMexic
o
El Salvador Chile LAC
Indonesia Russia
Transitio
n Economies Afric
a
Corruption in the Judiciary Administrative Corruption
Source: Global Competitiveness Survey, 2000
High Extent of Corruption
Fig. 5: Judicial and Administrative Corruption (View of the Firm, GCS 2000)

52
Fig. 7: ‘Captor’ Firms Grow much faster – in High Capture States
0
5
10
15
20
25
30
35
Ent
erpr
ise
outp
ut g
row
th
(3-y
ear)
High Capture Economies
'Captor' firms Other firmsSource: J. Hellman, G. Jones, D. Kaufmann. 2000. “Seize the State, Seize the Day: State Capture, Corruption and Influence in Transition”World Bank Policy Research Working Paper 2444.
Fig. 8: Yet Growth by captors comes at a large Governance Cost to Society:
Greater Property Rights Insecurity for All Others
10
20
30
40
50
60
70
Low Capture State High Capture State
% Share of Firms with Secure Property Rights
Source: J. Hellman, G. Jones, D. Kaufmann. 2000. “Seize the State, Seize the Day: State Capture, Corruption and Influence in Transition”World Bank Policy Research Working Paper 2444.

53
Fig. 9: Peru and Colombia: Extent of "State Capture" by Fig. 9: Peru and Colombia: Extent of "State Capture" by elite unduly influencing laws and regulations elite unduly influencing laws and regulations
(as reported by public officials, 2001)
30 50 70 90
Central Bank decisions
Regulatory Agencies
High Officials (influencing presidentialdecrees/decisions)
Judiciary (influencing major courtdecisions)
Parliamentarians (to influence laws)
Colombia
Peru
% public officials report bribes to agency influence business climate
Capture by Vested Interests of:
Fig. 10: Peru: Sources of Undue Private Influence on the State
10
40
70
100
Drug conglomerates
Economic Groups
FDI/ Transnational Corporations
Other Organized
Crime
Professional Associations
Labor Unions
% r
epor
ting
agen
t is
high
ly in
fluen
tial
Firms Public officials Based on governance diagnostic surveys of public officials and enterprises
Responses by:

54
Ombudsman
NationalComptroller
CentralBank
Mun.SantaCruz Justice-SantaCruz Mun.VallaGrande
Prosecutor-SantaCruz NationalCustoms
ElectoralCourt
Prosecutor-LaPaz
JudicialCouncil Tax-SantaCruz
WorkersCourt Court-LaPaz
Police-SantaCruz
0
20
40
60
80
100
0 10 20 30 40 50 60 Citizen Voice/Feedback Mechanisms
Bri
ber
y
r = - .45
11b: Bribery and Citizen Voice in Bolivia's Public Institutions
High
High
Low
Low
CentralBank ConstitutionalTribune
CustomsCochabamba CustomsSantaCruz
HealthCochabamba HighCourt-LaPaz HighCourt-SantaCruz JudicialCouncil
NatComptroller
NatCustoms NatPolice
Ombudsman
PoliceSantaCruz
TaxSantaCruz
JusticeSantaCruz
0
20
40
60
80
100
30 40 50 60 70 80 90 Transparency within Agencies
Bri
ber
y High
High Low
Low
11a: Bribery and Transparency in Bolivia's Public Institutions
r = - . 54
Figure 11a-b: Performance and Governance in Bolivia’s Public Institutions Empirical Analysis of Public Officials Survey1
1 Source: Kaufmann, D., G. Mehrez, and T. Gurgur (2002): “Voice or Public Sector Management?: An Empirical Investigation of the Determinants of Public Sector Performance Based on a Survey of Public Officials in Bolivia”, World Bank Institute. Draft.

55
TaxSantaCruz
TaxCochabamba
Pref.LaPaz
PoliceSantaCruz
Ombudsman
NatCustoms
NatComptoller
JudicialCouncil
ImmigrationSantaCruz
HighCourt -SantaCruz
HighCourt-LaPaz
HealthCochabamba
CustomsSantaCruz
CustomsCochabamba
ConstitutionalTribune
CentralBank
20
40
60
80
100
0 10 20 30 40 50 60 Wage Level Satisfaction
Ser
vice
Del
iver
y P
erfo
rman
ce
High
High
Low
Low
11c: Service Delivery and Wage Satisfaction in Bolivia's Public Institutions
r = .13
1 Source: Kaufmann, D., G. Mehrez, and T. Gurgur (2002): “Voice or Public Sector Management?: An Empirical Investigation of the Determinants of Public Sector Perf ormance Based on a Survey of Public Officials in Bolivia”, World Bank Institute. Draft.
Figure 11c: Performance and Governance in Bolivia’s Public Institutions Empirical Analysis of Public Officials Survey1