g.s. (geoff) strong craig smith2, and danny brown · 2 definition: mixing ratio is the ratio of the...
TRANSCRIPT

1
1 Atmospheric Scientist (ret. EC 1998), Adj. Prof. UofA/EAS
- DRI Investigator (Thunderstorm Drought)
- Alberta thunderstorms (since 1973)
- Atmospheric moisture budgets (MAGS), climatic cycles2 Climate Scientist, Envir. Can., Saskatoon3 M.Sc grad. UofA/EAS
Seasonal stream 8 km ENE Ardrossan
Land Surface (Moisture Flux) Feedbacks
on Drought and on Thunderstorms
G.S. (Geoff) Strong1,
Craig Smith2, and Danny Brown3

2
Definition: Mixing Ratio is the ratio of the mass of water vapour (g)
to the mass of dry air (kg) at a given pressure
– an expression of the absolute humidity.
Advantage of using mixing ratio over other moisture variables:
=> conservative w.r.t. elevation changes.
Humidity Variable:

3
Transect E-W through Sundre (pop. 2,500)
13 July 2008
Canola/barley Canola
small urban
dry island

4
Objectives:
1. Quantify urban dry (heat) island across Edmonton (pop. 780,000)
using mobile transects- carried out 22 transect days (more than double that no. of transects)
2. Quantify a) horiz. moisture gradient from crop - road during transects,
and possibly collect some b) vertical moisture profiles over a crop.- quantified horizontal gradient at least a dozen times
- obtained 4 sample vertical moisture profiles (to 3 m) over canola crops
In parallel:
3. Fixed horizontal Transects and vertical Profiles (to 6 m)
across pasture/barley at Kenaston SK
5. Carried out photo/data drought survey, Edmonton to Saskatoon- http://www.drinetwork.ca/current_drought.php
4. Monitor local drought conditions (photos) in Strathcona County
2009 Edmonton Mobile Transects

5
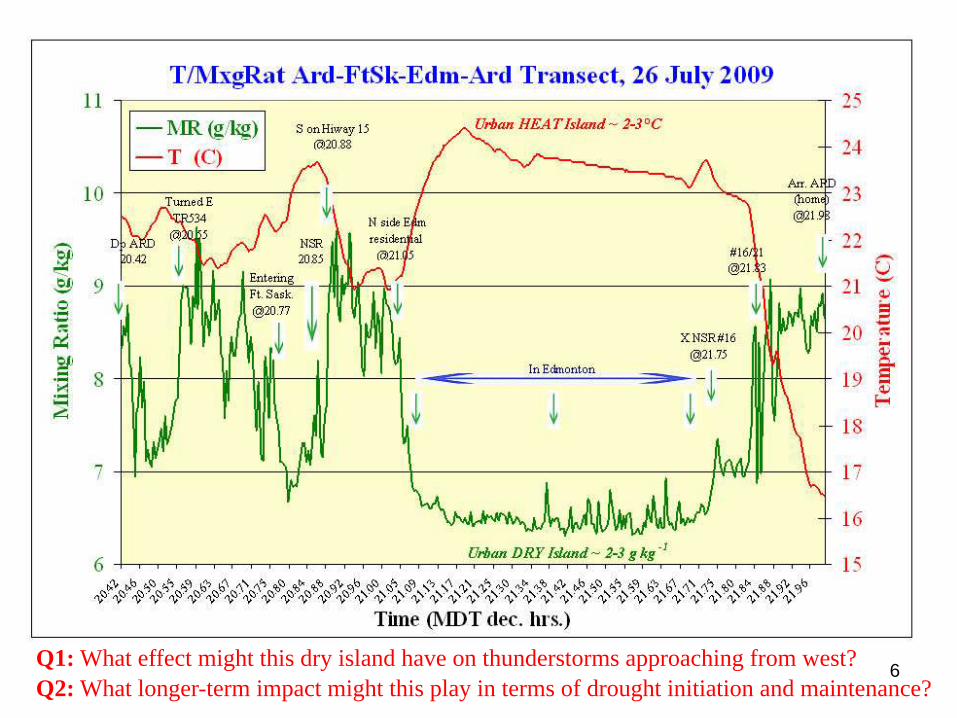
6Q1: What effect might this dry island have on thunderstorms approaching from west?
Q2: What longer-term impact might this play in terms of drought initiation and maintenance?

7

8
2009 Edmonton Vertical Profiles
July 27
Aug.08
Aug.07
Aug. 07

9
Spot Profile ‘P4’ (S of Ft. Sask.)12:05 MDT, 08 Aug. 2009
12:19 MDT, 08 Aug. 2009
12:06 MDT, 08 Aug. 2009
Wind Sock
Note: Due to low precipitation and lack of soil moisture, crops were 2-3 weeks behind.

10
Lower Surface Layer
(below 150 cm)

11
Kenaston ‘pasture’ site
Kenaston ‘transition’ site
Kenaston ‘barley’ site
T/RH at
0.5
1.5
3.0
6.0 m
T/RH at
1.5 m
In addition: Pressure, Wind (3 levels), radiation,
eddy correlation, precipitation, and soil moisture
(~ 1 km baseline)
P/T/RH at
0.5
1.5
3.0 m
2009 Kenaston SK fixed Profiles

12
CONCLUSIONS
Horizontal Profiles (Transects – applies to agricultural districts):
Vertical Profiles:
1. Small Towns (<5,000 pop.) – urban heat island ~ +0.1 C, dry island is -0.4 g kg-1
2. Small Cities (5-15,000) – heat island ~ +0.2 C, dry island, -0.6 g kg-1
3. Larger Cities (>500,000) – heat island +1-3 C, dry island, -2 to -3 g kg-1
4. These results are valid for afternoon situations following mixing, which suggests
that the results (dry island) may apply for the well-mixed ABL.
If so, these factors might:=> a) dramatically affect thunderstorms approaching the city from west (Example 21 Aug.)
b) contribute to initiation/maintenance of drought region downstream (curr. drought?)
Requires low-level soundings (16Z/20Z over/downstream of Edmonton (+ WSE).
5. Inner surface layer over crops (lowest 1-2 m) caused by crop ET that enhances
convective cloud potential significantly, providing an additional 2-4 g kg-1
mixing ratio (through daily ET) above the background ABL moisture.
6. Most of the diurnal increase (ET) occurs during late-morning (14-1600 UTC),
which coincides with severe storm ABL changes observed during LIMEX-85.

13
Google-Earth view of Twin Island Lake
~ 5 km due south from where I livePhoto of Twin Island Lake, 22 Aug. 2009
DROUGHT Impacts (east/south of Edmonton)
Traditionally been an
airpark for float planes.
P
The End – Thank you!

14

15
Could the Edmonton
urban dry island be
playing some critical
role in the current
drought over eastern
Alberta?
Installation of new septic tank – dry clay down to 18 feet –20 Oct. 2009
Drought near Edmonton
essentially on-going
since 1999.