gsfc atmospheres instrument report 2017 - earth
TRANSCRIPT

November 2017
NASA/TP–2017-219025
Atmospheric Instrument Systems and Technology in the Goddard Earth Sciences Division

Cover Photo Captions
GCAS was developed in the IRAD program and is designed to provide high spatial resolution (< 1 km) remote-sensing observations of tropospheric- and boundary-layer pollutants and aerosols in addition to providing coastal and open-ocean color measurement capabilities. It provides broad wavelength coverage, hyperspectral radiance, it is compact and easily deployable on a variety of aircraft. It has been deployed during Discover-AQ (KingAir), NAAMES (C-130), and GOES-R validation (ER-2)
TOP LEFT,
NASA’s Goddard Space Flight Center, Wallops Flight Facility in Wallops Island, Virginia, deployed an integrated S-band (2700–2900 MHz), dual-polarized antenna system. The antenna system consists of a parabolic reflector, dual-polarized feed horn, pedestal, drive motors, and servo-amplifiers. It is capable of emitting and receiving both horizontal and vertical linearly polarized RF energy. The antenna system is used as an integrated, transportable meteorological research radar, with all of the components constructed for shipment in standard ISO sea containers with outside dimensions of 2.44 m x 2.44 m x 6.1m (8 ft x 8 ft x 20 ft).
TOP RIGHT
Located in a remote area of Namibia to the southwest of Etosha National Park, the NASA Micro-Pulse Lidar Network’s (MPLNET) newest site is 100-percent solar-powered and is expected provide a long-term comprehensive dataset for the region. MPLNET is a federated network of micro-pulse lidar systems designed to measure aerosol and cloud vertical structure, as well as boundary layer heights. The data are collected continuously, day and night, over long time periods from sites around the world. Most MPLNET sites are co-located with sites in the NASA Aerosol Robotic Network.
BOTTOM LEFT
NASA successfully deployed Goddard Space Flight Center’s IceCube from the International Space Station at 7:55 a.m. EDT, May 16, 2017, as a spaceflight technology mission to present a new 883-GHz cloud ice radiometer. The system will demonstrate and validate the submillimeter-wave receiver developed to advance cloud ice remote-sensing and help scientists better understand the role of ice clouds in the Earth’s climate system.
BOTTOM RIGHT
Level of Review: This material has been technically reviewed by technical management.
Trade names and trademarks are used in this report for identification only. Their usage does not constitute an official endorsement,
either expressed or implied, by the National Aeronautics and Space Administration.
Notice for Copyrighted Information
This manuscript is a work of the United States Government authored as part of the official duties of employee(s) of the National
Aeronautics and Space Administration. No copyright is claimed in the United States under Title 17, U.S. Code. All other rights are
reserved by the United States Government. Any publisher accepting this manuscript for publication acknowledges that the United
States Government retains a non-exclusive, irrevocable, worldwide license to prepare derivative works, publish, or reproduce this
manuscript, or allow others to do so, for United States Government purposes.
National Aeronautics and Space Administration
Goddard Space Flight CenterGreenbelt, Maryland 20771
November 2017
NASA/TP–2017-219025
Atmospheric Instrument Systems and Technology in the Goddard Earth Sciences Division
NASA STI Program Mail Stop 148 NASA’s Langley Research Center Hampton, VA 23681-2199
National Technical Information Service 5285 Port Royal Road Springfield, VA 22161 (703) 605-6000
Since its founding, NASA has been dedicated to the advancement of aeronautics and space science. The NASA scientific and technical information (STI) program plays a key part in helping NASA maintain this important role.
The NASA STI program operates under the auspices of the Agency Chief Information Officer. It collects, organizes, provides for archiving, and disseminates NASA’s STI. The NASA STI program provides access to the NASA Aeronautics and Space Database and its public interface, the NASA Technical Report Server, thus providing one of the largest collections of aeronautical and space science STI in the world. Results are published in both non-NASA channels and by NASA in the NASA STI Report Series, which includes the following report types:
TECHNICAL PUBLICATION. Reports of completed research or a major significant phase of research that present the results of NASA Programs and include extensive data or theoretical analysis. Includes compilations of significant scientific and technical data and information deemed to be of continuing reference value. NASA counterpart of peer-reviewed formal professional papers but has less stringent limitations on manuscript length and extent of graphic presentations.
TECHNICAL MEMORANDUM. Scientific and technical findings that are preliminary or of specialized interest, e.g., quick release reports, working papers, and bibliographies that contain minimal annotation. Does not contain extensive analysis.
CONTRACTOR REPORT. Scientific and technical
findings by NASA-sponsored contractors and grantees.
CONFERENCE PUBLICATION. Collected papers from scientific and technical conferences, symposia, seminars, or other meetings sponsored or co-sponsored by NASA.
SPECIAL PUBLICATION. Scientific, technical, or historical information from NASA programs, projects, and missions, often concerned with subjects having substantial public interest.
TECHNICAL TRANSLATION. English-language translations of foreign scientific and technical material pertinent to NASA’s mission.
Specialized services also include organizing and publishing research results, distributing specialized research announcements and feeds, providing help desk and personal search support, and enabling data exchange services. For more information about the NASA STI program, see the following:
• Access the NASA STI program home page at http://www.sti.nasa.gov
• E-mail your question via the Internet to [email protected]
• Phone the NASA STI Information Desk at 757-864-9658
• Write to:
NASA STI Information Desk Mail Stop 148 NASA’s Langley Research Center Hampton, VA 23681-2199
NASA STI Program ... in Profile
Available from
Available in electron form at http://

Executive Summary
Studies of the Earth’s atmosphere require a comprehensive set of observations that rely on instruments flown on spacecraft, aircraft, and balloons as well as those deployed on the surface. Within NASA’s Goddard Space Flight Center (GSFC) Earth Sciences Division-Atmospheres, laboratories and offices maintain an active program of instrument system development and observational studies that provide: 1) information leading to a basic understanding of atmospheric processes and their relationships with the Earth’s climate system, 2) prototypes for future flight instruments, 3) instruments to serve as calibration references for satellite missions, and 4) instruments for future field validation campaigns that support ongoing space missions. Our scientists participate in all aspects of instrument activity, including component and system design, calibration techniques, retrieval algorithm development, and data processing systems. The Atmospheres Program has well-equipped labs and test equipment to support the development and testing of instrument systems, such as a radiometric calibration and development facility to support the calibration of ultraviolet and visible (UV/VIS), space-borne solar backscatter instruments.
This document summarizes the features and characteristics of 46 instrument systems that currently exist or are under development. The report is organized according to active, passive, or in situ remote sensing across the electromagnetic spectrum. Most of the systems are considered operational in that they have demonstrated performance in the field and are capable of being deployed on relatively short notice. Other systems are under study or of low technical readiness level (TRL). The systems described herein are designed mainly for surface or airborne platforms. However, two Cubesat systems also have been developed through collaborative efforts. The Solar Disk Sextant (SDS) is the single balloon-borne instrument.
The lidar systems described herein are designed to retrieve clouds, aerosols, methane, water vapor pressure, temperature, and winds. Most of the lasers operate at some wavelength combination of 355, 532, and 1064 nm. The various systems provide high sensitivity measurements based on returns from backscatter or Raman scattering including intensity and polarization. Measurements of the frequency (Doppler) shift of light scattered from various atmospheric constitutes can also be made.
Microwave sensors consist of both active (radar) and passive (radiometer) systems. These systems are important for studying processes involving water in various forms. The dielectric properties of water affect microwave brightness temperatures, which are used to retrieve atmospheric parameters such as rainfall rate and other key elements of the hydrological cycle. Atmosphere radar systems operate in the range from 9.6 GHz to 94 GHz and have measurement accuracies from -5 to 1 dBZ; radiometers operate in the 50 GHz to 874 GHz range with accuracies from 0.5 to 1 degree K; conical and cross-track scan modes are used.
Our passive optical sensors, consisting of radiometers and spectrometers, collectively operate from the UV into the infrared. These systems measure energy fluxes and atmospheric parameters such as trace gases, aerosols, cloud properties, or altitude profiles of various species. Imager spatial resolution varies from 37 m to 400 m depending on altitude; spectral resolution is as small as 0.5 nm.
Many of the airborne systems have been developed to fly on multiple aircraft.

ii Atmospheres 2017 Instrument Systems Report
In situ systems provide a wide range of unique observing capabilities that are used to validate satellites measurements and to better understand the interaction among atmospheric variables through direct observations. These observing systems consist of both ground and airborne sensors. Measurements are made with instruments such as rain gauges, disdrometers, gas analyzers, and laser-based detectors. A complete mobile facility (COMMIT), housed in a 20-foot trailer, has traveled widely over the globe to support numerous field and validation campaigns.
Instrument systems evolve and change over time, and therefore this report has been updated as required, typically every three to five years. The previous report was completed in 2011; 18 new instruments programs have begun since that time and are included in this 2017 report. An electronic version of this report is posted on the Earth Sciences Division-Atmospheres Website at: https://atmospheres.gsfc.nasa.gov/.
We want to thank all of the Laboratory members who contributed material on the various instrument systems, and especially the efforts of Chuck Cote (SSAI) and Omega Williams (610) who managed and coordinated the report preparation as well as Judith Clark (TIMS) for formatting, proofreading, and editing support.
Sincerely,
Steven Platnick Karen Mohr Deputy Director for Atmospheres Associate Deputy Director for Atmospheres
Atmospheres 2017 Instrument Systems Report iii
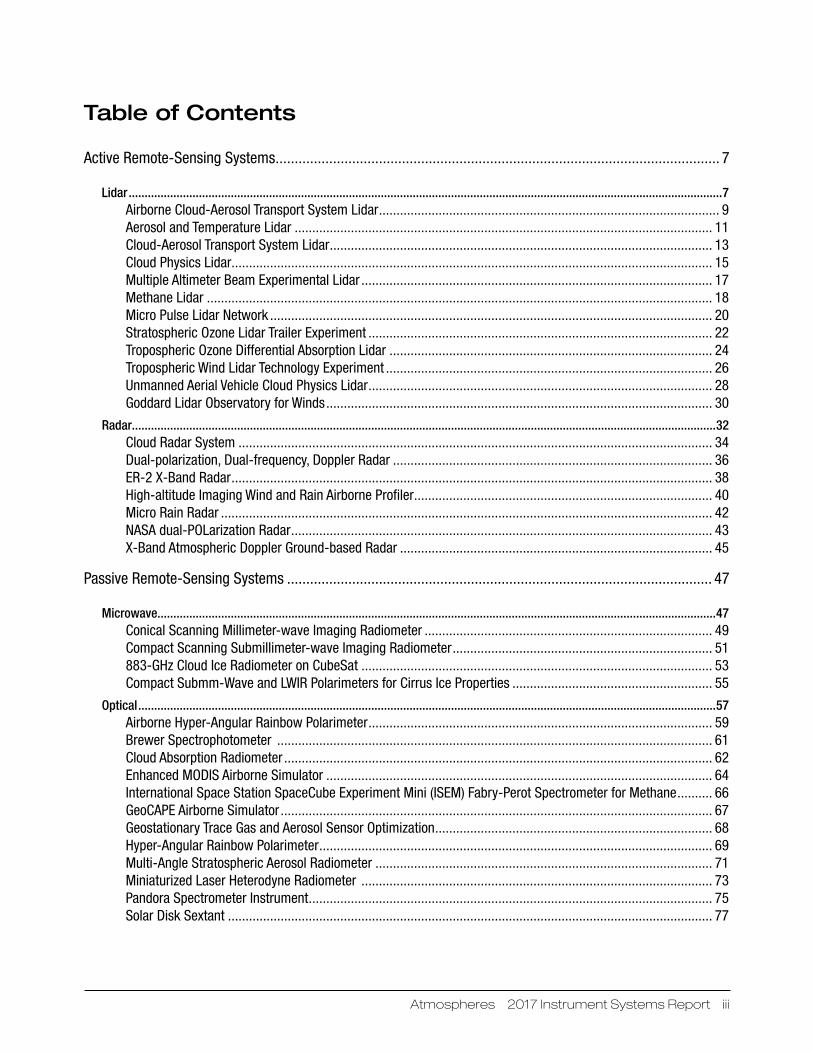
Table of Contents
Active Remote-Sensing Systems .................................................................................................................... 7
Lidar ..........................................................................................................................................................................................7Airborne Cloud-Aerosol Transport System Lidar ................................................................................................. 9Aerosol and Temperature Lidar ....................................................................................................................... 11Cloud-Aerosol Transport System Lidar ............................................................................................................. 13Cloud Physics Lidar......................................................................................................................................... 15Multiple Altimeter Beam Experimental Lidar .................................................................................................... 17Methane Lidar ................................................................................................................................................ 18Micro Pulse Lidar Network .............................................................................................................................. 20Stratospheric Ozone Lidar Trailer Experiment .................................................................................................. 22Tropospheric Ozone Differential Absorption Lidar ............................................................................................ 24Tropospheric Wind Lidar Technology Experiment ............................................................................................. 26Unmanned Aerial Vehicle Cloud Physics Lidar .................................................................................................. 28Goddard Lidar Observatory for Winds .............................................................................................................. 30
Radar.......................................................................................................................................................................................32Cloud Radar System ....................................................................................................................................... 34Dual-polarization, Dual-frequency, Doppler Radar ........................................................................................... 36ER-2 X-Band Radar ......................................................................................................................................... 38High-altitude Imaging Wind and Rain Airborne Profiler ..................................................................................... 40Micro Rain Radar ............................................................................................................................................ 42NASA dual-POLarization Radar ........................................................................................................................ 43X-Band Atmospheric Doppler Ground-based Radar ......................................................................................... 45
Passive Remote-Sensing Systems ............................................................................................................... 47
Microwave...............................................................................................................................................................................47Conical Scanning Millimeter-wave Imaging Radiometer .................................................................................. 49Compact Scanning Submillimeter-wave Imaging Radiometer .......................................................................... 51883-GHz Cloud Ice Radiometer on CubeSat .................................................................................................... 53Compact Submm-Wave and LWIR Polarimeters for Cirrus Ice Properties ......................................................... 55
Optical .....................................................................................................................................................................................57Airborne Hyper-Angular Rainbow Polarimeter .................................................................................................. 59Brewer Spectrophotometer ............................................................................................................................ 61Cloud Absorption Radiometer .......................................................................................................................... 62Enhanced MODIS Airborne Simulator .............................................................................................................. 64International Space Station SpaceCube Experiment Mini (ISEM) Fabry-Perot Spectrometer for Methane .......... 66GeoCAPE Airborne Simulator ........................................................................................................................... 67Geostationary Trace Gas and Aerosol Sensor Optimization ............................................................................... 68Hyper-Angular Rainbow Polarimeter ................................................................................................................ 69Multi-Angle Stratospheric Aerosol Radiometer ................................................................................................ 71Miniaturized Laser Heterodyne Radiometer .................................................................................................... 73Pandora Spectrometer Instrument ................................................................................................................... 75Solar Disk Sextant .......................................................................................................................................... 77

iv Atmospheres 2017 Instrument Systems Report
In situ Measurement Systems ................................................................................................................................................79Two-dimensional Video Disdrometer ............................................................................................................... 81Compact Airborne Formaldehyde Experiment .................................................................................................. 83CARbon Airborne Flux Experiment ................................................................................................................... 84Chemical, Optical, and Microphysical Measurements of In situ Troposphere ................................................... 86Tipping Bucket Rain Gauges ........................................................................................................................... 87In situ Airborne Formaldehyde ......................................................................................................................... 88Parsivel2 Disdrometer ...................................................................................................................................... 89Precipitation Imaging Package ........................................................................................................................ 91PLUVIO2 Precipitation Gauges .......................................................................................................................... 93
Mobile Laboratories ..................................................................................................................................... 95
Integrated Active/Passive ......................................................................................................................................................95Aerosol-Cloud-Humidity Interactions Exploring and Validating Enterprise ......................................................... 97Surface-sensing Measurements for Atmospheric Radiative Transfer ................................................................ 99
Acronyms .................................................................................................................................................. 103

Atmospheres 2017 Instrument Systems Report v
Scientific Products and Measurements ParametersAtmospheric Scientists in the Earth Sciences Division are constantly seeking new opportunities for instrument concepts that promote NASA Earth Science objectives, leading eventually to new space-based remote-sensing sys-tems. The approach that is used to accomplish this is the scientific process shown in Figure 1. The process begins with a scientific question raised by a NASA goal or objective and proceeds through the various phases and results in new science outcomes. This science-to-science approach is repeated with each new opportunity.
During the process, mission goals are formulated to address an important scientific problem, hypothesis, or both. Definition of the measurement requirements is a key process and identifies the geophysical parameters of spe-cific interest to investigators. Instrument development begins with a concept definition and design followed by syn-thesis and fabrication. Laboratory and field models are then built and tested. Stringent requirements are placed on measurement accuracies in order to understand fully the complexity and vari-ability of Earth science processes. This requires careful attention to calibration procedures to remove error sources and biases from instruments and data-processing algorithms. Uncertainties are uncovered and characterized through field and sub-orbital campaigns that pro-vide feedback to hardware or software designs to improve accuracy and per-formance. These lead to a better under-standing of physical parameters in the context of retrievals of these parameters from remote sensing. Field campaigns may be carried out jointly between gov-ernment organizations, universities and other research institutions, under agency, or national or international pro-grams. The successive feedback and refinement process continues throughout the lifetime of all atmospheric instrument systems. Calibration and Validation (CalVal) is therefore an essential element of Earth science research prior to and during flight operations. Some ground validation systems take the form of complete multi-instrument mobile vans or trailers that are never intended for space. They provide measurements to validate space-derived products, including calibration.
The final phases shown in Figure 1 are space flight and the generation of scientific outcomes (products) derived from sensor measurements. As systems migrate through the various phases of the NASA project cycle, Principal Investigators (PIs) and Instrument Scientists have the responsibility to ensure that scientific integrity is maintained throughout all development and testing phases. They are essential participants and stakeholders in any decision process that affects the performance or cost of an instrument, and are responsible to the scientific community to explain any constraints imposed by limited resources or schedule.
Hypothesis, Questions
Proposals and Studies Data Sets
Review Mission Goals
Scie
ntifi
c U
nder
stan
ding
Define Scientific Requirements and Geophysicial Parameters
Time
Field and Sub-orbital Demonstrations and CalibrationInstrument Systems
Development
Space Flight
Science Outcome• Models• Findings• Publications
Earth Sciences Division – Atmospheres
Figure 1. Instrument Systems Development (in orange) is the subject of this report.
vi Atmospheres 2017 Instrument Systems Report
Data are the primary product of NASA experimentation and provide the underpinnings for all scientific findings and outcomes. Raw data are transformed into products through data-processing algorithms. Design, development, and testing of retrieval algorithms is an essential aspect of the scientific measurement process. Regional or global computer models are used to place the data in a larger context and derive useful information. They add to our existing knowledge and enhance our capability to draw conclusions relative to the original scientific formulation and hypothesis.
Peer reviewed publications are essential to the success of an experimental campaign or mission. Laboratory sci-entists have established an impressive record of publications and citations over the years based on data products from various stages of the instrument formulation, from laboratory fabrication to space flight. A list of yearly publica-tions can be found the Atmospheric website: http://atmospheres.gsfc.nasa.gov/.
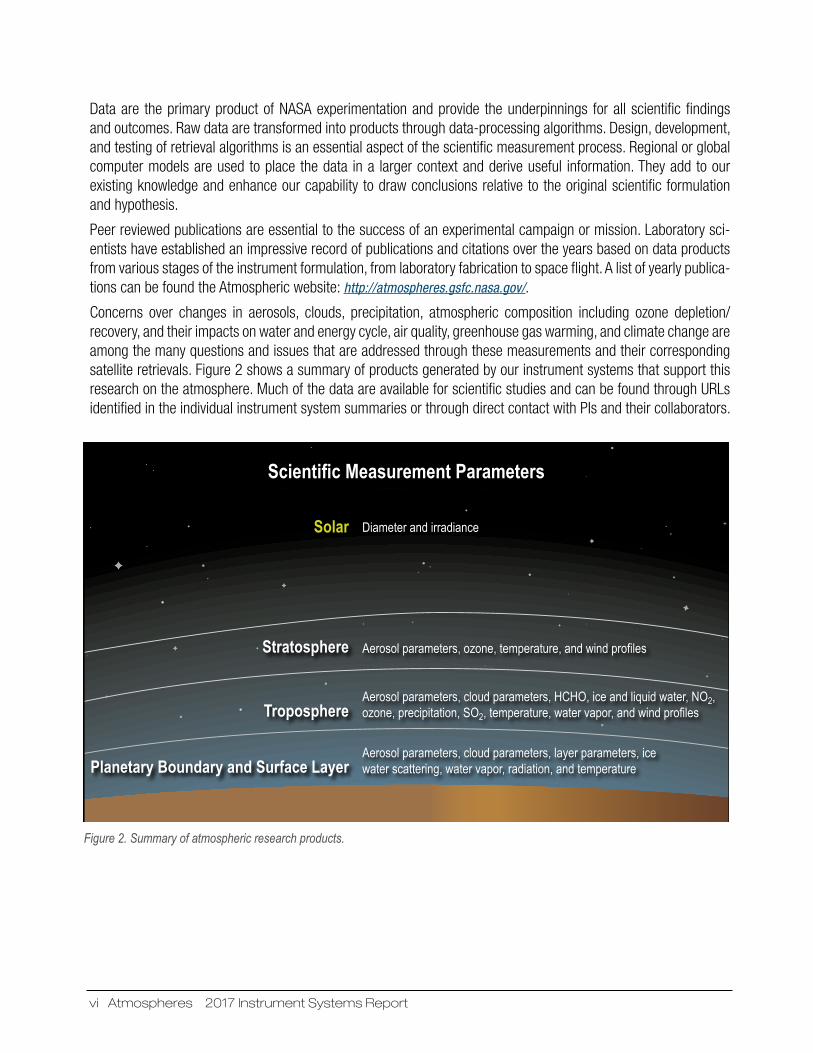
Concerns over changes in aerosols, clouds, precipitation, atmospheric composition including ozone depletion/recovery, and their impacts on water and energy cycle, air quality, greenhouse gas warming, and climate change are among the many questions and issues that are addressed through these measurements and their corresponding satellite retrievals. Figure 2 shows a summary of products generated by our instrument systems that support this research on the atmosphere. Much of the data are available for scientific studies and can be found through URLs identified in the individual instrument system summaries or through direct contact with PIs and their collaborators.
Figure 2. Summary of atmospheric research products.
Planetary Boundary and Surface LayerAerosol parameters, cloud parameters, layer parameters, ice water scattering, water vapor, radiation, and temperature
TroposphereAerosol parameters, cloud parameters, HCHO, ice and liquid water, NO2, ozone, precipitation, SO2 temperature ater apor and ind profiles
Stratosphere erosol parameters o one temperature and ind profiles
Solar Diameter and irradiance
Scientific Measurement Parameters

Atmospheres 2017 Instrument Systems Report 7
Active Remote-Sensing Systems
Lidar

8 Atmospheres 2017 Instrument Systems Report

A picture of (a) the current ACATS instrument includes (b) the
receiver subsystem and (c).the telescope subsystem.
ACATSAirborne Cloud-Aerosol Transport System Lidar
Key ACATS Facts• Heritage: Cloud Physics Lidar (CPL)• ER-2 airborne lidar for cloud and aerosol profiling. Provides
cloud/layer boundary, depolarization ratio, optical depth, and extinction ratios.
• Participated in several small field campaigns, including WAVE-2012, CCAVE, and ICESat-2 demonstration flights.
• Nominal Flight Characteristics: 65,000 ft (20 km), above 94 percent of Earth’s atmosphere. Multiple 45 degree viewing angles, 8 h duration time.
DescriptionLidar remote sensing is a proven useful tool for profiling the structure of atmospheric cloud and aerosol features. In addition to basic intensity information, backscattered photons inherently possess other microphysical attributes, such as Doppler shift caused by the mean motion of the scattering medium. Thus, a lidar system capable of resolving the Doppler shifts inherent to atmospheric motions can simultaneously provide information about both the scattering intensity and the particle motion.
The Airborne Cloud-Aerosol Transport System (ACATS) is a relatively new instrument that has flown several times on NASA aircraft. The ACATS instrument is a lidar that is both a Doppler lidar and, by its very nature, a high spectral
resolution lidar (HSRL). The HSRL aspect of ACATS will provide information on cloud and aerosol height, internal structure, and optical properties (e.g., extinction). The Doppler aspect adds capability to derive wind motion, which in turn enables studies of aerosol transport and cloud motion. The technology developed has direct application to future spaceborne missions, such as the proposed Aerosol-Cloud-Ecosystems (ACE) mission and will provide critical validation capability for future missions.
The ACATS lidar is an aerosol-based fringe-imaging HSRL/ Doppler lidar. The fringe-imaging method measures the Doppler shift of the spectral return by observing the signal spectroscopically (i.e., as a function of wavelength) using a spectral-resolving filter and a multi-element detector. A unique aspect of the fringe-imaging Doppler lidar concept is that it is also, by its very nature, an HSRL. Because the broad
Rayleigh-scattered spectrum is imaged as a nearly flat background (and can be characterized and removed from the total signal) the aerosol scattered signal can be directly and unambiguously measured. The integral of the aerosol-scattered spectrum is, in fact, analogous to the aerosol measurement made with a typical iodine filter HSRL instrument.
Designed for operation on high- altitude aircraft, the ACATS lidar instrument provides a combination of backscatter lidar, Doppler lidar, and HSRL. Although it is an HSRL, the single-wavelength ACATS lidar is designed to enable aerosol transport studies. In addition, the need to point off-nadir for wind measurements inherently enables cross-track cloud and aerosol measurements.
The ACATS lidar also provides an important technology demonstration for a future global wind system. Global wind measurements from space are recognized as an essential and unfulfilled measurement capability. Although different lidar techniques are being evaluated, no single method is yet mature enough to propose as a definitive space-based system. Because of the numerous difficulties inherent in the measurement, it is unknown if any of the methods currently being evaluated will result in either a successful demonstration of wind measurement technology or a system that is scalable to space platforms. Demonstration flights of the ACATS lidar will permit both science and engineering evaluation of an alternate approach to the measurement.
Active Remote-Sensing Systems: Lidar
Atmospheres 2017 Instrument Systems Report 9

ACATS Data Products• Particulate backscatter • Layer boundaries for aerosols and clouds• Layer and column optical depth• Particulate extinction profile• Horizontal wind speed and direction
ACATS Instrument Parameters• Wavelength: 532 nm• Laser repetition rate: 200 Hz• Laser energy: 10mJ at 532 nm• Telescope diameter: 8 in• Total power: <1500 W• Weight: <120 kg• FOV: 200 microradians• Vertical resolution: 60 m (aerosol), 450 m (wind)• Horizontal resolution: 200 m (standard), 5 km (wind &
HSRL)
Principal InvestigatorJohn Yorks NASA’s Goddard Space Flight Center [email protected]
Co-InvestigatorsMatthew McGill NASA’s Goddard Space Flight CenterStanley Scott NASA’s Goddard Space Flight CenterAndrew Kupchock Science Systems and Applications, Inc.Scott Ozog University of Maryland
Scientific Questions for Future Campaigns• What are the fluxes of aerosols in high transport regions?• What is the outflow speed in anvil cirrus associated with
tropical and convective storms?
Future Plans• Provide demonstration measurements for ACE and future
space-based lidar missions.• Yearly campaigns supporting various Earth Science
missions or experiments.
ReferencesYorks, J. E., M. McGill, V. S. Scott, A. Kupchock, S. Wake, D. Hlavka, W. Hart, P. Selmer (2014), The Airborne Cloud-Aerosol Transport System: Overview and Description of the Instrument and Retrieval Algorithms, J. Atmos. Oceanic Technol., 31, 2482–2497, doi:10.1175/JTECH-D-14-00044.1.
Active Remote-Sensing Systems: Lidar
10 Atmospheres 2017 Instrument Systems Report

AT Lidar operating at GSFC; 532 nm beam is clearly visible.
AT LidarAerosol and Temperature Lidar
Key AT Lidar Facts• Heritage: Originally designed for stratospheric parameters;
modified to include the troposphere.• The AT Lidar is an elastic and Raman backscatter lidar
designed for aerosol and temperature profiling in the stratosphere and above; and for tropospheric water vapor and temperature, cirrus cloud parameters, and temperature within cirrus clouds.
• Nominal field configuration: The system is mobile and is housed in a large, environmentally controlled trailer.
DescriptionThis Lidar system has high sensitivity aerosol and temperature capabilities using two separate Nd:YAG lasers to transmit three different wavelengths: 1064, 532, and 355 nm. Returns from the spectrally narrow transmitted 1064 and 532-nm beams are used to measure aerosol backscatter into the stratosphere. The depolarization ratio of the 532-nm radiation is measured to determine the physical state of the particles. The transmitted 532-nm beam is spectrally narrow and rotational. Raman lines scattered from nitrogen can be spectrally resolved. These lines are temperature sensitive, so temperature within cirrus clouds can be retrieved. The rotational Raman detection of tropospheric temperature has been a collaboration between NASA and Germany’s GKSS. Raman scattering of the transmitted 532-nm radiation from nitrogen (607-nm radiation) is also collected. Raman scattered returns from nitrogen (at 387 nm) and water vapor (at 407 nm) are also collected from the transmitted 355-nm beam. The ratio of the elastically scattered 355 or 532
nm radiation to the corresponding Raman scattered return at 387 or 607 nm, allows for the direct measure of the aerosol backscatter ratio. The ratio of the 407-nm return to the 387-nm return yields a relative water vapor profile. This can be calibrated to yield an absolute measurement of the tropospheric water vapor profile.
AT Lidar Data Products• Aerosol backscatter: 1064, 532, and 355 nm• Aerosol depolarization: 532 nm• Aerosol backscatter and extinction: 532 and 355 nm• Stratospheric aerosol and temperature• Tropospheric water vapor• Tropospheric temperature (includes within clouds)
AT Lidar Parameters• Laser wavelengths: 1064, 532, and 355 nm at 50 Hz• Optical returns: 1064, 532, 607, 355, 387, and
407 nm• Vertical resolution (raw signal): 15 m• Telescopes: far-field 36-in Newtonian; near-field: 4-in
Cassegrain
Principal InvestigatorThomas J. McGee NASA’s Goddard Space Flight Center [email protected]
Co-InvestigatorsJohn Sullivan NASA’s Goddard Space Flight CenterGrant Sumnicht Science Systems and Applications, Inc.Laurence Twigg Science Systems and Applications, Inc.
International CollaboratorJens Reichardt German Weather Service
Science Question for Future Campaigns• What determines the formation of cirrus cloud particles as
a function of temperature within the cloud?
Active Remote-Sensing Systems: Lidar
Atmospheres 2017 Instrument Systems Report 11

ReferencesBeyerle, G., M.R. Gross, D.A. Haner, N.T. Kjome, I.S. McDermid, T.J. McGee, J.M. Rosen, H.J. Schaefer, and O. Schrems, 2001: STRAIT’97: An aerosol lidar and backscatter sonde intercomparison campaign at Table Mountain Observatory during February–March 1997, J. Atmos. Sci., 58, 1275–1287.
Leblanc, T., Walsh, T. D., McDermid, I. S., Toon, G. C., Blavier, J.-F., Haines, B., Read, W. G., Herman, B., Fetzer, E., Sander, S., Pongetti, T., Whiteman, D. N., McGee, T. J., Twigg, L., Sumnicht, G., Venable, D., Calhoun, M., Dirisu, A., Hurst, D., Jordan, A., Hall, E., Miloshevich, L., Vömel, H., Straub, C., Kampfer, N., Nedoluha, G. E., Gomez, R. M., Holub, K., Gutman, S., Braun, J., Vanhove, T., Stiller, G., and Hauchecorne, A. 2011. Measurements of Humidity in the Atmosphere and Validation Experiments (MOHAVE)-2009: overview of campaign operations and results”, Atmos. Meas. Tech., 4, 2579–2605, doi:10.5194/amt-4-2579-2011.
Stiller, G. P., Kiefer, M., Eckert, E., von Clarmann, T., Kellmann, S., García-Comas, M., Funke, B., Leblanc, T., Fetzer, E., Froidevaux, L., Gomez, M., Hall, E., Hurst, D., Jordan, A., Kämpfer, N., Lambert, A., McDermid, I. S., McGee, T., Miloshevich, L., Nedoluha, G., Read, W., Schneider, M., Schwartz, M., Straub, C., Toon, G., Twigg, L. W., Walker, K., and Whiteman, D. N., 2012, Validation of MIPAS IMK/IAA temperature, water vapor, and ozone profiles with MOHAVE-2009 campaign measurements, Atmos. Meas. Tech., 5, 289-320, doi: 10.5194/amt-5-289-2012.
Active Remote-Sensing Systems: Lidar
12 Atmospheres 2017 Instrument Systems Report

CATS is a lidar instrument that operates on the International
Space Station (ISS) and provides a combination of operational
science measurements, in-space technology demonstrations,
and technology risk reduction for future Earth Science missions.
CATSCloud-Aerosol Transport System Lidar
Key CATS Facts• Heritage: Cloud Physics Lidar (CPL), Airborne Cloud-
Aerosol Transport System (ACATS)• CATS uses a 60 cm telescope, 2 high-repetition ratio
lasers, and photon-counting detection to measure backscatter and depolarization ratio at 532 and 1064 nm
• CATS has operated on the ISS (altitude of 415 km) for over three years (since Feb. 05, 2015) and has fired over 200 wavelengths.
• Website: CATS URL: http://cats.gsfc.nasa.gov
DescriptionScientists use an array of satellite, aircraft, and ground-based instruments to measure and monitor clouds and aerosols. To better observe the vertical structure of clouds and aerosols, scientists turn to active remote-sensing instruments, such as lidar. Lidar instruments provide information about the three-dimensional distribution of clouds and aerosols by emitting a laser pulse of light and measuring the elapsed time of the return signal.
The Cloud-Aerosol Transport System (CATS) is a lidar remote-sensing instrument designed to provide vertical profiles of clouds and aerosols while also demonstrating new in-space technologies for future Earth Science missions. CATS has been operating on the International Space Station (ISS) for over two years, beginning in early February 2015. CATS provides diurnally varying vertical profiles of clouds and aerosols in near-real-time (NRT) from the ISS to enhance our depth of understanding in the areas of aerosols (man-made pollution, smoke, dust), clouds, and hazardous events.
The CATS payload was designed to operate on-orbit for a minimum of 6 months and up to three years (with a possibility of extending to 5 years). With over 2 years of operation from the ISS, the CATS data products are enabling the science community to investigate cloud and aerosol impacts on the climate system, as well as more accurately monitor and model hazardous aerosol plumes.
CATS is primarily a technology demonstration designed to provide vertical profiles of clouds and aerosols that are similar to those provided by the Cloud-Aerosol Lidar and Infrared Pathfinder Satellite Observation (CALIPSO) mission. One benefit of CATS is that the ISS orbital characteristics enable measurements that are often hours apart from CALIPSO observations, providing additional data that when combined with CALIPSO data can provide better temporal and spatial coverage over the tropics and mid-latitudes. CATS has enhanced the data record of cloud and aerosol vertical profiles by providing excellent spatial and temporal coverage over the tropics and mid-latitudes at local times not observed by CALIPSO. CATS’ high detection sensitivity at the 1064 nm wavelength enables detection of the full extent of the aerosol layers above the cloud, and differentiation of these two layers so that the radiative effect of smoke and dust above clouds can be more accurately determined. Additionally, CATS data enables analysis of aerosol plume characteristics over time and space, since the ISS orbit provides comprehensive coverage of the primary aerosol transport paths.
In addition to their impact on the Earth’s climate system, aerosols from volcanic eruptions, wildfires, man-made pollution events, and dust storms are hazardous to aviation safety and human health. The 2010 eruption of the Eyjafjallajökull volcano in Iceland grounded nearly 95,000 flights and caused an estimated $1.7 billion loss for the airline industry. Aerosols near the Earth’s surface contribute to an annual death toll of ~68,000 Americans and ~3.3 million people globally. The CATS data products are produced within 6 hours of collection, which enables assimilation of aerosol vertical profiles into models for applications such as forecasting volcanic plume transport that cost the airline industry billions of dollar and predicting air quality during hazardous events that result in millions of deaths globally.
CATS Data Products• Attenuated total backscatter • Layer boundaries for aerosols and clouds• Layer and column optical depth• Extinction profile
Active Remote-Sensing Systems: Lidar
Atmospheres 2017 Instrument Systems Report 13
• Depolarization ratio• Cloud phase• Aerosol type • Ice water content/path
CATS Instrument Parameters• Wavelengths: 532 and 1064 nm• Laser repetition rate: 4-5 kHz• Laser energy: 1-2 mJ/wavelength• Telescope diameter: 60 cm• View angle: 0.5 degrees• Weight: <500 kg• FOV: 110 microradians• Vertical resolution: 60 m • Horizontal resolution: 350 m (Level 1), 5-60 km (Level 2)
Principal InvestigatorMatthew McGill NASA’s Goddard Space Flight Center [email protected]
Co-InvestigatorsJohn Yorks (Science Lead) NASA’s Goddard Space Flight CenterStanley Scott (Instrument Lead) NASA’s Goddard Space Flight CenterDennis Hlavka Science Systems and Applications, Inc.Andrew Kupchock Science Systems and Applications, Inc.Scott Ozog University of MarylandSteve Palm Science Systems and Applications, Inc.Rebecca Pauly Science Systems and Applications, Inc.Sharon Rodier Science Systems and Applications, Inc. Patrick Selmer Science Systems and Applications, IncMark Vaughan NASA’s Langley Research Center
Science Goals for the Project• Extend space-based lidar climate observations to include
measurements at various local times and promote studies of diurnal changes in clouds and aerosols.
• Provide near real time observational data to improve operational aerosol model forecasts.
• Demonstrate new technologies for future space-based lidar missions and future Earth Science ISS payload.
ReferencesMcGill, M.J., J. E. Yorks, V. S. Scott, A. W. Kupchock, P. A. Selmer (2015), The Cloud-Aerosol Transport System (CATS): a technology demonstration on the International Space Station, Proc. SPIE 9612, Lidar Remote Sensing for Environmental Monitoring XV, 96120A, doi:10.1117/12.2190841.
Yorks, J. E., S. P. Palm, D. L. Hlavka, M. J. McGill, E. Nowottnick, P. Selmer, W. D. Hart (2015), The Cloud-Aerosol Transport System (CATS) Algorithm Theoretical Basis Document, http://cats.gsfc.nasa.gov/media/docs/CATS_ATBD.pdf.
Yorks, J. E., M. J. McGill, S.P. Palm, D. L. Hlavka, P.A. Selmer, E. Nowottnick, M. A. Vaughan, S. Rodier, and W. D. Hart (2016), An Overview of the CATS Level 1 Data Products and Processing Algorithms, Geophys. Res. Let., 43, doi:10.1002/2016GL068006.
Hughes, E. J., J. E. Yorks, N. A. Krotkov, A. M. da Silva, and M. McGill (2016), Using CATS Near-Realtime Lidar Observations to Monitor and Constrain Volcanic Sulfur Dioxide (SO2) Forecasts, Geophys. Res. Lett., 43, doi:10.1002/2016GL070119.
Rajapakshe, C. Z. Zhang, J. E. Yorks, H. Yu, Q. Tan, K. Meyer, S. Platnick (2017), Seasonally Transported Aerosol Layers over Southeast Atlantic are Closer to Underlying Clouds than Previously Reported, Geophys. Res. Lett., 44, doi:10.1002/2017GL073559.
Active Remote-Sensing Systems: Lidar
14 Atmospheres 2017 Instrument Systems Report

CPL configured to fly on the NASA ER-2.
CPLCloud Physics Lidar
Key CPL Facts• Heritage: Cloud Lidar System (CLS)• ER-2 airborne lidar for cloud and aerosol profiling. Provides
cloud/layer boundary, depolarization ratio, optical depth, and extinction ratios.
• Participated in more than two-dozen field campaigns, includ-ing SAFARI-2000, CRYSTAL-FACE, TC4, and SEAC4RS.
• Nominal Flight Characteristics: 65,000 ft (20 km), above 94 percent of Earth’s atmosphere. Nadir viewing, 9-h duration time with 5-GB storage.
• CPL URL: http://cpl.gsfc.nasa.gov
DescriptionThe effect of clouds and aerosols on regional and global climate is of great scientific importance. Long-standing elements of the NASA climate and radiation science program are field studies incorporating airborne remote sensing and in situ measurements of clouds and aerosol. The CPL system is designed specifically for studying clouds and aerosols using the ER-2 High Altitude Aircraft. Because the ER-2 typically flies at 65,000 ft (20 km), its instruments are above 94 percent of the Earth’s atmosphere, thereby allowing ER-2 instruments to function as spaceborne instrument simulators. The CPL provides a unique tool for atmospheric profiling and is sufficiently small and low cost to include in multiple instrument missions. Active lidar profiling is especially valuable because the cloud height structure is measured unambiguously, up to the limit of signal attenuation.
CPL Data Products• Planetary boundary layer (PBL) • Layer boundaries for aerosols and clouds• Layer and column optical depth
• Extinction profile• Depolarization ratio• Cloud phase• Aerosol type
CPL Parameters• Vertical resolution: 30 m• Horizontal resolution: 200 m• Wavelengths: 1064, 532, and 355 nm• Laser repetition Rate: 5000 Hz• Laser pulse energy: 50 μJ at 1064 nm; 25 μJ at 532 nm;
50 μJ at 355nm• Total power: 60 W to 1200 W• Weight: 50 kg to 110Kg• FOV: 100 μrad
Principal InvestigatorMatthew McGill NASA’s Goddard Space Flight Center [email protected]
Co-InvestigatorsJohn Yorks (Science Lead) NASA’s Goddard Space Flight CenterDennis Hlavka Science Systems and Applications, Inc.Andrew Kupchock Science Systems and Applications, Inc.Patrick Selmer Science Systems and Applications, Inc.Steve Palm Science Systems and Applications, Inc.Rebecca Pauly Science Systems and Applications, Inc.
Science Question for Future Campaigns• What are the particle sizes within clouds?• What is the effect of multiple scattered signals on
estimates of extinction-to-backscatter and optical depth?
Future Campaigns• CATS, CALIPSO and GOES-16 validation flights• Future EVS flights• Yearly campaigns supporting various Earth Science
missions or experiments
Active Remote-Sensing Systems: Lidar
Atmospheres 2017 Instrument Systems Report 15

ReferencesDi Noia, A., O. Hasekamp, L. Wu, B. van Diedenhoven, B. Cairns, and J. E. Yorks, (2017), Aerosol retrievals over land from the NASA Research Scanning Polarimeter: A combined neural network / Phillips-Tikhonov approach, Atmos. Meas. Tech. Discuss., https://doi.org/10.5194/amt-2017-148.
Sinclair, K., van Diedenhoven, B., Cairns, B., Yorks, J., Wasilewski, A., and McGill, M. (2017), Remote Sensing of Multiple Cloud Layer Heights using Multi-Angular Measurements, Atmos. Meas. Tech. Discuss., doi:10.5194/amt-2017-2.
Wu, L., O. Hasekamp, B. van Diedenhoven, B. Cairns, J. E. Yorks, and J. Chowdhary (2016), Passive remote sensing of aerosol layer height using near-UV multiangle polarization measurements, Geophys. Res. Lett., 43, doi:10.1002/2016GL069848.
Alexandrov, M.D., B. Cairns, B. van Diedenhoven, A.S. Ackerman, A.P. Wasilewski, M.J. McGill, J.E. Yorks, D.L. Hlavka, S.E. Platnick, and G.T. Arnold, (2016), Polarized view of supercooled liquid water clouds. Remote Sens. Environ., 181, doi:10.1016/j.rse.2016.04.002.
Diedenhoven, B., A. M. Fridlind, B. Cairns, A. S. Ackerman, and J. E. Yorks (2016), Vertical variation of ice particle size in convective cloud tops, Geophys. Res. Lett., 43, doi:10.1002/2016GL068548.
Meyer, K., Platnick, S., Arnold, G. T., Holz, R. E., Veglio, P., Yorks, J., and Wang, C. (2016), Cirrus cloud optical and microphysical property retrievals from eMAS during SEAC4RS using bi-spectral reflectance measurements within the 1.88 µm water vapor absorption band, Atmos. Meas. Tech. Discuss. 9, 1743-1753, doi:10.5194/amt-9-1743-2016.
Alexandrov, M.D., B. Cairns, A.P. Wasilewski, A.S. Ackerman, M.J. McGill, J.E. Yorks, D.L. Hlavka, S.E. Platnick, G.T. Arnold, B. van Diedenhoven, J. Chowdhary, M. Ottaviani, and K.D. Knobelspiesse (2015), Liquid water cloud properties during PODEX. Remote Sens. Environ., 169, 20–36, doi:10.1016/j.rse.2015.07.029.
Active Remote-Sensing Systems: Lidar
16 Atmospheres 2017 Instrument Systems Report

MABEL being installed in the ER-2 nose
MABELMultiple Altimeter Beam Experimental Lidar
Key MABEL Facts• Heritage : New development, as demonstration of ICESat-2
measurement capability• MABEL is a new instrument being developed in support of
the ICESat-2 mission• Field operations (aircraft, altitude, etc.): Flies on ER-2
aircraft at >20,000 ft
DescriptionThe Multiple Altimeter Beam Experimental Lidar (MABEL) is a new instrument being developed in support of the ICESat-2 mission. The ICESat-2 mission is critically dependent on making cross-track measurements of surface slope. This is accomplished by using multiple independent beams, measured simultaneously, to profile the surface. Moreover, to enable this measurement concept, ICESat-2 is embracing a new approach to surface altimetry measurements by using high-repetition rate, low-pulse-energy lasers and photon-counting detection.
Because there are many engineering and science trades made possible by using the multiple beam photon-counting approach, it is essential to have an airborne simulator instrument that can be used to demonstrate the measurement concept. MABEL is an airborne demonstrator instrument that has enough design flexibility to permit exploration of engineering and science trade spaces to inform and validate the ICESat-2 instrument design. Initial plans call for deployment on the high-altitude ER-2 aircraft, with eventual adaptation to the Global Hawk unmanned platform.
The design for MABEL is two wavelength (532 and 1064 nm) with 16 beams at 532 nm and 8 beams at 1064 nm. Each transmit beam produces a 2-m diameter footprint on the surface, centered on a 4-m diameter field of view. Fiber- optic arrays coupled to the transmit and receive telescopes determine the viewing geometry. The fiber arrays, arranged similar to a telephone switchboard, permit selection of specific viewing geometry that can be varied in increments of 20 m across a 2-km swath.
MABEL Parameters• Wavelength: 532 and 1064 nm• Laser repetition rate: 5 to 25 kHz• Laser energy (per beam): ~5 μJ at 532 nm; ~5 μJ at
1064 nm• Number of beams: up to 16 at 532 nm, up to 8 at 1064
nm• Telescope diameter: 6 in (0.152m)• Total Power: <1500 W• Weight: <120 kg• FOV: 200 microradians• 30-m vertical resolution
Principal InvestigatorMatthew McGill NASA’s Goddard Space Flight Center [email protected]
Science Questions• Under formulation
Future Campaigns• Provide demonstration measurements in support of
ICESat-2• Provide validation measurements in support of ICESat-2
Referencehttps://icesat.gsfc.nasa.gov/icesat2/data/mabel/mabel_docs.php
Active Remote-Sensing Systems: Lidar
Atmospheres 2017 Instrument Systems Report 17

MELI principle of operation (left). DC-8 over the Pacific Ocean during a MELI flight in October 2015 (right).
MELIMethane Lidar
Key MELI Facts• Heritage: The first IPDA CH4 lidar, aside from the German
DLR CHARM-F instrument
• Integrated Path Differential Absorption (IPDA) lidar instrument to measure CH4 column concentrations
• Uses GSFC-developed 1.65-µm laser transmitters and a sensitive avalanche photodiode detector
• Prototype R&D demonstrator for a future space mission
DescriptionMethane (CH4) is the second most important anthropogenic greenhouse gas with a higher radiative forcing potential than carbon dioxide (CO2) on a per molecule basis, making anthropogenic CH4 a critical target for mitigation. Anthropogenic CH4 is responsible for a significant portion of the global warming produced by all well-mixed greenhouse gases. MELI is an IPDA lidar using an optical parametric oscillator (OPO) and optical parametric amplifier (OPA) laser transmitters and sensitive avalanche photodiode detector. The lidar measures atmospheric a CH4 absorption at multiple, discrete wavelengths at 1650.9 nm. The lidar, along with an in situ spectrometer was deployed in the fall of 2015 aboard NASA’s DC-8 airborne laboratory based at the Armstrong Science Aircraft Integration Facility (SAIF) in Palmdale, CA, and measured CH4 column concentrations over a wide range of topography and weather conditions from altitudes of 3 km to 13 km.
MELI Main Data Products• CH4 column concentration measurements at 1.65 µm• Atmospheric backscatter profile at 1.65 µm
MELI Parameters• Center wavelength: 1650.958 nm• Number of wavelengths: 5–20• Transmitter energy/pulse: ~30–250 µJ• Transmitter pulse rate: 5–10 kHz• Transmitter divergence: ~150 µrad• Receiver field-of-view: 300 µrad• Receiver diameter: 20 cm• Receiver band pass: 0.8 nm (FWHM)• Detector: HgCdTe e-ADP• Detector QE: ~90%t• Averaging time: 1/16 sec
Principal InvestigatorHaris Riris NASA’s Goddard Space Flight Center [email protected]
Team MembersKenji Numata, NASA’s Goddard Space Flight Center Stewart Wu, NASA’s Goddard Space Flight Center
MELI transceiver and with back-illuminated transmitter and re-
ceiver images during deployment on the NASA DC-8 airborne laboratory in the fall of 2015 to measure CH4 concentrations over a wide range of topography and weather conditions from
altitudes of 3 km to 13 km.
Scientific Questions for Future Campaigns• What are the global, regional, and sectoral sources and
sinks of CH4?• What are the processes that drive CH4 release in the Arctic
and tropical wetlands and what is their the contribution to climate change?
Future CampaignsNo current campaigns planned. The previous flights were supported by IRAD.
Active Remote-Sensing Systems: Lidar
18 Atmospheres 2017 Instrument Systems Report

Active Remote-Sensing Systems: Lidar
Atmospheres 2017 Instrument Systems Report 19
References 1. Riris, H., Numata, K., Wu, S., Gonzalez, B., Rodriguez, M., Scott, S., Kawa, S. and Mao, J., Methane optical density measurements with an integrated path differential absorption lidar from an airborne platform. Journal of Applied Remote Sensing, 11(3), p.034001, (2017).
2. Riris, H., K. Numata, S. Li, S. Wu, A. Ramanathan, M. Dawsey, J. Mao, R. Kawa, and J. Abshire, "Airborne measurements of atmospheric methane column abundance using a pulsed integrated-path differential absorption lidar," Appl. Opt. 51, 8296-8305 (2012).
3. Numata, K., Riris, H., S. Li, S. Wu, S. R. Kawa, M. Krainak, J. Abshire, “Ground demonstration of trace gas lidar based on optical parametric amplifier”, Journal of Applied Remote Sensing, Vol. 6, 063561-1, (2012).
4. Numata, K., Riris, H., Wu, S., “Fast-switching methane lidar transmitter based on a seeded optical parametric oscillator”, Applied Physics B, 116, 4, 959-966, (2014).
Selected conference presentations:
5. Riris, H., Numata, K., Wu, S., Gonzalez, B., Rodriguez, M., Kawa, S. and Mao, J., 2017, May. Methane measurements from space: technical challenges and solutions. In Laser Radar Technology and Applications XXII (Vol. 10191, p. 1019104). International Society for Optics and Photonics.
6. Li, Steven, Haris Riris, Kenji Numata, Stewart Wu, Demetrios Poulios, Anand Ramanathan, James Abshire, and Michael Krainak. "Tunable narrow linewidth laser source for a methane lidar," Aerospace Conference, 2012 IEEE, pp. 1-8. IEEE, (2012).

MPLNET in Doi Ang Khang, Thailand
MPLNETMicro Pulse Lidar Network
Key MPLNET Facts• Heritage: GSFC Director’s Discretionary Fund • Nominal field configuration: Global ground-based sites in
the NASA Micro-Pulse Lidar Network.• Instruments are compact and eye-safe polarized lidars
capable of profiling the vertical structure of aerosols and clouds up to 30 km.
• The instrument design was engineered for deployments to remote field locations requiring continuous lidar observations.
• MPLNET Website: http://mplnet.gsfc.nasa.gov
DescriptionThe NASA Micro-Pulse Lidar Network (MPLNET) is a global, federated network of polarized micro-pulse lidar (MPL) systems designed to measure aerosol and cloud vertical structure continuously, over long time-periods required to contribute to climate change studies and provide ground validation for satellite sensors and related aerosol modeling and forecasting efforts. MPLNET began in 2000, and there have been over 60 sites worldwide. There are currently 17 long-term and numerous short-term field campaign sites in operation. Seven of the long-term sites have over 10 years of data, and many more have 5+ years. There are 6 more sites in planning stages towards operational status by end of 2017 and several more at proposal stage. Most MPLNET sites are co-located with the NASA Aerosol Robotic Network (AERONET), producing both column and vertically resolved data on aerosol and cloud properties and the evolution and structure of the planetary boundary layer (PBL). MPLNET is also a member of the WMO Global Atmospheric Watch (GAW) Aerosol Lidar Observation Network (GALION).
MPLNET Data Products• Polarized backscatter lidar signals and volume
depolarization ratio from surface to 30 km (1 min, 30 or 75 m resolutions)
• Cloud heights, phase, thin cloud extinction and optical depth
• Aerosol heights, backscatter and extinction profiles, optical depth and depolarization ratio
• Planetary Boundary Layer heights and aerosol optical depth• Near real time delivery of all data products on public
webserver, including quality assured data products
MPL Instrument Parameters• Laser wavelength: 523, 527, or 532 nm• Laser pulse energy: 5–10 μJ• Pulse repetition rate: 2500 Hz• Alternating polarized output from linear to elliptical at 10 Hz• Telescope: 7–8-in Cassegrain• Vertical resolution: 15–300 m• Typical data rate: 1 s to 1 min
Principal InvestigatorEllsworth J. Welton NASA’s Goddard Space Flight Center [email protected]
Scientific Questions for Future Observation• What are the distributions of aerosol layers and properties
and how have they changed over the past decade?• How can operational lidar networks improve aerosol
modeling and forecasting?• How does boundary layer height impact aerosol transport
and surface pollution levels?• How do dust, smoke, and pollution aerosols effect cloud
formation and precipitation?
ReferencesLolli, S., J.R. Campbell, J.R. Lewis, Y. Gu, and E.J. Welton, 2017. Technical note: Fu-Liou-Gu and Corti-Peter model performance evaluation for radiative retrievals from cirrus clouds, Atmos. Chem. Phys., 17, 7025-7034, doi: org/10.5194/acp-17-7025-2017.
Lolli, S., P.D. Girolamo, B. Demoz, X. Li, and E.J. Welton, 2016. Rain evaporation rate estimates from dual-wavelength
Active Remote-Sensing Systems: Lidar
20 Atmospheres 2017 Instrument Systems Report

lidar measurements and intercomparison against a model analytical solution. J. Atmos. Oceanic Tech., doi: 10.1175/JTECH-D-16-0146.1.
Welton, E. J., J. R. Campbell, J. D. Spinhirne, and V. S. Scott, Global monitoring of clouds and aerosols using a network of micro-pulse lidar systems, in Lidar Remote Sensing for Industry and Environmental Monitoring, U. N. Singh, T. Itabe, N. Sugimoto, (eds.), Proc. SPIE, 4153, 151-158, 2001.
Active Remote-Sensing Systems: Lidar
Atmospheres 2017 Instrument Systems Report 21

STROZ LITEStratospheric Ozone Lidar Trailer Experiment
Key STROZ LITE Facts• Heritage: Originally designed for stratospheric ozone, then
modified to include temperature, aerosols, and tropospheric water vapor.
• A differential absorption, elastic and inelastic backscatter lidar instrument that returns vertical profiles of ozone, temperature, and aerosol parameters in the stratosphere and a vertical profile of water vapor in the troposphere.
• The lidar has been involved in more than two dozen national and international campaigns supporting satellite validation, aircraft campaigns, and NDSC validation campaigns.
• Nominal field configuration: The system is mobile and housed in a large, environmentally-controlled shipping container.
DescriptionThe STROZ LITE lidar uses two lasers to generate the two wavelengths that are transmitted into the atmosphere: an XeCl excimer laser, emitting at 308 nm; and another laser to transmit near 350 nm with a spectrally narrow emission line. Ozone is extracted using a differential absorption (DIAL) technique—two wavelengths are transmitted into the atmosphere: one is strongly absorbed by ozone, while the other is not absorbed. Ozone can then be deduced from the difference in slope between the lidar returns at the two transmitted wavelengths. In addition to collecting the backscatter signal from each of these transmitted wavelengths, STROZ LITE collects several inelastic returns from Raman scattering from N2 and H2O. The STROZ LITE instrument was the first to develop the Raman scatter
differential absorption technique for the measurement of ozone profiles in the presence of heavy aerosol loadings. This was put into place shortly after the eruption of Mt. Pinatubo in 1991. The success of this technique resulted in a recommendation from the NDSC Steering Committees that all ozone lidar instruments within the NDSC should incorporate the Raman channels needed for the Raman DIAL technique. NDACC ozone and temperature data from instruments around the world that have been validated by the STROZ lidar, have been shown to be in very good agreement with global data records from satellites.
STROZ LITE Data Products• Aerosol backscatter and extinction at 355 nm, troposphere• Stratospheric and mesospheric temperature• Tropospheric water vapor• Stratospheric ozone
STROZ LITE Parameters• Laser wavelengths: 308 nm at 100Hz; 355 nm at 50 Hz• Optical returns: 308, 332, 355, 387, and 407 nm• Vertical resolution (raw signal): 15 m• Telescopes: Far Field–30-in Dall-Kirkham; Near field:–4-in
Cassegrain
Principal InvestigatorThomas J. McGee NASA’s Goddard Space Flight Center [email protected]
Co-InvestigatorsJohn Sullivan NASA’s Goddard Space Flight CenterGrant Sumnicht Science Systems and Applications, Inc.Laurence Twigg Science Systems and Applications, Inc.
Science Questions for Future Campaigns• Has ozone begun its recovery from the losses because of
chlorine destruction?• What are the variability and abundance of water vapor just
above the tropopause?
Future Campaigns• Observatoire de Haute Provence, France: July–November,
2017
The STROZ LITE trailer deployed at the Mauna Loa Observatory in August 2013. Mauna Kea is visible in the background.
Active Remote-Sensing Systems: Lidar
22 Atmospheres 2017 Instrument Systems Report

• Hohenpeissenberg, Germany: February, 2018• Maido Observatory, Reunion Island, France: July – October,
2018• Lauder, New Zealand: January, 2019
References• T.J. McGee, M. Gross, U.N. Singh, J. J. Butler, and P.
Kimvilakani,1995, “Improved Stratospheric Ozone Lidar”, Opt. Engin., 34, 1421-1430. doi:10.1117/12.199883.
• Bailey, P.L., D.P. Edwards, J.C. Gille, L.V. Lyjack, S.T. Massie, A.E. Roche, J.B. Kumer, J.L. Mergenthaler, B.J. Connor, M.R. Gunson, J.J. Margitan, I.S. McDermid, and T.J. McGee, 1996: Comparison of Cryogenic Limb Array Etalon Spectrometer (CLAES) ozone observations with correlative measurements. J. Geophys. Res., 101, 9737–9756, doi: 10.1029/95JD03614.
• Steinbrecht, W., T. J. McGee, L. Twigg, H. Claude, F. Schonenborn, G. Sumnicht, D. Silbert, and R. Neuber, 2009, Intercomparison of stratospheric ozone and temperature profiles during the October 2005 Hohenpeißenberg Ozone Profiling Experiment (HOPE), Atmos. Meas. Tech., 2, 125-145, doi: 10.5194/amtd-2-37-2009.
Active Remote-Sensing Systems: Lidar
Atmospheres 2017 Instrument Systems Report 23

Key TROPOZ Facts• Heritage: Trailer and laser were originally used for
stratospheric ozone measurements. The telescope and optical assemblies were largely repurposed from the AROTAL instrument; modified to include tropospheric ozone.
• An ultraviolet lidar for tropospheric ozone measurements from near 200 m to 18 km agl. Used to investigate boundary layer (air quality) and upper tropospheric/lower stratospheric ozone dynamics.
• Participated in the 2014 DISCOVER-AQ campaign and 2016 KORUS-AQ campaign.
• Nominal field configuration: The system is mobile and is housed in a large, environmentally controlled trailer.
• TROPOZ URL: https://www-air.larc.nasa.gov/missions/TOLNet/
DescriptionAlthough tropospheric ozone is a critical measurement for climate and air quality studies, it is difficult to accurately measure with current space-based instrumentation. For this reason, the TROPOZ was constructed in a transportable trailer and has been deployed to provide high-resolution time-height measurements of tropospheric ozone from near-surface to the lower stratosphere for air quality/chemical-transport-model improvement and satellite validation/assessment. Because of the lack of historic diurnal information in the lower troposphere, TROPOZ advances the understanding of atmospheric processes controlling regional air quality and chemistry.
TROPOZ is made up of three major components: the transmitter, the receiver, and the data acquisition system.
The transmitter comprises an Nd:YAG laser, transmitting two parallel beams at 266 nm, which are then shifted using Stimulated Raman Scattering to 289 and 299 nm using deuterium and hydrogen, respectively. The primary receiver used for far field (upper tropospheric returns) is a 16-in Newtonian telescope and near field signal is collected using four isolated 1-in receivers. Real-time data acquisition and analysis programs provide information that is relayed to flight planners in order to improve measurement strategies during NASA campaigns.
TROPOZ Data Products • O3 vertical profiles from 0.2 –18 km • Surface: O3, NO2, and meteorology (P, T, RH, Winds)
TROPOZ Parameters• Laser wavelengths: 289 and 299 nm• Laser pulse energy: 18 mJ and 24 mJ• Pulse rate: 50 Hz • Field of view: 4.5 mrad (near field), 1.0 mrad (far field) • Optical channels: 289, 299 nm• Vertical resolution: 0.1–1.5 km
Principal InvestigatorThomas J. McGee NASA’s Goddard Space Flight Center [email protected]
TROPOZ Team MembersJohn T. Sullivan NASA’s Goddard Space Flight Center
TROPOZTropospheric Ozone Differential Absorption Lidar
TROPOZ trailer deployed to Ft. Collins, CO, during the 2014 DISCOVER-AQ campaign. The NASA P3-B flies overhead as the TROPOZ team prepares to launch an ozonesonde.
Active Remote-Sensing Systems: Lidar
24 Atmospheres 2017 Instrument Systems Report

Laurence Twigg Science Systems and Applications, Inc.Grant K. Sumnicht Science Systems and Applications, Inc.
Science Questions for Future Campaigns• What is the validity of the ozone products from future
geostationary satellites (such as TEMPO)?• How does urban pollution and ozone interact with complex
terrain (such as mountains or coastal transitions)?• What are the local and regional air quality impacts of
biomass burning entering the urban environment?
Planned Campaigns2017 – Ozone Water Land Environmental Transition Study (OWLETS) in Hampton, VA.
ReferencesSullivan, John T., Scott D. Rabenhorst, Joel Dreessen, Thomas J. McGee, Ruben Delgado, Laurence Twigg, and Grant Sumnicht. “Lidar observations revealing transport of O3 in the presence of a nocturnal low-level jet: Regional implications for “next-day” pollution.” Atmospheric Environment (2017). 158, 160-171.
Sullivan, J. T., T. J. McGee, G. K. Sumnicht, L. W. Twigg, and R. M. Hoff. “A mobile differential absorption lidar to measure sub-hourly fluctuation of tropospheric ozone profiles in the Baltimore-Washington, DC region.” Atmospheric Measurement Techniques 7, no. 10 (2014): 3529
Sullivan, John T., Thomas J. McGee, Anne M. Thompson, R. Bradley Pierce, Grant K. Sumnicht, Laurence W. Twigg, Edwin Eloranta, and Raymond M. Hoff. “Characterizing the lifetime and occurrence of stratospheric-tropospheric exchange events in the rocky mountain region using high-resolution ozone measurements.” Journal of Geophysical Research: Atmospheres 120, no. 24 (2015c): 12410-12424.
Sullivan, John T., Thomas J. McGee, Andrew O. Langford, Raul J. Alvarez, Christoph J. Senff, Patrick J. Reddy, Anne M. Thompson et al. “Quantifying the contribution of thermally driven recirculation to a high-ozone event along the Colorado Front Range using lidar.”Journal of Geophysical Research: Atmospheres 121, no. 17 (2016).
Sullivan, John T., Thomas J. McGee, Russell DeYoung, Laurence W. Twigg, Grant K. Sumnicht, Denis Pliutau, Travis Knepp, and William Carrion. “Results from the NASA GSFC and LaRC ozone lidar intercomparison: New mobile tools for
atmospheric research.” Journal of Atmospheric and Oceanic Technology 32, no. 10 (2015b): 1779-1795.
Sullivan, J. T., T. J. McGee, T. Leblanc, G. K. Sumnicht, and L. W. Twigg. “Optimization of the GSFC TROPOZ DIAL retrieval using synthetic lidar returns and ozonesondes-Part 1: Algorithm validation.” Atmospheric Measurement Techniques 8, no. 10 (2015a): 4133.
Active Remote-Sensing Systems: Lidar
Atmospheres 2017 Instrument Systems Report 25

TWiLiTETropospheric Wind Lidar Technology Experiment
Key TWiLiTE Facts• Heritage: Double-Edge Wind Lidar, GLOW, ESTO Instrument
Incubator Program• An autonomous airborne Doppler lidar system for
measuring vertical profiles of wind from the Doppler-shifted frequency of the laser signal scattered back towards the instrument by air molecules.
• Demonstrates key technologies needed for space-based Global Tropospheric Wind Mission
• Nominal Field Configuration: Airborne scanning Doppler lidar system designed to operate autonomously on NASA high-altitude research aircraft, including the DC-8, ER-2 and Global Hawk. Step-stare scanning in azimuth (0 to 360 degrees) with 45-degree elevation angle.
DescriptionThe TWiLiTE Doppler lidar measures vertical profiles of wind by transmitting a short laser pulse into the atmosphere, collecting the laser light scattered back to the lidar by air molecules and measuring the Doppler-shifted frequency of that light. The magnitude of the Doppler shift is proportional to the wind speed of the air in the parcel scattering the laser light. TWiLiTE was developed with funding from the Earth Science Technology Office’s Instrument Incubator Program (IIP). The primary objectives of the TWiLiTE program are twofold: First, to advance the development of key technologies and subsystems critical for a future space based Global Wind Sounding Mission, as recommended by the National Research Council in the recent Decadal Survey
for Earth Science and second, to develop for the first time a fully autonomous airborne Doppler wind lidar instrument to demonstrate tropospheric wind-profile measurements from a high-altitude, downward-looking, moving platform to simulate spaceborne measurements.
TWiLiTE Data Products• Range-resolved conical scans of radial wind speed• Vertical profiles of u-, v-, and w-component winds, and
wind-speed and direction• Coverage: 20 km to the surface• Nominal vertical resolution: 250 m• Accuracy: 0.5 to 3 m/s
TWiLiTE Parameters• Laser wavelength: 355 nm• Laser energy/pulse: 35 mJ at 355nm• Pulse repetition rate: 200 Hz• Telescope/scanner aperture: 40 cm• FOV: 0.2 mrad
Principal InvestigatorBruce Gentry NASA’s Goddard Space Flight Center [email protected]
Co-InvestigatorsHuailin Chen Science Systems and Applications, Inc.
Science Questions for Future Campaigns• Can wind observations in and around a tropical cyclone
improve the prediction of hurricane intensity and track?• Can wind profile observations through the tropopause
improve understanding of tropospheric/stratospheric exchange?
ReferencesGentry, B., M. McGill, G. Schwemmer, M. Hardesty, A. Brewer, T. Wilkerson, R. Atlas, M. Sirota, S. Lindemann and F. Hovis. “The TWiLiTE airborne direct detection Doppler lidar for tropospheric wind profiling”, invited paper, Proceedings of the Annual Meeting of the American Meteorological Society, New Orleans, Louisiana, 2008.
Gentry, B., M. McGill, G. Schwemmer, M. Hardesty, A. Brewer, T. Wilkerson, R. Atlas, M. Sirota, S. Lindemann and
The Tropospheric Wind Lidar Technology Experiment (TWiLiTE)
lidar configured for flight on the NASA ER-2
Active Remote-Sensing Systems: Lidar
26 Atmospheres 2017 Instrument Systems Report

F. Hovis. “New technologies for direct detection Doppler lidar: Status of the TWiLiTE airborne molecular Doppler lidar project”, Proceedings of the 24th International Laser Radar Conference, Boulder, Colorado, 2008.
Gentry, B., M. McGill, G. Schwemmer, M. Hardesty, A. Brewer, T. Wilkerson, R. Atlas, M. Sirota, S. Lindemann and F. Hovis. “Recent advances in Doppler lidar instrument Technology at NASA’s Goddard Space Flight Center”, IGARSS 2009, Cape Town, South Africa, 2009.
Gentry, B., M. McGill, R. Machan, D. Reed, R. Cargo, D. J. Wilkens, W. Hart, J. Yorks, S. Scott, S. Wake, M. Hardesty, and A. Brewer. “Flight testing of the TWiLiTE airborne molecular Doppler lidar”, 25th International Laser Radar Conference, St Petersburg, Russia, 2010.
Active Remote-Sensing Systems: Lidar
Atmospheres 2017 Instrument Systems Report 27

UAV CPLUnmanned Aerial Vehicle Cloud Physics Lidar
Key UAV CPL Facts• Heritage: ER-2 Cloud Physics Lidar (CPL)• NASA’s first lidar instrument for the new Global Hawk
platform• Nominal flight characteristics: 65,000 ft (20 km), nadir
viewing, up to 36-hour duration, real-time command and control, and data downlinking
• URL: http://cpl.gsfc.nasa.gov
DescriptionBased on the success of the ER-2 Cloud Physics Lidar, or CPL (see http://cpl.gsfc.nasa.gov), a similar instrument, termed UAV-CPL, has been constructed for use on the Global Hawk unmanned platform. NASA now has two Global Hawks and UAV-CPL is the first lidar to fly on the new aircraft. Global Hawk is a large aircraft, and the UAV-CPL instrument package fits nicely into the nose section.
Data products and data quality are similar to the current ER-2 CPL instrument. Using the proven ER-2 instrument as a design base has permitted easy and inexpensive construction of the UAV-CPL. The long duration flights possible with the Global Hawk will prove useful in future science campaigns allowing, for example, study of cyclogenesis life cycle, from formation up through dissipation. Validation of satellite sensors in regions previously inaccessible by manned aircraft will also be enabled through use of Global Hawk.
The UAV-CPL is a backscatter lidar designed to operate simultaneously at three wavelengths: 1064, 532, and 355 nm. The lidar uses state-of-the-art technology with a high repetition rate, low pulse-energy laser, and photon-counting detection. Vertical resolution of the measurements is fixed at 30 m; horizontal resolution is variable but is typically 1 s. Primary instrument parameters are listed below.
UAV-CPL Parameters• Laser wavelengths: 1064, 532, and 355 nm• Laser type: solid-state Nd:YVO4• Laser repetition rate: 5 kHz• Laser output energy: 50 μJ at 1064 nm, 25 μJ at 532 nm,
and 50 μJ at 355 nm• Telescope: 20-cm diameter, off-axis parabola• Telescope FOV: 100 μrad, full angle• Raw data resolution: 1/10 s (30 m × 200 m horizontal)• Processed data resolution: 1 s (30 m × 200 m horizontal)• Instrument weight: approximately 350 lbs• Duration: Up to 36 h• Flight altitude: 50,000–60,000 ft
Principal InvestigatorMatthew J. McGill NASA’s Goddard Space Flight Center [email protected]
Co-InvestigatorsJohn Yorks NASA’s Goddard Space Flight CenterDennis Hlavka Science Systems and Applications, Inc.Andrew Kupchock Science Systems and Applications, Inc.Patrick Selmer Science Systems and Applications, Inc.Steve Palm Science Systems and Applications, Inc.Rebecca Pauly Science Systems and Applications, Inc.
Science Questions for Future Campaigns• How are clouds, particularly cirrus and subvisual cirrus,
affecting radiative balance?• How are aerosols transported from the source region to
other areas?• How are clouds and aerosols interacting?
CampaignsGloPac was the first field campaign for the NASA Global Hawk during February – March 2010. UAV-CPL was a critical component of the GloPac campaign, as well as HS3 and ATTREX EVS projects.
The NASA Global Hawk aircraft.
Active Remote-Sensing Systems: Lidar
28 Atmospheres 2017 Instrument Systems Report

ReferencesJenson, E.J., G. Diskin, R.P. Lawson, S. Lance, T.P. Bui, D. Hlavka, M. McGill, L. Pfister, O.B. Toon, and R. Gao, “Ice nucleation and dehydration in the Tropical Tropopause Layer,” Proceedings of the National Academy of Sciences, 6(110), 2041-2046 (2012).
Active Remote-Sensing Systems: Lidar
Atmospheres 2017 Instrument Systems Report 29

GLOWGoddard Lidar Observatory for Winds
Key GLOW Facts• Heritage: Double Edge Wind Lidar, and ZEPHYR New
Millennium Program.• GLOW is a mobile system for determining vertical profiles
of wind from the Doppler-shifted frequency of the laser signal scattered back towards the lidar. Profiles of wind speed and direction are produced.
• GLOW participated in several field experiments including the International H2O Project (IHOP) and Plains Elevated Convection at Night (PECAN).
• GLOW currently operates at the Howard University Research Facility in Beltsville, Maryland.
• Nominal Field Configuration: Step stare scanning in azimuth (0–360 deg) with fixed elevation angle (0–90 deg).
• GLOW URL: http://glow.gsfc.nasa.gov
DescriptionThe Goddard Lidar Observatory for Winds (GLOW) is a mobile wind lidar system utilizing direct detection Doppler lidar techniques for measuring wind profiles up to 35 km. The GLOW mobile lidar system has a twofold purpose: First, to provide wind profile measurements from the surface into the stratosphere for use in scientific measurement programs, and second, as a testbed for validating the performance of new technologies and measurement techniques proposed for use in future spaceborne applications.
GLOW Data Products• Range resolved scans (PPI, RHI) of radial wind speed• Vertical Profiles of u, v, w component winds and wind
speed, and direction
• Coverage: 0.1 to 30 km• Minimum range resolution: 40 m• Accuracy: 0.5 to 3 m/s
GLOW Parameters• Laser Wavelengths 355 nm• Laser Energy/Pulse: 50 mJ @ 355nm• Pulse Repetition Rate: 50 Hz• Telescope/scanner aperture: 45 cm• FOV: 0.2 mrad
Principal InvestigatorBruce Gentry NASA’s Goddard Space Flight Center [email protected]
GLOW Team MembersHuailin Chen Science Systems and Applications, Inc.Belay Demoz UMBC JCETGerry McIntire SGTKevin Vermeesh Science Systems and Applications, Inc.
Science Questions for Future CampaignsHow do clouds and aerosols impact the molecular Doppler lidar wind measurement?Can wind profile observations through the tropopause improve understanding of tropospheric/stratospheric exchange?
ReferencesDemoz, B., C. Flamant, T. Weckwerth, D. Whiteman, F. Fabry, P. Di Girolamo, D. Miller, B. Geerts, W. Brown, G. Schwemmer, B. Gentry, W. Feltz, and Z. Wang, 2006: The dryline on 22 May 2002 during IHOP_2002: Convective- scale measurements at the profiling site. Mon. Wea. Rev., 134, 294–310.
Gentry, B. and H. Chen. “Performance Validation and Error Analysis for a Direct Detection Molecular Doppler Lidar,” invited paper, SPIE Third International Asia-Pacific Environmental Remote Sensing Conference, Hangzhou, 2002.
Gentry, B. and H. Chen. “Performance Validation and Error Analysis for a Direct Detection Molecular Doppler
The GLOW mobile Doppler lidar measures wind profiles from the surface into the stratosphere. The two-axis scanner (on the roof)
allows full-sky scanning of the lidar
Active Remote-Sensing Systems: Lidar
30 Atmospheres 2017 Instrument Systems Report

Lidar,” invited paper, SPIE Third International Asia-Pacific Environmental Remote Sensing Conference, Hangzhou, 2002.
Gentry, B. and H. Chen. “Profiling tropospheric winds with the Goddard Lidar Observatory for Winds (GLOW),” Proceedings of the 21st International Laser Radar Conference, Quebec City, Canada, 2002
Gentry, B., H. Chen. S. X. Li, 2000: Wind measurements with a 355-nm molecular Doppler lidar. Opt. Lett., 25, 1231–1233.
Koch, S., C. Flamant, J. Wilson, B. Gentry, B. Jamison, 2007: An atmospheric solution observed with Doppler radar, differential absorption lidar, and a molecular Doppler lidar. J. Atmos. Oceanic Technol., 25, 1267–1287.
Korb, C. L., B. Gentry, S. Li, 1997: Edge technique Doppler lidar wind measurements with high vertical resolution. Appl. Opt., 36, 5976–5983.
Active Remote-Sensing Systems: Lidar
Atmospheres 2017 Instrument Systems Report 31

Atmospheres 2017 Instrument Systems Report 32
Active Remote-Sensing Systems
Radar

Atmospheres 2017 Instrument Systems Report 33

CRSCloud Radar System
Key CRS Facts• Heritage: Second generation ER-2 instrument based on the
ER-2 Doppler Radar (EDOP). Several other ground-based and lower-altitude airborne W-band radars are present in the community.
• A Doppler cloud radar system at W-band (94 GHz) developed for the ER-2 aircraft. Vertical profiles of radar reflectivity and hydrometeor motions are produced.
• The first deployment of CRS was in CRYSTAL–FACE during Summer 2002. Participated in TCSP, TC4, and CLASIC.
• Nominal aircraft configuration: The CRS system is configured for operation in the unpressurized tailcone of an ER-2 wing SuperPod. The single nadir antenna radiates through a 20 in × 20 in opening in the SuperPod.
• CRS URL: http://har.gsfc.nasa.gov
DescriptionCloud radars at millimeter wavelengths have demonstrated high sensitivity to clouds. These radars, at frequencies above 35 GHz, have been used in various ground-based and airborne studies that focus on the effect of clouds on the Earth’s radiation budget. The CloudSat mission has 94 GHz cloud radar as its primary instrument. Cloud radars have strong synergism with profiling backscatter lidars which have higher sensitivity to cirrus and other clouds, but whose signal becomes considerably more attenuated in thicker, more opaque clouds. The ER 2 platform provides the best satellite- like view of the tropospheric clouds and along with CRS, has a powerful suite of cloud remote-sensing instruments. CRS is a W-band (94 GHz) cloud radar that is a fully coherent Doppler system with a fixed nadir pointing beam, which maps
out Doppler winds and reflectivities in the vertical plane. CRS, combined with the existing CPL backscatter lidar system on the ER-2, provided a testbed for algorithms and a validation platform for the CloudSat and Calipso missions, as well as for the future ACE Decadal Survey Mission.
CRS Data Products• Vertical profiles: radar reflectivity, hydrometeor and air
vertical motions, ice and liquid water content, cloud layer locations
• Measurement interval: 37.5 m vertical, 100 m along track• Measurement accuracy: reflectivity of 1.0 dBZ; winds at
0.5 m/s
CRS Parameters• Transmitter peak power: 30 W• Frequency: 94.155 GHz• Pulse repetition frequency: 4000/5000 Hz (staggered)• Pulse width: 20 µs (pulse compression), 0.5 µs (short
pulse) • Receiver IF: 60 MHz• Dynamic range: 80 dB• Minimum detection signal: –28 dBZ (at 10 km range)
Principal InvestigatorGerald M. Heymsfield NASA’s Goddard Space Flight Center [email protected]
CRS Team MembersMatthew McLinden NASA’s Goddard Space Flight Center
Lihua Li NASA’s Goddard Space Flight Center
Michael Coon NASA’s Goddard Space Flight Center
Science Questions for Future Campaigns• What are the particle sizes and ice contents in
thunderstorm-generated cirrus?• What is relation between convective intensity and the
extent and depth of cirrus anvils generated by the convection?
• What are the growth mechanisms in cirrus clouds?
CRS instrument and antenna located in the tail section of an ER-2 SuperPod. The antenna points at nadir.
Active Remote-Sensing Systems: Radar
34 Atmospheres 2017 Instrument Systems Report

• What is the best approach for obtaining information on the cirrus properties using radar, lidar, and microwave, and visible, near-infrared radiometers?
Future Campaigns• GOES-16 validation flights• Future EVS flights• Future Decadal Mission and other Earth Science missions
ReferencesHeymsfield, G.M., L. Li, L. Tian, M. McGill, and Z. Wang. 2003: Thunderstorm generated cirrus observed from X and W-band airborne radar during CRYSTAL–FACE. Preprints, 31st AMS Conf. Radar Meteor., Seattle, Washington, 2003.Li, L., G.M. Heymsfield, P.E. Racette, and L. Tian, 2003: Calibration of a 94 GHZ airborne cloud radar using measurements from the ocean surface. Preprints, 31st AMS Conf. Radar Meteor., Seattle, Washington, 2003.Li, L., G.M. Heymsfield, P.E. Racette, and E. Zenker. 2003: A 94 GHz cloud radar system on a NASA ER-2 aircraft. J. Atmos. Ocean. Tech., 21, 1378–1388.Li, L., G.M. Heymsfield, L. Tian, and P.E. Racette. 2005: Measurements of ocean surface backscattering using an airborne 94-GHz cloud radar – Implication for calibration of airborne and spaceborne W-band radars, J. Atmos. Oceanic Tech., 22, 1033–1045.Liao, L., R. Meneghini, L. Tian, and G. M. Heymsfield. 2009: Measurements and simulations of nadir- viewing radar returns from the bright band at X- and W-Bands, J. Appl. Meteor. and Clim., 48, 2215-2226.McGill, M.J., L. Li, W.D. Hart, G. M. Heymsfield, D.L. Hlavka, P.E. Racette, L. Tian, M. A. Vaughan, and D.M. Winker. 2004: Combined lidar-radar remote sensing: initial results from CRYSTAL–FACE, J. Geophys. Res., 109, D2703.Tian, L., G. M. Heymsfield and L. Li, 2003: Stratiform precipitation observed by airborne radar at 94 and 10 GHZ. Preprints, 31st AMS Conf. Radar Meteor., Seattle, Washington, 2003.Tian, L., G. M. Heymsfield, L. Li, A. J. Heymsfield, A. Bansemer, C.H. Twohy, and R.C. Srivastava. 2009: A study of cirrus ice particle size distribution using TC4 observations, J. Atmos. Sci., 67, 195–216.Battaglia, A., Simone Tanelli, Gerald M. Heymsfield, and Lin Tian, 2014: The dual wavelength ratio knee: a signature of multiple scattering in airborne ku–ka observations. J. Appl. Meteor. Climatol., 53, 1790–1808
Active Remote-Sensing Systems: Radar
Atmospheres 2017 Instrument Systems Report 35

D3RDual-polarization, Dual-frequency, Doppler Radar
Key D3R Facts• The dual-frequency, dual-polarized Doppler radar (D3R)
was jointly developed by NASA’s Goddard Space Flight Center, Colorado State University, and Remote Sensing Solutions specifically for NASA’s Precipitation Measurement Mission.
• D3R utilizes the same bands (Ka and Ku) as the Dual-frequency Precipitation Radar (DPR) onboard the Global Precipitation Measurement (GPM) satellite.
• D3R consists of a solid-state transmitter and receiver, which allows full tuning of the generated signal.
• D3R is an easily transportable radar as it resides on a trailer, but is usually located at a single site for specific campaigns.
• D3R has supported several GPM field campaigns, including: the Iowa Flood Studies (IFLOODS, 2013); Integrated Precipitation/Hydrology Experiment (IPHEX; 2014) and the Olympic Mountain Experiment (OLYMPEX; 2015-2016).
• D3R URL: https://wallops-prf.gsfc.nasa.gov/Radar/D3R
DescriptionThe D3R employs a frequency-diversity waveform consisting of three frequency-spaced sub-pulses to achieve its sensitivity and minimum range. The three pulses and their associated pulse duration are long (40 s), medium (20 s), and short (1 s). The long and medium pulses are nonlinear frequency-modulated signals with an overall signal bandwidth of 3.6 MHz [Vega et al., 2014 ]. The D3R frequency diversity waveforms have a restriction requirement on the transmit waveforms spectra to avoid overlapping of
the sub-pulse frequency bands. The digital receiver filter utilizes a minimum integrated side lobe level (ISL) filter which has been shown to be excellent for weather radar applications [Bharadwaj and Chandrasekar, 2012 ]. This is a mobile, surface-based radar that has been deployed in numerous field campaigns in Canada, Iowa, South Carolina, Washington, and Wallops Flight Facility.
D3R Data Products• Radar Reflectivity• Radial Velocity• Differential Reflectivity• Differential Phase• Cross-correlation• Derived products: precipitation rate, hydrometeorID, rain
type
D3R Parameters• Frequency: Ku (13.91 GHz), Ka (35.56 GHz)• Parabolic reflector: Ku (1.83 m); Ka (0.71 m)• Beam width: Ku (0.85°); Ka (0.90°)• Scan patterns: PPI, RHI, vol & sector, vertical• Pulse width: 0.8 or 2.0 s, selectable• Peak Power: Ku (200 W); Ka (40 W per H/V)• Transmitter/Receiver: Solid-state
D3R Team MembersManuel Vega NASA’s Goddard Space Flight Center [email protected]. Chandrasekar Colorado State University [email protected] B. Wolff NASA’s Wallops Flight Facility [email protected]
Science Questions for Future Campaigns• What is the particle size and velocity distribution of
remotely sensed volumes of precipitation?• How do ground-based observations of precipitation at Ka-
and Ku-band compare to those made by the GPM DPR?
Future CampaignD3R has supported several GPM field campaigns, including: the Iowa Flood Studies (IFLOODS, 2013); Integrated
NASA’s Dual-polarization, Dual-frequency, Doppler Radar (D3R), currently deployed at NASA’s Wallops Flight Facility on Wallops Island, VA.
Active Remote-Sensing Systems: Radar
36 Atmospheres 2017 Instrument Systems Report

Precipitation/Hydrology Experiment (IPHEX; 2014) and the Olympic Mountain Experiment (OLYMPEX; 2015-2016). When not deployed for remote field campaigns, D3R is deployed and operated to support the GV activities of the Wallops Precipitation Research Facility on the main base of NASA Wallops Flight Facility. D3R is also available for other studies and collaborations.
D3R will be deployed in South Korea to support the Interactive Collaborative Experiment – Pyeongchang Olympic & Paralympic Games 2018 (ICE-POP 2018) for the winter of 2018.
ReferencesBharadwaj, N., and V. Chandrasekar (2012), Wideband waveform design principles for solid-state weather radars, J. Atmos. Oceanic Technol., 29(1), 1431, doi:10.1175/JTECH-D-11-00030.1.
Vega, M. A., V. Chandrasekar, J. Carswell, R. M. Beauchamp, M. R. Schwaller, and C. Nguyen (2014), Salient features of the dual-frequency, dual-polarized, Doppler radar for remote sensing of precipitation, Radio Sci., 49, doi:10.1002/2014RS005529.
Active Remote-Sensing Systems: Radar
Atmospheres 2017 Instrument Systems Report 37

EXRADER-2 X-Band Radar
Key EXRAD Facts• Heritage: EXRAD is an updated scanning version of the
ER-2 Doppler Radar (EDOP) that participated in CAMEX 1, 2, 3, and 4; Houston Precipitation Experiment (HOPEX); Texas and Florida Underflight Experiment (TEFLUN) A and B, TRMM LBA, CRYSTAL–FACE, TCSP, and TC4.
• EXRAD was originally designed for the NASA Global Hawk and then was reconfigured to fly on NASA ER-2 in 2014.
• The first science campaign was in the Integrated Precipitation and Hydrology Experiment (IPHEx) sponsored by GPM Ground Validation.
• Nominal aircraft configuration: The EXRAD system is configured for operation in a refurbished military radar nose for the ER-2. One scanning and one fixed beam are used; one is pointing at nadir and the other is conical or cross-track scanning.
• EXRAD URL: http://har.gsfc.nasa.gov
DescriptionAirborne weather radar systems have played an important role in studying mesoscale convective systems (MCSs) and other mesoscale and cloud-scale phenomenon. These radars have provided important information on kinematic and dynamical aspects of isolated thunderstorms, MCSs, and hurricanes.
Mesoscale phenomena often have long lifetimes (12–24 h), have large spatial extent (several hundred kilometers), and advect considerable distances over their lifetime. As a result, ground-based radars may not be suitably located for high-resolution measurements of MCSs and hurricanes because of either large radar slant ranges, or from the radars or that the MCSs are located over open ocean. In addition, most airborne
weather radars are side-looking and do not provide coverage of the top portions of weather systems.
The system operates at X-band (9.6 GHz) and is a conven-tional short-pulse coherent Doppler weather radar with fixed nadir and scanning beams. The nadir beam maps out Doppler winds and reflectivities in the vertical plane along the aircraft motion vector, the scanning beam provides horizontal winds in the cross-track direction. Wind retrieval methods for the scan-ning beam are similar to those used for the HIWRAP radar.
EXRAD Data Products• Vertical profiles: Radar reflectivity, hydrometeor vertical
motions, u, w wind components, rain rate, hail, and melting layer discrimination.
• Measurement interval: 37.5 m vertical, 100 m along-track• Measurement accuracy: Reflectivity at 0.5 dBZ; winds 0.5
m/s1
EXRAD Parameters• Transmitter peak power: 10 kW• Split between two antennae• Radio Frequency: 9.6 GHz• Pulse repetition frequency: 4000/5000 Hz• Pulse width: 1 μs• Receiver IF: 60 MHz• Dynamic range: >90 dB
EXRAD Field Campaigns• Future EVS flights• Future Decadal Mission and other Earth Science missions
Principal InvestigatorGerald M. Heymsfield NASA’s Goddard Space Flight Center [email protected]
EXRAD Team MembersLihua Li NASA’s Goddard Space Flight Center
Matthew McLinden NASA’s Goddard Space Flight Center
Michael Coon NASA’s Goddard Space Flight Center
Lin Tian GESTAR
Aft view of EXRAD nose showing transmitter and data system.
Active Remote-Sensing Systems: Radar
38 Atmospheres 2017 Instrument Systems Report
Science Questions for Future CampaignsWhat is the relation between convective intensity and the extent and depth of cirrus anvils generated by the convection?
What is the distribution of rainfall in landfalling hurricanes?
How well are hydrometeor particle-size distributions represented in TRMM algorithms?
How does overshooting convection interact with the lower stratosphere?
ReferencesBattaglia, A., K. Mroz, T. Lang, F. Tridon, S. Tanelli, G. M. Heymsfield, and L. Tian, 2016: How deep and what can a multi-wavelength suite of microwave instruments see in deep convective cores? J Geophys. Res. Atmos., 121, 16, 9356–9381, doi:10.1002/2016JD025269.
Active Remote-Sensing Systems: Radar
Atmospheres 2017 Instrument Systems Report 39
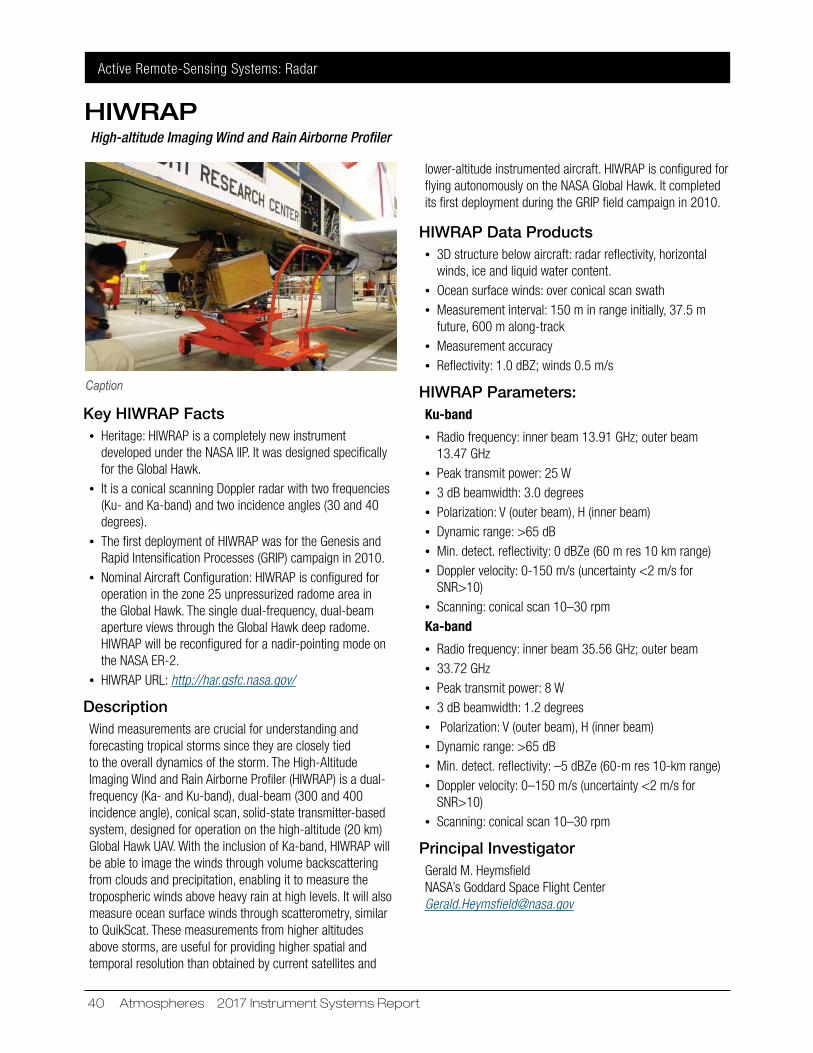
HIWRAPHigh-altitude Imaging Wind and Rain Airborne Profiler
Key HIWRAP Facts• Heritage: HIWRAP is a completely new instrument
developed under the NASA IIP. It was designed specifically for the Global Hawk.
• It is a conical scanning Doppler radar with two frequencies (Ku- and Ka-band) and two incidence angles (30 and 40 degrees).
• The first deployment of HIWRAP was for the Genesis and Rapid Intensification Processes (GRIP) campaign in 2010.
• Nominal Aircraft Configuration: HIWRAP is configured for operation in the zone 25 unpressurized radome area in the Global Hawk. The single dual-frequency, dual-beam aperture views through the Global Hawk deep radome. HIWRAP will be reconfigured for a nadir-pointing mode on the NASA ER-2.
• HIWRAP URL: http://har.gsfc.nasa.gov/
DescriptionWind measurements are crucial for understanding and forecasting tropical storms since they are closely tied to the overall dynamics of the storm. The High-Altitude Imaging Wind and Rain Airborne Profiler (HIWRAP) is a dual- frequency (Ka- and Ku-band), dual-beam (300 and 400 incidence angle), conical scan, solid-state transmitter-based system, designed for operation on the high-altitude (20 km) Global Hawk UAV. With the inclusion of Ka-band, HIWRAP will be able to image the winds through volume backscattering from clouds and precipitation, enabling it to measure the tropospheric winds above heavy rain at high levels. It will also measure ocean surface winds through scatterometry, similar to QuikScat. These measurements from higher altitudes above storms, are useful for providing higher spatial and temporal resolution than obtained by current satellites and
lower-altitude instrumented aircraft. HIWRAP is configured for flying autonomously on the NASA Global Hawk. It completed its first deployment during the GRIP field campaign in 2010.
HIWRAP Data Products• 3D structure below aircraft: radar reflectivity, horizontal
winds, ice and liquid water content.• Ocean surface winds: over conical scan swath• Measurement interval: 150 m in range initially, 37.5 m
future, 600 m along-track• Measurement accuracy• Reflectivity: 1.0 dBZ; winds 0.5 m/s
HIWRAP Parameters:Ku-band
• Radio frequency: inner beam 13.91 GHz; outer beam 13.47 GHz
• Peak transmit power: 25 W• 3 dB beamwidth: 3.0 degrees• Polarization: V (outer beam), H (inner beam)• Dynamic range: >65 dB• Min. detect. reflectivity: 0 dBZe (60 m res 10 km range)• Doppler velocity: 0-150 m/s (uncertainty <2 m/s for
SNR>10)• Scanning: conical scan 10–30 rpmKa-band
• Radio frequency: inner beam 35.56 GHz; outer beam• 33.72 GHz• Peak transmit power: 8 W• 3 dB beamwidth: 1.2 degrees• Polarization: V (outer beam), H (inner beam)• Dynamic range: >65 dB• Min. detect. reflectivity: –5 dBZe (60-m res 10-km range)• Doppler velocity: 0–150 m/s (uncertainty <2 m/s for
SNR>10)• Scanning: conical scan 10–30 rpm
Principal InvestigatorGerald M. Heymsfield NASA’s Goddard Space Flight Center [email protected]
Caption
Active Remote-Sensing Systems: Radar
40 Atmospheres 2017 Instrument Systems Report
HIWRAP Team Members Lihua Li NASA’s Goddard Space Flight Center
Matthew Mclinden NASA’s Goddard Space Flight Center
Michael Coon NASA’s Goddard Space Flight Center
Lin Tian University of Maryland, Baltimore County Goddard Earth Sciences and Technology Center
Stephen Guimond Earth System Science Interdisciplinary Center
Science Questions
• How does hurricane vortex spin-up during rapid intensification?
• Where does vortex originate during genesis of tropical cyclones?
• Do convective bursts and hot towers help intensify tropical storms?
• What are best algorithms for dual-frequency microphysics retrievals?
Field Campaigns• Future EVS flights• Future Decadal Mission and other Earth Science missions
ReferencesLi, Lihua, G. Heymsfield, J. Carswell, D. Schaubert, M. McLinden, J. Creticos, S. Guimond, M. Vega, M. Perrine, and M. Coon, J.I. Cervantes, M. Vega, S. Guimond, Lin Tian, and A. Emory, 2015: Development of the NASA High-altitude Imaging Wind and Rain Airborne Profiler (HIWRAP). IEEE Transactions on Geosci. and Remote Sens., 54, 298–310.
Guimond, S., G. Heymsfield, P. Reasor, and A. Didlake, 2016: The Rapid Intensification of Hurricane Karl (2010): New Remote Sensing Observations of Convective Bursts from the Global Hawk Platform. J. Atmos. Sci., 73, 3617–3639, doi: 10.1175/JAS-D-16-0026.1.
Didlake, A., G. Heymsfield, P. Reasor, and S. Guimond, 0: Concentric eyewall asymmetries in Hurricane Gonzalo (2014) observed by airborne radar. Mon. Wea. Rev., 0, doi: 10.1175/MWR-D-16-0175.1.
Tian, L., G.M. Heymsfield, S. Guimond, and L. Li, 2015: Velocity–Azimuth Display Analysis of Doppler Velocity for HIWRAP. J. of Appl. Meteor. and Clim., 54:8, 1792–1808
Active Remote-Sensing Systems: Radar
Atmospheres 2017 Instrument Systems Report 41

MRRMicro Rain Radar
Key MRR Facts• The Micro Rain Radar (MRR) is a small and easy to operate
K-Band Radar• Vertical profiles of rain rate and liquid water content up to
6 km (3.7 miles)• Computes detailed drop size and distribution output• User adjustable averaging intervals and height resolution• Adjustable averaging intervals 10–3600 s• Height range steps between 10 m to 200 m (600 ft) with
30 range gates • MRR URL: www.biral.com/product/micro-rain-radar//
DescriptionThe Micro Rain Radar (MRR) is a small, portable, and easy to operate. It can be used for now-casting of precipitation, i.e., it will detect the start of rain from ground level to high above the radar several minutes before the start of rain at ground level. It is a highly reliable system suitable for use in remote and extreme environments, requiring minimal maintenance, and is well adapted for long term unattended operation.
Statistically stable drop size distributions can be derived within a few seconds due to the size of the scattering volume. The MRR can detect very small amounts of precipitation (below the threshold of conventional rain gauges) detecting drop sizes between 0.25 mm and 4.53 mm. This covers the size range of atmospheric precipitation drops as larger
drops in the atmosphere are affected by the air resistance as they fall and will split into smaller drops. The droplet number concentration in each drop-diameter bin is derived from the backscatter intensity in each corresponding frequency bin
MRR Parameters• Vertical profiles of rain rate and liquid water content up to
6 km (3.7 miles)• Computes detailed drop size and distribution output• User adjustable averaging intervals and height resolution• Adjustable averaging intervals 10–3600 s• Height range steps between 10–200 m (600 ft) with 30
range gates
Support and Future PlansThe MRR2 owned by NASA’s Wallops Flight Facility currently supports GPM Ground Validation. It have been used in numerous GPM and other field campaigns and is deployed at the Wallops Precipitation Research Facility when not sent elsewhere.
Instrument Science Team MembersDavid B. Wolff NASA’s Wallops Flight Facility [email protected]
Walter A. Petersen NASA’s Marshall Space Flight Center [email protected]
Small, portable K-band radar
Active Remote-Sensing Systems: Radar
42 Atmospheres 2017 Instrument Systems Report

The Key NPOL Facts• NPOL was built by NASA using some parts from the “mile-
high” radar previously owned by the National Center for Atmospheric Research (NCAR).
• The antenna was built specifically for NASA and is capable of pointing accuracies of nearly 0.1°.
• The entire NPOL system can be packed into four sea-containers and shipped for remote operations using five 18-wheeler trucks.
• NPOL can run on commercial power, but has it’s own generator that can be used for particularly remote operations, as was done during a field campaign in Washington State during the winter of 2015-2016.
• NPOL is the only currently active, transportable S-band radar of its size in the world.
• NPOL URL: https://wallops-prf.gsfc.nasa.gov/Radar/NPOL
Description:The National Aeronautics and Space Administration, Goddard Space Flight Center, Wallops Flight Facility, Wallops Island, Virginia has deployed an integrated S-band (2700–2900 MHz) dual-polarized antenna system. The antenna system consists of a parabolic reflector, dual-polarized feed horn, pedestal, drive motors, and servo-amplifiers. The system is capable of emitting and receiving both horizontal and vertical linearly polarized RF energy.
The antenna system is used as an integrated transportable meteorological research radar, and all of the components were constructed so that they can be shipped in standard
ISO sea-containers with outside dimensions of 2.44 m × 2.44 m × 6.1m (8 ft × 8 ft × 20 ft). The primary objective of the radar system is to collect meteorological research quality reflectivity, Doppler and polarimetric data at various locations in the world. The radar system is capable of handling up to 1.0 megawatts of peak pulsed power with pulse widths up to 2 microseconds and pulse recurrence frequencies up to 1200 pulses per second. The antenna can be scanned in both the azimuth and elevation planes.
This high-performance radar is required for accurate measurements of dual-polarimetric quantities and will be used to provide accurate estimates of precipitation rates and hydrometeor types that in turn will be used to help validation space-based retrievals from the GPM-core and other satellites.
NPOL Observables• Radar reflectivity• Radial velocity• Differential reflectivity• Differential phase• Cross-correlation• Derived products: precipitation rate, hydrometeor ID,
rain type
NPOL Parameters• Frequency: 2700–2900 MHz tunable• Reflector type: 8.5 m prime-focus parabolic• Beam width: 0.93 (0.94) @ +3 (+4) dB H (V)• Scan patterns: PPI, RHI, col & sector, vertical• Pulse width: 0.8 or 2.0 s, selectable• Peak Power: 425 kW H & V channel• PRF: 250–1200 Hz
Participating Team MembersDavid B. Wolff NASA’s Wallops Flight Facility [email protected]
Walter A. Petersen NASA’s Marshall Space Flight Center [email protected]
David A. Marks Science Systems & Applications, Inc. [email protected]
NPOLNASA dual-POLarization Radar
NASA’s NPOL radar deployed during the Iowa FLOODs Study (IFLOODS) in central Iowa (May–June 2013). The antenna’s diameter is 8.5 m (28 feet) and operates at S-band (10 cm) with an output power in excess of 800 kW
Active Remote-Sensing Systems: Radar
Atmospheres 2017 Instrument Systems Report 43

Science Questions• What are the rain rates of remotely observed precipitation
systems?• What are the particle types (e.g. snow, hail, graupel, large
drops, etc.)?• Are there tornadoes or other dangers in a remotely
sensed storms?• What is the vertical distribution of hydrometeors and how
do the ground-based radar rain rate estimates compare to GPM satellite estimates?
Previous and Future CampaignsNPOL has supported several GPM field campaigns, including:
• Mid-Continental Convective Cloud Experiment (MC3E, 2011)
• Iowa Flood Studies (IFLOODS, 2013); • Integrated Precipitation/Hydrology Experiment
(IPHEX; 2014) • Olympic Mountain Experiment (OLYMPEX; 2015-2016).
When not deployed for remote field campaignsNPOL is currently deployed and operates to support the ground validation activities at the Wallops Precipitation Research Facility from a field in Newark, MD, which is about 38 km north-northeast from NASA’s Wallops Flight Facility. NPOL is also available for other studies and collaborations.
Active Remote-Sensing Systems: Radar
44 Atmospheres 2017 Instrument Systems Report

X-BADGERX-Band Atmospheric Doppler Ground-based Radar
Key X-BADGER Facts• Heritage: X-BADGER began as the ER-2 Doppler (EDOP)
radar (PI Gerald Heymsfield). The system was updated to include a solid-state power amplifier and digital receiver and then moved to a research trailer to transmit up from the surface instead of down from a high-altitude aircraft.
• Two fixed beams are used: one points vertically and the other is 20 deg forward of the vertical beam. Profiles of radar reflectivity, Doppler velocity, and spectrum width are produced. The forward beam can also provide measurements of the linear depolarization ratio.
• Participated in PECAN (2015) and is currently deployed at the Precipitation Research Facility at NASA WFF.
DescriptionFrom 2013 to 2015, the X-BADGER system was built at NASA’s Goddard Space Flight Center primarily for long-term precipitation and microphysics studies for the Global Precipitation Measurement (GPM) mission ground validation, but also for short-term field campaign deployments. The 9.6 GHz radar is housed in a custom-built research trailer that is lightweight, rugged, and mobile for easy field campaign deployment. The radar has two beams: one zenith and one dual-polarized 20 deg off-zenith “forward-pointing” beam for comparison of radar reflectivity and cloud microphysics. The radar evolved from the ER-2 Doppler (EDOP) radar design, but has been upgraded to include a 1000W GaN solid-state power amplifier and a Remote Sensing Solutions iRAP digital receiver. X-BADGER addresses the absence of 3-cm wavelength radars, and in particular relatively non-attenuating precipitation profiling radars, in the current NASA ground validation radar suite. The team incorporated innovative
methods to keep costs low while at the same time developing a state-of-the-art profiling radar.
The system operates at X-band (9.6 GHz) and is a fully developed, coherent Doppler weather radar with fixed vertical- and forward-pointing beams that map out Doppler winds and reflectivities in the vertical plane. In addition, the forward beam provides linear depolarization measurements, which are useful in discriminating microphysical characteristics of the precipitation
X-BADGER Data Products• Vertical profiles: Radar reflectivity, hydrometeor vertical
motions, rain rate, hail, and melting layer discrimination.• Vertical resolution: 37.5 m • Measurement accuracy: Reflectivity 1 dBZ; winds 1 m/s
X-BADGER Parameters• Transmitter peak power: 900 W• Split between 2 antennae• Radio Frequency: 9.6 GHz• Pulse repetition frequency: 4400 Hz• Pulse width: 0.5 μs• Receiver IF: 60 MHz• Dynamic range: >90 dB
Principal InvestigatorAmber E. Emory NASA’s Goddard Space Flight Center [email protected]
X-BADGER Team MembersMichael Coon NASA’s Goddard Space Flight Center
Stephen Nicholls University of Maryland Baltimore County, JCET
Science Questions for Future Campaigns• How does the melting layer evolve in time?• What differences can be detected with elevated
convection?• How well are hydrometeor particle-size distributions
represented in satellite precipitation algorithms?• What type/amount of precipitation do horizontally scanning
radars miss in mountain valleys due to beam blockage?
The X-BADGER radar system with digital receiver on top, data system on the middle rack, and transmitter on the bottom with
copper waveguide for the two beams on the left.
Active Remote-Sensing Systems: Radar
Atmospheres 2017 Instrument Systems Report 45

Future CampaignsNorthern Vietnam in late December 2017, integrated into ACHIEVE trailer, located in the aerosol-cloud confluence region, together with various regional contributing UAVs and IMPACT in profiling and in situ, respectively, the atmospheric state parameters and aerosol distribution.
ReferencesPreliminary Data Analysis from the Plains Elevated Convection At Night (PECAN) field campaign using NASA’s X-Band Atmospheric Doppler Ground-based Radar (X-BADGER) System—Poster presented at the 37th AMS Radar Meteorology Conference
Active Remote-Sensing Systems: Radar
46 Atmospheres 2017 Instrument Systems Report

Atmospheres 2017 Instrument Systems Report 47
Passive Remote-Sensing Systems
Microwave

48 Atmospheres 2017 Instrument Systems Report

CoSMIR shown in laboratory calibration with liquid nitrogen. The four antennae apertures correspond to the four visible receivers.
CoSMIRConical Scanning Millimeter-wave Imaging Radiometer
Key CoSMIR Facts• Heritage: An improved version of GSFC airborne MIR
(Millimeter-wave Imaging Radiometer), capable of acquiring radiometric data over the frequency range of 50–183 GHz in conical or across-track scan modes or both.
• Onboard the NASA ER-2 aircraft, performed calibration/ validation of the high-frequency channels of the Special Sensor Microwave Imager/Sounder (SSMIS), a new generation orbiting microwave imager/sounder for the DMSP (Defense Meteorological Satellite Project) F-16 satellite during 2004–2005.
• Modified to conform to high-frequency channels of the GMI (Global Precipitation Measurement mission Microwave Imager) and to acquire data in field campaigns for algorithm development of precipitation retrievals.
• Flew in GPM field campaigns MC3E in 2011, GCPEX in 2012, IPHEX in 2014, and OLYMPEX in 2015.
• Nominal Field Configuration: CoSMIR was designed to operate onboard the NASA ER-2 aircraft but has been installed and flown on the DC-8 aircraft and may be flown in other aircraft with an appropriate nadir port. As the GMI airborne simulator for GPM field campaigns, a new scan mode to acquire both conical and across-track scan data simultaneously in a given flight was implemented to satisfy the requirements of the PMM algorithm development team.
DescriptionCoSMIR is an airborne, nine-channel, total power radiometer that was originally developed for the calibration/validation of the SSMIS. When first completed in 2003, the system had four receivers near 50, 91, 150 and 183 GHz that measured horizontally polarized radiation at the frequencies of 50.3, 52.8, 53.6, 150, 183.3±1, 183.3±3, and 183.3±6.6 GHz, and dual-polarized radiation at 91.665 GHz from onboard the high-flying NASA ER-2 aircraft. All receivers and radiometer electronics are housed in a small cylindrical scan head (21.5 cm in diameter and 28 cm in length) that is rotated by a two-axis gimbaled mechanism capable of generating a wide variety of scan profiles. Two calibration targets, one maintained at ambient (cold) temperature and another heated to a hot temperature of approximately 328 K, are closely coupled to the scan head and rotate with it about the azimuth axis. Radiometric signals from each channel are sampled at 0.01-second intervals. These signals and housekeeping data are fed to the main computer in an external electronics box.
In 2004–2005 CoSMIR flew for calibration/validation of the SSMIS off the coastal areas of California. From 2011 to 2015 CoSMIR served as an airborne high-frequency simulator for GMI in four GPM field campaigns. This required changing the frequency and polarization for some channels to more closely match GMI. After modification, the nine channels are at center frequencies of 50.3, 52.6, 89, 165.5, 183.3±1, 183.3±3, and 183.3±7 GHz. 89 and 165.5 channels are dual-polarized (V and H) while the other channels are horizontal (H) polarized only
CoSMIR Data Products• Well-calibrated radiometric data between 50 and 183 GHz
with accuracy on the order of ±1 K• Through various retrieval algorithms, the acquired data can
be used to estimate snowfall rates, water vapor profiles (with known temperature profiles), light precipitation, and shallow snow cover on the ground
CoSMIR Parameters• Frequencies: 9 channels at 50.3, 52.6, 89 (H & V), 165.5
(H & V), 183.3±1, 183.3±3, and183.3±7 GHz• Scan mode: Programmable for conical scan at angles
between 0-53.6°, across scan, or a combination of both• In-flight calibration: two external targets at ~328 K and at
ambient temperature (~ 250 K at ER-2 aircraft cruising altitudes)
Passive Remote-Sensing Systems: Microwave
Atmospheres 2017 Instrument Systems Report 49

• Scan head: a cylinder 21.5 cm in diameter and 28.0 cm long
• FOV: ~4° beam width (gives a nadir footprint at the surface of about 1.4 km at ER-2 cruising altitude of 20 km)
Principal InvestigatorRachael Kroodsma ESSIC, University of Maryland NASA’s Goddard Space Flight Center [email protected]
Co-Investigators/Team MembersMatthew Fritts SGT, Inc. [email protected] Racette NASA’s Goddard Space Flight Center [email protected]
Science Questions• What advances can be made in snowfall retrieval
algorithms for GPM, particularly with the 166 GHz dual-polarization channel?
• How can we improve cloud and precipitation studies by combining CoSMIR measurements with submillimeter-wave frequencies (e.g. CoSSIR)?
Planned CampaignsThere are no campaigns currently scheduled.
ReferencesWang, J.R., P.E. Racette, J.E. Piepmeier, B. Monosmith, and W. Manning, 2007: Airborne CoSMIR observations between 50 and 183 GHz over snow-covered Sierra mountains,” IEEE Trans. Geosci. Remote Sens., 45, 55-61.
Wang, J.R., P.E. Racette, and J.E. Piepmeier, 2008: A comparison of near concurrent measurements from the SSMIS and CoSMIR for some selected channels over the frequency range of 50-183 GHz, IEEE Trans. Geosci. Remote Sens., 46, 923-933.
Wang, J.R., G.M. Skofronick-Jackson, M.R. Schwaller, C.M. Johnson, W.B. Monosmith, and Z. Zhang, 2013: Observations of storm signatures by the recently modified conical scanning millimeter-wave imaging radiometer, IEEE Trans. Geosci. Remote Sens., 51, 411-424.
Passive Remote-Sensing Systems: Microwave
50 Atmospheres 2017 Instrument Systems Report

CoSSIR shown in system functional check. The five antenna ap-
ertures corresponding to the five receivers are clearly displayed
CoSSIRCompact Scanning Submillimeter-wave Imaging Radiometer
Key CoSSIR Facts• Heritage: An instrument implemented for the
measurements of ice clouds. It has five receivers covering the frequency range of 183-874 GHz, that are housed in a compact cylinder 21.5 cm in diameter and 28.0 cm long. All receivers at frequencies > 183 GHz were developed under the Small Business Innovation Research (GSFC SBIR) program.
• Flown on the NASA ER-2 aircraft during the Cirrus Regional Study of Tropical Anvils and Cirrus Layers– Florida Area Cirrus Experiment (CRYSTAL–FACE) in 2002 and the Tropical Composition, Cloud and Climate Coupling (TC4) experiment in 2007.
• Modified to serve as an airborne simulator for the Submillimeter-Wave and Infrared Ice Cloud Experiment (SIRICE) and to acquire data in field campaigns for algorithm development of ice-cloud parameter retrievals.
• Nominal Field Configuration: CoSSIR is designed to operate onboard the NASA ER-2 aircraft, but it has also been installed in WB-57 aircraft. In both CRYSTAL– FACE and TC4, the system acquired data mainly in conical scan mode. After these experiments, a new scan mode to acquire both conical and across-track scan data simultaneously during a given flight was successfully implemented and tested to satisfy future science requirements.
DescriptionCoSSIR is an airborne, twelve-channel total power imaging radiometer that was mainly developed for the measurements of ice clouds. However, it can be used for estimation of water vapor profiles and snowfall rates. When first completed and flown in the CRYSTAL–FACE field campaign during July 2002, the system had 15 channels at different frequencies from those listed above. All the receivers and radiometer electronics are housed in a small cylindrical scan head (21.5 cm in diameter and 28 cm in length) that is rotated by a two-axis gimbaled mechanism capable of generating a wide variety of scan profiles. Two calibration targets, one maintained at ambient (cold) temperature and another heated to a hot temperature of about 328 K, are closely coupled to the scan head and rotate with it about the azimuth axis. Radiometric signals from each channel are sampled at 0.01 second intervals. These signals and housekeeping data are fed to the main computer in an external electronics box.
CoSSIR Data Products• Well-calibrated radiometric data between 183 and 874
GHz with accuracy on the order of ±1 K.
• Through various retrieval algorithms, the acquired data can be used to estimate ice cloud parameters (ice water path and mean particle size), snowfall rates, and water vapor profiles (with known temperature profiles).
CoSSIR Parameters• Frequencies: 12 channels at 183.3±1, 183.3±3, 183.3±
325±1.5, 325±3.5, 325±9.5, 448±1.4, 448±3, 448±7.2 642 (H and V), and 874 GHz
• Scan modes: programmable for conical scan at angles between 0-53.6°, across scan, or a combination of both
• In-flight Calibration: two external targets at ~328° K and at ambient temperature (~250 K at ER-2 aircraft cruising altitudes)
• Scan head: a cylinder 21.5 cm diameter and 28.0 cm long
• FOV: ~4° beam width (gives a nadir footprint at the surface of about 1.4 km at ER-2 cruising altitude of 20 km)
Passive Remote-Sensing Systems: Microwave
Atmospheres 2017 Instrument Systems Report 51
Principal InvestigatorRachael Kroodsma ESSIC, University of Maryland NASA’s Goddard Space Flight Center [email protected]
Co-Investigators / Team MembersMatthew Fritts SGT, Inc.
Paul Racette NASA’s Goddard Space Flight Center
Science QuestionsHow can we improve cloud and precipitation studies by combining CoSSIR measurements with lower frequencies (e.g. CoSMIR)?
What advances can be made in ice cloud modeling using submillimeter-wave measurements?
What is the validity of ice cloud products from future spaceborne instruments with CoSSIR-like frequencies (e.g. METOP-SG)?
Planned CampaignsThere are no campaigns currently scheduled.
ReferencesEvans, K.F., J.R. Wang, P.E. Racette, G. Heymsfield, and L. Li, 2005: Ice cloud retrievals and analysis with data from the Conical Scanning Submillimeter Imaging Radiometer and the Cloud Radar System during CRYSTAL–FACE, J. Appl. Meteor., 44, 839–859.
Wang, J.R., L.A. Chang, B. Monosmith, and Z. Zhang, 2008: Water vapor profiling from CoSSIR radiometric measurements, IEEE Trans. Geosci. Remote Sens., 46, 137-145.
Evans, K.F, J.R. Wang, D.C. Starr, G. Heymsfield, L. Li, L. Tian, R.P. Lawson, A.J. Heymsfield, and A. Bansemer, 2012: Ice hydrometeor profile retrieval algorithm for high-frequency microwave radiometers: application to the CoSSIR instrument during TC4, Atmos. Meas. Tech., 5, 2277-2306.
Passive Remote-Sensing Systems: Microwave
52 Atmospheres 2017 Instrument Systems Report

IceCube with solar panels deployed during its final I&T and sys-
tem functional check in late 2016 at Wallops Flight Facility
IceCube883-GHz Cloud Ice Radiometer on CubeSat
Key IceCube Facts• Heritage: Built upon NASA’s ER-2 aircraft sensor, the
Compact Scanning Submm-wave Imaging Radiometer (CoSSIR), IceCube seeks to raise the technology readiness level (TRL) of 883-GHz radiometer for future spaceflight mission. It is the first end-to-end CubeSat experiment led by GSFC.
• IceCube employs a novel radiometric calibration scheme involving a noise source in the receiver. Its goal is to achieve radiometric accuracy of 2K in a spaceflight environment using only space views and the pre-launch gain model.
• IceCube has no scanning mechanisms. It relies on the cubesat spin around the Sun vector (1.2° per second) to provide periodic views between the Earth (atmosphere and clouds) and cold space (calibration). Having its solar panels facing the Sun all the time produces the maximum power for operation.
• To thermally stabilize the 883-GHz receiver temperature, IceCube attaches several paraffin packs around the instrument such that excessive heat is stored during daytime and released at night by the packs.
• IceCube is on a rideshare to the International Space Station (ISS), followed by a subsequent release from ISS for nominal 28-day mission operation.
• EoPortal Overivew: IceCube https://directory.eoportal.org/web/eoportal/satellite-missions/i/icecube
DescriptionGlobal cloud ice amount is important for understanding atmospheric radiation, dynamics, and precipitation processes, and yet it remains challenging to measure cloud ice accurately from space. Submillimeter (submm) wave remote sensing has great capability of penetrating ice clouds for mass measurements. IceCube is spaceflight demonstration of 883-GHz cloud ice radiometer on a 3U CubeSat, with a goal to mature the submm wave remote-sensing technology for future NASA’s missions. The 883-GHz frequency is a spectral window whereby the radiation is highly sensitive to ice cloud scattering and interacts in depth with volume ice mass inside the cloud. IceCube is a collaborative endeavor between NASA’s Goddard Space Flight Center and Virginia Diode Inc. (VDI), funded by NASA’s Science Mission Directorate (SMD) and Earth Science Technology Office (ESTO).
IceCube Data Products• 883-GHz radiances with accuracy of ±2 K
• Cloud-induced radiances
• Cloud ice above ~12 km
Cloud Radiometer Parameters• Frequency: 883 GHz
• Channel bandwidth: 6 GHz
• Radiometric accuracy: 2K
• Radiometric precision: ~1K (1-s integration)
• Power/Mass/Volume: 7.8W / 0.9 kg / 1.3 U
• FOV: 1.8° beam width (13 km footprint at nadir)
CubeSat Information• Development period: 4/2014 – 12/2016
• Power/Mass/Volume: 20W max / 4.3 kg / 3 U
• Payload duty-cycle: 50% (day-on, night-off)
• Date rate: 70 MB/day
• Date downlink: UHF at WFF
• Attitude control: 11 arcsec (2 axes), 25 arcsec (3rd axis), star-tracker (night), sun sensor (day)
• Battery: 40 Wh
• Launch date: April 2017
• Orbit: ISS (~405 km, 51.6° inclination)
• Lifetime: ~1 year
Passive Remote-Sensing Systems: Microwave
Atmospheres 2017 Instrument Systems Report 53

Principal InvestigatorDong L. Wu NASA’s Goddard Space Flight Center [email protected]
Co-Principal InvestigatorsNASA’s Goddard Space Flight Center Jaime Esper, [email protected] Negar Ehsan, [email protected] Matt McLinden, [email protected] Jeff Piepmeier, [email protected] Paul Racette, [email protected]
Payload Team MembersNASA’s Goddard Space Flight Center Du Toit, Nelis Fetter, Lula (Lu) Hersey, Ken Horgan, Kevin Lu, Daniel Lucey, Jared Pellerano, Armi Ortiz-Acosta, Melyane Solly, Michael Wong, Mark (Englin)
Virginia Diode Inc. Hesler, Jeff Bryerton, Eric Retzloff, Steven
CubeSat Team MembersAbresch, Brian Choi, Michael K. Coleman, Alexander Corbin, Brian Duran-Aviles, Carlos Daisey, Ted Flaherty, Brooks Hart, Henry Heatwole, Scott Hudeck, John Johnson, Tom Lewis, Christopher Mast, William Purdy, Christopher Reddersen, Kurt
Rodriguez-Ruiz, Juan Stancil, Robert K.
ReferencesWu et al. (2016), IceCube: 883-GHz Cloud Radiometer Ready for its Space Journey https://esto.nasa.gov/forum/estf2016/PRESENTATIONS/Wu_A1P3_ESTF2016.pdf
Schematic drawing of IceCube operation in space. Solar panels
face the Sun with the instrument day-on and night-off.
Passive Remote-Sensing Systems: Microwave
54 Atmospheres 2017 Instrument Systems Report

SWIRP is a lab prototype of miniaturized (20 × 20 × 40 cm) conically-scanning polarimetric radiometer system for ice cloud
observations. Development period: Jan 2017–Dec 2019.
SWIRPCompact Submm-Wave and LWIR Polarimeters for Cirrus Ice Properties
Key SWIRP Facts• Objectives: 1) Observe global cloud ice and microphysical
properties accurately; 2) Substantiate size, mass, and power of combined mm/submm-wave, LWIR polarimetric-radiometer systems, scan and calibration mechanism; 3) Mature the 220 and 680-GHz direct detection technology with narrow band filters; 4) Design and develop a compact, multi-channel LWIR spectro-polarimeter.
• Heritage: Microwave (MW) polarimetric receivers (220 and 680 GHz) benefit from an earlier development in IIP-13, successful designs of Bearing and Power Transfer Assembly (BAPTA), and the new technology for 25 nm InP HEMT low-noise amplifier (LNA).
• Key subsystems: Two 680 GHz and one 220 GHz polarimetric receivers; an InfraRed Channeled Spectro-Polarimeter (IRCSP), min-BAPTA, drum structure, radiometric and polarimetric calibration assembly, RF instrument control and data acquisition, and power distribution unit.
• Partnership: NASA’s Goddard Space Flight Center, Northrop Grumman Corp, University of Arizona, and Texas A&M University.
DescriptionClouds remain as a major source of uncertainty in climate models. Ice clouds, in particular, are poorly constrained and have been used as a tuning parameter in the models to balance radiation budget at the top of atmosphere and precipitation at the surface. Lack of accurate cloud ice and its microphysical property measurements has led to large uncertainty about global clouds and their processes within the atmosphere.
The SWIRP instrument, funded by NASA’s and Earth Science Technology Office (ESTO) Instrument Incubator Program, is to enable accurate measurements of cloud ice and microphysical properties (particle size and shape) with a compact conically-scanning submm and IR polarimeters for future remote sensing from space. Radiometric and polarimetric measurements from the SWIRP submm (220 and 680 GHz) and IR (8.6, 11, and 12 μm) bands provide the needed sensitivity over a full dynamic range of cloud ice. The SWIRP conical scanning configuration will preserve horizontal and vertical polarization information for bulk cloud particle shape retrievals while the matched submm and LWIR footprints allow determination of cloud particle size from the scattering radiances at these frequencies. The compactness of SWIRP design enables cost-effective, flexible deployment of such radiometers-polarimeters in future spaceflight missions (e.g., ACE) for rapid update and frequent revisit sampling to study fast atmospheric processes.
SWIRP Data Products• Cloud ice water path (IWP)• Cloud bulk particle size (Deff) and shape (Aspect Ratio)
SWIRP Parameters• Frequency: 220 and 680 GHz, 8-12 μm• Channel bandwidth: 10 and 17 GHz, 0.3-1 μm• Power/Mass/Volume: 16W/ 12 kg / 20 × 20 × 40 cm3
• Radiometric precision: 1K (MW), 0.5 K (IR)• FOV: 15 km footprint at 220 GHz from 400 km orbit; 7.5
km at 680 GHz and LWIR
Science Questions • How much cloud ice is in the atmosphere?• What are the microphysical properties of cloud ice
particles? • How do cloud microphysical properties vary in different
cloud-precipitation systems?
Passive Remote-Sensing Systems: Microwave
Atmospheres 2017 Instrument Systems Report 55

SWIRP Principal InvestigatorDong L. Wu NASA’s Goddard Space Flight Center [email protected]
Co-Principal InvestigatorsNASA’s Goddard Space Flight Center:
Giovanni De Amici, [email protected] Negar Ehsan, [email protected] Jeff Piepmeier, [email protected]
Northrop Grumman Corp::
William Gaines, [email protected] William Deal, [email protected]
University of Arizona
Russell Chipman, [email protected]
Texas A&M University
Ping Yang, [email protected]
Team MembersCornelis Du Toit Carlos Duran Don Jennnigns Victor Marrero Michael Solly Manuel Vega
ReferencesGong, J., and D. L. Wu. 2017. “Microphysical Properties of Frozen Particles Inferred from Global Precipitation Measurement (GPM) Microwave Imager (GMI) Polarimetric Measurements.” Atmospheric Chemistry and Physics, 17: 2741-2757, doi: 10.5194/acp-17-2741-2017].
Waliser, D. E., et al. (2009), “Cloud ice: A climate model challenge with signs and expectations of progress,” J. Geophys. Res., 114, D00A21, doi:10.1029/2008JD010015.
Wu, D. L., et al. (2009), “Comparisons of global cloud ice from MLS, CloudSat, and other correlative data sets,” J. Geophys. Res. (CloudSat special section), doi:10.1029/2008JD009946.
Passive Remote-Sensing Systems: Microwave
56 Atmospheres 2017 Instrument Systems Report
Atmospheres 2017 Instrument Systems Report 57
Passive Remote-Sensing Systems
Optical

58 Atmospheres 2017 Instrument Systems Report

Air-HARP has been integrated and flown in the Langley UC-12 aircraft, and has also been approved to fly in the NASA ER2.
AirHARP Airborne Hyper-Angular Rainbow Polarimeter
Key AirHARP CubeSat Facts• Heritage: AirHARP is a fully autonomous airborne copy of
the HyperAngular Rainbow Polarimeter Instrument (HARP CubeSat), built at the Laboratory for Aerosols Clouds and Optics at UMBC in collaboration with GSFC through the Joint Center for Earth Systems and Technology (JCET). The spacecraft was built at the Space Dynamics Lab (SDL) in Utah.
• Wide field of view hyperangular polarization with no moving parts.
• Versatile, small, low power system.• Angles and sampling wavelengths are selectable within
pre-defined values• Other wavelength modules can be added from UV to
shortwave infrared (SWIR).
DescriptionAirHARP is a fully autonomous airborne copy of the HyperAngular Rainbow Polarimeter Instrument (HARP CubeSat) built at the Laboratory for Aerosols Clouds and Optics at UMBC, in collaboration with NASA GSFC through the Joint Center for Earth Systems and Technology (JCET). The Spacecraft was built at the Space Dynamics Lab (SDL) in Utah.
AirHARP is a compact, robust and accurate, multiwavelength, hyperangular polarimeter with no moving parts. The built-in hyperangular properties of AirHARP allow for the direct measurement of the angular scattering properties aerosol and cloud particles which contain information about their size, shape, refractive index and amount. As the aircraft moves, each angle and each wavelength are to cover the same
region on the ground with multiple push-broom systems, producing continuous multi-angle observations for each scene. Although the current version of AirHARP only covers the visible to NIR spectral range, this concept represents a very modular design which allows easy expansion to other wavelength ranges (already designed from 360 to 2250 nm).
This current version AirHARP is flying in the NASA’s Langley UC12 airplane but has already been approved to fly in the NASA ER2 and is also expected to fly in other airplanes.
AirHARP Future Data Products• Aerosol optical thickness and microphysics• Cloudbow phase function from water droplets• Hyperangular phase function of ice clouds• Cloud droplet effect radius and variance• Surface BRDF
AirHARP Visible and Near-Infrared Parameters• Wavelengths: 440, 550, 670, 865nm• Pixel Resolution from 20 km: 19.5m• Cross track swath: 94°�• 2048 pixels cross track (un-binned) • Up to 20 along track view angles at 440, 550, and 865 nm• Up to 60 along track view angles at 670 nm
Photograph of the AirHARP structure and doghouse. Everything is contained within the doghouse, including the data system. The
pen on the left hand side shows the scale of the system
AirHARP Principal InvestigatorJ. Vanderlei Martins University of Maryland Baltimore County/JCET NASA’s Goddard Space Flight Center [email protected]
Passive Remote-Sensing Systems: Optical
Atmospheres 2017 Instrument Systems Report 59
AirHARP Team MembersRoberto Fenandez-Borda University of Maryland Baltimore County/JCET
Lorraine Remer University of Maryland Baltimore County /JCET
Lerroy Sparr NASA’s Goddard Space Flight Center
Science Questions for Future Campaigns • What are the true scattering properties of generic aerosols
(spherical and non-spherical) and cloud ice particles?• How can a spaceborne imaging polarimeter improve our
understanding between aerosols and clouds and help to narrow down the uncertainties in climate change?
Planned CampaignsIntended to become a HARP demonstration before launch and a calibration validation effort for HARP CubeSat amer launch.
Passive Remote-Sensing Systems: Optical
60 Atmospheres 2017 Instrument Systems Report

The GSFC modified Brewer spectrophotometer.
BrewerBrewer Spectrophotometer
Key Brewer Facts• A MK IV Brewer Spectrophotometer was purchased
primarily for use in the validation of EP-TOMS ozone measurements, for research on new methods to retrieve ozone and SO2, and for the retrieval of aerosol properties in the ultraviolet range
DescriptionThe Brewer has the capability to measure the intensity of ultraviolet radiation but was modified to provide for sky radiance measurements by removing unneeded filters from the optical path. The TOMS team replaced them with a set of high quality polarization filters, added a curved quartz window to remove the Fresnel reflection effect, and incorporated a depolarizer. The TOMS team also developed new algorithms to measure the ultraviolet intensity and retrieve ozone and aerosols. The instrument has been well characterized and calibrated in laboratory at the Radiometric Calibration and Development Facility. A unique capability to measure ozone profiles in both the stratosphere and troposphere was developed. This measurement uses multiple angle observations of the sky radiances throughout the day to determine the ozone profiles every 20 minutes. The method is now being ported to the newly developed Pandora spectrometers.
In the spring of 2010, the Brewer was shipped to the University of Alaska Fairbanks, where it was being used to measure ozone at high latitudes. Zenith sky observations are being used to develop an accurate zenith sky ozone algorithm.
The Brewer was shipped back to Goddard in May 2017 to help validate the total column ozone measured by the Pandora instruments.
Brewer Data Products• Total column ozone from direct sun observations • Ultraviolet radiation from 286 to 363 nm with a resolution
of approximately 0.5 nm.• Trace gases such as NO2 in the 335–365 nm range; used
to validate OMI NO2 retrievals.• Direct sun and zenith sky radiances at medium (327– 343
nm) and high (349–363 nm) wavelengths• Polarized radiance and almucantar measurements• Polarized Umkehr ozone profiles
Co-Investigators:Richard McPeters NASA’s Goddard Space Flight Center
Jay Herman University of Maryland, Baltimore County Joint Center for Earth Systems Technology
Alexander Cede University of Maryland Earth System Science Interdisciplinary Center
Future PlansTo send the Brewer to Table Mountain, California, in 2018 to compare with Dr. Sanders’s FTUVS instrument to understand the interference between HCHO and BrO
Passive Remote-Sensing Systems: Optical
Atmospheres 2017 Instrument Systems Report 61

CARCloud Absorption Radiometer
Schematic illustration of NASA’s Cloud Absorption Radiometer (CAR) mounted in the nose of the Naval Research Lab (NRL P-3C) air-craft during the SnowEx field experiment based out of Colorado Springs, Colorado, USA, in 2017 (picture credit: The Associated Press).
Key CAR Facts• Heritage: originally designed for cloud research in the
diffusion domain defined by optically thick and horizontally extended cloud decks
• Provide unique angular measurements for characterizing surface bidirectional reflectance-distribution function
• Fly on P-3B • Previously flown on Washington Aircraft Convair (CV-580,
C-131A, Douglas B-23), Aerocommander 690A, Jetstream 31, Naval Research Lab (NRL P-3C) aircraft
• CAR URL: https://car.gsfc.nasa.gov/
DescriptionThe Cloud Absorption Radiometer (CAR) is an airborne multi-wavelength scanning radiometer that can perform several functions including: determining the single scattering albedo of clouds at selected wavelengths in the visible and near-infrared, measuring the angular distribution of scattered radiation of various surface types, and acquiring imagery of cloud and Earth surface features. The CAR was designed to operate from a position mounted on various aircraft. The CAR has been deployed on a regular basis in field campaigns around the world including deployments to Alaska, Brazil, Greenland, Kuwait, Portugal (Azores), southern Africa and many states in the continental United States.
CAR Data Products• Calibrated angular view data of the Earth surface features,
including clouds and smoke on a pixel-by-pixel basis
• Measurements of spectral BRDF (bidirectional reflection distribution function)
• Level-1C data is available at the NASA Goddard Earth Science Data Information and Services Center
CAR Parameters• Total Field of View: 190 deg
• Instantaneous Field of View: 1 deg
• Scan Rate: 100 scans/minute (1.67 Hz)
• Spectral Channels: 14
• Spectral Range: 0.34-2.30 µm
• Spatial Resolution: 18 m at nadir and about 580 m at 80-deg viewing angle at a flight altitude of 1 km
• Spatial Coverage Cross-Track: zenith to nadir or horizon to horizon
• Environmental requirements: pressurized compartment
• Instrument Mass: 42 kg
• Dimensions: 72-cm long × 41-cm wide × 39-cm deep
• Power: 345 W max
• Data rate: between acquisition hardware and the flight computer is 12KHz for display and storage
• Data storage: all data stored on a flight computer
Principal Investigator• Charles Gatebe
Universities Space Research Association [email protected]
Passive Remote-Sensing Systems: Optical
62 Atmospheres 2017 Instrument Systems Report

Team MembersRajesh Poudyal Science Systems and Applications, IncKurt Rush Instrument Electronics Development BranchCharles Ichoku NASA’s Goddard Space Flight Center
Science Questions for Future Campaigns• What is the distribution of the snow energy balance, in
different canopy types and densities, and terrain?• How does the average albedo of an area scale as we move
from point to plot to hectare to stand and domain?• How does the observed spatial heterogeneity in the aerosol
and cloud field impact the spatial distribution of radiative heating rates in the atmosphere and the surface?
• To what extent does the heterogeneity of the atmosphere impede the use of satellite remotely sensed products for quantifying aerosol-induced changes to cloud and precipitation properties?
Planned Campaigns• 2018 – Cloud and Aerosol Monsoonal Processes-
Philippines Experiment in the vicinity of the Philippines in August, 2018.
• 2019-2021 – NASA’s SnowEx Years 3-5 Campaigns. Locations to be decided.
ReferencesGatebe C. K, and King M. D. (2016). Airborne spectral BRDF of various surface types (ocean, vegetation, snow, desert, wetlands, cloud decks, smoke layers) for remote-sensing applications. Remote Sensing of Environment,179,131–148.
Passive Remote-Sensing Systems: Optical
Atmospheres 2017 Instrument Systems Report 63

Key eMAS Facts• Heritage: MODIS Airborne Simulator (MAS) • NASA ESD facility imager managed by the Ames Airborne
Sensor Facility (ASF), and supported by EOS Project Science Office.
• ER-2 airborne scanning spectrometer. Provides measurements of reflected solar and emitted thermal radiation in 38 narrowband channels; used in satellite algorithm development/validation and science studies involving cloud, aerosol, water vapor, and surface properties.
• Participated in numerous major field campaigns around the world since 1991, including: ASTEX (1992), TOGA/COARE (1993), MAST (1994), SCAR-B (1995), FIRE-ACE (1998), SAFARI (2000), CRYSTAL-FACE (2002), CC-VEX (2006), TC4 (2007), SEAC4RS (2013), RADEX/OYMPEX (2015), and ORACLES (2016).
• Nominal Flight Characteristics: 65,000 ft (20 km), above 94 percent of Earth’s atmosphere.
• eMAS URL: https://mas.arc.nasa.gov
DescriptionThe temporal and spatial distributions of clouds and aerosols are critical for understanding the Earth-atmosphere system processes and climate. Geophysical retrievals from high-quality multispectral imagery acquired from satellite platforms are an efficient and reliable means of fulfilling
global observational requirements, provided the retrievals are validated with known uncertainties. For over 25 years, eMAS/MAS has provided high spatial resolution multispectral imagery over many locations around the globe. Flying aboard the NASA ER-2 high altitude research aircraft, eMAS serves as a simulator for current and future satellite imagers, and provides essential imagery and science for field campaigns. Its frequent coincidence with in situ measurements and satellite underflights facilitates retrieval algorithm development and validation.
eMAS Data Products• True and false color imagery• Cloud detection• Cloud top temperature, pressure, thermodynamic phase• Cloud optical thickness, effective particle size, and water/
ice path• Above cloud water vapor• Aerosol optical depth• Surface reflectance
eMAS Instrument Characteristics• Total Field of View: 85.92° across swath• Swath Width: 37.25 km (at 20 km altitude)• Instantaneous Field of View: 2.5 mrad• Pixel Spatial Resolution: 50 m (at ground from 20 km)• Pixels per Scan Line: 716• Scan Rate: 6.25 scan lines per second• Spectral Channels: 38• Spectral Range: 0.47–14.0 µm
Facility LeadJeffery Myers NASA’s Ames Research Center [email protected]
Science Principal InvestigatorSteven Platnick NASA’s Goddard Space Flight Center [email protected]
Science Co-Investigator:Kerry Meyer NASA’s Goddard Space Flight Center
eMASEnhanced MODIS Airborne Simulator
Photograph of eMAS with its cover attached.
Passive Remote-Sensing Systems: Optical
64 Atmospheres 2017 Instrument Systems Report

Science Topics for Future Campaigns• Cirrus cloud optical and microphysical properties• Aerosol direct radiative effects• Cloud-aerosol interactions• Satellite algorithm development (Suomi NPP, VIIRS, PACE)
Future Campaigns• CAMP2Ex, 2018 (TBD)
ReferencesTechnical publications
King, M. D, W. P. Menzel, P. S. Grant, J. S. Myers, G. T. Arnold, S. E. Platnick, L. E. Gumley, S. C. Tsay, C. C. Moeller, M. Fitzgerald, K. S. Brown, and F. G. Osterwisch (1996), Airborne scanning spectrometer for remote sensing of cloud, aerosol, water vapor and surface properties, J. Atmos. Oceanic Technol., 13, 777–794.
Guerin, D. C., J. Fisher, and E. R. Graham (2011), The Enhanced MODIS Airborne Simulator Hyperspectral Imager, SPIE Optical, 1–11.
Selected campaign publications
Platnick, S., J. Li, M. King, H. Gerber, and P. Hobbs (2001), A solar reflectance method for retrieving the optical thickness and droplet size of liquid water clouds over snow and ice surfaces,, 106( D14), 15185–15200.
Swap, R. J., H. J. Annegarn, J. T. Suttles, M. D. King, S. Platnick, J. L. Privette, and R. J. Scholes (2003), Africa burning: A thematic analysis of the Southern African Regional Science Initiative (SAFARI 2000), 108(D13), 8465, doi:10.1029/2003JD003747.
Chiriaco, M., H. Chepfer, P. Minnis, M. Haeffelin, S. Platnick, D. Baumgardner, P. Dubuisson, M. McGill, V. Noel, and J. Pelon (2007), Comparison of CALIPSO-Like, LaRC, and MODIS Retrievals of Ice-Cloud Properties over SIRTA in France and Florida during CRYSTAL-FACE,, 46(3), 249–272.
Toon, O. B. et al., (2016), Planning, implementation, and scientific goals of the Studies of Emissions and Atmospheric Composition, Clouds and Climate Coupling by Regional Surveys (SEAC4RS) field mission,,J. Geophys. Res. Atmos., 121, doi:10.1002/2015JD024297.
Meyer, K., S. Platnick, G. T. Arnold, R. E. Holz, P. Veglio, J. Yorks, and C. Wang (2016), Cirrus cloud optical and microphysical property retrievals from eMAS during SEAC RS using bi-spectral reflectance measurements within the
1.88-µm water vapor absorption band, Atmos. Meas. Tech., 9(4), 1743–1753, doi:10.5194/amt-9-1743-2016.
Alexandrov, M. D., B. Cairns, B. van Diedenhoven, A. S. Ackerman, A. P. Wasilewski, M. J. Mcgill, J. E. Yorks, D. L. Hlavka, S. E. Platnick, and G. T. Arnold (2016), Polarized view of supercooled liquid water clouds, Remote Sensing of Environment, 181, 96–110, doi:10.1016/j.rse.2016.04.002.
Passive Remote-Sensing Systems: Optical
Atmospheres 2017 Instrument Systems Report 65

ISEM-FPSInternational Space Station SpaceCube Experiment Mini (ISEM) Fabry-Perot Spectrometer for Methane
Key ISEM-FPS Facts• The NASA GSFC ISEM-FPS is a small, low-cost sensor for
the measurement of atmospheric methane on board the ISS.
• Methane is 20-30 more effective than CO2 at trapping outgoing long wave radiation on a per molecule basis. No decadal survey mission currently addresses methane.
• A major advantage of the Fabry Perot design is its high throughput which enables the instrument to operate at very short integration times to achieve a high spatial resolution.
DescriptionThe goals of this mission are to evaluate the FPS technology for measurement of greenhouse gases and to demonstrate the usefulness of on-board processing of the raw FPS images prior to ground-station transmission. It is currently hosted on the Space Test Program-Houston 5 (STP-H5) pallet on board the International Space Station (ISS), and has been operational since March 2017. The ISEM works in tandem with the FPS to process the raw FPS data and increase the level of information per down-loaded byte.
ISEM-FPS Data Products• Column-mean, dry-air mixing ratio of CH4• Column-mean H2O mixing ratio• Atmospheric absorption spectra near 1640 nm• Surface and cloud/aerosol reflectances
Science Questions to be Addressed in Future Campaigns• What is the regional and temporal variability of methane in
the tropics and mid-latitudes?
• What geophysical processes control the emissions and loss of methane to the atmosphere globally?
• How do the methane flux processes respond to changing composition and climate, and how well can they be predicted?
Principal InvestigatorsWilliam S. Heaps Johns Hopkins University Applied Physics Laboratory [email protected] Flatley NASA’s Goddard Space Flight Center [email protected]
ISEM-FPS Science Team MembersS. Randolph Kawa NASA’s Goddard Space Flight CenterClark J. Weaver Earth System Science Interdisciplinary Center NASA’s Goddard Space Flight CenterCompton J. Tucker NASA’s Goddard Space Flight Center
The ISEM-FPS instrument prior to deployment on the ISS.
The ISEM-FPS operates on the principal of detecting spectral
absorption of reflected sunlight by greenhouse gases in the atmosphere.
ReferencesA new remote sensing filter radiometer employing a Fabry-Perot etalon and a CCD camera for column measurements of methane in the Earth atmosphere, Georgieva, E; Huang, W; Heaps, WS, IEEE International Symposium on Geoscience and Remote Sensing IGARSS, Pages: 2434-2437, doi: 10.1109/IGARSS.2012.6350999, 2012.
Passive Remote-Sensing Systems: Optical
66 Atmospheres 2017 Instrument Systems Report

GCASGeoCAPE Airborne Simulator
Key GCAS Facts• Broad wavelength coverage, hyperspectral radiance • Compact; easily deployable on a variety of aircraft.• Deployed during Discover-AQ (KingAir), NAAMES (C-130),
GOES-R Validation (ER-2)
DescriptionGCAS was developed in the IRAD program and is designed to provide high spatial resolution (< 1 km) remote-sensing observations of the tropospheric and boundary layer pollutants and aerosols in addition to providing coastal and open ocean color measurement capabilities. The system is designed to be low-cost and portable while still providing satellite instrument grade sensitivity in order to support future Air Quality/Ocean science decadal survey geostationary mission planning. This effort will also improve our capabilities to perform in-field absolute calibration of UV/VIS spectrographs and explore absolute radiance transfers with satellite instruments (e.g., OMI) under the 5-percent accuracy level.
GCAS Geolocated Data Products• Slant column abundances of NO2, O3, H2CO, and SO2• Aerosol index
GCAS Parameters• NO2 Sensitivity: 2x10-15 molecules/cm2• 2 Channel 300–480nm, 480–960nm• Spatial Resolution: 250 m2 • Spatial Coverage Cross-Track: 15 km at flight altitude of
18 km• Environmental requirements: Unpressurized compartment• Instrument Mass: 40 kg• Volume: 48 cm × 48 cm × 46 cm
• Power: 400 W max• Data rate: Real-time status and swath averaged NO2 at
1Hz = 4 Kbps• Data storage: All data stored on instrument (50 GB/8 hour
sortie)
Principal InvestigatorScott Janz NASA’s Goddard Space Flight Center [email protected]
Team MembersMatt Kowalewski University Space Research AssociationKent McCullough, Sam Xiong Science Systems and Applications, Inc.
Science Questions for Future Observations• What is the evolution of ozone and aerosol through
chemical formation and loss, transport, and deposition processes?
• What are the influences of weather in transforming and dispersing emissions, ozone, and aerosol?
• What are the regional budgets for air quality criteria pollutants (O3 NOx, SO2, and aerosol)?
• What are the emission patterns of the precursor chemicals for tropospheric ozone and aerosols?
ReferencesKowalewski M. and S. Janz, 2009: Remote-sensing Capabilities of the GeoCAPE Airborne Simulator, Proc. SPIE, 9218 (2014).
Minwei Zhang, Chuanmin Hu, Matthew G. Kowalewski, Scott J. Janz, Zhongping Lee & Jianwei Wei: Atmospheric correction of hyperspectral airborne GCAS measurements over the Louisiana Shelf using a cloud shadow approach, Intl. J. Remote Sensing, 38:4 201
Exploded view of GCAS components.
Passive Remote-Sensing Systems: Optical
Atmospheres 2017 Instrument Systems Report 67

GeoTASOGeostationary Trace Gas and Aerosol Sensor Optimization
Key GeoTASO Facts• Heritage: Developed through the Instrument Incubator
program, in collaboration with Ball Aerospace, and is designed to provide high spatial resolution (< 1 km) remote-sensing observations of the tropospheric and boundary layer pollutants and aerosols.
• Imaging spectrometer in the UV-Visible band designed for atmospheric trace gas measurements.
• Airborne simulator for the NASA EV-I TEMPO and Korean GEMS instruments.
• Deployed during Discover-AQ (LaRC Falcon) and KORUS-AQ (LaRC King Air)
DescriptionGeoTASO is a prototype of the geostationary air quality sensors being built for both the Tropospheric Emissions: Monitoring Pollution (TEMPO) and the Geostationary Environmental Monitoring Sensor (GEMS) platforms and is being used for field measurements to improve algorithm development and operational strategies for these missions. In the future, the instrument will be used in dedicated validation campaigns.
GeoTASO Geolocated Data Products• Slant and vertical column abundances of NO2, O3, H2CO,
and SO2
GeoTASO Parameters• NO2 Sensitivity: 2x10-15 molecules/cm2
• HCHO Sensitivity: 6.0x10⁻¹⁵ molecules/cm2 • 2 Channel: 265-408n m, 404-690 nm• Spatial Resolution: 250 m2 • Spatial Coverage Cross-Track: 7 km at flight altitude of 10 km
• Instrument and rack mass: 200 kg• Volume: 100 cm × 75 cm × 50 cm• Power: 700 W max• Data rate: 1k × 1k pixels @4Hz• Data storage: All data stored on instrument (50 GB per
4-hour sortie)
Principal InvestigatorScott Janz NASA’s Goddard Space Flight Center [email protected]
Team MembersMatt Kowalewski University Space Research AssociationKent McCullough, Sam Xiong Science Systems and Applications, Inc.James Leitch Ball Aerospace and Technology Corporation
Science Questions for Future Observations• What is the evolution of ozone and aerosol through chemical
formation and loss, transport, and deposition processes?• What are the influences of weather in transforming and
dispersing emissions, ozone, and aerosol?• What are the regional budgets for air quality criteria
pollutants (O3 NOx, SO2 , and aerosol)?• What are the emission patterns of the precursor chemicals
for tropospheric ozone and aerosols?
Planned Campaigns2017 – Lake Michigan Ozone Study (LMOS) in Madison, WI
2018 – Long Island Ozone Study in Long Island, NY
ReferencesNowlan, et al.: Nitrogen dioxide observations from the Geostationary Trace gas and Aerosol Sensor Optimization (GeoTASO) airborne instrument: Retrieval algorithm and measurements during DISCOVER-AQ Texas 2013, Atmos. Meas. Tech., 9, 2647-2668, 2016J. W. Leitch; T. Delker; W. Good; L. Ruppert; F. Murcray; K. Chance; X. Liu; C. Nowlan; S. J. Janz; N. A. Krotkov; K. E. Pickering; M. Kowalewski; J. Wang: The GeoTASO Airborne Spectrometer Project, Proc. SPIE, 9218 (2014).
GeoTASO instrument integrated on the NASA LaRC Falcon for the Discover-AQ deployment in Denver (2014).
Passive Remote-Sensing Systems: Optical
68 Atmospheres 2017 Instrument Systems Report

HARP CubeSatHyper-Angular Rainbow Polarimeter
Key HARP CubeSat Facts:• Heritage: PACS (Passive Aerosol and Cloud Suite),
Imaging polarimeter designed as a robust, accurate, multiwavelength, hyperangular polarimeter with no moving parts. Designed for the ER-2 aircraft but it can be easily adapted for other platforms.
• HARP is poised to be the first U.S. imaging polarimeter in space.
• HARP will ride on the CubeSat spacecraft; the launch date has not been established. Shortly thereafter, it will be released and become a fully autonomous, data-collecting satellite.
• HARP is designed to see how aerosols interact with the water droplets and ice particles that make up clouds. Aerosols and clouds are deeply connected in Earth’s atmosphere – it’s aerosol particles that seed cloud droplets and allow them to grow into clouds that eventually drop their precipitation.
• HARP will prove the on-flight capabilities of a highly-accurate, wide FOV hyper-angle imaging polarimeter for characterizing aerosol and cloud properties
• HARP is a potential precursor for the polarimeter in ACE (Aerosol-Clouds and Echosystems) and other future NASA mission
DescriptionThe HARP payload is designed to observe interactions between clouds and aerosols – small particles such as pollution, dust, sea salt or pollen, suspended in Earth’s atmosphere. HARP is poised to be the first U.S. imaging
polarimeter in space. It’s an example of the kind of advanced scientific instrument it wouldn’t have been possible to cram onto a tiny CubeSat in their early days. Shortl yafter launch, HARP will be released and become a fully autonomous, data-collecting satellite.
The HARP instrument is a wide field-of-view imager that splits three spatially identical images into three independent polarizers and detector arrays. This technique achieves simultaneous imagery of the same ground target in three polarization states and is the key innovation to achieve high polarimetric accuracy with no moving parts. The spacecraft consists of a 3U CubeSat with 3-axis stabilization designed to keep the image optics pointing nadir during data collection but maximizing solar panel sun pointing otherwise. The hyper-angular capability is achieved by acquiring overlapping images at very fast speeds.
HARP CubeSat is a fully autonomous satellite that will be launched at the ISS orbit.
Small size of the HARP instrument
HARP Future Data Products• Aerosol optical thickness and microphysics• Cloudbow phase function from water droplets• Hyperangular phase function of ice clouds• Cloud droplet effect radius and variance• Surface BRDF
HARP Visible and Near-Infrared Parameters• Wavelengths: 440, 550, 670, 865 nm• Pixel Resolution from ISS orbit: 400 m• Binned Resolution from ISS orbit: 2500 to 4000 m• Cross track swath: 94°�• 2048 pixels cross track (un-binned) • Up to 20 along track angles at 440, 550, and 865 nm• Up to 60 along track angles at 670 nm
Passive Remote-Sensing Systems: Optical
Atmospheres 2017 Instrument Systems Report 69

HARP Principal InvestigatorJ. Vanderlei Martins University of Maryland Baltimore County/JCET NASA’s Goddard Space Flight Center [email protected]
HARP Team MembersRoberto Fenandez-Borda, UMBC/JCET – NASA GSFC
Lorraine Remer, JCET-UMBC
Tim Nielsen, Utah State University/ Science Dynamics Laboratory (USU/SDL)
Leroy Sparr, NASA/GSFC
Mark Schoeberl, Science and Technology Corp (STC).
Science Questions for Future Campaigns• What are the true scattering properties of generic aerosols
(spherical and non-spherical) and cloud ice particles?• How can a spaceborne imaging polarimeter improve our
understanding between aerosols and clouds and help to narrow down the uncertainties in climate change
• Can climate change estimates of uncertainties be narrowed through new observations and a better understanding of aerosol and cloud processes from a spacebourne polarimeter?
ReferencesJ. Vanderlei Martins, ”HARP: Hyper-Angular Rainbow Polarimeter CubeSat,” ESTO Science and Technology Forum, June 14, 2016, URL: https://esto.nasa.gov/forum/estf2016/PRESENTATIONS/Martins_A1P2_ESTF2016.pdf
”HARP Hyper-Angular Rainbow Polarimeter,” USU/SDL, URL: http://www.sdl.usu.edu/downloads/harp.pdf
”Hyper-Angular Rainbow Polarimeter (HARP) CubeSat,” Feb. 2015, URL: http://userpages.umbc.edu/~martins/laco/HARP%20QuadChart%20Feb%202015.pdf
J. Vanderlei Martins, Tim Nielsen, Chad Fish, Leroy Sparr, Roberto Fernandez-Borda, Mark Schoeberl, Lorraine Remer, ”HARP CubeSat–An innovative Hyperangular Imaging Polarimeter for Earth Science Applications,” Small Sat Pre-Conference Workshop, Logan Utah, 3 Aug 2014, URL: http://digitalcommons.usu.edu/cgi/viewcontent.cgi?filename=0&article=3154&context=smallsat&type=additional
Passive Remote-Sensing Systems: Optical
70 Atmospheres 2017 Instrument Systems Report

MASTARMulti-Angle Stratospheric Aerosol Radiometer
comes from satellite limb scattering measurements, which provide greater sensitivity than space-based lidar and much better spatial sampling than occultation measurements. The Ozone Mapping and Profiling Suite (OMPS) Limb Profiler (LP), currently flying on the Suomi National Polar-orbiting Partnership (S-NPP) satellite, has been providing daily aerosol extinction profile data from limb scattering measurements since April 2012. While the S-NPP OMPS LP instrument was designed for a 7- year operating lifetime, the next OMPS LP instrument is not scheduled to fly until 2022. This raises the possibility of a data gap in this crucial measurement. Furthermore, the present OMPS LP instrument provides only a narrow viewing swath on each orbit, and is subject to systematic uncertainties because of sampling biases related to the aerosol scattering angle sampling that its viewing geometry provides.
MASTAR follows from investment by Center and 610AT resources through the IRAD program that spearheaded initial concept development (“Global Aerosol Monitoring System (GAMS),” PI: Peter Colarco, 614). The concept for MASTAR is for a multi-directional, multi-spectral instrument suitable for a 3U-sized CubeSat that provides a low-cost, multi-view capability for observing stratospheric aerosols. This concept complements and extends the capabilities of the current OMPS LP, and future versions that will fly on JPSS 2 (launching in 2022) and beyond.
The MASTAR observation concept is illustrated in Figure 1. The multi-angle viewing capability is provided by employing multiple viewing apertures around the satellite bus. Each aperture projects onto a single, centrally located mirror, which reflects the incident beam through the optical chain and projects onto a CCD that records the observation. Figure 2 shows the MASTAR concept as viewed from the top down, laid out for six viewing apertures. As illustrated, each aperture contains filters to pass in one of several wavelengths of reflected light. Each aperture/filter combination projects a line onto the CCD, where the distance along the line is related to the altitude of the feature observed. A lab bench version of the MASTAR instrument based on the original GAMS IRAD project is shown in the top image, which shows the aperture arrangements, mirror assembly, and optics and detector array. This instrument is currently being tested with input from a lab light source.
The goal for MASTAR is a multi-wavelength, multi-angle viewing capability. Nominally we are designing for three wavelengths: 350 nm for altitude registration and 675 nm and 850 nm for aerosol detection. The use of two aerosol
Key Facts• Heritage: A new instrument currently under development
under an Instrument Incubator Program (IIP) award from NASA HQ (“Advanced Development of a Multi-Angle Stratospheric Aerosol Radiometer (MASTAR)
• The goal for MASTAR is a multi-wavelength, multi-angle viewing capability
DescriptionThe contribution of atmospheric aerosols to the Earth’s energy budget is an important, yet relatively uncertain, component of the Earth system. Stratospheric aerosols represent a less well-studied, but nevertheless significant, element of this contribution through their impact on direct radiative forcing of the climate system. Comprehensive measurements of aerosol extinction vertical profiles with dense spatial sampling are needed to better constrain climate model simulations of aerosol extinction, composition, and particle size, in order to compute climate impacts. The most effective source of stratospheric aerosol extinction data
Side view of the prototype MASTAR instrument in the laboratory, showing the primary components (viewing apertures, central mir-
ror, focusing optics, CCD detector).
Passive Remote-Sensing Systems: Optical
Atmospheres 2017 Instrument Systems Report 71
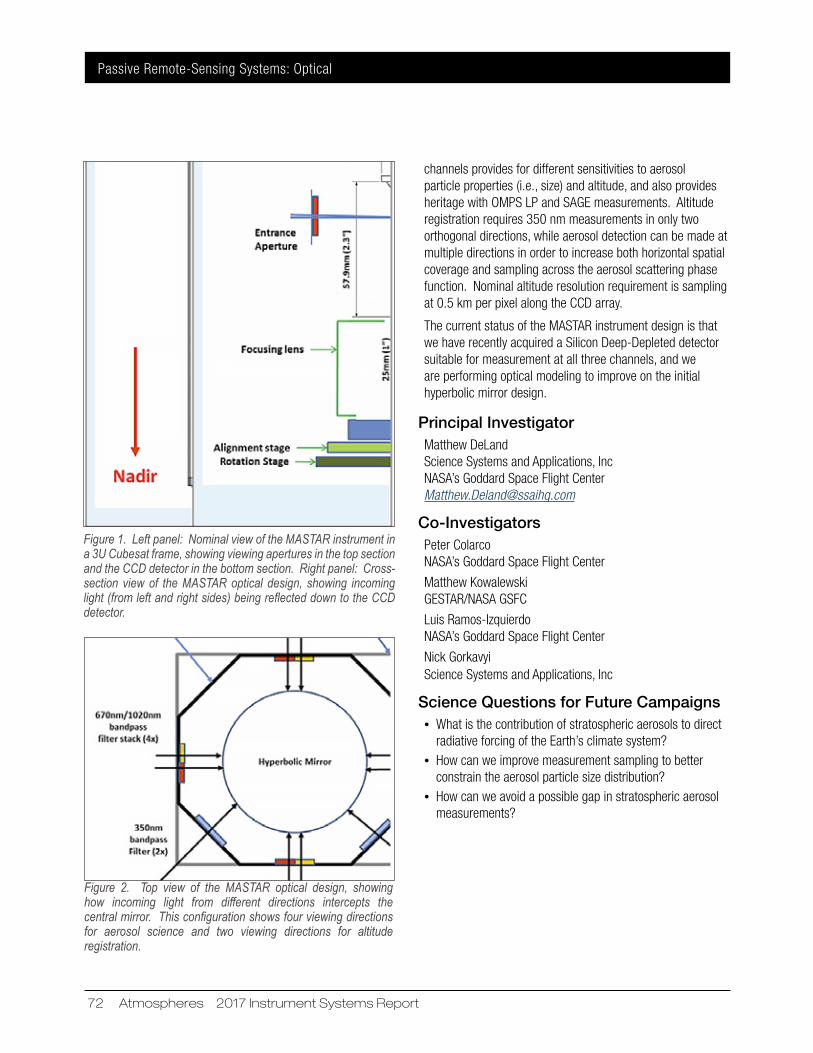
channels provides for different sensitivities to aerosol particle properties (i.e., size) and altitude, and also provides heritage with OMPS LP and SAGE measurements. Altitude registration requires 350 nm measurements in only two orthogonal directions, while aerosol detection can be made at multiple directions in order to increase both horizontal spatial coverage and sampling across the aerosol scattering phase function. Nominal altitude resolution requirement is sampling at 0.5 km per pixel along the CCD array.
The current status of the MASTAR instrument design is that we have recently acquired a Silicon Deep-Depleted detector suitable for measurement at all three channels, and we are performing optical modeling to improve on the initial hyperbolic mirror design.
Principal InvestigatorMatthew DeLand Science Systems and Applications, Inc NASA’s Goddard Space Flight Center [email protected]
Co-InvestigatorsPeter Colarco NASA’s Goddard Space Flight CenterMatthew Kowalewski GESTAR/NASA GSFCLuis Ramos-Izquierdo NASA’s Goddard Space Flight CenterNick Gorkavyi Science Systems and Applications, Inc
Science Questions for Future Campaigns• What is the contribution of stratospheric aerosols to direct
radiative forcing of the Earth’s climate system?• How can we improve measurement sampling to better
constrain the aerosol particle size distribution?• How can we avoid a possible gap in stratospheric aerosol
measurements?
Figure 1. Left panel: Nominal view of the MASTAR instrument in a 3U Cubesat frame, showing viewing apertures in the top section and the CCD detector in the bottom section. Right panel: Cross-section view of the MASTAR optical design, showing incoming light (from left and right sides) being reflected down to the CCD detector.
Figure 2. Top view of the MASTAR optical design, showing how incoming light from different directions intercepts the
central mirror. This configuration shows four viewing directions for aerosol science and two viewing directions for altitude
registration.
Passive Remote-Sensing Systems: Optical
72 Atmospheres 2017 Instrument Systems Report

Key Mini-LHR facts:• Heritage: While laser heterodyne radiometers have been in
common use at NASA for several decades, development of the miniaturized version began in July 2009 with regular measurements in the atmospheric column in April 2012. A patent was awarded to Emily Wilson and Matt McLinden in 2014 for this development which is the first LHR to use a distributive feedback laser and this optical arrangement.
• A low-cost, ground-based autonomous instrument that measures CO2, CH4, in the atmospheric column.
• Mini-LHR data products can be used for validation of satellite retrievals such as OCO-2, OCO-3, GeoCARB, and ASCENDS
• The mini-LHR can provide a continuous record of greenhouse gases that bridges gaps in data sets from flight missions
• The mini-LHR can provide coverage in key regions missed by satellite passes such as arctic regions (not covered by OCO-2) where accelerated warming due to the release of CO2 and CH4 from thawing tundra and permafrost is a concern.
DescriptionThe Mini-LHR is portable ground instrument that measures CO2 and CH4 in the atmospheric column. It has been field tested in locations such as Wisconsin (2012) to compare with TCCON observations, and California (2014) to measure methane over cattle-based agricultural areas. In early 2016 the Mini-LHR was redesigned to improve sensitivity and reduce its weight to fit on a backpack so it could be hiked into remote locations that do not have roads or electricity. Three complete instruments were built under the ROSES IDS Program, (HQ: Jared Entin) and successfully demonstrated at high latitudes (May 2016) measuring CH4 and CO2 emitted from thawing permafrost. In 2017, mini-LHRs were deployed to notable locations including Hi-SEAS - the long-term Mars simulation experiment on Mauna Loa, Hawaii as well as the University of Edinburgh in Scotland.
Operation: The mini-LHR operates in tandem with an AERONET sun photometer and uses its sun tracker as a platform for the mini-LHR light collection optics. This partnership offers a simultaneous measure of aerosols, known to be important modulators in regional carbon cycles as well as an established global framework for the deployment of mini-LHR instruments.
In the operation of the mini-LHR, infrared sunlight that has undergone absorption by the gas is collected and mixed with laser light that scans across the wavelength of the absorption feature of interest. Lines for both methane and carbon dioxide have been selected in wavelength regions that contain minimal interferences from other species such as water vapor, but also that are within the C-L bands for commercially available distributive feedback (DFB) lasers.
Mini-LHR Data Products• Half-hour, and hourly column CH4 and CO2 retrievals
Mini-LHR Parameters• High resolution spectra of CH4 and CO2 measured at
1640 nm and 1610 nm• Scanning resolution: 0.0015 nm• Field of view: 0.2 degrees• Portion of the atmosphere: entire column• Sensitivities: 1 ppm for carbon dioxide and 10 ppb for
methane
The mini-LHR makes observations of CO2 and CH4 at 11,400 feet at Mauna Loa Observatory in Hawaii in tandem with an AERONET sun photometer.
Mini-LHRMiniaturized Laser Heterodyne Radiometer
Passive Remote-Sensing Systems: Optical
Atmospheres 2017 Instrument Systems Report 73
Mini-LHR Principal InvestigatorEmily L. Wilson NASA’s Goddard Space Flight Center [email protected]
Team Members/Co-InvestigatorsMelissa Floyd AJ DiGregorio Lesley Ott Bryan Duncan Matt McLinden Geronimo Villanueva Giuliano Liuzzi Paul Palmer Jake Bleacher Bryan Caldwell Jianping Mao Liang Feng Karla Miletti Mischa Grünberg Arsenio Menendez Christopher Grünberg Lauren Cutlip Dodd Fleming
Science Questions for Future Campaigns• How will increasing anthropogenic emissions impact the
Earth’s climate? • Our Observing System Simulation Experiments (OSSE)
study results show that carbon flux uncertainty could be reduced by up to 70% if mini-LHR instruments were deployed in 50 selected AERONET sites globally.
Planned Campaigns• Hi-SEAS (Hawai’i Space Exploration Analog and Simulation)
is a Habitat on an isolated Mars-like site on the Mauna Loa side of the saddle area on the Big Island of Hawaii at approximately 8200 feet above sea level. Crewmembers from Hi-SEAS V operated the mini-LHR from March 2017-September 2017 and crewmembers from the upcoming Hi-SEAS VI will run similar operations.
• Royal Observatory in Edinburgh Scotland. As of October 2017, the mini-LHR is making regular observations.
ReferencesE. L. Wilson and M. L. McLinden, “Miniaturized laser heterodyne radiometer for carbon dioxide, methane and carbon monoxide measurements in the atmospheric column,” 8699029 (Filed 2012, Issued 2014).
G. B. Clarke, E. L. Wilson, P. Palmer, L. Feng, J.-P. Mao, A. Ramanathan, L. Ott, B. N. Duncan, H. R. Melroy, S. R. Kawa, M. L. McLinden, B. N. Holben, and A. J. DiGregorio, “The science and technology case for a global network of compact, low cost ground-based laser heterodyne radiometers for column measurements of CO2 and CH4,” American Geophysical Union (AGU) Fall Meeting (2015).
E. L. Wilson, M. L. McLinden, J. H. Miller, G. R. Allen, L. E. Ott, H. R. Melroy, and G. B. Clarke, “Miniaturized Laser Heterodyne Radiometer for Measurements of CO2 in the Atmospheric Column,” Applied Physics B: Lasers & Optics 114, 385-393 (2014).
H. R. Melroy, E. L. Wilson, G. B. Clarke, L. E. Ott, J.-P. Mao, A. K. Ramanathan, and M. L. McLinden, “Autonomous field measurements of CO2 in the atmospheric column with the miniaturized laser heterodyne radiometer (Mini-LHR),” Applied Physics B 120, 609-615 (2015).
E. L. Wilson, A. J. DiGregorio, V. J. Riot, M. S. Ammons, W. W. Bruner, D. Carter, J.-P. Mao, A. Ramanathan, S. E. Strahan, L. D. Oman, C. Hoffman, and R. M. Garner, “A 4 U laser heterodyne radiometer for methane (CH4) and carbon dioxide (CO2) measurements from an occultation-viewing CubeSat,” Measurement Science and Technology 28, 035902 (2017).
Passive Remote-Sensing Systems: Optical
74 Atmospheres 2017 Instrument Systems Report

Pandora Spectrometer InstrumentPandora Spectrometer Instrument
Three Pandora instruments tracking the Sun on the roof of the
Chesapeake Bay Bridge Tunnel during the 2017 Ozone Water-Land Environmental Transition Study (OWLETS).
Key Pandora Facts:• The Pandora instrument prototype was conceived and
deployed in 2006 with the goal of designing of a small, low cost instrument capable of providing high precision, high spatial and high temporal resolution of total columns based on direct sun measurements. It has since evolved into an instrument used for the validation of Earth observing satellites as well as a valuable addition to ground-based air quality monitoring efforts such as those of the EPA and MDE.
• The NASA Pandora Project and its ESA counterpart, Pandonia, are moving towards a synergistic, global network of instruments known as the Pandonia Global Network.
• The UV-Vis spectroscopy based instrument gathers information about trace gases such as ozone, nitrogen dioxide, formaldehyde and sulfur dioxide.
• Pandora instruments are small, mobile and can be controlled remotely through the use of software.
• Pandora instruments have participated in many field campaigns, including the 2015 KORUS-AQ campaign, the 2017 Lake Michigan Ozone Study, 2017 SARP and most recently in the 2017 OWLETS campaign.
• Pandora URL: https://acd-ext.gsfc.nasa.gov/Projects/Pandora.Test/index.html
Description• The trace gases that Pandora instruments study are
important for both climate and air quality, and the high spatial and temporal resolution of the instrument makes it a great tool for studying these emerging issues. Because of this, Pandora instruments have been sited during NASA field campaigns to provide context of trace gases for the
additional instruments being used during the campaign. Further, total column measurements of trace gases are important for calibration and validation of satellites, which is a major component of the overall Pandonia Global Network.
• The Pandora instrument consists of two main components: the sensor head and the instrument box. The sensor head acts to collect sunlight as it passes through the atmosphere and filters out certain wavelengths so that only the wavelengths where the signals of trace gases of interest lie pass through. The light passes from the sensor head into an optical fiber, which carries the light to a spectrometer inside the instrument box. The data output of the spectrometer is read by the mini-pc also housed in the instrument box and synced over the internet to be processed. Near real-time data processing is utilized during intensive field campaigns and is invaluable in coordinating the movements and measurements of ancillary instrumentation.
Pandora Data Products• Quality-assured total column ozone, nitrogen dioxide and
formaldehyde• Atmospheric profiles are a work in progress, along with
spectral fitting for sulfur dioxide
Pandora Specifications• Wavelength range: 270–530 nm• Spectral resolution: 0.6 nm• Field of view: 1.5°• Azimuth range: 360°/0.01°• Zenith range: +100°/0.01°
Improvements to the Pandora• New optics to reduce noise from straylight have been
incorporated. Addition of a new, more robust industrial grade PC has also improved performance and durability of the system. Addition of a miniature camera system for better sun tracking as well as new capability for installation on moving platforms (e.g. boat, truck). The delivery of an improved tracker system is anticipated by the spring of 2018.
Principal InvestigatorRobert J. Swap NASA’s Goddard Space Flight Center [email protected]
Passive Remote-Sensing Systems: Optical
Atmospheres 2017 Instrument Systems Report 75
Pandora Team Members• Jay Herman, NASA GSFC/JCET• Nader Abuhassan, NASA GSFC/JCET• Joe Robinson, NASA GSFC/JCET• Lena Shalaby, NASA GSFC/JCET• Mischa Grunberg, NASA GSFC/CRESST• Alexander Dimov, NASA GSFC/SSAI• Alexander Cede, NASA GSFC/GESTAR/ Luftblick• Elena Spinei, NASA GSFC/ESSIC/VT
Science Questions for Future Endeavors• What is the intra-pixel variation of trace gases
measurements from polar orbiting and geostationary satellites?
• How do urban centers and the pollution they produce behave at the land-water interface?
• How do vertical column densities of trace gases observed by Pandora vary temporally and spatially over the long term and how do they relate to satellite measurements, both polar-orbiting and geostationary?
Planned Campaigns• Pandora will continue to support planned and future
satellite validation campaigns such as 2018 – OWLETS II (Baltimore/Long Island Sound), CAMPEX (SE Asia), and TROPOMI, TEMPO and GEMS validation activities.
References• Zhao, X., Fioletov, V., Cede, A., Davies, J., & Strong, K.
(2016). Accuracy, precision, and temperature dependence of pandora total ozone measurements estimated from a comparison with the brewer triad in toronto. Atmospheric Measurement Techniques, 9(12), 5747-5761.
• Park, J., Lee, H., Kim, J., Herman, J., & Kim, D. (2017, April). HCHO column density retrieval using Pandora measurements in Seoul, Korea: Temporal characteristics and comparison with OMI measurement. EGU General Assembly Conference Abstracts (Vol. 19), p. 11727).
• Ialongo, I., Herman, J., Krotkov, N., Lamsal, L., Boersma, K. F., Hovila, J., & Tamminen, J. (2016). Comparison of OMI NO 2 observations and their seasonal and weekly cycles with ground-based measurements in Helsinki. Atmospheric Measurement Techniques, 9(10), 5203.
• Herman, J., Evans, R., Cede, A., Abuhassan, N., Petropavlovskikh, I., & McConville, G. (2015). Comparison of ozone retrievals from the Pandora spectrometer system and Dobson spectrophotometer in Boulder, Colorado. Atmospheric Measurement Techniques, 8(8), 3407-3418.
• Tzortziou, M., Herman, J. R., Cede, A., & Abuhassan, N. (2012). High precision, absolute total column ozone measurements from the Pandora spectrometer system: Comparisons with data from a Brewer double monochromator and Aura OMI. Journal of Geophysical Research: Atmospheres, 117(D16).
Passive Remote-Sensing Systems: Optical
76 Atmospheres 2017 Instrument Systems Report

SDSSolar Disk Sextant
SDS preparing for launch from Fort Sumner, New Mexico.
Key SDS Facts• Heritage: Designed at GSFC for climate/solar physics
studies by means of ultra precise measurements of the solar diameter and shape.
• The SDS uses a custom fused silica wedge to insure a long term, stable calibration reference.
• The SDS is a balloon-borne payload that is launched by CSBF at its facility in Fort Sumner, New Mexico.
DescriptionThe Solar Disk Sextant (SDS) is a balloon-borne experiment whose objective is to measure the diameter of the Sun with a precision of several milli-arc-seconds, maintained over a time frame of decades. It has flown twelve times starting in 1992, and the latest flight was in October 2011. It is scheduled to fly again in the fall of 2018, with the primary objective of continuing inter-calibration with the SODISM experiment onboard the CNES PICARD satellite, and obtaining long-term secular solar diameter data.
In general the SDS diameter measurements are to be used along with simultaneous solar luminosity measurements to determine the relationship between radius and luminosity changes in the Sun. The team can then use historical solar radius change data (obtained from solar eclipse timings) to determine the amplitude of solar luminosity changes in the past. This is to help in validating climate models. In addition, as a byproduct of this research, the team plans to obtain a value for the solar oblateness, which is of great interest to those working in relativity and fluid dynamics and several areas of solar physics.
SDS Data Products• Solar diameter• Solar shape
SDS Instrument Parameters• Main telescope is a ruggedized 7-in Questar• Reference wedge is 1/50 wave, optically bonded fused
silica, detector package = 7 linear CCDs
Principal InvestigatorU. J. Sofia American University [email protected]
GSFC Principal InvestigatorEmily L. Wilson NASA’s Goddard Space Flight Center [email protected]
Co-InvestigatorsGerard Thuillier CNES/LATMOS/SSAI
SDS Team MembersTerry Girard, Yale University Laurence Twigg, Science Systems and Applications, Inc.
Science Questions for Future Campaigns• How do the solar diameter and shape change with time?• How do the SDS and SODISM (an instrument currently
flying on the ESA PICARD satellite) solar diameter measurements compare?
• How does the solar diameter change effect climate?
Planned CampaignsSDS is scheduled to fly again in the fall of 2018, with the primary objective of continuing inter-calibration with the SODISM experiment onboard the CNES PICARD satellite, and obtaining long-term secular solar diameter data.
ReferencesSofia, S., Heaps, W., and Twigg, L.W. 1994: Ap. J, 427, 1048.
Egidi, A., Caccin, B., Sofia, S., Heaps, W., Hogey, W. and Twigg, L. 2006: Solar Physics, 247, 225.
Djafer, D., Thuillier, G., Sofia, S. and Egidi, A. 2008: Solar Physics, 247, 225.
Sofia, S, Girard, T.M., Sofia, U. J., Twigg, L., Heaps, W., and Thullier, 2013, Monthly Notices Royal Astronomical Society, 436 (3), 2151-2
Passive Remote-Sensing Systems: Optical
Atmospheres 2017 Instrument Systems Report 77

78 Atmospheres 2017 Instrument Systems Report

Atmospheres 2017 Instrument Systems Report 79
In situ Measurement Systems

80 Atmospheres 2017 Instrument Systems Report

A 2DVD as commonly deployed. The unit is elevated on cinder blocks to help mitigate splashing of rain drops by the ground.
The drops fall through the center of the instrument and are
simultaneously imaged by two orthogonal cameras.
2DVDTwo-dimensional Video Disdrometer
Key 2DVD Facts• The two-dimensional video disdrometer (2DVD) is
manufactured by Joanneum Research (https://www.joanneum.at) in Graz, Austria.
• The instrument measures individual precipitation particle (rain drops, hailstones and/or snowflakes) simultaneously with two orthogonally positioned cameras.
• 2DVDs have been in use by NASA since 1999.• Wallops Flight Facility currently owns six units, and
they have been deployed for numerous field campaigns in Finland, Canada, Oklahoma, Iowa, South Carolina, Washington and NASA’s Wallops Flight Facility.
• 2DVD URL: https://wallopsprf.gsfc.nasa.gov/Disdrometer
DescriptionThe two-dimensional video disdrometer (2DVD) is manufactured by Joanneum Research (https://www.joanneum.at) at the Institute for Applied Systems Technology in Graz, Austria. The Outdoor Unit measures every single precipitation particle—i. e. rain drops, hailstones or snowflakes—from front and side with two high-speed cameras in real-time. The Indoor Unit`s analysis PC gives detailed information about size, shape, state of aggregation, orientation and fall speed of each precipitation particle. Taking into account rain rate and accumulated amount of rain, these measurement data are the basis for a thorough understanding of atmospheric processes and precise prediction of the precipitation types, impact on radio links and free-space optics. These are surface-deployed instruments
and have been deployed in multiple field campaigns by NASA and other organizations.
2DVD Data Products• Canting angle• Drop size and shape (3D reconstruction)• Precipitation type assessment• Open interface for user-defined models
2DVD Parameters• Fall velocity, front and side view of individual precipitation
particles• Virtual top view of measurement area• Optical resolution: ~0.17 mm, no upper limit of particle
size• Time stamp with high resolution of ~18 µs • Vertical resolution better than 0.17 mm for velocity
< 10 m/s • Vertical velocity accuracy: better than 4% for velocity
< 10 m/s• Sampling area: approximately 100 x 100 mm2
• Rain rate: compared to tipping bucket differences, typically less than 10%
• Integration time: 15 s to 12 h• Sampling area: approximately 100 x 100 mm2
• Rain Rate: typically less than 10% compared to tipping bucket differences
• Integration Time: 15 sec to 12 h
Science Team MembersDavid B. Wolff NASA’s Wallops Flight Facility [email protected] A. Petersen NASA’s Marshall Space Flight Center [email protected]
Science Questions• What is the particle size and velocity distribution of par-
ticles in different precipitation types and regimes?• What is the rain or snow rate?• What is the liquid water content?• What are the concentrations and total number of particles
observed?
In Situ Measurement Systems
Atmospheres 2017 Instrument Systems Report 81

Drop size distribution of precipitation observed by 2DVD SN25 on 10/28/2012. The ordinate is drop size, the abscissa is time of day. The colors represent thenumber of drops of a given size.
Integrated parameters from 2DVD SN25 on 10/28/2012. The abscissa is time of day. The plots from left to right and top to
bottom are: rain rate; reflectivity; liquid water content; drop size; total number of drops per minute; and drop concentration, respectively.
Future Campaigns• Although the 2DVD was deployed in numerous GPM field
campaigns, they are currently deployed at NASA’s Wallops Flight Facility supporting the GPM Precipitation Research Facility (David B. Wolff, Manager). However, from time to time GPM collaborates with and loans the instruments to other members of the GPM community, e.g. NASA’s Mar-shall Flight Facility.
Referenceshttp://www.distrometer.at
In Situ Measurement Systems
82 Atmospheres 2017 Instrument Systems Report

The CAFE instrument installed on the NASA ER-2 at the Armstrong flight research facility in Palmdale, CA. CAFE is easily adapted to fly almost any aircraft.
CAFECompact Airborne Formaldehyde Experiment
Key CAFE Facts• Heritage: Designed to fly on high-altitude aircraft in
unpressurized bays, but it can fly on any aircraft with enough payload capacity (60 lbs/27.2 kg). CAFE measures HCHO in˛situ with laser-induced fluorescence (LIF)
• CAFE can fly on high altitude aircraft in unpressurized bays• CAFE uses an industrial laser to ensure long-term hands-
off operation
DescriptionFormaldehyde is produced in the atmosphere from the oxidation of volatile organic compounds (VOCs). These species can be transported to the upper troposphere where they can produce ozone and organic aerosol. Formaldehyde is an excellent tracer of these gases and a sensitive indicator of recent transport by deep convection.
The NASA Compact Airborne Formaldehyde Experiment (CAFE) instrument is a high-performance, laser-based detector for gas-phase formaldehyde. It is designed to fly on high altitude aircraft in unpressurized bays, but it can fly on any aircraft with enough payload capacity (60 lbs). The instrument samples ambient air through an inlet mounted to the exterior of the aircraft and detects the HCHO in the sample with non-resonant laser excitation at 353 nm. The laser-induced fluorescence is detected with photon counting photomultipliers, giving CAFE uniquely sensitive and fast detection capabilities. .
CAFE Data Products• Cloud ice water path (IWP)• Cloud bulk particle size (Deff) and shape (Aspect Ratio)
CAFE Parameters• Size: 38 × 43 × 60 cm3
• Weight: 25 kg • Power: 600 W • Precision: 50 pptv/s• Accuracy: ±10%• Time response: < 0.2 s• Data rate: 1 s (100 ms on request).
Principal InvestigatorPI Thomas F. Hanisco NASA’s Goddard Space Flight Center [email protected]
Co-InvestigatorsGlenn M. Wolfe Joint Center for Earth Systems TechnologyJin Liao United Space Research AssociationJason M. St. Clair Joint Center for Earth Systems Technology
Science Goals for Future Campaigns• Measure the transport of HCHO and the volatile organic
compounds (VOCs) to the upper troposphere/lower stratosphere (UT/LS)
• Quantify oxidation sources in the UT/LS• Quantify vertical profiles for remote-sensing validation
Planned Campaigns• 2017–2018: Atmospheric Tomography (Atom) Earth
Venture• 2019: Fire Impacts on Regional Emissions and Chemistry
(FIREChem), Salina, Kansas
References• J. M. St. Clair, A. K. Swanson, S. A. Bailey, G. M. Wolfe, J. E.
Marrero, L. T. Iraci, J. G. Hagopian, and T. F. Hanisco, A new non-resonant laser-induced fluorescence instrument for the airborne in situ measurement of formaldehyde, Atmos. Meas. Tech., https://doi.org/10.5194/amt-2017-282.
In Situ Measurement Systems
Atmospheres 2017 Instrument Systems Report 83

The CARAFE is installed on the Sherpa aircraft (left). Payload includes gas analyzers (center), nose radome modified for the 3-D wind system; pressure ports highlighted for clarity (upper right), and fuselage plate holding angle-of-attack and true
air temperature probes (lower right).
CARAFECARbon Airborne Flux Experiment
Key CARAFE Facts• Heritage: The instrument system used in CARAFE was
developed for flies on the NASA C-23 Sherpa which is an ideal platform for airborne eddy covariance. The instrument system used in CARAFE currently flies on the NASA C-23 Sherpa which is an ideal platform for airborne eddy covariance.
• Typical minimum flight speeds of 75 m/s provide extended sampling time and thus better turbulent statistics over a target area.
• The greenhouse gas (GHG) package consists of two Los Gatos Research (LGR) analyzers (CH4/H2O and CO2), a Picarro analyzer (CH4/CO2/H2O) and a custom-built data acquisition and fast pumping system. Laboratory tests and boundary layer spectra confirm a time response of ~10 Hz for the LGRs, sufficient to resolve > 95% of concentration fluctuations in the mixed layer. The Picarro serves as a stable accuracy standard. Fast water vapor measurements are also provided by the NASA LaRC Diode Laser Hygrometer (DLH, Diskin et al., 2002).
DescriptionEddy covariance is the only experimental method that directly quantifies surface-atmosphere exchange. The technique relies on acquiring fast, simultaneous measurements of concentration fluctuations and vertical wind speed, driven by atmospheric turbulence. The time-averaged product of vertical wind and concentration (their covariance) yields a direct measurement of the surface flux.
The advantage offered by airborne measurements, especially when combined with the wavelet transform technique, is the ability to characterize a wide range of ecosystems at model-relevant scales (1–100 km) with a single measurement package. Airborne eddy covariance has elucidated surface-atmosphere exchange processes for more than three decades (Lenschow et al., 1981; Kawa and Pearson, 1989; Wolfe et al., 2015).
CARAFE Data Products• Surface-atmosphere exchange (flux) of CO2, CH4, H2O and
sensible heat• Atmospheric chemical composition of CO2, CH4, and H2O• Atmospheric mean and turbulent wind components• Atmospheric meteorological state • Incoming photosynthetically active radiation• Spectral surface state imagery• Surface flux footprint probabilities
CARAFE Parameters• Dry air-gas mixing ratios of CO2, CH4, H2O at 10 Hz and
0.3 Hz, calibrated to NOAA/NIST standards• Concentration of H2O vapor at 20 Hz• 3-D winds, temperature, and pressure with respect to Earth
at 20 Hz• Aircraft position and attitude at 20 Hz• Visible, infrared, and 4-band vegetation health imagery
along track at 1 Hz• Downward photosynthetic photon flux density at 1 Hz
In Situ Measurement Systems
84 Atmospheres 2017 Instrument Systems Report

Principal InvestigatorsS. Randolph Kawa NASA’s Goddard Space Flight Center [email protected] M. Wolfe University of Maryland, Baltimore County [email protected] F. Hanisco NASA’s Goddard Space Flight Center [email protected] A. Newman NASA’s Goddard Space Flight Center [email protected]
Instrument Science Team MembersGlenn S. Diskin NASA’s Langley Research CenterJohn D. Barrick, K. Lee Thornhill NASA’s Langley Research CenterGeoffrey L Bland NASA’s Wallops Flight Facility
Science Questions• How do we validate greenhouse gas surfaceflux estimates
from top-down, satellite data inversions and bottom-up biogeochemical process models?
• What is the response of the geophysical processes that control GHG fluxes to changing composition and climate?
• How well can we predict future carbon-climate interactions?
Planned Campaigns• Contributions to Earth Venture-Suborbital 3• Possible ABoVE deployment
ReferencesDiskin, GS, Podolske, JR, Sachse, GW, Slate, TA, Open-path airborne tunable diode laser hygrometer, in Diode Lasers and Applications in Atmospheric Sensing, Proceedings of the SPIE, A. Fried editor, 4817, 196–204, doi: 10.1117/12.453736, 2002.
Kawa, S. R., and R. Pearson, Jr., Ozone budgets from the Dynamics and Chemistry of Marine Stratocumulus Experiment, J. Geophys. Res., 94, 9809–9817, 1989.
Lenschow, D. H., Pearson, R., and Stankov, B. B.: Estimating the ozone budget in the boundary-layer by use of aircraft measurements of ozone eddy flux and mean concentration, J. Geophys. Res. Oceans Atmos., 86, 7291–7297, 1981.
Wolfe, G. M., Hanisco, T. F., Arkinson, H. L., Bui, T. P., Crounse, et al.: Quantifying sources and sinks of reactive gases in the lower atmosphere using airborne flux observations, Geophys. Res. Lett., 42, 8231–8240, 2015.
In Situ Measurement Systems
Atmospheres 2017 Instrument Systems Report 85

COMMITChemical, Optical, and Microphysical Measurements of In situ Troposphere
Key COMMIT Facts• Nominal field configuration: comprehensive and rack-
mounted in situ instruments (shown) for aerosol and trace gas measurements, serving as a supersite in Ground-based Formation Flight operations.
• COMMIT URL: https://labs.gsfc.nasa.gov/
DescriptionCOMMIT is equipped with four inlet stacks to ingest sample air from ~6–10 meters above the ground and to split it into groups of instruments: five trace gas analyzers for carbon monoxide/dioxide, nitrogen monoxide/dioxide, sulfur dioxide and ozone concentrations, and aerosol optical (light scattering, absorption, and extinction) and microphysical (mass concentration and size distribution at different size cuts) properties. Also, two identical sets of nephelometers and scanning mobility particle sizers are used to probe aerosol hygroscopicity between ambient and adjustable relative humidities
COMMIT Data Products• Aerosol mass concentration and size distribution
• Aerosol light extinction/scattering/absorption coefficient
• Aerosol hygroscopicity and activation
• Trace gas concentration
COMMIT Parameters• Gas concentration: NOX/NOY, SO2, CO, CO2, and O3
• Mass concentrations: PM10 µm, PM2.5 µm and PM1 µm
• Aerosol size distribution: 5 nm ~ 20 µm in diameter
• Extinction/scattering/absorption coefficient: At nominal wavelengths of 0.45 (blue), 0.55 (green), 0.65 (red) µm, with additional absorption at 0.37, 0.59, 0.88, 0.95 µm
Science Questions to be Addressed• How are the chemical and microphysical properties of
aerosol particles linked to their optical properties?• How are the aerosol properties near the surface related to
those in the boundary layer and aloft?• Can we better quantify the aerosol indirect effect?
Principal InvestigatorSi-Chee Tsay [email protected] NASA’s Goddard Space Flight Center
Instrument Team MembersUkkyo Jeong University of MarylandAdrian M. Loftus University of MarylandPeter Pantina Science Systems and Applications, Inc.
Key ReferencesTsay, et al., AAQR, 2016, doi:10.4209/aaqr.2016.08.0350
Pantina, Tsay, et al., AAQR, 2016, doi:10.4209/aaqr.2015.011.0630
The COMMIT mobile laboratory was established in 2006.
The COMMIT Laboratory trailer, 2006.
In Situ Measurement Systems
86 Atmospheres 2017 Instrument Systems Report

Instrument Team MembersDavid B. Wolff NASA’s Wallops Space Flight Center [email protected] A. Petersen NASA’s Marshall Space Flight Center [email protected]
Rain Gauge Support and Future PlansNASA has deployed these gauges in multiple GPM field campaigns and also has approximately forty currently deployed in the regions near Wallops Flight Facility. Of these forty gauges, approximately 25 are located in an approximately 5 km x 5 km high-density network in the Pocomoke City, MD area.
. Dual-Tipping Bucket Rain Gauges
This figure shows a contour of rainfall over the Pocomoke grid from June 25, 2012. It well illustrates the variability of rainfall over the 25 km
2 area: namely, 27 mm in the southwest corner versus 20 mm in the northeast corner. This represents approximately a 35% difference.
RAIN GAUGESTipping Bucket Rain Gauges
Key Rain Gauge Facts• NASA has used tipping bucket rain gauges for a very
long time and their deployment has been a critical part of ground validation for the Tropical Rainfall Measuring Mission (TRMM) and Global Precipitation Measurement (GPM) Ground Validation (GV) programs.
Description
The current inventory of gauges is approximately a total of 200 separate instruments. The setup illustrated in the image above shows a dual-tipping bucket system that was designed by the University of Iowa. This system provides two independent estimates of rain rate, but has built in cell modems that communicate with NASA servers every 15 minutes to provide the number of tips that have occurred, as well as soil moisture info (if soil moisture probes are attached), the GPS location of the gauge and other “health” or metadata that is used to determine whether a gauge and/or battery needs maintenance. These 15-minute packets are then interpreted and used to maintain a near-real-time web site showing the rain rate and health info. (http://wallops-prf.gsfc.nasa.gov/Gauge)
Rain Gauge Observables• Rain rate, soil moisture, system health, GPS location
Rain Gauge Parameters• Bucket size: 8 in and 12 in• Mechanism: Tipping bucket• Tip resolution: 0.254 or 0.200 mm• Time resolution: Based on time to tip• Communications: Cell modem• Power: Solar and battery
In Situ Measurement Systems
Atmospheres 2017 Instrument Systems Report 87

The ISAF instrument operated on the NASA DC-8 by University of Maryland graduate student Heather Arkinson..
ISAFIn situ Airborne Formaldehyde
Key ISAF Facts• Heritage: ISAF was designed to fly on any number of NASA
and non-NASA aircraft. • It measures HCHO with laser-induced fluorescence (LIF).• It is small and simple enough to fly on most aircraft.• ISAF has flown on different aircraft (DC-8, P3, C-130, and
G-V) for different agencies (NASA, NOAA, and NSF).
DescriptionFormaldehyde is a reactive trace gas produced from the oxidation of hydrocarbons. It ususally has a very low abundance ranging from a few parts per trillion in the upper troposphere to a few parts per billion in the boundary layer. Despite its low abundance it plays an important role the photochemistry that determines the composition of the atmosphere.
The NASA In situ Airborne Formaldehyde (ISAF) instrument is a high-performance laser-based detector for gas phase formaldehyde. It is designed to fly on any number of NASA and non-NASA aircraft. The ISAF instrument samples ambient air through an inlet mounted to the exterior of the aircraft and detects the HCHO in the sample with rotational-state specific laser excitation at 353 nm. The laser-induced fluorescence is detected with photon counting photomultipliers, giving ISAF uniquely sensitive and fast detection capabilities.
ISAF Parameters• Size: 38 × 43 × 60 cm3
• Weight: 25 kg • Power: 200 W • Precision: 20 pptv/s
• Accuracy: ±10%• Time response: < 0.2 s• Data rate: 1 s (100 ms on request)
Principal InvestigatorThomas F. Hanisco NASA’s Goddard Space Flight Center [email protected]
Co-InvestigatorsGlenn M. Wolfe, Joint Center for Earth Systems TechnologyJin Liao, United Space Research AssociationJason M. St. Clair, Joint Center for Earth Systems Technology
Science Goals for Future Campaigns• Measure the transport of HCHO and the volatile organic
compounds that produce HCHO• Contribute to the understanding of atmospheric photo-
chemistry and oxidation processes• Determine the role of HCHO and its precursors in the for-
mation of organic aerosols• Provide in situ validation for satellite remote sensing of
HCHO columns
Planned Campaigns• 2017–2018: Atmospheric Tomography (Atom) Earth Venture• 2019: Fire Impacts on Regional Emissions and Chemistry
(FIREChem), Salina, Kansas.
ReferencesCazorla, M.; Wolfe, G. M.; Bailey, S. A., Swanson, A.K., Hanisco, T. F., A new airborne laser-induced fluorescence instrument for in situ detection of formaldehyde throughout the troposphere and lower stratosphere, Atmos. Meas. Tech., 8(2), 2015.
St. Clair, J. M., Rivera-Rios, J. C., Crounse, J. D., Praske, E., Kim, M. J., Wolfe, G. M., Keutsch, F. N., Wennberg, P.O., and Hanisco, T. F.: Investigation of a potential HCHO measurement artifact from ISOPOOH, Atmos. Meas. Tech. Disc., doi:10.5194/amt-2016-204, 2016.
Wolfe, G. M., Kaiser, J., Hanisco, T. F., Keutsch, F. N., de Gouw, J. A., Gilman, J. B., Graus, M., Hatch, C. D., Holloway, J., Horowitz, L. W., Lee, B. H., Lerner, B. M., Lopez-Hilifiker, F., Mao, J., Marvin, M. R., Peischl, J., Pollack, I. B., Roberts, J. M., Ryerson, T. B., Thornton, J. A., Veres, P. R., and Warneke, C.: Formaldehyde production from isoprene oxidation across NOx regimes, Atmos. Chem. Phys., 16, 2597–2610, 2016.
In Situ Measurement Systems
88 Atmospheres 2017 Instrument Systems Report

Automated Parsivel Unit (APU) deployed at NASA’s Wallops Flight Facility. The Parsivel disdrometer itself is shown atop the
computer and electronics container. The small antenna is a GPS.
The APUs were designed at NASA’s Marshall Flight Facility for remote operations of the Parsivel instruments.
PARSIVEL2 DISDROMETERParsivel2 Disdrometer
Key Parsivel2 Facts• The Parisivel2 is the second version of Parsivel instrument
developed by OTT Inc. http://www.ott.com/en-us/products/meteorological-sensors-26/ott-parsivel2-laser-weather-sensor-1536
• The Global Precipitation Measurement (GPM) Ground Validation (GV) currently owns 24 separate units.
• The APU unit shown above allows for specialized processing of the Parsivel2 data and can allow operations with commercial or solar power.
• APUs have been deployed during all GPM Field Campaigns and at NASA’s Wallops Flight Facility.
• Parsivel URL: https://wallops-prf.gsfc.nasa.gov/Disdrometer
DescriptionThe OTT Parsivel2 is a modern laser disdrometer for comprehensive measurement of all precipitation types. The Parsivel2 captures both the size and speed of falling particles, classifying them into one of 32 separate size and velocity
classes. The raw data are used to calculate the type, amount, intensity, and kinetic energy of the precipitation, the visibility in the precipitation, and the equivalent radar reflectivity.
Parsivel2 Observables• Rain rate, present weather, particle size distributions
Precipitation types: drizzle, rain, mixed rain/snow, snow, snow grains, sleet, hail
Parsivel2 Parameters• Optical sensor: laser diode • Wavelength: 650 nm• Peak output power: 0.2 mW• Laser Class: 1 (IEC/EN 60825-1:2014)• Measuring surface: 180 × 30 mm• Particle size range (liquid): 0.2 – 8.0 mm• Particle size range (ice): 0.2 – 25.0 mm• Particle velocity: 0.2 – 20.0 m/s• Size and velocity classes: 32
Parsivel2 Team MembersPatrick Gatlin NASA’s Marshall Space Flight Center [email protected] A. Petersen NASA’s Marshall Space Flight Center [email protected] Wingo NASA’s Marshall Space Flight Center [email protected] B. Wolff NASA’s Wallops Flight Facility [email protected]
Science Questions• What is the particle size and velocity distribution of
particles in different precipitation types and regimes?• What is the rain or snow rate?• What is the liquid water content?• What are the concentrations and total number of particles
observed?
Previous and Future CampaignsGPM currently owns and operates 24 separate Parsivel2 instruments. Many of these have been deployed in the GPM field campaigns and others are deployed at the Wallops
In Situ Measurement Systems
Atmospheres 2017 Instrument Systems Report 89

Precipitation Research Facility at NASA’s Wallops Flight Facility. In the image, the actual Parsivel2 instrument is located on the top, while the encasement was designed at NASA’s Marshall Space Flight Center and contains the processing computer, GPS, communications and power. When the Parsivel2 is paired with this NASA unit, it is referred to as the Autonomous Parsivel Unit (APU) and can use DC, AC, or solar power for operations. Currently, Parsivels are being used primarily at NASA’s Wallops Flight Facility, but some will be deployed as requested by other GPM collaborators.
ReferencesTokay A., D. B. Wolff and W. A. Petersen, 2014: Evaluation of the New Version of the Laser-Optical Disdrometer, OTT Parsivel2. J. Atmos. Ocean. Tech., 31, doi: http://dx.doi.org/10.1175/JTECH-D-13-00174.1.
In Situ Measurement Systems
90 Atmospheres 2017 Instrument Systems Report

correspond to 48 × 64 mm. Precipitation events produce many images with particles, so PIP software uses parallel processing to hasten product delivery, which is near real-time.
Software challenges were numerous because storage and near real-time analysis of one billion images per month seems overwhelming for a PC. Challenges were solved by ~15,000 lines of Matlab code and a similar amount of graphical Labview code that were written for this project. Using both Matlab and Labview enabled optimization for hardware\software interfacing, for parallel processing techniques, and for code development. Special modules were written for (a) image compression and storage (~1.8 PB/yr reduced to ~100 GB/yr), (b) conversion to a widely used visualization format (~5 GB per minute of precipitation), (c) quick particle identification, (d) speedy particle-tracking, even with multiple particles per image, (e) reliable particle fall-velocity that compensates for outliers that here-to-fore had no logically way to remove, (f) logic controls for parallel processing, optimization of two disc utilization, and looping for continuous analysis.
PIP AttributesFor each minute of precipitation, the basic data products are (a) a visualization of falling particles, (b) a particle size distribution and (c) a fall speed distribution. Raindrops (water) fall at close to terminal velocity, whereas non-raindrops (particles that contain ice, such as sleet and snow) fall at slower speeds. This distinguishing trait is used to assign rain and non-rain classification to each size within a particle size distribution.
PIP Products• Canting angle• Drop size and shape (3D reconstruction)• Hydrometeor ID• Precipitation type assessment• Effective snow density
PIP Team MembersF. L. Bliven NASA’s Wallops Flight Facility [email protected] B. Wolff NASA’s Wallops Flight Facility [email protected]
A Precipitation Imaging Package disdrometer shown deployed
near Marquette, MI. The PIP was designed by Dr. Larry Bliven at Wallops Flight Facility. It consists of a halogen light and a high-
speed camera that are used to image precipitation particles.
PIPPrecipitation Imaging Package
Key PIP Facts• The Precipitation Imaging Package (PIP) was designed in-
house at the NASA’s Wallops Flight Facility Field Support Office by Larry Bliven.
• It consists of hardware and software that record and process images of falling particles near ground level.
• The main hardware components are a high-frame-rate (380 fps), fast-shutter-speed (28 s) video camera with a lamp, and at least a six core PC with two-disc drives.
• The PIP instrument has proven very popular among Global Precipitation Measurement (GPM) partners and have been deployed worldwide, including at NASA’s Wallops Flight Facility, Colorado, Michigan, Alaska, Finland, Canada, and Korea.
• 2DVD URL: https://wallopsprf.gsfc.nasa.gov/Disdrometer
Description The instrument/package consists of hardware and software that record and process images of falling particles near ground level. The main hardware components are a high-frame-rate (380 fps), fast-shutter-speed (28 s) video camera with a lamp, and at least a six-core PC with two-disc drives. Each 8-bit grey-scale image is 240 × 640 pixels that
In Situ Measurement Systems
Atmospheres 2017 Instrument Systems Report 91

PIP observations of precipitation rate for 01/28/2016. The blue curve represents observed snow and the red curve represents
liquid rain. The total precipitation flux is the sum of these two fall amounts. The snow is identified by measuring the reduced fall speed of frozen particles.
Science Questions• What is the particle size and velocity distribution of par-
ticles in different precipitation types and regimes?• What is the rain or snow rate?• What is the liquid water content?• What are the concentrations and total number of particles
observed?• What is the effective density of observed mixed-phase or
frozen precipitation? • How can this information be used to help validate space-
borne snow rate estimates from GPM?
Future CampaignsThe PIP is undergoing a patent application process with the hope that the instrument will eventually be developed commercially by a third party. Nonetheless, the PIP is currently deployed worldwide (NASA’s Wallops Flight Facility, Colorado, Michigan, Alaska, Finland, Canada, and South Korea).
Referenceshttp://www.distrometer.at
In Situ Measurement Systems
92 Atmospheres 2017 Instrument Systems Report
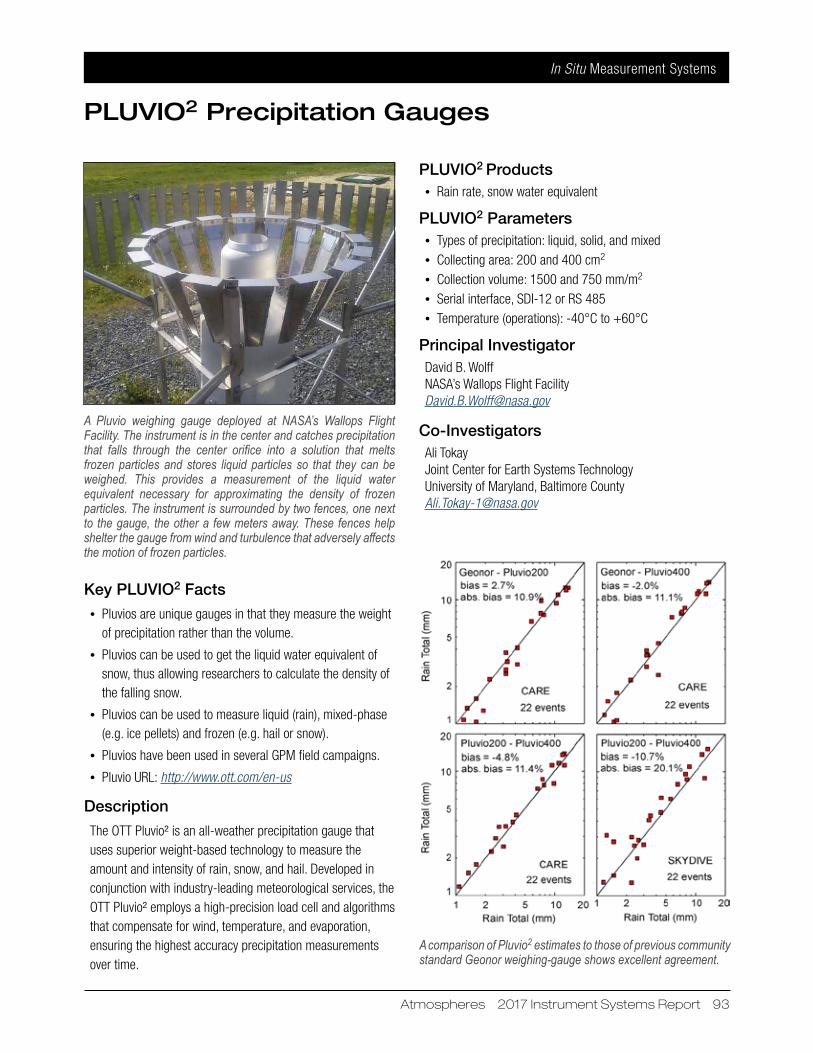
A Pluvio weighing gauge deployed at NASA’s Wallops Flight Facility. The instrument is in the center and catches precipitation
that falls through the center orifice into a solution that melts frozen particles and stores liquid particles so that they can be weighed. This provides a measurement of the liquid water equivalent necessary for approximating the density of frozen particles. The instrument is surrounded by two fences, one next
to the gauge, the other a few meters away. These fences help
shelter the gauge from wind and turbulence that adversely affects
the motion of frozen particles.
PLUVIO2 Precipitation GaugesPLUVIO2 Precipitation Gauges
Key PLUVIO2 Facts• Pluvios are unique gauges in that they measure the weight
of precipitation rather than the volume.
• Pluvios can be used to get the liquid water equivalent of snow, thus allowing researchers to calculate the density of the falling snow.
• Pluvios can be used to measure liquid (rain), mixed-phase (e.g. ice pellets) and frozen (e.g. hail or snow).
• Pluvios have been used in several GPM field campaigns.
• Pluvio URL: http://www.ott.com/en-us
DescriptionThe OTT Pluvio² is an all-weather precipitation gauge that uses superior weight-based technology to measure the amount and intensity of rain, snow, and hail. Developed in conjunction with industry-leading meteorological services, the OTT Pluvio² employs a high-precision load cell and algorithms that compensate for wind, temperature, and evaporation, ensuring the highest accuracy precipitation measurements over time.
PLUVIO2 Products• Rain rate, snow water equivalent
PLUVIO2 Parameters• Types of precipitation: liquid, solid, and mixed• Collecting area: 200 and 400 cm2
• Collection volume: 1500 and 750 mm/m2
• Serial interface, SDI-12 or RS 485• Temperature (operations): -40°C to +60°C
Principal InvestigatorDavid B. Wolff NASA’s Wallops Flight Facility [email protected]
Co-InvestigatorsAli Tokay Joint Center for Earth Systems Technology University of Maryland, Baltimore County [email protected]
A comparison of Pluvio2 estimates to those of previous community
standard Geonor weighing-gauge shows excellent agreement.
In Situ Measurement Systems
Atmospheres 2017 Instrument Systems Report 93
Walter A. Petersen NASA’s Marshall Space Flight Center [email protected]
Support and Future Plans• GPM has deployed four of its Pluvio systems in several
cold-weather field campaigns. A recent purchase of an additional 12 instruments is being prepared for deployment in the Marquette, MI, area to help validate snow totals for GPM. This deployment will occur during the 2017–2018 winter.
Science Questions• What is the density of falling snow?• How much liquid water content was contained in a given
snow event?
ReferencesHydromet/OTT: http://www.ott.com/en-us
Download PDF: http://www.ott.com/en-us/products//ott-pluvio2-l-weighing-rain-gauge-1521/productAction/outputAsPdf/
In Situ Measurement Systems
94 Atmospheres 2017 Instrument Systems Report

Atmospheres 2017 Instrument Systems Report 95
Mobile Laboratories
Integrated Active/Passive

Passive Remote-Sensing Systems: Microwave
96 Atmospheres 2017 Instrument Systems Report

The ACHIEVE mobile laboratory was established in 2011.
ACHIEVEAerosol-Cloud-Humidity Interactions Exploring and Validating Enterprise
Key ACHIEVE Facts• Heritage: In support of the NASA Earth Observing System
(EOS) endeavor, GSFC’s SMART, COMMIT, and ACHIEVE ground-based mobile laboratories were conceptualized, built, and have participated in numerous field campaigns.
• Nominal field configuration: integrated passive and active instruments for cloud, aerosol and atmospheric state parameter measurements, serving as a supersite in “Ground-based Formation Flight” operations.
• Radar calibration: Using corner-cube reflectors atop a ~30 m telescoping tower with remotely controlled rotator for precise alignment with radar beam, a unified and robust statistical procedure is used for pre- & post-mission calibration of multi-frequency radars at NASA’s Wallops Flight Facility (WFF).
• ACHIEVE URL: https://smartlabs.gsfc.nasa.gov/
DescriptionAccurate retrievals of aerosol and cloud properties from spaceborne sensors have been achieved with certain degrees of confidence. One of the most difficult tasks remaining to be resolved is the interaction between aerosols and clouds, co-existing in the planetary boundary layer. Ground-based measurements of aerosol, cloud and radiation properties are critical to provide independent assessment of satellite retrievals and diagnostic/prognostic modeling studies.
ACHIEVE, extending the success of SMART-COMMIT mobile facility, is being built to provide urgently needed test-bed data with high temporal and spectral resolutions. ACHIEVE (see above image) contains active remote-sensing instruments of scanning 94/9.6 GHz radars (c & d), vertical-pointing 24 GHz radar (e), a ceilometer (b), and passive instruments of a scanning microwave radiometer (a), an all-sky imager (f) and an interferometer (g).
ACHIEVE Data Products• Temperature, pressure and humidity profiles, boundary
layer depth• Cloud cover imagery, cloud base/top heights, cloud
thermodynamic phase• Cloud water content and effective particle size profiles,
cloud optical thickness• Doppler mean velocity• Precipitation occurrence and rain rate
Achieve Parameters• Multi-frequency (94, 24, and 9.6 [in progress] GHz) radars:
Range-dependent Doppler spectral width and equivalent radar reflectivity, linear depolarization ratio
• Ceilometer (910 nm lidar): Range-dependent total attenuated backscatter intensity
• Interferometer (3–20 µm): downwelling spectral intensity or sky brightness temperature
• Microwave radiometer (22–24, 36.5, and 89 GHz): spectral brightness temperature (H-/ V-polarization at 89 GHz)
Principal Investigator Si-Chee Tsay NASA’s Goddard Space Flight Center [email protected]
Team MembersUkkyo Jeong University of MarylandAdrian M. Loftus University of MarylandPeter Pantina Science Systems and Applications, Inc.
Science Questions to be Addressed• How do clouds respond to perturbations in aerosols, in
terms of cloud condensation nuclei and ice nuclei activa-tion?
• What is the sensitivity of the climate system to low-level cloud marco-/micro-structure in the planetary boundary layer (PBL)?
• What is the role of drizzle evaporation play in sub-cloud layer impacting the PBL moisture and energy budgets? And how quantitatively the lifecycle of drizzle can be measured?
Integrated Active/Passive Mobile Laboratories
Atmospheres 2017 Instrument Systems Report 97

Future CampaignsACHIEVE is being prepared to deploy in late December 2017 to northern Vietnam to serve at the supersite located in the aerosol-cloud confluence region, together with various regional contributing UAVs and IMPACT in profiling and in situ, respectively, the atmospheric state parameters and aerosol distribution. All of these remotely-sensed and in situ measurements will provide essential input/initialization data to the regional chemistry-transport and cloud-resolving models in simulating aerosol-cloud interaction processes and cloud lifecycle studies. These activities represent an important milestone for the 7-SEAS/BASELInE (Seven SouthEast Asian Studies/Biomass-burning Aerosols & Stratocumulus Environment: Lifecycles & Interactions Experiments 2013–2018).
Key ReferencesTsay, et al., AAQR, 2016, doi:10.4209/aaqr.2016.08.0350
Loftus, Tsay, et al., AAQR, 2016, doi:10.4209/aaqr.2015.011.0630
Integrated Active/Passive Mobile Laboratories
98 Atmospheres 2017 Instrument Systems Report

The first mobile laboratory, SMART trailer established in 2001, which hosted an array of remote-sensing instruments, has been transformed into network operations (Figs. A & B)..
SMARTSurface-sensing Measurements for Atmospheric Radiative Transfer
Key SMART Facts• Heritage: The original SMART instruments cover a wide
spectral range, from ultraviolet to microwave, and were integrated into a 20-ft weather-sealed trailer with a thermostatic temperature control to facilitate the shipping to, and operation in, the field.
• SMART: is currently transformed into six satellite units, serving as the ground-based formation measurements, with COMMIT-ACHIEVE (-Other contributing instruments) supersite operations.
• Nominal field configuration: unified sets, currently up to six of ground-based solar spectrometers (Fig. A), short-wave (with thermal-dome-effect corrected) and longwave irradiance radiometers (Fig. B), serving as the satellite units in “Ground-based Formation Flight” operations.
• SMART URL: https://smartlabs.gsfc.nasa.gov/
DescriptionAs the suite evolved over time, SMART was transformed into six unified units (Figs. A&B), distributed around the core supersite of COMMIT-ACHIEVE mobile laboratories in 2011. Collectively, it became SMARTLabs (Surface-based Mobile Atmospheric Research & Testbed Laboratories) and has been deployed in many national and international field experiments. Many unique data sets have been generated for ground-based remote sensing and in situ studies in atmospheric sciences. The overarching goal of the SMARTLabs mobile facility is to enrich NASA Earth Sciences by (1) contributing to NASA satellite missions in providing
calibration/validation of data products, (2) piloting innovative science research through the mobility, flexibility and rich suite of complementary instruments offered in these test-bed platforms, and (3) promoting NASA Earth Sciences through educational and public outreach activities.
SMART Data Products• Sun and sky solar spectral radiance at 1 nm resolution for
retrieving trace gas, aerosol and cloud properties• Surface spectral bi-directional reflectance and albedo at
1 nm resolution• Hemispheric/direct-beam shortwave and longwave
irradiance with various bands of energy partitioning
SMART Parameters• Solar spectra: 280~800 nm and 0.35~2.5 µm• Broadband wavelengths: 0.3~3, 0.4~3, 0.7~3, and
4~50 µm (global, diffuse and direct component)
Complementary setup: an additional spectroradiometer (Fig.
a) in sun-tracking mode; or in surface bi-directional reflectance mode (Fig. b); and broadband radiometers on tracking station
for diffuse and direct components (Fig. c) at various selected
wavelength ranges.
Integrated Active/Passive Mobile Laboratories
Atmospheres 2017 Instrument Systems Report 99

Principal Investigator Si-Chee Tsay NASA’s Goddard Space Flight Center [email protected]
Team MembersUkkyo Jeong University of MarylandAdrian M. Loftus University of MarylandPeter Pantina Science Systems and Applications, Inc.
Science Questions To Be Addressed • How is atmospheric composition changing? • What are the effects of atmospheric composition changes
on air quality and radiative energetics?
Planned and Participated CampaignsIn 2017, various satellite units of SMART have participated domestic OWLETS (Ozone, Water-Land Environmental Transition Study) and Eclipse and will be in the 7-SEAS/BASELInE and HMA deployments.
ReferencesJi and Tsay, JGR, 2010, doi:10.1029/2009JD013483
Ji, Tsay, et al., JGR, 2011, doi:10.1029/2011JD016466
Hansell, Tsay, et al., JGR, 2014, doi:10.1002/2013JD021423
Integrated Active/Passive Mobile Laboratories
100 Atmospheres 2017 Instrument Systems Report

PRIDE (Puerto RIco Dust Experiment), Puerto Rico, June–July 2000 SAFARI (Southern Africa Fire-Atmosphere Research Initiative), southern Africa, August–September 2000 ACE-Asia (Aerosol Characterization Experiment – Asia), eastern Asia, March–May 2001 CRYSTAL-FACE (Cirrus Regional Study of Tropical Anvils and Cirrus Layers – Florida Area Cirrus Experiment), Florida, July 2002 UAE2 (United Arab Emirates United Aerosol Experiment), Arabian Gulf, August–September 2004 EAST-AIRE (East Asian Study of Tropospheric Aerosols: an
International Regional Experiment), China, February–July 2005 BASE-ASIA (Biomass-burning Aerosols in South East-Asia:
Smoke Impact Assessment), Thailand, February–May 2006 NAMMA (NASA African Monsoon Multidisciplinary Activities), Cape Verde, August–September 2006 CHINA2-AMY08 (Cloud, Humidity Interacting Natural/Anthropogenic Aerosols in Asian Monsoon Year-2008), China, April–October 2008 7-SEAS/Dongsha (7-South East Asian Studies/Dongsha), Dongsha Island, Taiwan, March-June 2010
DISCOVER-AQ (Deriving Information on Surface conditions from
COlumn and VERtically resolved observations relevant to Air Quality), Greater Washington-Baltimore area, July 2011 7-SEAS/Son La (7-South East Asian Studies), Son La, Vietnam, March-April 2012–2013 IPHEx (Integrated Precipitation and Hydrology Experiment), eastern United States, May–June 2014 7-SEAS/BASELInE (Biomass-burning Aerosols & Stratocumulus Environment: Lifecycles & Interactions Experiment), northern Southeast Asia, March–April 2013–2015 DSCOVR/Eclipse (Deep Space Climate Observatory – Solar Eclipse), mid-Western U.S., August 2017 7-SEAS/Yen Bai (7-South East Asian Studies), Yen Bai, Vietnam, March–April 2018 RAJO-MEGHA (Radiation, Aerosol Joint Observation Modeling Exploration over Glaciers in Himalayan Area), Nepal and India, April–June 2018 7-SEAS (7-South East Asian Studies), Maritime Continent, August–September 2018
Integrated Active/Passive Mobile Laboratories
Atmospheres 2017 Instrument Systems Report 101

102 Atmospheres 2017 Instrument Systems Report

Atmospheres 2017 Instrument Systems Report 103
AcronymsAcronyms

104 Atmospheres 2017 Instrument Systems Report
7-SEAS Seven South East Asian Studies
ACAM Airborne Compact Atmospheric Mapper
ACE Advanced Composition Explorer
ACHIEVE Aerosol-Cloud-Humidity Interactions Exploring and Validating Enterprise
AERONET Aerosol Robotic Network
ALVICE Atmospheric Lidar for Validation, Interagency Collaboration and Education
ARM IOP-2000 Atmospheric Radiation Measurement program – cloud Intensive Operational Period – March 2000
AROTAL Airborne Raman Ozone, Temperature, and Aerosol Lidar
ASCENDS Active Sensing of CO2 Emissions over Nights, Days, and Seasons
AT Lidar Aerosol and Temperature Lidar
BASE-ASIA Biomass-burning Aerosols in South-East Asia: Smoke Impact Assessment
CalVal Calibration and Validation
CATS Cloud-Aerosol Transport Lidar
CCD Charge Coupled Device
CLS Cloud Lidar System
CMOS Complementary Metal-Oxide Semiconductor
CNES Centre National d’Etudes Spatiales
COMMIT Chemical, Optical, and Microphysical Measurements of In situ Troposphere
CoSMIR Conical Scanning Millimeter-wave Imaging Radiometer
CoSSIR Compact Scanning Submillimeter-wave Imaging Radiometer
CPL Cloud Physics Lidar
CRS Cloud Radar System
CRYSTAL-FACE Cirrus Regional Study of Tropical Anvils and Cirrus Layers —Florida Area Cirrus Experiment
DDF Director’s Discretionary Fund
DIAL Differential Absorption Lidar
DSCOVR Deep Space Climate Observatory
EDOP ER-2 Doppler Radar
EPIC Earth Polychromatic Imaging Camera
EP-TOMS Earth Probe–Total Ozone Mapping Spectrometer
ER-2 Earth Science Technology Office
ESTO Earth Sciences Technology Office
EXRAD ER-2 X-band Radar
FOV Field of View
FPGA Field Programmable Gate Array
GACM Global Atmospheric Composition Mission
GCOS Global Climate Observing System
GEO-CAPE Geostationary Coastal and Air Pollution Events
GOES Geostationary Operational Environmental Satellite
GeoSpec Geostationary Spectrograph for Earth and Atmospheric Science Applications
Atmospheres 2017 Instrument Systems Report 105

GEST Goddard Earth Sciences and Technology Center
GloPac Global Hawk Pacific campaign
GLOW Goddard Lidar Observatory for Winds
GPM Global Precipitation Measurement
GRUAN GCOS Reference Upper Air Network
HARGLO Intercomparison of Wind Profile Systems experiment involving the HARLIE and GLOW instruments
HARLIE Holographic Airborne Lidar Instrument Experiment
HIWRAP High-Altitude Imaging and Wind and Rain Airborne Profiler
HOE Holographic Optical Element
HOPEX Houston Precipitation Experiment
HSRL High Spectral Resolution Lidar
ICESat-2 Ice, Cloud, and land Elevation Satellite-2
IHOP International H2O Project
IIP Instrument Incubator Program
IRAD Internal Research and Development
ISO International Standards Organization
JCET Joint Center for Earth Systems Technology
JPL Jet Propulsion Laboratory
KILT Kiritimati Island Lidar Trailer
LBA Large Scale Biosphere-Atmosphere Experiment in Amazonia
LIF Laser Induced Florescence
MABEL Multiple Altimeter Beam Experimental Lidar
MOHAVE Measurements of Humidity in the Atmosphere and Validation Experiments
MPLNET Micro Pulse Lidar Network
NAAMES North Atlantic Aerosols and Marine Ecosystems
NAMMA NASA African Monsoon Multidisciplinary Analyses
NASA National Aeronautics and Space Administration
NDACC Network for the Detection of Atmospheric Composition Change
NDSC Network for the Detection of Stratospheric Change
NIR Near Infrared
NPOESS National Polar-orbiting Operational Environmental Satellite System
NPP NPOESS Preparatory Project
NRC National Research Council
OMI Ozone Monitoring Instrument
PACS Passive Aerosol and Cloud Suite
PSC Polar Stratospheric Cloud
RASL Raman Airborne Spectroscopic Lidar
SAFARI-2000 Southern African Regional Science Initiative 2000
SAGE III Stratospheric Aerosol and Gas Experiment III
106 Atmospheres 2017 Instrument Systems Report

SLED Storage Latency Estimation Descriptor
SMART Surface-sensing Measurements for Atmospheric Radiative Transfer
SODISM SOlar Diameter Imager and Surface Mapper
SOLVE SAGE III Ozone Loss and Validation Experiment
STROZ LITE Stratospheric Ozone Lidar Trailer Experiment
SWIR Short-Wave InfraRed
TC4 Tropical Composition, Cloud, and Climate Coupling
TCSP Tropical Cloud Systems and Processes
TEFLUN Texas and Florida Underflight Experiment
THOR Thickness from Offbeam Returns
TIMS Technical Information and Management Services
TRL Technical Readiness Level
TRMM Tropical Rainfall Measuring Mission
TWiLiTE Tropospheric Wind Lidar Technology Experiment
TWT Traveling Wave Tube
UAS Unmanned Aerial System
UAV Unmanned Aerial Vehicle
UV Ultraviolet
UV/VIS Ultraviolet and Visible
UV-MFRSR UV Multifilter Rotating Shadowband Radiometer
VIS Visible Light
VNIR Visible and Near InfraRed
Atmospheres 2017 Instrument Systems Report 107