guidance on thresholds and … water...wfd surface water point source discharges risk assessment...
TRANSCRIPT

WFD Surface Water Point Source Discharges Risk
Assessment Methodology
GUIDANCE ON THRESHOLDS AND METHODOLOGY TO BE APPLIED IN IRELAND’S RIVER BASIN DISTRICTS
Paper by the Working Group on Characterisation and Risk
Assessment
Surface water guidance document
This is a guidance paper on the application of a proposed Surface Water Point Source Discharges Risk Assessment methodology. It documents the principles to be adopted by River Basin Districts and authorities responsible for implementing the Water Framework Directive in Ireland. This is a working draft describing a method that will evolve as it is trialled, and will be amended accordingly.
REVISION CONTROL TABLE Status Approved by National Technical
Coordination Group WFD
Requirement Relevant EU Reporting sheets Date
Final 12th November 2004
Impacts and Pressures
SWPI 3 Significant point source pollution on surface waters
November 2004

TABLE OF CONTENTS
1 INTRODUCTION............................................................................................................... 1
1.1 Background ................................................................................................................... 1
1.2 Point Source Discharges ................................................................................................ 1
1.3 Risk categories .............................................................................................................. 1
2 WASTE WATER TREATMENT PLANTS......................................................................... 2
2.1 General.......................................................................................................................... 2
2.2 Data Requirements ........................................................................................................ 2
2.3 Discharge Standards ...................................................................................................... 3
2.4 Sampling ....................................................................................................................... 4
2.5 WWTP Risk Assessment ............................................................................................... 5
3 COMBINED STORM OVERFLOWS ................................................................................. 6
3.1 General ......................................................................................................................... 6
3.2 Data Requirements ........................................................................................................ 6
3.3 CSO Risk Assessment ................................................................................................... 6
4 INDUSTRIAL DISCHARGES............................................................................................ 7
4.1 Integrated Pollution Control Licences ............................................................................ 7
4.2 Section 4 Discharge Licences ........................................................................................ 7
5 WATER TREATMENT PLANTS....................................................................................... 8
5.1 General.......................................................................................................................... 8
6 OTHER POINT SOURCE DISCHARGES.......................................................................... 9
6.1 General ......................................................................................................................... 9
7 COASTAL AND TRANSITIONAL WATERS ................................................................... 9
7.1 General.......................................................................................................................... 9
Appendix A - Schedules extracted from S.I. No. 254 of 2001, Urban Waste Water
Treatment Regulations, 2001.

1
1 INTRODUCTION
1.1 Background
Article 5 of the Water Framework Directive requires, inter alia, a review of the
impact of human activity on the status of surface waters and groundwater. The
review must be undertaken in accordance with Annex II 1.4 – 2.5, and requires an
assessment of the likelihood that water bodies in river basin districts will fail to
meet the Directive’s environmental objectives.
The results of the analyses will be used in:
• Targeting the monitoring programmes required under Article 8
• Setting objectives required under Article 4
• Designing targeted and proportionate measures in accordance with Article 11
Guidance has been produced on how this may be achieved by the EU through the
Common Implementation Strategy (CIS) IMPRESS guidance and in the UK
through the UK technical advisory Group (UKTAG).
1.2 Point Source Discharges
The following methodology to assess the risk from point source discharges to
surface waters has been developed following a review of the CIS Guidance
documents, the UK TAG guidance document 7d(01) ‘draft guidance on point
source discharges (v2 6/6/03)’, and Northern Ireland’s Environment and Heritage
Service’s (EHS) ‘draft risk assessment for pressures from point source pollution’.
A significant data collection exercise was undertaken to test the application of the
methodology. In common with the EHS document, the methodology uses the
approach suggested in the UKTAG guidance document 7d, within the limits of the
available data.
1.3 Risk categories
The Risk Assessment Working Group in Ireland has agreed to the adoption of a
four-category risk classification scheme:
1a at risk
1b probably at risk
2a probably not at risk
2b not at risk

2
2 WASTE WATER TREATMENT PLANTS
2.1 General
The risk assessment for Waste Water Treatment Plants (WWTPs) is undertaken by
assessing compliance with discharge standards and compliance with monitoring
requirements, as stipulated in Urban Waste Water Treatment Regulations 2001 (SI
254 of 2001).
Compliance with discharge standards and monitoring requirements can be
determined from the latest monitoring results or recent Local Authority (LA)
returns to the Environmental Protection Agency (EPA) and can be checked against
the EPA publication ‘Urban Waste Water Discharges in Ireland (2000-2001)’. It is
noted that the above publication only details WWTPs with secondary treatment;
WWTPs with preliminary and/or primary treatment will be assessed using the LA
returns. The EPA reporting threshold of 500 PE is adopted for the point source
risk assessment. Data received on WWTPs below this threshold will be retained for
future use.
2.2 Data Requirements
• WWTP Name
• Population Equivalent
• Discharge Location (Eastings, Northings)
• Plant Code (Currently identical set for each county – use ‘number plate’
prefix)
• Monitoring Frequency
• Sampling Type
• Influent and Effluent measurements:
o Date of sample
o BOD
o COD
o TSS
o Total Phosphorus
o Total Nitrogen

3
2.3 Discharge Standards
The required discharge standards are stipulated in the second schedule of the Urban
Waste Water Treatment Regulations 2001 (UWWTR 2001). The second schedule
is reproduced in Appendix A and summarised in the tables below. In line with
DEHLG guidelines and the EPA publication ‘Urban Waste Water Treatment
Regulations - A handbook on implementation for sanitary authorities’, the risk
assessment adopts the concentration limits rather the percentage reduction
approach for the relevant parameters. The regulations also state that ‘the
parameters…..must not deviate from the parametric values by more than 100% but,
for the parametric value in concentration relating to total suspended solids,
deviations of up to 150% may be accepted’; i.e. whilst certain instances of slight non
conformity are allowable (detailed in the following section) there is an absolute
threshold of allowable concentration, as summarised in Table 1 below.
Table 1 Discharge Standards
Parameter
Concentration mg/l
‘Absolute fail’ if concentration
>mg/l
BOD 25 >50
COD 125 >250
TSS 35 >87.5
For the purpose of the risk assessment, it is assumed that the sample fails if any of
the relevant parameters fail to conform or are not recorded.
The regulations also give the ‘requirements for discharges from urban waste water
treatment plants to sensitive areas. One or both parameters may be applied
depending on the local situation’. The application of one or both parameters is
determined by expert judgement. The third schedule of the Regulations,
reproduced in Appendix A, lists the sensitive areas.
4
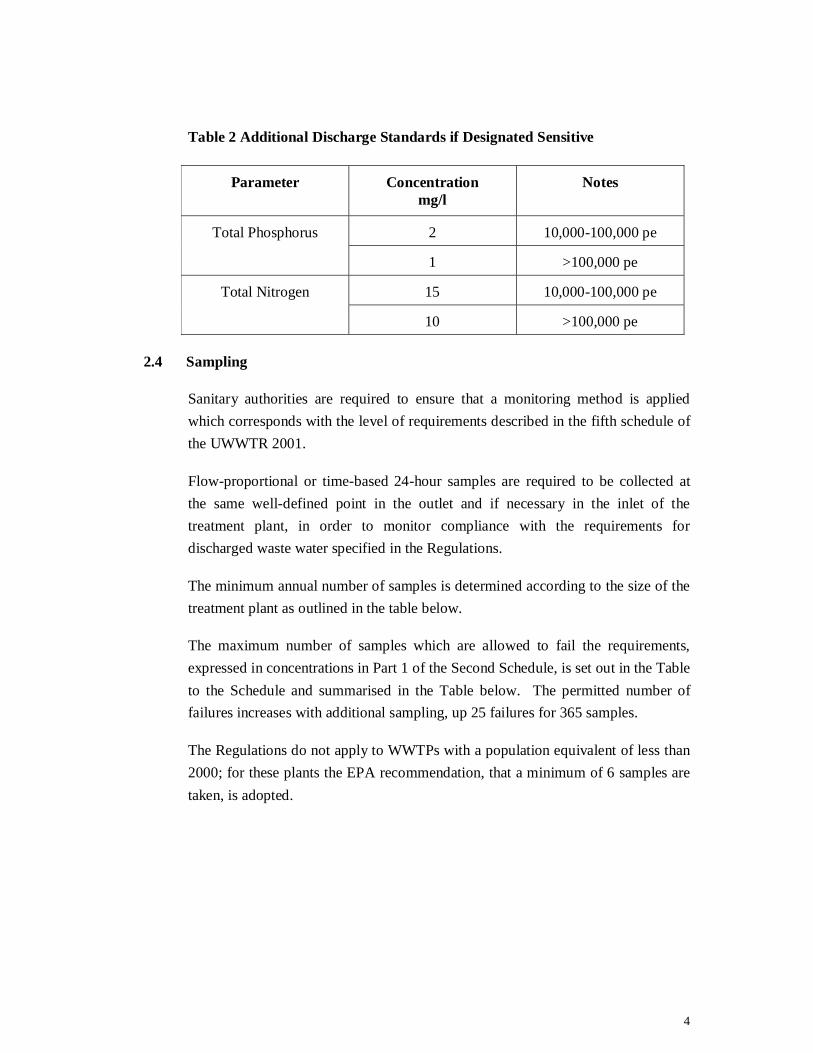
Table 2 Additional Discharge Standards if Designated Sensitive
Parameter
Concentration mg/l
Notes
2 10,000-100,000 pe Total Phosphorus
1 >100,000 pe
15 10,000-100,000 pe Total Nitrogen
10 >100,000 pe
2.4 Sampling
Sanitary authorities are required to ensure that a monitoring method is applied
which corresponds with the level of requirements described in the fifth schedule of
the UWWTR 2001.
Flow-proportional or time-based 24-hour samples are required to be collected at
the same well-defined point in the outlet and if necessary in the inlet of the
treatment plant, in order to monitor compliance with the requirements for
discharged waste water specified in the Regulations.
The minimum annual number of samples is determined according to the size of the
treatment plant as outlined in the table below.
The maximum number of samples which are allowed to fail the requirements,
expressed in concentrations in Part 1 of the Second Schedule, is set out in the Table
to the Schedule and summarised in the Table below. The permitted number of
failures increases with additional sampling, up 25 failures for 365 samples.
The Regulations do not apply to WWTPs with a population equivalent of less than
2000; for these plants the EPA recommendation, that a minimum of 6 samples are
taken, is adopted.

5
Table 3 Sampling
Pe Samples per year Permitted No. of samples which fail to conform
Notes / Comments
500 - 2,000 6 1 EPA recommended
figure
2,000 – 9,999 4 1 12 in first year and any year following
a failed sample
9,999 – 49,999 12 2
>50,000 24 3
2.5 WWTP Risk Assessment
The initial risk assessment is summarised in the table below.
Table 4 Initial Risk Assessment for WWTPs
Not at Risk At Risk
2b 2a 1b 1a
Complies with discharge
standards and is monitoring compliant
Complies with discharge
standards and is monitoring non
compliant
Does not comply with discharge
standards and is monitoring non
compliant
Does not comply with discharge
standards and is monitoring compliant
A WWTP is considered compliant with the monitoring requirements if the
stipulated number of samples is taken using flow-proportional or time-based 24-
hour samples. Grab sampling is not considered sufficient to comply with the
UWWTR. However, for WWTPs under 2000PE, grab sampling may be
appropriate; for the purpose of the risk assessment, expert judgement should be
applied.
A WWTP is considered compliant with the discharge standards if number of
samples failing (the concentration limits set out in Tables 1&2) is less than the

6
maximum permitted number of samples which fail to conform (Table 3) and the
degree of failure is less than the allowable deviation set out in Table 1.
The initial risk assessment is then considered in the context of the receiving water
allowing expert judgement to be applied. For discharge to rivers and lakes, it is
envisaged that the risk category will generally remain unchanged (see section 7).
The risk assessment for WWTP discharges to surface waters within 500m of a
lake, transitional water or coastal water is carried out on the lake, transitional water
or coastal water.
3 COMBINED STORM OVERFLOWS
3.1 General
For the purpose of the risk assessment any intermittent discharge from a foul sewer
network is considered as a combined storm overflow CSO; this includes discharges
to surface waters resulting from foul flooding as well as from designed CSOs.
3.2 Data Requirements
• CSO location (Eastings & Northings)
• Frequency of operation above or below 6 spills per annum
The location of CSOs for networks serving a pe of 2000 or greater is available
from the National Urban Wastewater Study (NUWWS); this threshold of 2000 pe
is adopted for the risk assessment.
3.3 CSO Risk Assessment
The CSO risk assessment is determined using a conservative design standard for
combined storm overflows of 6 spills per annum; a CSO with discharges in excess
of this number is considered to be at risk. It is recognised that the optimum
number of spills should only be determined through a detailed design process and
that 6 spills per annum is a level normally associated with bathing waters or
sensitive waters. In this context, the threshold value id used only for the purpose of
risk assessment, which will in turn be used to target a monitoring programme.
Where the number is of spills is unknown the precautionary principle is applied
and the ‘1b’ category is given to the CSO, as detailed in the table below.

7
Table 5 CSO Risk Assessment
Not at Risk At Risk
2b 2a 1b 1a
No CSOs CSO operates <
6/year
CSO operation
frequency
unknown
CSO operates >
6/year
4 INDUSTRIAL DISCHARGES
4.1 Integrated Pollution Control Licences
The risk assessment for discharges to surface waters under Integrated Pollution
Control Licences (IPCL) is undertaken in a similar manner to WWTPs.
The Environmental Protection Agency has provided each river basin with national
data on the compliance of licensed activities. It is important to note that the data is
provided only for the purpose of risk assessment which will in turn be used to
target a monitoring programme. Where the data on compliance with discharge
standards and monitoring is incomplete, expert judgement should be applied
following consultation with the local EPA inspector. The risk assessment is
summarised in Table 6 below.
Table 6 IPC Risk Assessment
Not at Risk At Risk
2b 2a 1b 1a
Complies with
discharge
standards and is
monitoring
compliant
Complies with
discharge
standards and is
monitoring non
compliant
Does not Comply
with discharge
standards and is
monitoring non
compliant
Does not Comply
with discharge
standards and is
monitoring
compliant
4.2 Section 4 Discharge Licences
Discharges to surface waters under Section 4 of the Water Pollution Acts are
licensed by the Local Authorities. Section 9 of the Act requires the Local

8
Authority to keep a register of licences granted. The following data is required for
the risk assessment.
• Licence Reference/Activity Name/Description
• Discharge Location (Eastings, Northings)
• Discharge Consent Parameters
• Monitoring Frequency Requirements
• Compliance Data
Whilst developing and testing the methodology significant ‘gaps’ were experienced
in the Local Authority data. Furthermore, the data was not always readily
accessible for retrieval and analysis; although every effort was made to obtain data
in order to test the methodology, it is recognised that this will not be practical on a
national basis within the required timeframe. Consequently, the risk assessment
will rely on a greater level of expert judgement, following consultation with Local
Authority staff, than with the forgoing risk assessments.
The risk assessment is again undertaken in a similar manner to WWTPs as detailed
in the table below.
Table 7 Section 4 Risk Assessment
Not at Risk At Risk
2b 2a 1b 1a
Complies with
discharge
standards and is
monitoring
compliant
Complies with
discharge
standards and is
monitoring non
compliant
Does not Comply
with discharge
standards and is
monitoring non
compliant
Does not Comply
with discharge
standards and is
monitoring
compliant
5 WATER TREATMENT PLANTS
5.1 General
Discharges from Water Treatment Plants are not currently licensed or monitored.
The risk assessment for Water Treatment Plant discharges will be undertaken in
consultation with Local Authority staff using expert judgement. The location of
Water Treatment Plants and the population equivalent served can be obtained form

9
the National Drinking Water Monitoring Programme. As with the risk assessment
for WWTPs, a threshold of 500pe is adopted.
6 OTHER POINT SOURCE DISCHARGES
6.1 General
The risk assessment for point source discharges to surface waters from other
sources and activities identified in the IMPRESS guidelines (such as mining;
landfill contaminated land; agriculture point (slurry, silage and other feeds, sheep
dip use and disposal, manure depots, farm chemicals, agricultural fuel oils); waste
management and aquaculture) will be undertaken using expert judgement.
The data required for the above risk assessments was not found to be readily
available, although a number of the activities are covered by industrial discharge
licences. In this assessment, the following guidance from the UK TAG document
7d is useful, “A water is at risk at such point sources if there is a record of
occasional incidents of pollution from these sources (one per year on average) that
are sufficient to warrant serious attention in terms of established systems for the
classification of incidents.”
7 COASTAL AND TRANSITIONAL WATERS
7.1 General
For transitional and coastal waters, expert judgement is applied to take account of
the location and depth of discharge, prevailing currents and available dilution. In
this assessment, the guidance from option 2 of the UK TAG document 7d is useful,
as indicated in the table below.
Table 8 Point Source Discharge to Transitional Waters.
Not at Risk At Risk
2b 2a 1b 1a
- Total volume of
discharge <5% of tidal water volume
Total volume of discharge ≥5% of tidal water volume
-
The data required to conduct a risk analysis for coastal waters was generally not
available; given the size of coastal water bodies and the available dilution, the

10
default position was not to place the coastal water bodies at risk from point source
discharges. However, if the scale of point source discharge is of significant
magnitude to cause concern the “probably at risk category” was adopted.
Whilst the data for transitional waters was also generally not available, expert
judgement was applied to assign an appropriate risk category.
A further stage of analysis will be to apply a risk assessment to coastal embayment.
This will require the creation of additional coastal water bodies and as such; coastal
embayments have not been considered as a separate entity in this risk assessment.

Appendix A Page 1 of 8
APPENDIX A
Contents
Schedules extracted from S.I. No. 254 of 2001, Urban Waste Water Treatment Regulations,
2001,

Appendix A Page 2 of 8
Second Schedule
Part 1
The values for concentrations or for the percentage of reduction shall apply.
Parameters Concentration Minimum
percentage of
reduction (1)
Reference method
of measurement
Biochemical
oxygen demand
(BOD5 at 20o C)
without
nitrification (2)
25 mg/l O2 70-90 Homogenized, unfiltered,
undecanted sample.
Determination of
dissolved oxygen before
and after five-day
incubation at 20o C + 1o
C, in complete darkness.
Addition of a nitrification
inhibitor
Chemical oxygen
demand (COD)
125 mg/l O2 75 Homogenized, unfiltered,
undecanted sample
Potassium dichromate
Total suspended
solids
35 mg/l
90
- Filtering of a
representative sample
through a 0,45 um filter
membrane. Drying at
105oC and weighing
- Centrifuging of a
representative sample (for
at least five mins with
mean acceleration of
2,800 to 3,200 g), drying
at 105oC and weighing
(1) Reduction in relation to the load of the influent.
(2) The parameter can be replaced by another parameter: total organic carbon (TOC) or
total oxygen demand (TOD) if a relationship can be established between BOD5 and the
substitute parameter.

Appendix A Page 3 of 8
Part 2
Requirements for discharges from urban waste water treatment plants to sensitive areas. One or both parameters may be applied depending on the local situation. The values for concentration or for the percentage of reduction shall apply.
Parameters Concentration Minimum
percentage of
reduction(1)
Reference
method of
measurement
Total
phosphorus
2 mg/l
(10,000 - 100,000 p.e.)
1 mg/l
(more than 100,000 p.e.)
80 Molecular
absorption
spectrophotometr
y
Total nitrogen
(2)
15 mg/l
(10,000 - 100,000 p.e.)(3)
10 mg/l
(more than 100,000 p.e.)
(3)
70 - 80 Molecular
absorption
spectrophotometr
y
(1) Reduction in relation to the load of the influent.
(2) Total nitrogen means the sum of total Kjeldahl nitrogen (organic and
ammoniacal nitrogen), nitrate – nitrogen and nitrite - nitrogen.
(3) These values for concentration are annual means as referred to in paragraph 4
(c) of the Fifth Schedule. However, the requirements for nitrogen may be
checked using daily averages when it is proved, in accordance with paragraph 1
of that Schedule, that the same level of protection is obtained. In this case, the
daily average must not exceed 20 mg/l of total nitrogen for all the samples when
the temperature from the effluent in the biological reactor is superior or equal to
120C. The conditions concerning temperature could be replaced by a limitation
on the time of operation to take account of regional climatic conditions.
Appendix A Page 4 of 8
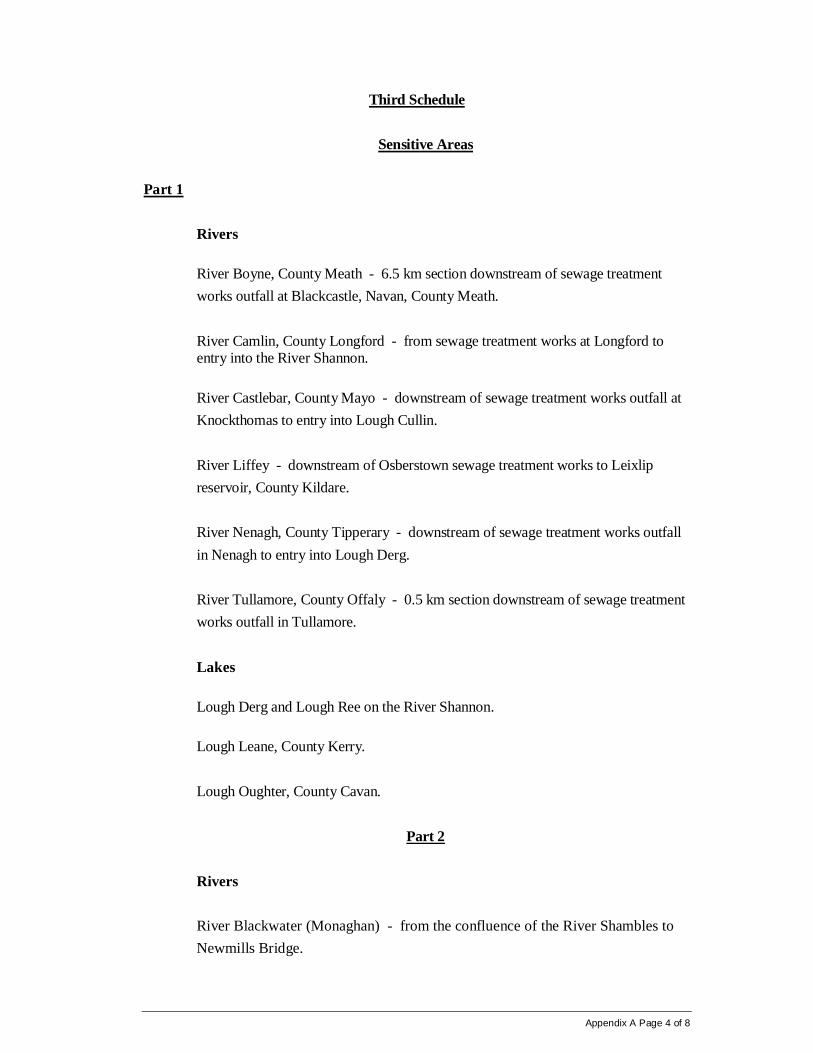
Third Schedule
Sensitive Areas
Part 1
Rivers
River Boyne, County Meath - 6.5 km section downstream of sewage treatment
works outfall at Blackcastle, Navan, County Meath.
River Camlin, County Longford - from sewage treatment works at Longford to entry into the River Shannon.
River Castlebar, County Mayo - downstream of sewage treatment works outfall at
Knockthomas to entry into Lough Cullin.
River Liffey - downstream of Osberstown sewage treatment works to Leixlip
reservoir, County Kildare.
River Nenagh, County Tipperary - downstream of sewage treatment works outfall
in Nenagh to entry into Lough Derg.
River Tullamore, County Offaly - 0.5 km section downstream of sewage treatment
works outfall in Tullamore.
Lakes
Lough Derg and Lough Ree on the River Shannon.
Lough Leane, County Kerry.
Lough Oughter, County Cavan.
Part 2
Rivers
River Blackwater (Monaghan) - from the confluence of the River Shambles to
Newmills Bridge.

Appendix A Page 5 of 8
River Brosna - downstream of Mullingar sewage outfall [opposite intersection of
regional road (R400) with N52 south of Mullingar], to Lough Ennell.
River Cavan - from the bridge at Lisdarn downstream of Cavan Town to the
Annalee River confluence.
River Proules - downstream of Carrickmacross sewage outfall, to confluence
with the River Glyde.
River Barrow - downstream of Portarlington sewage outfall, to
Graiguenamanagh Bridge.
River Triogue - downstream of Portlaoise sewage outfall, to confluence with the
River Barrow.
River Nore - downstream of Kilkenny sewage outfall, to Inistioge Bridge.
River Hind - downstream of Roscommon Town sewage outfall, to Lough Ree.
River Suir - downstream of Thurles sewage outfall, to Twoford Bridge.
River Suir - downstream of Clonmel sewage outfall, to Coolnamuck Weir.
Little Brosna River - downstream of Roscrea sewage outfall below its
confluence with the Bunow River, to the bridge near Brosna House.
River Blackwater (Munster) - downstream of Mallow railway bridge, to
Ballyduff Bridge.
Lakes
Lough Ennell, County Westmeath.
Lough Muckno, County Monaghan.
Lough Monalty, County Monaghan.
Estuaries

Appendix A Page 6 of 8
Broadmeadow Estuary (Inner) - from the bridge west of Lissenhall
(Broadmeadow River) to the railway viaduct.
Liffey Estuary - from Islandbridge weir to Poolbeg Lighthouse, including the
River Tolka basin and South Bull Lagoon.
Slaney Estuary (Upper) - from Enniscorthy railway bridge to Macmine.
Slaney Estuary (Lower) - from Macmine to Drinagh / Big Island.
Barrow Estuary - from the weir at Bahana Wood to New Ross Bridge.
Suir Estuary (Upper) - from Coolnamuck Weir to Mount Congreve.
Bandon Estuary Upper - from Inishannon Bridge to Kinsale Western Bridge.
Bandon Estuary Lower - downstream of Kinsale Western Bridge, to Money
Point.
Lee Estuary Upper (Tralee) - from Ballymullin Bridge to seaward end of Tralee
Ship Canal / Annagh Island.
Feale Estuary Upper - downstream of Finuge Bridge, to Poulnahaha old Railway
Bridge.
Cashen / Feale Estuary - downstream of Poulnahaha old Railway Bridge, to
Moneycashen.
Killybegs Harbour - Killybegs Harbour inside Kane’s Rock / Carntullagh Head.
Castletown Estuary - from the weir 130 m downstream St. Johns Bridge
(Castletown River) to Pile Light.
Blackwater Estuary Upper - from Bullsod Island (1 km downstream Lismore
Bridge) to Dromana Ferry.
Blackwater Estuary Lower - downstream of Dromana Ferry, to near East Point,
Youghal Harbour.

Appendix A Page 7 of 8
Fifth Schedule
Reference methods for monitoring and evaluation of results
1. Sanitary authorities shall ensure that a monitoring method is applied which
corresponds at least with the level of requirements described below. Alternative
methods to those mentioned in paragraphs 2, 3 and 4 may be used provided that
it can be demonstrated that equivalent results are obtained.
2. Flow-proportional or time-based 24-hour samples shall be collected at the
same well-defined point in the outlet and if necessary in the inlet of the
treatment plant, in order to monitor compliance with the requirements for
discharged waste water specified in these Regulations. Good international
laboratory practices aiming at minimising the degradation of samples
between collection and analysis shall be applied.
3. The minimum annual number of samples shall be determined according to the
size of the treatment plant and be collected at regular intervals during the year:
2,000 to 9,999 p.e.: 12 samples during the first year: four samples in
subsequent years, if it can be shown that the
water during the first year complies with the
provisions of these Regulations; if one sample
of the four fails, 12 samples must be taken in
the year that follows.
10,000 to 49,999 p.e.: 12 samples
50,000 p.e. or over : 24 samples.
4. The treated waste water shall be assumed to conform to the relevant
parameters if, for each relevant parameter considered individually, samples of
the water show that it complies with the relevant parametric value in the
following way:
(a) for the parameters specified in Part 1 of the Second Schedule, a
maximum number of samples which are allowed to fail the
requirements, expressed in concentrations and/or percentage
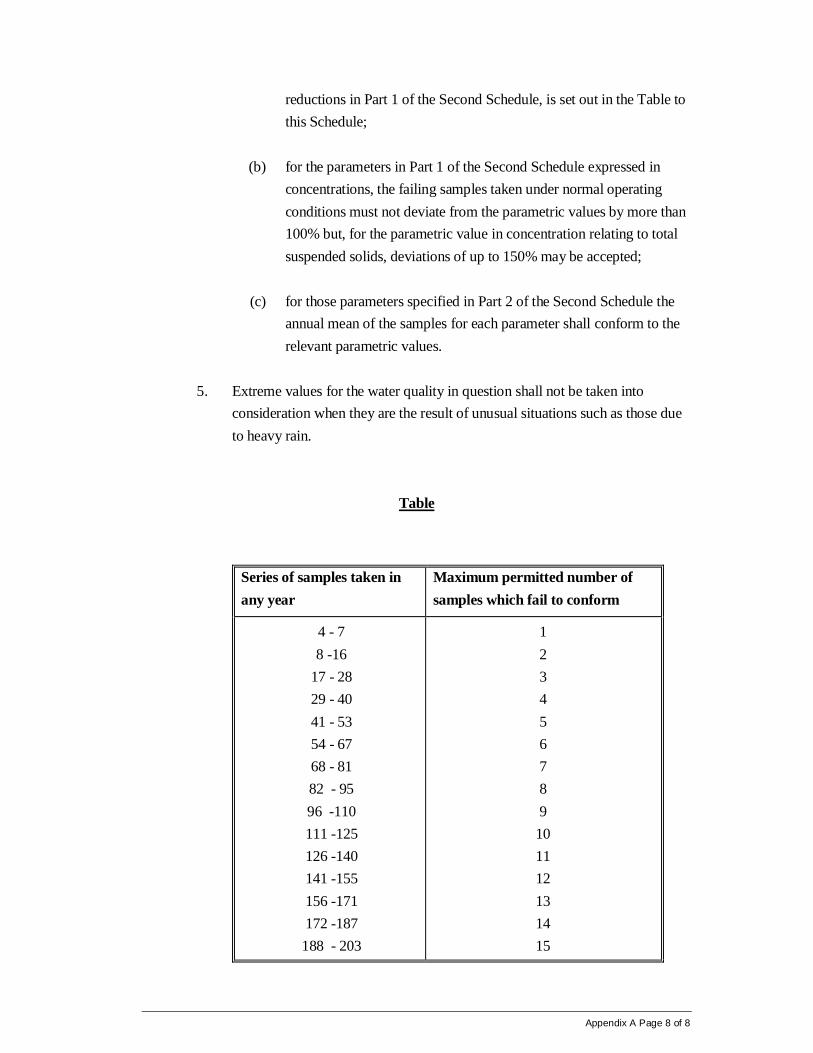
Appendix A Page 8 of 8
reductions in Part 1 of the Second Schedule, is set out in the Table to
this Schedule;
(b) for the parameters in Part 1 of the Second Schedule expressed in
concentrations, the failing samples taken under normal operating
conditions must not deviate from the parametric values by more than
100% but, for the parametric value in concentration relating to total
suspended solids, deviations of up to 150% may be accepted;
(c) for those parameters specified in Part 2 of the Second Schedule the
annual mean of the samples for each parameter shall conform to the
relevant parametric values.
5. Extreme values for the water quality in question shall not be taken into
consideration when they are the result of unusual situations such as those due
to heavy rain.
Table
Series of samples taken in
any year
Maximum permitted number of
samples which fail to conform
4 - 7
8 -16
17 - 28
29 - 40
41 - 53
54 - 67
68 - 81
82 - 95
96 -110
111 -125
126 -140
141 -155
156 -171
172 -187
188 - 203
1
2
3
4
5
6
7
8
9
10
11
12
13
14
15

Appendix A Page 9 of 8
Series of samples taken in
any year
Maximum permitted number of
samples which fail to conform
204 - 219
220 - 235
236 - 251
252 - 268
269 - 284
285 - 300
301 - 317
318 - 334
335 - 350
351 - 365
16
17
18
19
20
21
22
23
24
25