guide: graphical user interface for database exploration
TRANSCRIPT
GUIDE: Graphical User Interface for Database Exploration
Harry K.T. Wong and Ivy Kuo
Lawrence Berkeley Lab. University of California, Berkeley
Abstract This paper describes a system which uses graph-
ics devices as tools to interface to complex data- bases. The difficulties associated with using query languages for large, complex databases such as some of the statistical databases (e.g., Census data, energy data) are examined, We will describe a system con- taining features such as subject directories, help messages, zooming facilities to the relevant part of the database schema, and partial query formulation with intermediate results.
The system offers a graphics interface to the user. The database schema is displayed as a network of entity and relationship types. Queries can be expressed as traversal paths on this network. Partial queries (called “local queries”) can be formulated and represented graphically and database retrieval results of any local query are available at any time. Local queries can be linked together to form larger queries and provide the basis for building queries in a piecemeal fashion. Parts of the schema can be selec- tively made visible or invisible and provide the basis of representing multiple levels of details of the schema.
1. Introduction and Motivation
The main motivation of our work comes from experiences in using database query languages. Even people with a computer science background (our- selves included) often have difficulty using the so- called “high level user friendly languages”. Non- expert users may not have the patience, ability, or desire to learn and use these languages correctly. By non-expert users (as opposed to casual users), we mean non-computer science professionals such as social analysts, statisticians or accountants who have to deal with data regularly. The problem becomes much worse in an environment with very large data- bases that have very large and complex database definitions (schemas). Large statistical databases such as the Census database and energy database are examples of such an environment.
We believe that the following factors are the major reasons for the difficulty in using and under- standing query languages.
This work is supported by the Applied Mathematical Sci- ences Research Program of the OfTice of hergy Research Depart- ment of Energy under Contract DEACOS76SFQOOS8.
Proceedings of the Eighth International Conference on Very Large Data Bases
22
1. The user has to remember too many things. - The names of the record types and attributes have to be remembered before the user can express a query. Lower level details such as the format and units of the attributes (e.g. $10,000, $lOK, 10 or lO,OOO?) are only found by exploring the data, or looking the attri- bute definitions up in a dictionary (sometimes as parts of manuals). On the semantics side, the user has to determine the “meaning” of acronyms used to represent elements ( record types and their attri- butes). All these problems are magnified when the database has a very complex schema (hundreds of record types, thousands of attributes).
2. Semantically poor data models. -- Most high level query languages are based on mathematical concepts such as Predicate Calculus or Algebra or set theory. This sometimes leads to languages with a solid foun- dation; often, however, users don’t relate to mathematical concepts such as range variables, join clauses, projections or complex aggregate functions. Often the problem comes from inadequate semantics in the underlying data model. An example is the join clause in the relational data model. Join clauses are typically used for establishing relationships that exist implicitly between relations. The burden is put on the user to augment the semantics of the implicit relationships between relations and make them expli- cit. It is the responsibility of the user to restate these relationships every time the relations are referred to. We believe a more explicit model should be used to support the non-expert user interface to complex data.
3. No feedback during the query process. -- The chances of formulating a complex query correctly on the first try (or even the first few trials) ‘are slim. When using current languages, there is the fear and doubt as to whether the query is complete or whether some conditions are missing. Users could benefit from a facility that allows them to build a query in a piecemeal fashion with feedback of partial results available to them at any time. Also, users of large statistical databases (statistical analysts) often do not have a set of fixed queries in mind. Rather their interaction with the databases is exploratory in nature and highly dependent on the intermediate results. Again a facility with feedback of partial results should be helpful in this kind of environment. To simulate this facility with current query systems requires stating separate queries. Query systems should be designed to encourage the experimental, exploratory nature of formulating queries in a piece- meal fashion,
Mexico City, September, 1982
Prc oceedings of the Eighth International Conference on Very Large Data Bases
4. Lack of levels of detail in schemas. -- Users can be overwhelmed by a complex schema with thousands of elements in it. Most query systems have only two lev- els of detail at the schema levels: record (relation, set) level and attribute level. Even when the second level is suppressed, the user still has to locate the relevant record types. This is not easy if the schema has hundreds of record types in it. At the attribute level, there are applications where record types with up to several hundred attributes exist, each with its own code conventions. This is especially true for com- plex databases such as the Census database. It is not an easy matter to understand and select the relevant attributes for the query among these hundreds of attributes. What is needed is a mechanism to present the schema with varying amounts cf detail controlled by the user.
5. Lack of meta-data browsing facility. -- Complex databases often have a large number of data sets that deal with many diverse subject matters. For exam- ple, the Energy Information Administration (EIA) of the Dept. of Energy currently are maintaining 230 data sets of all aspects of energy such as sources, production, shipment, and consumptions. It is not an easy matter to even know what and where data is being kept. What is needed is a mechanism that can guide and encourage the user to explore and browse the meta-data to obtain a general view of the data- base and select subject matters that are of interest.
The approach being taken to address some of these problems is discussed in Section 2 of this paper. Section 3 will present an overview of a system called GUIDE (Graphical User Interface for Database Exploration) being implemented. In Section 4, an example session of using the system is described. Section 5 compares this system with some other sys- tems with similar goals. Finally, Section 6 summar- izes the paper, discusses some shortcomings of the system, and presents future plans.
2. Approach The goal is to put together a set of facilities in an
integrated system to try to address some of the above mentioned problems.
First, there are facilities in the system to remove the memory burden from the user. The facil- ities provide menus, examples, illustrations, and help messages at any stage of query formulation.
Second, a version of the Entity-Relationship (E-R) model ([Chen76]) is used to represent relationships between entities explicitly. For experimental pur- poses, the graphics user facility interfaces to the query language STRAND ([JohnsonBO]) which is imple- mented on top of the database system INGRES ([Held et a1.751).
Third, a simple graphics user interface is used for the following reasons:
-- The E-R model schema can be displayed as a network of objects, each object representing an entity or relationship type. This gives the user an overall view of the schema at all times.
-- Queries can be expressed as a traversal along the network of entities, Colors can be used to indicate the paths of the queries, and hence, pictori- ally indicate the scope and meaning of the queries.
23
-- Parts of the schema can be selectively made visible or invisible and provides the basis to the implementation of multiple levels of detail to aid m the understanding and use of the schema. (More details are discussed later.)
Fourth, the user can build up the query in a piecemeal fashion and have intermediate results of partial queries available at all times.
Fifth, to handle the problem of meta-data and the large number of the entities and their attributes, two kinds of directories are provided. The first is called a “hierarchical subject directory” (similar to that in [Chan & ShoshaniBl]), which can be used to organize the entities into logical groups hierarchi- cally. The user is guided by the system through this directory to locate the relevant part of the schema for which queries can be expressed. This is also a useful facility to browse and explore the subject matters of the database. Figure 1 gives an example of the subject directory; more details will be presented in the Example Session section (Section 4). The second kind of directories are called “hierarchi- cal attribute directories”, and are used to organize attributes of entities (or relationships) into groups similar to the subject directory. Each entity or rela- tionship type has an attribute directory. An example of an attribute directory is presented in Figure 2. Both kinds of directories are implemented as menus.
Sixth, a facility is made available to “rank” objects according to their “relevancy” to a particular group of users. The entity and relationship types are ordered and classified into groups according to the users’ interests and the frequency of access in queries. Different groups of users may have different classifications, The first group of objects (with rank 1) is considered the most important objects or focal points of the schema. This is followed by the second group (with rank 2) of objects which together with objects from the first group gives the next, more detailed, level of the schema. Currently, up to 5 groups are allowed in the system. In the example presented in Section 4, the entity types PERSON, GEO-LOCATION, OCCUPATION and INDUSTRY were assigned with ranking 1, FAMILY, HOUSEHOLD are given ranking 2, and so on by a labor force analyst according to the experience in using the database. “Focus” can be specified in the schema so that the selected object will be placed in the center of the screen. Also, there are commands to move the pic- ture around the screen, to zoom-in and zoom-out on the selected part of the picture. The idea is to present the right level of detail and the right part of the schema.
3. Dverview of System There are four stages of query formulation in
GUIDE: schema definition, schema exploration, query expression, and output display.
Data definition stage. -- The Data Base Adminis- trator (DBA) provides information about the schema during the definition stage. In addition to information on entities, relationships, and their attributes, there are examples and explanations of these objects. The graphical layout of the schema is fed into the system in this stage. Facilities are provided to the DBA to do the following: __ specify a graphical layout of the schema;
Mexico City, September, 1
Prc on
-- build a hierarchical subject directory for the schema objects;
-- build a hierarchical attribute directory for each entity and relationship type
-- specify the “importance ranking” of entity and relationship in the schema. Every object is given a rank (currently from 1 to 5). Schema exploration stage. -- During this stage,
the user can use the hierarchical subject directory to reach the most relevant part of the schema. From there the schema can be graphically examined at several levels of abstraction and only objects above a specified importance ranking are made visible. The user can also graphically edit the schema so that irrelevant objects can be removed from the screen. With the relevant part of the schema selected and displayed at the desired level of detail the user is now ready to express queries.
Query expression stage. -- In the query stage, the user can build up a query in a piecemeal fashion. The database retrieval results of a partial query can be shown if so desires. Examples and explanations on any object on the screen can be requested. Graphi- cally, the user will be traversing a network of objects. The query is a path selected by the user and shown in different colors for each partial query. The user is also encouraged to experiment with different condi- tions on the schema objects by adding or subtracting conditions and the result of these experimentations are available at any time. Piecemeal formulation of a query is an important facility. It is achieved through the formulation of “local queries.” The user can con- centrate on several parts of the schema being shown on the screen and can formulate a “local query” on each part so that each local query is completely independent of another. The idea is to allow the user to have a focused vision of small parts of the schema so that local results can be obtained and understood without having to compose a complex query covering a large schema space at the same time. The user can then link local queries to form a complex one. This complex query can then be treated as a local query when the user expresses additional local queries. All the local queries can be linked to form yet another more complex query, etc. This process continues until the final query is formulated. The retrieval results of each local query are always available for display. The result of linking several local queries is also displayable at any time.
Output display stage. -- In the output display stage, results can be displayed m various forms such as graphs, bar charts etc. The CHART package ([Ben- son &Kitous’77]) has been interfaced to GUIDE for graphical displays.
4. An Ekample Session
The database used m this example is from the Current Population Survey (CPS) which is conducted by the Bureau of the Census for the Bureau of Labor Statistics. It contains comprehensive data on indivi- duals, families and households. Data such as employ- ment, occupation, age, race, sex, educational back- ground are available for each person in the household enumerated. Also, data such as income sources, health insurance, pension plan, foodstamps, etc. is provided.
An E-R database for a subset of CPS has been designed with the help of a statistician who uses the CPS frequently. Currently it contains 20 entity and
Bceedings of the Eighth International Conference Very Large Data Bases
relationship types, This session shows some example interactions between a user and GUIDE when a realis- tic query is being composed.
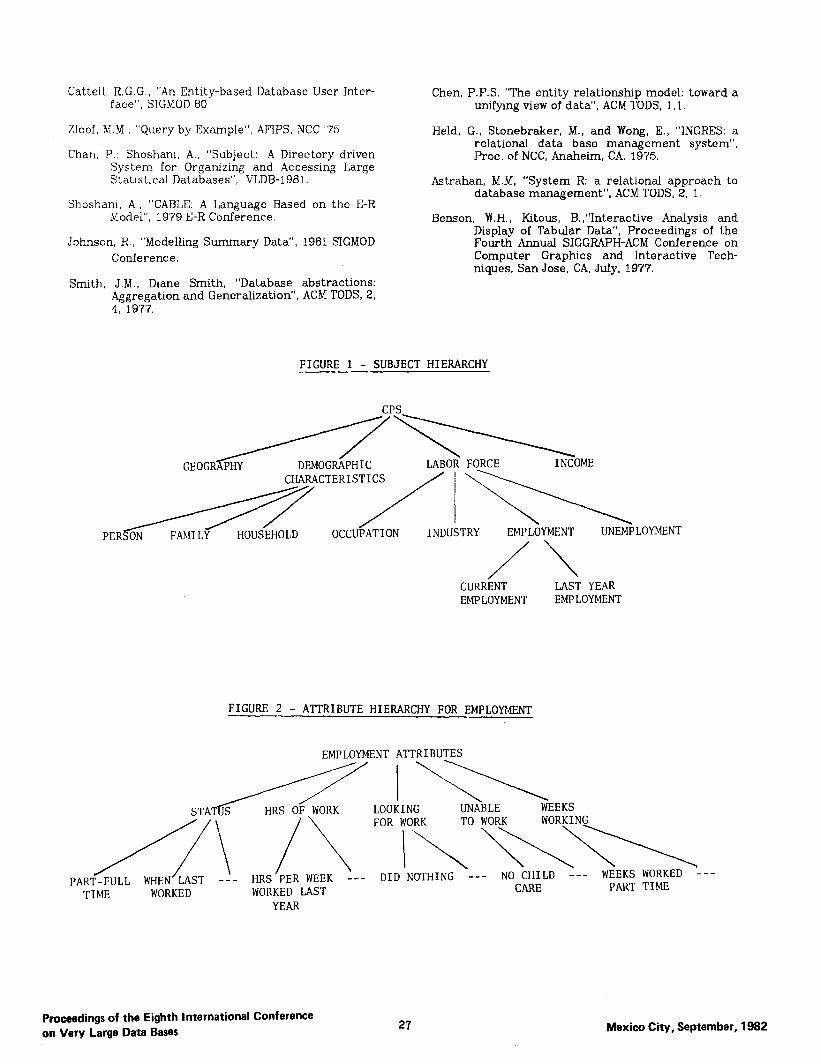
Photo 1 shows the configuration of the interac- tion. The terminal on the left is used as a keyboard and also as a query result presentation device. An additional terminal (Ramtek) equipped with a joystick is used as a interactive graphics device. The interac- tion with GUIDE is through the selection of commands from a menu located on the right side of the screen. The selection is done by manipulating the joystick to move the cursor to the desired item and entering a “hit” through the keyboard. The first command menu is shown in Photo 2. The second and third commands in the menu are the entry commands to the “explore schema” and “query expression” stages, and will be illustrated later. The first command “use subject directory” can be used to locate a particular object in a schema in a hierarchical, general-to-specific fashion. The top level of the CPS subject directory is shown on the left of Photo 2. A larger segment of the hierarchy is displayed in Figure 1. The non-leafs of the tree are subject categories and the leafs point to specific nodes in the schema. A hit of a non-leaf in the hierarchy will expand to the next level below the hit non-leaf. A hit of a leaf will bring the user to the “explore schema” stage with the node that is pointed to by the leaf of the herarchy in the center of the screen. Photo 3 shows the result of the user’s selec- tion of the path CPS - demographic characteristics - person. The commands on the right are the “explore schema” stage commands and they are briefly explained below: examine node -- ths command has a submenu (not
shown) whose commands can be used to display some sample instances of any user selected entity or relationship type, to describe its meaning and display the attri- butes using Its hierarchical attribute direc- tory (example m figure 2 and more on this later).
set schema detail level L -- the effect of this com- mand 1s that only nodes with ranking <= L will appear on the screen and only those links that connect these nodes will appear. In the CPS example, users rank the entity and relationship types according to the users interests and frequency of access to these objects.
focus -- the command allows the user to select a node in the schema as a “focus” and the selected node is moved to the center of the screen.
set radius R -- the effect 1s to use the current focus as a center point and include those nodes and links that are R links away. Only nodes with ranking <= L are shown, where L is the current detail level.
hide node or link -- this command allows the user to erase some nodes or links from the screen to unclutter the picture before stating the query.
zoom -- this command allows the user to scale the picture according to a selected scaling fac- tor to achieve the effect of zoom-in and zoom-out. A larger or smaller number of objects may appear on the screen, depend- ing on the zoom scale.
move schema -- this command can be used to move the physical layout of the schema on the screen by moving it in the direction of up. down, left or right.
Mexico City, September, 1982
By using a combination of these commands, the user can display the most relevant part of the schema, and can concentrate on the query expres- sion with only the relevant elements on the screen.
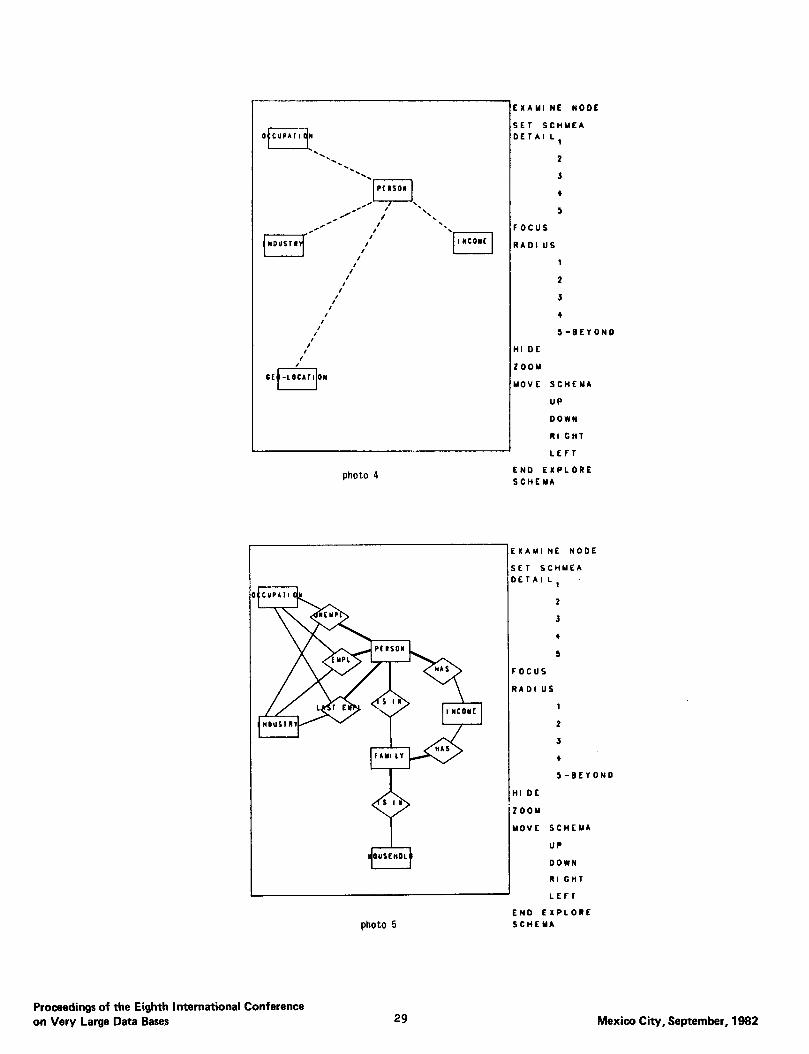
Photo 4 shows the schema with detail level set at 1, radius 5-beyond and entity type PERSON as the focus. This combination presents the focal points of the schema and they constitute the “core” of the database. Note that the selected focus will stay on the screen regardless of its detail level. A dash line indicates the existence of an indirect path between two objects through the connection of some inter- mediate objects (entities or relationships). A query can now be expressed and the system will augment it with the necessary objects to complete the query.
Photo 5 shows the schema with detail level set at 3 and radius 4. Entity types FAMILY, HOUSEHOLD and relationship types EMPLOYMENT, UNEMPLOYMENT and LAST-YEAR EMPLOYMENT are now displayed. Note that line width is used to represent cardinality of relationships. For example, the relationship IS IN between entities PERSON and FAMILY is a many-to-l mapping as indicated by the thick line between PER- SON and IS IN and a thin line between IS IN and FAM- ILY. FinaIly, Photo 6 shows the schema after a series of the commands above. The user is now ready to express the query.
The commands in query stage are displayed on Photo 7. The first command “examine node” is the same command as in the “explore schema” stage.
The command “include node in query” displays a submenu (listed below) after the user points to a node on the screen.
use attribute hierarchy display attribute value codes show attribute restriction samples enter attribute restriction select attributes for output
Briefly, this’ submenu deals with the details of the attribute level of entity or relationship types. It allows the user to examine the attributes in a hierarchical, general-to-specific fashion similar to the subject directory; to display the code convention of the attribute value (e.g., age-group 18 to 25 has code value 5); to display sample of attribute restriction conditions; to enter restriction on attribute as part of the query (examples to follow); and to select the out- put attributes for qualified entity or relationship instances. Figure 2 shows the attribute hierarchy for the relationship type EMPLOYMENT. The leafs are specific attributes and at this level attribute restric- tions can be entered. Note that the user can return from any submenu by hitting the END command. Note also that the code convention of attributes are exactly as contained in the CPS database. However, with the use of menus of English descriptions of code values, the user can express restrictions in a query without having to remember any code convention at all.
After using the command “include node in query” several times, the user can use one of the three commands shown below to obtain the result of the database retrieval.
show local result - the purpose of this command is Ic allow the user to compose “local queries” on several parts of the schema independently
from each other. All the “included” nodes along with their restrictions on attributes will constitute a local query when the com- mand is used. The database retrieval results of each local query can be displayed using the following submenu which is avail- able for all three “show result” commands.
display number of instances qualified
show result sample 5 10
;Fi more
show all instances on printer
These commands are used to control the amount of output from the database retrieval. The command “more” provides the capability of “stepping through’ the result, The next series of node inclusions will constitute a new independent local query. Multiple local queries can be com- posed in this way and they can be thought of as building blocks of larger queries. Each local query is painted a different color by GUIDE to communicate the effect and scope of the local query graphically to the user. The intermediate results of these local queries can provide the user with data that either conflrms or rejects the intuition or “feeling” of the restriction conditions pro- vided. The confirmation or rejection of the user’s intuition is possible because the schema space and the number of restric- tions are small in a local query.
show result so far - local queries can be linked together to form a larger query and its retrieval result can be displayed using this command. This larger query will be treated as another local query when a new local query is being composed. The combination of this command and the command “show local result” provide the capability to com- pose queries in a piecemeal fashion. In the case where there are multiple ways of link- ing local queries, the system will blink all possible paths and prompts for additional nodes to make a distinct path.
show final result - is the same as “show result so far” except the system expects a entirely new query to be composed after the result is displayed.
Photo 7 shows a local query expressed by the CPS user by first including the entities PERSON and DEPENDENTS and then hitting the “local result” com- mand. The restrictions that the person is female, divorced, with at least 3 children under 18 were also expressed using the “include node in query” command’s submenu. Notice that the shading of the nodes within a local query is different from the rest and the purpose is to inform and graphically remind the user of the scope and effect of the local query. Actually, colors are usedjinstead of shading in GUIDE.
Proceedings of the Eighth International Conference on Very Large Data Bases 25 Mexico City, September, 1982
Notice also that a linear query (expressed in the sim- ple syntax of STRAND ([ JohnsonBO])) is being built up at the bottom of the screen as the user includes nodes. This serves as a form of documentation for the restrictions entered by the user. The attribute names and their value codes in the restrictions are looked up by using the commands in the “include node m query” submenu also.
Photo 3 shows a second local query on INCOME, FAMILY and GEO-LOCATION with the restrictions that the family is poor (below poverty level) and located in the San Francisco area. Notice that the nodes in this local query are shaded in a different pattern. Also a new linear query is composed for this local query on the bottom of the screen.
Photo 9 shows the effect the command “show result so far”. The two local queries are linked together to form a larger query for: “Divorced moth- ers with at least 3 under 18 children in a poor family located in the San Francisco area.” The formal query is expressed again at the bottom of the screen.
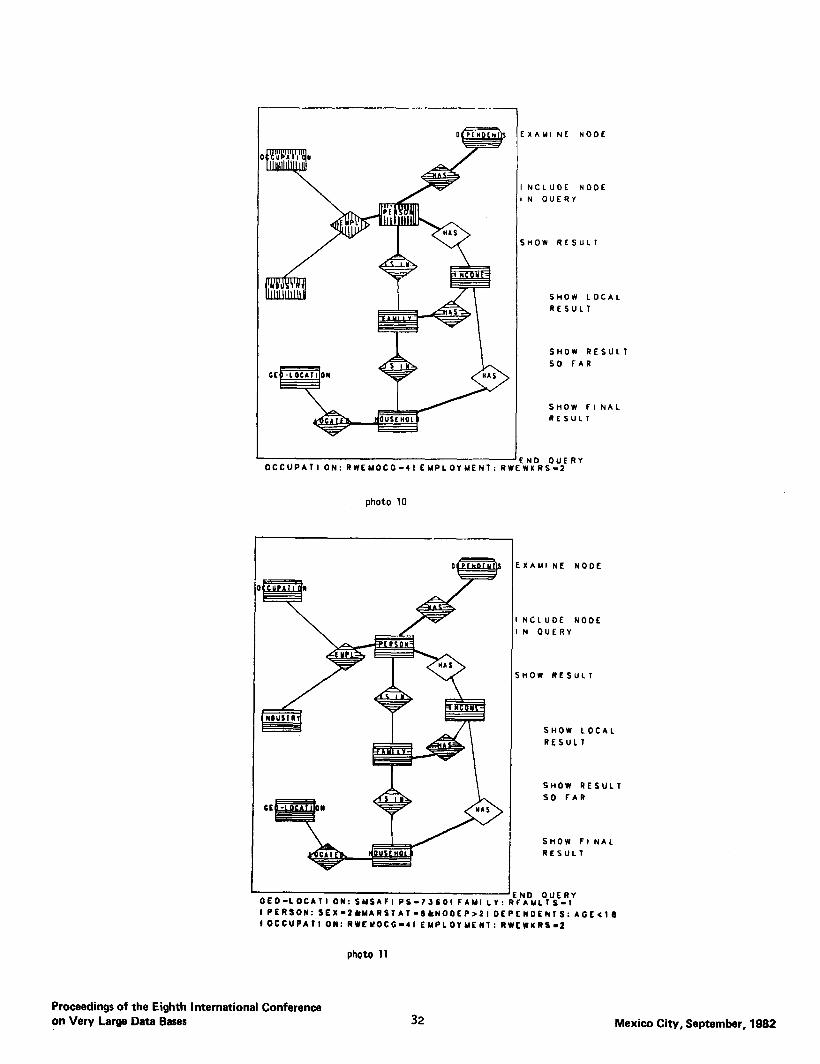
Photo 10 shows another local query involving OCCUPATION, INDUSTRY and EMPLOYMENT with the conditions that OCCUPATION be classified as “clerical or unskilled” and EMPLOYMENT as “part-time”. Photo 11 shows the effect of the “show fIna1 result” com- mand. The final query is put together as indicated by the shading of the included nodes. Also the whole for- mal query is displayed along with alI the conditions expressed for: “Part-time, clerical or unskilled, diOorced mother with at least 3 children under 18 in poor family located in the San Francisco area.”
5. Comparisons with Some Related Systems The following is a comparison of our system with
several graphics-based systems that have similar goals. These include the s atial data management system (SDMS) [HerotaO , the CUPID system f [McDonald741 , the E-R user interface [CattellSO], and Query by Example (QBE) [Zloof75]. In the interest of brevity, it is assumed that the user has some knowledge of these systems,
First, alI systems except the E-R user interface are based on the relational model, hence relation- ships must be specified by the user as discussed. SDMS concentrates on single relations, it is insufficient for our purposes.
Second, when using CUPID, the user must remember relation names, units and formats of attri- butes, etc.
Third, all systems except SDMS lack the power of presenting information in several levels of detail.
Fourth, the E-R user interface and SDMS emphasize interaction with the user at the instance level (i.e., specific instances of entities and attributes values). Expressing generic queries is not dealt with.
Fifth, all systems lack the facility of allowing the user to compose queries in a piece-by-piece fashion with intermediate feedback at any time.
Lastly, none of the systems encourage the user to traverse and explore meta-data of the database. Cattell’s system provides exploration at the instance level, but without the overall picture of the schema available, the user can lose sight of relative position.
Proceedings of the Eighth International Conference on Very Large Data Bases 26
6. Concluding Remarks
The entire system has been designed and coded in the programming language C and running on the VAX under VMS. This includes the data definition loader, the graphics editor, and the menu builder. The data definition loader is described in Section 3. The graphics editor is built on top of GWCORE, a George Washington University implementation of the SIGGRAPH GSPC ‘79 standard proposal. The menu builder consists of two parts, a menu loader for menu definition and a menu manipulator for invocation and expansion of menus.
At this time, we do not yet have any experience with users trying out the system. Initial users of the system will be limited to statisticians and research staff. Results of feedback from these users will be reported in a forthcoming paper along with a descrip- tion of an extended version of GUIDE.
Currently, GUIDE does not contain any aggregate functions. Work is being done to introduce a special entity type called “summary entity” (as introduced in [Johnson79]) into the schema. These entities will be treated as part of the data definition itself. This will allow the user to express aggregations in a clean and simple fashion. Implementation of facilities for on- line help messages and database update commands are being considered. Longer term plans include the exploration of a more powerful data model (such as an extended E-R model with aggregation and general- ization hierarchies) to better model the semantics of databases. More specific constructs useful in model- ling statistical databases will also be researched and incorporated into the system. Finally, the possibility of using CABLE (Shoshani791) as our underlying query language is being explored. This will provide the foundation for more complicated query expressions such as cyclic queries (a cyclic query is a query whose path on the schema network forms a cycle, typically involving range variables in queries such as “employees who make more than their managers”) and queries with dynamic link creation for temporary relationship establishment (users can establish dynamic paths among entities or relationships (joins)).
Acknowledgements We would like to acknowledge the valuable
insights of Arie Shoshani, who has contributed many ideas in our system. Thanks to Peter Kreps for his suggestion of the name for our system. The help of Carole Agazzi and Meri Jones is appreciated. The helpful comments from the referees are ack- nowledged. Special thanks to Virginia Sventek for her careful reading of the paper.
Reference
Herot, C.F. “Spatial Management of Data”, TODS 5,4, 1980
McDonald, N., Stonebraker, M., “CUPID - The Friendly Query Language I’, Memo, ERL-M487, ERL, Univ. of Calif., Berkeley, CA, October, 1974
Mexico City, September, 1982
Cattell, R.G.G., “An Entity-based Database User Inter- face”, SIGMOD 80
Zloof, M.M “Query by Example”, AFIPS, NCC ‘75
Chan, P.; Shoshani, A., “Subject: A Directory driven System for Organizing and Accessing Large Statistical Databases”, VLDB-1981.
Shoshani, A., “CABLE: A Language Based on the E-R Model", 1979 E-R Conference.
Johnson, R., “Modelling Summary Data”, 1981 SIGMOD Conference.
Chen, P.P.S. “The entity relationship model: toward a unifying view of data”, ACM TODS. 1,l.
Held, G., Stonebraker, M., and Wang, E., “INGRES: a relational data base management system”, Proc. of NCC, Anaheim, CA. 1975.
Astrahan, M.M, “System R: a relational approach to database management”, ACM TODS, 2, 1.
Benson, W.H., Kitous, B. ,“Interactive Analysis and Display of Tabular Data”, Proceedings of the Fourth Annual SIGGFtAPH-ACM Conference on Computer Graphics and Interactive Tech- niques, San Jose, CA, July, 1977.
Smith, J.M., Diane Smith, “Database abstractions: Aggregation and Generalization”, ACM TODS, 2, 4, 1977.
FIGURE 1 - SUBJECT HIERARCHY
GEOGRiiiib INCOME
PER\T::::i"STb EMPLOYMENT UNEMPLOYMENT
/\ CURRENT LAST YEAR EMPLOYMENT EMPLOYMENT
FIGURE 2 - ATTRIBUTE HIERARCHY FOR EMPLOYMENT
EMPI.OYMENT ATTRIBUTES
crnd / uDC nT: WflR!f I.C)OKTNI: JJNA\BLE WEEKS
J,I\,“i) ,,I\U “1 1IVI.1. ---..-..- _..~~ ~~
//\ /\ FOR~~\~\\
J nr”m ‘-,-L WHEN’LAST -!- \ - WEEKS WORKED --- rAKl-r"L.
TIME WORKED HRS'PER WEEK --- DID NOTHING --- NOCli;LD --. WORKED LAST PART TIME
YEAR
Proceedings of the Eighth international Conference on Very Large Data Bases 27 Mexico City, September, 1982
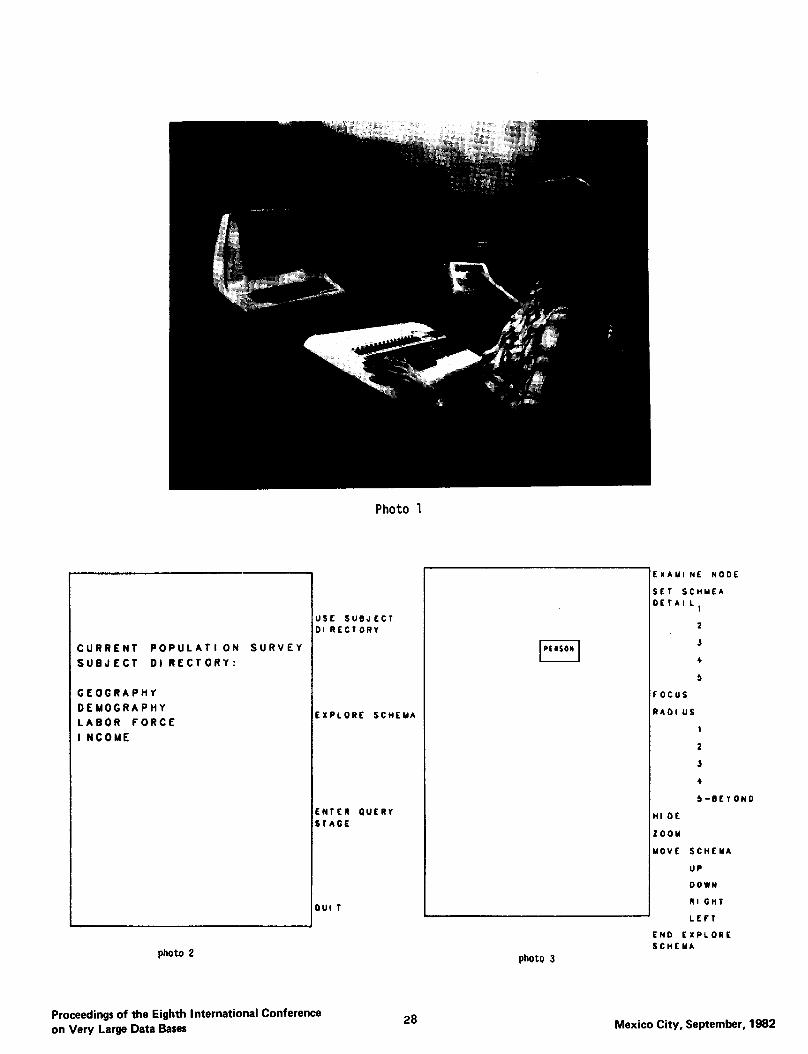
Photo 1
CURRENT POPULATI ON SURVEY SUBJECT 01 RECTORY:
GEOGRAPHY DEMOGRAPHY LABOR FORCE I NCOME
photo 2
Proceedings of the Eighth International Conference on Very Large Data Bases
USE sue.J cc1 DI RECTORY
EXPLORE SCHEMA
ENTER OUERY
SlAGC
28
I PtlSON
EXAUl NE NODE
SET SCHMEA
DETAl L,
2
3
4
5
FOCUS
RAOI us
1
2
J
4
5-BEYOND
lit DE
LOOY
MOVE SCIiEYA
UP
DOWN
RI Glil
LEFT
photo 3
END EXPLORE
SCHCYA
Mexico City, September, 1982
I’ If
,I oc
0 -LocArt ON
photo 4
l+UsEnOL)
Proceedings of the Eighth International Conference on Very Large Data Bases
EXAM1 NE NODE
SET SCHMEA
DETAI L,
2
3
4
5
FOCUS
RADI us
1
2
3
4
)-BEYOND
Ill DE
ZOOM
MOVE SCHEYA
UP
DOWN
RI cnr
LEfT
END EXPLORE
SCHEMA
IXAUI NE NODE
;Er SCHMEA
lETAl L (
2
3
4
5
:ocus
PADI US
1
2
3
4
)-BEYOND
HI or
zoou
UOVE SCHCYA
UP
DOWN
RI GMT
LEFT
photo 5
END EXPLORE
SCHEMA
29 Mexico City, September, 1982
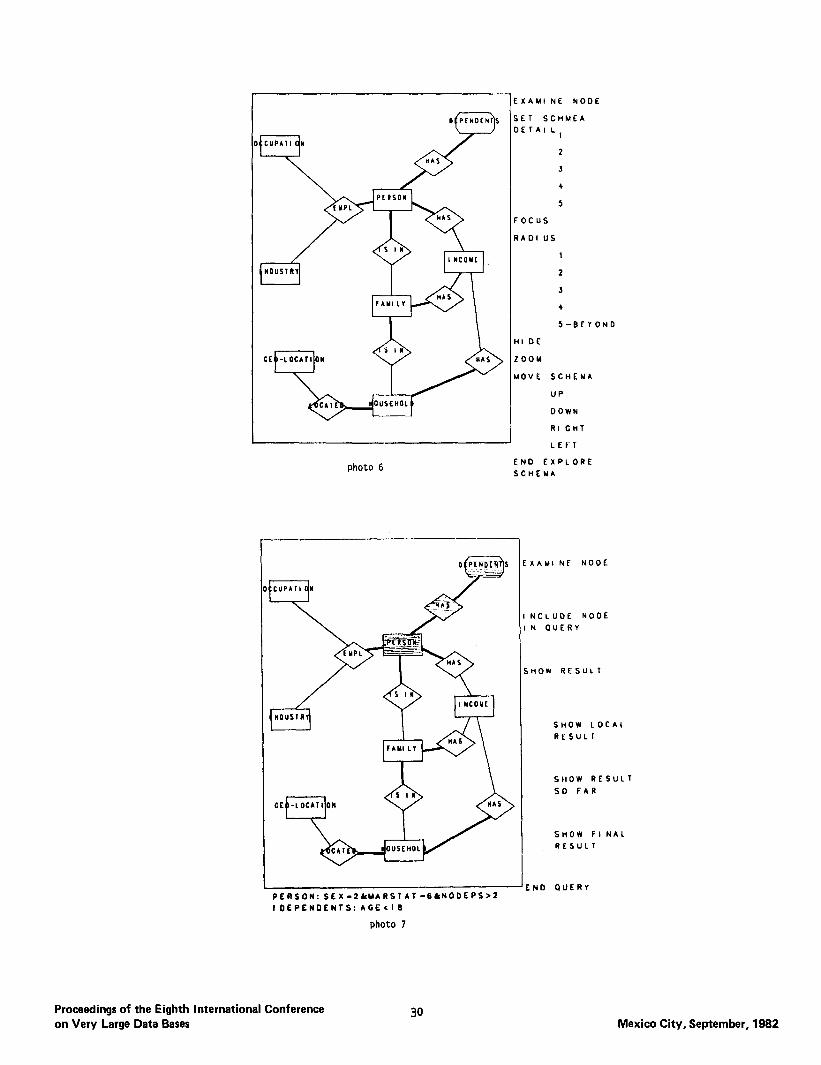
photo 6
XAHI NE NODE
ET SCHMEA
ErAI L,
2
3
4
5
ecus
ADI us
1
2
3
4
5-BEYOND
I DC
oou
OVE SCHENA
UP
DOWN
RI Clil
LEFT
I--- l
END EXPLORE
SCHEMA
EXAMI Nf NODE
I NCLUDE ‘NODE
IN OUERY
SHOW RESULI
SHOW LOCAL SHOW LOCAL
RESULT RESULT
SHOW RESULT SHOW RESULT
SO FAR SO FAR
I SHOW FI NAI
RESULT
TEND QUERY PERSON: SEX-ZLMARSTAT-SLNODEPS>Z
I DEPENDENTS: AGE<18
photo 7
Proceedings of the Eighth International Conference on Very Large Data Bases
30 Mexico City, September, 1982

I EXAM1 NE NODE
I NCLUDE NODE
IN OUERY
SHOW LOCAL
RESULT
SHOW RESULl
so FAR
SHOW FINAL
RESULT
IEND QUERY OEO-LOCATI ON: SUSAFI PS-73601 FAMI LY: RFAMLTS-I
photo a
I NCLUDE NODE
IN OUERY
snow RESUL 1
SHOW LOCAL
RESULT
SHOW RESULT
SO FAR
SHOW FINAL
RESULT
1 JENO QIJERY CEO-LOCAll ON: SMSAFI PS-73601 FAMI LY: RFAMLIS-1
1 PERSON: SEX.Z&MARSTAT -6&NDDEP*2
I DEPENDENTS: AGE<16
photo 9
Proceedings of the Eighth International Conference on Very Large Data Bases
31 Mexico City, September, 1982
OCCUPATI ON: RWEMOCO-II EMPLOYMENT: RY
photo 10
S
OEO-LOCATI OR: SMSAFI PS-73601 FAMI LY:
XAUI NE NOOE
NCLUOE NODE
N OUERY
,now RESULT
SHOW LOCAL
RESULT
SHOW RESULT
SO FAR
SHOW FINAL
RESULT
ND OUERY WKRS-2
XAYI NE NODE
NC1 UDE NODE
N OUERY
HOW RESULT
SHOW LOCAL
RESULT
SHOW RESULT
SO FAR
SliOW FINAL
RESULT
ND OUERY ‘AMLTS-1
I PERSON: SEX-2&YARSTAl-OLNOOEP>21 DEPENDENTS: AGE<18
I OCCUPAll ON: RWEYOCO-41 EMPLOYMENT: RWEWKRS-2
photo 11
Proceedings of the Eighth International Conference on Very Large Data Bases 32 Mexico City, September, 1982