guide to 2015 ohio school report cards
TRANSCRIPT

Guide to 2015
Ohio School Report Cards

Notes about this guide:
This guide to the online Ohio School Report Cards provides an overview and explanation of the key elements of Ohio’s 2015 report cards. Because of changes in state law and Ohio’s student testing system, some elements of the report card will be different from the 2014 report card.
Readers will see graphics marked as an “Example” that show how the 2014 Ohio School Report Cards displayed the data. While the type of graphics will not change for the 2015 Ohio School Report Cards, the state will update some elements of the display to reflect changes in the 2014-2015 school year.
There will be two additions to the 2015 Dropout Recovery Community Schools report cards. First, there will be a new, fourth component similar to the Progress component found on the district and school report cards. Second, the schools will receive ratings of Exceeds, Meets or Does Not Meet Expectations. The state was still designing those when this guide went to press.
The information in this guide is current as of Oct. 5, 2015.
reportcard.education.ohio.gov

03 Why are there Ohio School
Report Cards?
04 What do the Ohio School
Report Cards measure?
05 How do I use this information?
05 Achievement
05 Progress
06 Gap Closing
06 Graduation Rate
07 K-3 Literacy
07 Prepared for Success
08 Understanding Ohio School
Report Cards
08 Achievement
09 Progress
10 Gap Closing
11 Graduation Rate
12 K-3 Literacy
13 Prepared for Success
14 Other Report Card Information
14 Gifted Students
15 Financial Data
16 Career-Technical Planning
Districts
20 Dropout Prevention and
Recovery Schools
24 Safe Harbor
26 Rewards and Recognition
Table of Contents
GUIDE TO 2015 OHIO SCHOOL REPORT CARDS 3
Why are there Ohio School Report Cards?
Ohio School Report Cards give your community a clear
picture of the progress of your district and schools in raising
achievement and preparing students for the future. The
information measures district and school performance in the
areas most critical to success in learning. Ohio School Report
Cards data shows educators, school administrators and
families where their schools are succeeding as well as areas
where they need to improve.
As a school board member, you make choices that have an
impact on the future of your community. The goal of this guide
is to help you accurately interpret the information contained in
your district’s Ohio School Report Cards. As you let that data
inform your future decision making, you can know you are
acting in the best interests of your students.
Tom GunlockPresident State Board of Education
Dr. Lonny J. RiveraInterim Superintendent of Public Instruction

HOW DO I USE THIS INFORMATION? 54 GUIDE TO 2015 OHIO SCHOOL REPORT CARDS
What do the Ohio School Report Cards measure?
The 2015 Ohio School Report Cards include six major components – Achievement, Progress, Gap Closing, Graduation Rate, K-3 Literacy and Prepared for Success. There are one or more measures within each component. The state assigns an A-F letter grade to each. Districts and schools can receive up to 10 grades altogether.
The Prepared for Success component is unique in that it reports various ways your district and schools are keeping K-12 students on track to be ready for college or careers when they graduate. This component contains six measures that do not receive grades; they are provided only as information. Measures include college admission tests, College Credit Plus, industry credentials, honors diplomas, Advanced Placement and the International Baccalaureate program.
Recent laws have changed the timeline for schools and districts to receive an overall letter grade based on all the measures. But component grades are coming on the 2016 Ohio School Report Cards and an overall grade for each district and school is coming in 2018.

HOW DO I USE THIS INFORMATION? 5
How do I use this information?
Examine the grades for your district or school. Ask questions about what you see.
AchievementThis grade combines two results for students who took the state tests. The first result answers the question – How many students passed the state tests? The second result answers the question – How well did students do on the state tests?
What is being graded?
1. Indicators Met – How many students passed the state tests?
2. Performance Index – How well did the students do on the state tests?
Why is this important?
• It shows if students are meeting grade-level expectations.
• It shows how far above or below grade-level expectations students performed.
What is an A?
• You must exceed state standards.
• Your grade will improve as students score higher on tests.
Questions to ask
Some students will not achieve at the highest levels, even in a school with a good grade.
• Which students are performing well and which are not?
• In which subjects and grades are students doing well? Why?
• In which subjects and grades are students not doing well? Why?
• Which districts, similar to ours, are doing better than we are? What are they doing?
ProgressThis is your district’s or school’s average progress for its students in math and reading, grades 4-8. It looks at how much each student learns in a year. Did students get a year’s worth of growth? Did they get more? Did they get less?
What is being graded?
Progress of:1. All students.2. Gifted students.3. Lowest 20 percent of students in
achievement.4. Students with disabilities.
Why is this important?
• All students should make at least a year’s worth of progress in each subject or they will fall behind.
• Meeting a year’s worth of progress meets expectations of your parents and community.
• Your school’s grade will improve as students make more progress.
What is an A?
• The group of students makes more than a year’s growth.
What is a C?
• The group of students makes a year’s growth.
Questions to ask
• Which students are making progress and which are not?
• How can we change instruction for groups that are not making progress every year?
• Which districts, similar to ours, are doing better than we are? What are they doing?

HOW DO I USE THIS INFORMATION? 76 GUIDE TO 2015 OHIO SCHOOL REPORT CARDS
This grade shows how well all students are doing in your district or school in reading, math and graduation. It answers the question – Is every student succeeding, regardless of income, race, ethnicity or disability?
What is being graded?
Annual Measurable Objectives – How does the performance of student groups in my district or school compare to a state goal?
Why is this important?
Every student should succeed in learning. When groups of students are not succeeding, educators need to review why and make changes.
What is an A?
Every group of students must be proficient.
Questions to ask
• How are different groups of students performing?
• What information is available to determine which groups are doing well and which are not?
• How can we change instruction for groups that are not succeeding?
• Which districts, similar to ours, are doing better than we are? What are they doing?
Gap ClosingThis grade answers the question – How many students graduate in four years or five years?
What is being graded?
1. Four-Year Graduation Rate – How many students graduated in four years or less?
2. Five-Year Graduation Rate – How many students graduated in five years or less?
Why is this important?
Almost all jobs require skills and education beyond a high school diploma. Measuring the five-year rate gives districts credit for helping students, who just missed graduating on time, finish their diplomas.
Questions to ask
• What are the reasons students are not graduating?
• Are there certain subjects that are holding students back?
• What are we doing to grow the number of students who graduate?
• Which districts, similar to ours, are doing better than we are? What are they doing?
Graduation Rate

HOW DO I USE THIS INFORMATION? 7
K-3 LiteracyThis grade answers the question – Are more students learning to read in kindergarten through the third grade?
What is being graded?
K-3 Literacy Improvement – How well did your school move students at each level – kindergarten and grades 1, 2 and 3 – who were not on track to read at grade level at the beginning of the 2013-2014 school year to being on track at the beginning of the 2014-2015 school year?
Why is this important?
• Early reading predicts how students will do throughout the remainder of their school careers.
• Under state law, third-graders need to receive a score of 394 in the 2014-2015 school year to be promoted to the fourth grade. This is a different score than the score for proficient (400) on the Ohio School Report Card.
What is an A?
All students that are not on track in reading receive interventions and improve to being on track.
Questions to ask
• What are we doing to help our struggling readers?
• Do we have specialists, intervention services or outside assistance in place to meet the needs of struggling readers?
• How many students enter our schools struggling to read and how successful are we in helping them catch up?
• Which districts, like ours, are doing better than we are? What are they doing?
This answers the question – Are students who graduate from your school ready for college or careers? There are many ways to show that graduates are prepared.
What is being reported?
The measures are:• College Admission Test (participation rate and
percent receiving non-remediation scores).• College Credit Plus Credits (percent earning at
least three credits).• Industry Credentials (percent of students with
credentials).• Honors Diplomas Awarded (percent of students
with Honors Diplomas).• Advanced Placement (participation rate and
percent scoring three or above).• International Baccalaureate Program (participation
rate and percent scoring four or above).
Why is this important?
• Graduation is not enough. Students must be prepared for further education or work after high school.
• Whether training in a technical field or preparing for work or college, these indicators measure preparedness for all educational tracks.
• All districts and community schools must provide and promote ways for high schools to provide college credit.
Questions to ask
• Which of the elements in the Prepared for Success component are our schools providing?
• Why are we not offering other elements?
• Are those moving on to college able to do college-level work immediately?
• How do we inform parents and encourage students to get involved in these opportunities?
Prepared for Success

UNDERSTANDING OHIO SCHOOL REPORT CARDS 98 GUIDE TO 2015 OHIO SCHOOL REPORT CARDS
Understanding Ohio School Report Cards
Achievement
Measures: Indicators Met Performance Index
Description: The Indicators Met measure shows how many students have a minimum, or proficient, level of knowledge. These indicators are not new to Ohio students or teachers. They are based on a series of up to 35 state tests that measure the percent of students proficient or higher in a grade and subject. Schools and districts also are evaluated on the gifted indicator, giving them up to 36 possible indicators.
The Performance Index measures the achievement of every student, not just whether or not he or she reaches “proficient.” Districts and schools receive points for every student’s level of achievement. The higher the student’s level, the more points the school earns toward its index. This rewards schools and districts that improve the performance of highest- and lowest-performing students.
Technical Fact: The number of indicators “met” out of the total indicators determines the A-F grade on the report card. The calculation for the Performance Index letter grade is the number of points earned by the school or district divided by the total possible number of points (120).
A-F Rating: The ranges for both achievement measure grades are the same and partially prescribed by law.
Score Letter Grade
90% - 100% A
80% - 89.9% B
70% - 79.9% C
50% - 69.9% D
Below 50% F
Example:

UNDERSTANDING OHIO SCHOOL REPORT CARDS 9
Progress
Measures: All Students (overall rating of a school or district) Gifted Students (math, reading or superior cognitive only) Students with Disabilities (all students who have IEPs and take the Ohio Achievement Assessments)
Students in the Lowest 20 Percent of Achievement Statewide (based on distribution of scores for the entire state)
Description: The data from state tests for the 2014-2015 school year will be examined through a series of calculations to produce a value-added designation for each school and district. Additionally, the calculations also determine the progress of three specific groups of students.
The five designations – determined in law – are the same ranges of growth used to compute teacher effectiveness ratings.
Just because a school may have a low achievement level in a given year does not mean that students are not learning. In fact, there may be a great deal of academic growth taking place moving students toward academic success. Conversely, there is a misconception that high achievers have met their potential and can no longer advance their learning. This measure highlights the importance of providing the curriculum and instruction that will help all students to grow academically every year.
Technical Fact: A scale that measures a “value-added index” is the basis for value-added grades. This is the same value-added index used for report card purposes since Ohio adopted its use in 2007. A range of “-1 to +1” represents “one year of growth in one year” and results in a C grade.
A-F Rating: The grade ranges for all measures in the Progress component are the same and prescribed by law.
Score Letter Grade
+2 and higher A
Greater or equal to +1 but less than +2 B
Greater or equal to -1 but less than +1 C
Greater or equal to -2 but less than -1 D
Less than -2 F
UNDERSTANDING OHIO SCHOOL REPORT CARDS 1110 GUIDE TO 2015 OHIO SCHOOL REPORT CARDS
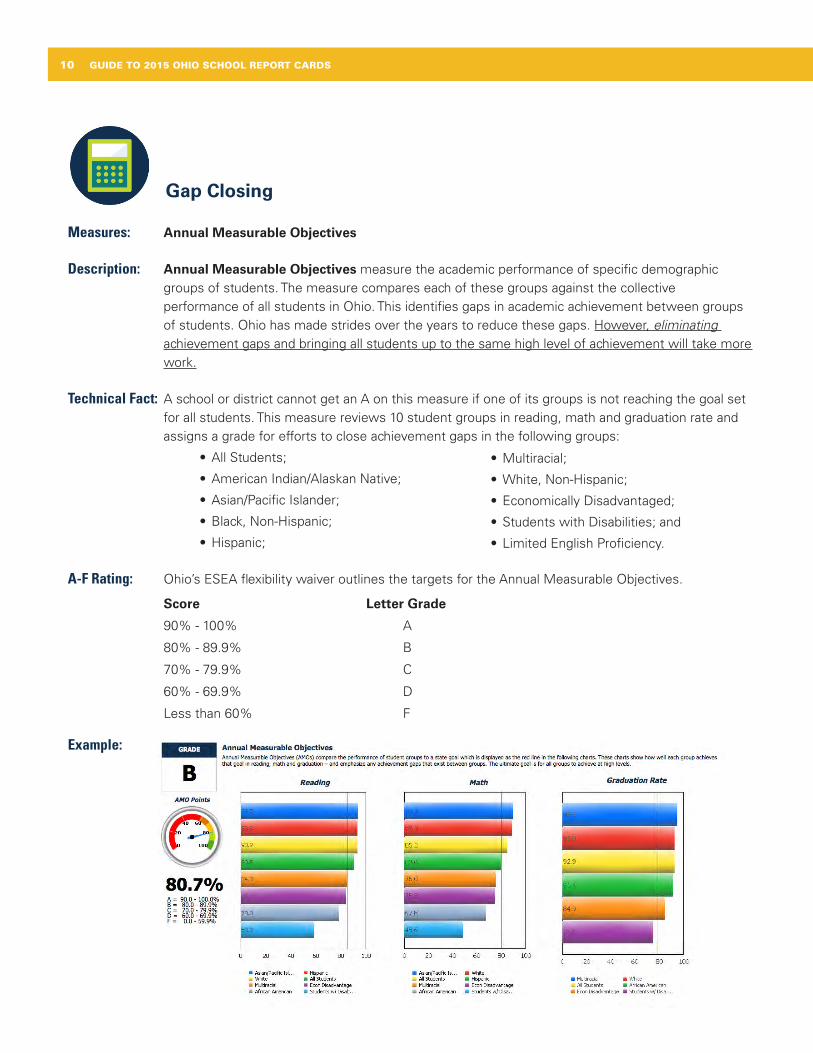
Gap Closing
Measures: Annual Measurable Objectives
Description: Annual Measurable Objectives measure the academic performance of specific demographic groups of students. The measure compares each of these groups against the collective performance of all students in Ohio. This identifies gaps in academic achievement between groups of students. Ohio has made strides over the years to reduce these gaps. However, eliminating achievement gaps and bringing all students up to the same high level of achievement will take more work.
Technical Fact: A school or district cannot get an A on this measure if one of its groups is not reaching the goal set for all students. This measure reviews 10 student groups in reading, math and graduation rate and assigns a grade for efforts to close achievement gaps in the following groups:
• All Students;
• American Indian/Alaskan Native;
• Asian/Pacific Islander;
• Black, Non-Hispanic;
• Hispanic;
A-F Rating: Ohio’s ESEA flexibility waiver outlines the targets for the Annual Measurable Objectives.
Score Letter Grade
90% - 100% A
80% - 89.9% B
70% - 79.9% C
60% - 69.9% D
Less than 60% F
• Multiracial;
• White, Non-Hispanic;
• Economically Disadvantaged;
• Students with Disabilities; and
• Limited English Proficiency.
Example:

UNDERSTANDING OHIO SCHOOL REPORT CARDS 11
Graduation Rate
Measures: Four-Year Graduation RateFive-Year Graduation Rate
Description: The Four-Year Graduation Rate includes as graduates only those students who earn diplomas within four years of entering the ninth grade for the first time. The Five-Year Graduation Rate includes those students who graduate within five years of entering ninth grade for the first time.
Technical Fact: In 2010, Ohio transitioned to a new method of calculating the graduation rate. The federal government set this rate to allow for comparisons between Ohio and other states. The calculation for the Four-Year Graduation Rate divides the number of students who graduate high school in four years or less by the number of students who form the adjusted group for the graduating class. The calculation of the Five-Year Graduation Rate divides the number of students who graduate high school in five years or less by the number of students who form the adjusted group for the graduating class. The adjusted group includes all students who entered ninth grade for the first time four years earlier. A group is adjusted by adding any students who transfer into the group later during the ninth grade and the next three years and subtracting students who transferred out. A student can be in only one group.
A-F Rating: The ranges for the graduation rate measures are different and partially prescribed in law.
Four-Year Graduation Rate
Score Letter Grade
93% - 100% A
89% - 92.9% B
84% - 88.9% C
79% - 83.9% D
Less than 79% F
Five-Year Graduation Rate
Score Letter Grade
95% - 100% A
90% - 94.9% B
85% - 89.9% C
80% - 84.9% D
Less than 80% F
Example:

UNDERSTANDING OHIO SCHOOL REPORT CARDS 1312 GUIDE TO 2015 OHIO SCHOOL REPORT CARDS
K-3 Literacy
Measures: K-3 Literacy Improvement
Description: Reading is the foundation for all learning. That is why it is critical to find and address reading issues for a student as early as possible. K-3 Literacy Improvement measures how well districts and schools are helping young students who are reading below grade level.
The measure and component relate to Ohio’s Third Grade Reading Guarantee, which aims to make sure that all students are reading at grade level by the end of third grade. The guarantee drives attention to students from kindergarten through third grade who are struggling readers and makes sure they get the help they need to succeed in reading. Through this initiative, districts and schools diagnose reading issues, create individualized reading improvement and monitoring plans, and provide intensive reading interventions.
Technical Fact: Any school or district that had fewer than 5 percent of its kindergartners reading below grade level at the beginning of the 2014-2015 school year will not receive a letter grade for this measure. The minimum range of a C grade will be the prior year’s statewide average value for this measure.Students who fail their reading assessment and are not receiving services through a reading improvement and monitoring plan count against a district.
This measure will use results from reading diagnostic assessments given to all students in kindergarten through grade three at the beginning of the year and the Grade 3 English Language Arts Ohio Achievement Assessment.
A-F Rating: The grade for the measure is based on the prior year’s state average. State law requires that the statewide average represents the bottom of the C range.
Example:

UNDERSTANDING OHIO SCHOOL REPORT CARDS 13
Prepared for Success
Measures: College Admission Test (participation rate and percent receiving non-remediation scores)College Credit Plus Credits (percent earning at least three credits)Industry-Recognized Credentials (percent of students with credentials)Honors Diplomas Awarded (percent of students with Honors Diplomas) Advanced Placement (participation rate and percent scoring three or above) International Baccalaureate Program (participation rate and percent scoring four or above)
Description: When students graduate from Ohio high schools, they must be ready for success in college and careers. The Prepared for Success component measures this goal.
Prepared for Success is a unique component. It contains six measures that do not receive individual grades; they are only reported on the report card.
Using multiple measures for college and career readiness allow districts to showcase their unique approaches to prepare students for success after high school. For example, some school districts may focus on Advanced Placement courses while others focus on College Credit Plus credits.
Technical Fact: Schools or districts earn one point for each student who earns an industry-recognized credential, a remediation-free score on a national college admission test or an Honors Diploma. The State Board of Education will give additional weight for students who demonstrate college and career readiness in multiple ways. The school or district earns an additional 0.3 point, up to a maximum of 1.3 points, per student if he or she has attained one point for one of the above and a three or higher on an Advanced Placement exam, a four or better on International Baccalaureate tests or three College Credit Plus credits. Schools or districts do not earn the extra points if the student did not earn an industry-recognized credential, a remediation-free score on the national college admission test or an Honors Diploma.
A-F Rating: The 2015 Ohio School Report Card will report individual measures. The measures will not receive grades.
Example:

CAREER-TECHNICAL PLANNING DISTRICTS 1514 GUIDE TO 2015 OHIO SCHOOL REPORT CARDS
Other Report Card Information
This information identifies the number of your district’s students who are determined to be gifted and how many of them are receiving gifted services from the district or school. Additionally, it shows how your gifted students are performing academically. You can find this information in the Achievement component section.
Gifted Students
Example:
The Achievement section of the district and school report cards provides access to this gifted information.

CAREER-TECHNICAL PLANNING DISTRICTS 15
These measures answer several questions about spending and performance. How much is spent on classroom instruction? How much, on average, is spent on each student? What is the source of the revenue? How do these measures compare to other districts and schools?
Financial Data
OTHER REPORT CARD INFORMATION 15
Example:
Comparison Group: Enrollment between 1000 and 2499
Every district and school report card includes this financial information.

CAREER-TECHNICAL PLANNING DISTRICTS 1716 GUIDE TO 2015 OHIO SCHOOL REPORT CARDS
Report Card for Career-Technical Planning DistrictsStudents included in this report card have completed at least half of their career-technical education and are enrolled for the second half. There are five components on this report card – Achievement, Graduation Rate, Prepared for Success, Post-Program Outcomes and Federal Accountability Results.
Technical Skill Attainment measures the proportion of students passing technical assessments. These assessments are designed to measure the skills and knowledge learned in a student’s career-technical program.
Achievement
What is being graded?
1. Percent of students participating in assessments.
2. Of those participating, the percent of students passing technical assessments.
Questions to ask
Some students will not achieve at the highest levels, even in a school with a good grade.
• Why are students not participating in assessments?
• What are we doing to increase participation?
• What help do our students need to pass assessments?
• Which career-tech centers, similar to ours, are doing better than we are? What are they doing?
How is the grade determined?
The Technical Skill Attainment Rate reflects the proportion of students who passed the technical tests in their career-tech programs. Only students who took tests are included in the passage rate.
Score Letter Grade
80% - 100% A
70% - 79.9% B
60% - 69.9% C
55% - 59.9% D
0 - 54.9% F
This grade also reflects the testing participation rate. Districts that test a high proportion of their students receive an increase of one letter grade, while those that test a low proportion of their students receive a grade decrease.
Effect Test Participation RateGrade Increase Test participation rate >70%Grade Decrease Test participation rate <50%

CAREER-TECHNICAL PLANNING DISTRICTS 17
This grade measures the percent of students who concentrate in career-technical education and graduate from high school within four or five years.
Graduation Rate
What is being graded?
1. Four-Year Graduation Rate – How many students graduated in four years or less?
2. Five-Year Graduation Rate – How many students graduated in five years or less?
Why is this important?
Almost all jobs require skills and education beyond a high school diploma. Measuring the five-year rate gives districts credit for helping students, who just missed graduating on time, finish their diplomas.
Questions to ask
• What are the reasons students are not graduating?
• Are there certain subjects that are holding students back?
• What are we doing to grow the number of students who graduate?
• Which districts, similar to ours, are doing better than we are? What are they doing?
How is the grade determined?
The Four-Year Graduation Rate includes only those students who earn diplomas within four years after entering the ninth grade for the first time and concentrated in career-technical education.
Score Letter Grade
93% - 100% A
89% - 92.9% B
84% - 88.9% C
79% - 83.9% D
Less than 79% F
The Five-Year Graduation Rate includes those students who graduate within five years after entering ninth grade for the first time and concentrated in career-technical education by the end of their fourth year.
Score Letter Grade
95% - 100% A
90% - 94.9% B
85% - 89.9% C
80% - 84.9% D
Less than 80% F

CAREER-TECHNICAL PLANNING DISTRICTS 1918 GUIDE TO 2015 OHIO SCHOOL REPORT CARDS
Prepared for Success
This measure answers the question – Are students who graduate from your school ready for college or careers? There are many ways to show that graduates are prepared.
What is being reported?
This information is only reported on the 2015 report card.
The measures are:
• Dual Enrollment (percent earning at least three college credits)
• Honors Diplomas Awarded (percent of students with Honors Diplomas)
• Advanced Placement (participation rate)
• International Baccalaureate Program (participation rate)
Why is this important?
• Graduation is not enough. Students must be prepared for further education or work after high school.
• Whether training in a technical field or preparing for work or college, these indicators measure preparedness for all educational tracks.
• All districts must provide and promote ways for high schools to provide college credit.
Questions to ask
• Which elements measured in Prepared for Success are our schools providing?
• Why are we not offering other elements?
• Are those moving on to college able to do college-level work immediately?
• How do we inform parents and encourage students to get involved in these opportunities?
• How prepared are our students to get good jobs in area businesses?

CAREER-TECHNICAL PLANNING DISTRICTS 19
Post-Program Outcomes
This measures the percent of students who are employed, in apprenticeships, in the military, or enrolled in postsecondary education or advanced training within six months of graduating high school.
Industry credentials measure the proportion of students earning credentials or certificates before they leave high school or in the six-month period after leaving school.
What is being graded?
1. Percent of graduates who are employed, in apprenticeships, in the military, or enrolled in postsecondary education or advanced training within six months after graduation.
2. Percent of graduates who earn one or more credentials or certificates before graduation or within six months after graduation. There is currently no grade attached to the credentials measure.
Why is this important?
• All graduates should move onto their next steps in higher education or jobs.
• Earning a credential or certificate ensures that the student has an employable skill.
Questions to ask
• Why are students not taking their next steps after graduation onto higher education or jobs?
How is the grade determined?
The Post-Program Placement Rate reflects the proportion of students who left school and, in the subsequent months after leaving, were employed, in the military, in apprenticeships or enrolled in postsecondary education or advanced training. Only students who responded to surveys six- to nine-months after leaving school are included in this rate.
Score Letter Grade
93% - 100% A
89% - 92.9% B
84% - 88.9% C
79% - 83.9% D
0.0% - 78.9% F
The Post-Program grade also considers the proportion of students who were surveyed. This is called the Status Known Rate. The Post-Program grade is increased by one letter grade for Career-Technical Planning Districts with high Status Known Rates and decreased by one letter grade for Career-Technical Planning Districts with low Status Known Rates.
Status Known Rate Effect95% - 100% Letter grade increased one level85% - 94.9% No change to initial letter grade0.0% - 84.9% Letter grade decreased one level

DROPOUT PREVENTION AND RECOVERY SCHOOLS 2120 GUIDE TO 2015 OHIO SCHOOL REPORT CARDS
Report Card for Dropout Prevention and Recovery SchoolsCommunity schools that serve a majority of their students through dropout prevention and recovery programs receive this report card. Rather than A-F grades, dropout prevention and recovery schools receive one of the following ratings for report card measures – Exceeds Standards, Meets Standards, Does Not Meet Standards or Not Reported (used when there are too few data to issue a rating).

DROPOUT PREVENTION AND RECOVERY SCHOOLS 21
This rating reports the percentages of students who passed all five subjects of the Ohio Graduation Tests as required for high school graduation.
High School State Test Passage Rate
What is being rated?
The number of students who have passed all five Ohio Graduation Tests.
Why is this important?
Every student deserves to succeed in learning.
Questions to ask
• Are students in this school succeeding academically in this program?
• If not, why?
Example:

DROPOUT PREVENTION AND RECOVERY SCHOOLS 2322 GUIDE TO 2015 OHIO SCHOOL REPORT CARDS
Gap Closing
This measure shows how well all students are doing in your school in reading, math and graduation. It answers the question – Is every student succeeding, regardless of income, race, ethnicity or disability?
What is being rated?
Annual Measurable Objectives – How does the performance of student groups in my school compare to a state goal?
Why is this important?
Every student should succeed in learning. When a group or groups of students are not succeeding, educators need to review why and make changes.
Questions to ask
• How are different groups of students performing?
• What information is available to determine who is doing well and who is not?
• How can we change instruction for groups who are not succeeding?
Example:

DROPOUT PREVENTION AND RECOVERY SCHOOLS 23
Graduation Rate
This rating reports the number of students graduating from your school in four, five, six, seven or eight years.
What is being rated?
1. The number of students who graduated in four years or less.
2. The number of students who graduated in five years or less.
3. The number of students who graduated in six years or less.
4. The number of students who graduated in seven years or less.
5. The number of students who graduated in eight years or less.
Why is this important?
Almost all jobs require skills and education beyond a high school diploma. Measuring the four-, five-, six-, seven- and eight-year graduation rates gives the school credit for helping students finish their diplomas.
Questions to ask
• If students are not graduating, why?
Example:

SAFE HARBOR 2524 GUIDE TO 2015 OHIO SCHOOL REPORT CARDS
What is Safe Harbor?
The General Assembly directed the Ohio Department of Education to transition to new state tests in mathematics and English language arts for the 2014-2015 school year. To give schools, teachers and students time to adjust, new Ohio law suspends many of the consequences of the tests for the 2014-2015, 2015-2016 and 2016-2017 school years.
Safe Harbor for School DistrictsSchool officials might find it helpful to communicate with parents about safe harbor as meaning “no impact.” School districts can become eligible for certain programs or interventions based on their report card performance. Safe harbor – or no impact – for school districts means the following programs or interventions will be suspended:
Challenged School District DesignationWhen the state designates a school district as “challenged,” new startup community schools can open within the district’s boundaries. Safe harbor means the state will designate no new school districts as challenged until it releases the 2018 report card.
Educational Choice Scholarship ProgramStudents attending persistently poor performing schools can become eligible for vouchers to pay the costs of attending private schools. Safe harbor means Ohio will include no new public school buildings in the program until the 2019-2020 school year.
Academic Distress CommissionsOhio forms these commissions to help improve a school district after three consecutive years of poor results on its report card. The law allows only a one-year safe harbor for Academic Distress Commission consideration. This means the state will not consider 2014-2015 school year performance (the 2015 report card) as part of the three years that lead up to Academic Distress Commission appointment. However, the 2014-2015 school year will not count as a gap in the consecutive years. The 2015 report card will simply not factor in at all. The 2016 report card and report cards thereafter will count toward the three consecutive years.
Community School ClosureThe majority of community schools receive the same traditional report card as other public schools. Community schools can be closed by law for continued poor performance. That said, Ohio’s current safe harbor provisions say the state will not use grades published on schools’ 2014-2015, 2015-2016 and 2016-2017 report cards to judge whether it will close a school.

SAFE HARBOR 25
School Restructuring
When traditional public schools receive low report card grades, there are several laws that require them to restructure or even close. Safe harbor means that no new school buildings will be required to restructure because of state law based on the 2015, 2016 or 2017 report cards. However, there are restructuring requirements included in federal law that are not covered by Ohio’s safe harbor provisions. This state portion of restructuring affects only a few schools.
Safe Harbor for StudentsSchools and districts may not use test results during the 2014-2015, 2015-2016 and 2016-2017 school years to grant credits to students or to promote or deny students’ promotion to higher grade levels, except in the case of the Third Grade Reading Guarantee and graduation requirements. Test vendors can release a student’s test score reports only to the school district, the student and the student’s parent or guardian.
Schools must still retain in third grade a child who does not meet the “promotion score” on Ohio’s grade three English language arts test. Some students may be exempted from this requirement. Exemption information is on the department’s website at education.ohio.gov.
The graduating classes of 2018 and after are taking end-of-course tests to earn graduation points. A student’s performance on these tests will impact a student’s graduation. However, safe harbor allows any student to retake any end-of-course tests. Students also have other options to earn a high school diploma.
Safe Harbor for Teachers and PrincipalsStudent growth makes up a significant portion of an evaluation for teachers and principals. State tests are one of the ways to calculate this student growth. Due to the transition to new assessments, there no longer will be consequences tied to the results of the state tests given in the 2014-2015 and 2015-2016 school years. Additionally, teachers and principals will not use value-added ratings from state tests for the 2014-2015 and 2015-2016 school years as part of their evaluations or when making decisions regarding dismissal, retention, tenure or compensation unless they choose to use the data. The law provides other options for districts to address student growth measures as a part of teacher evaluations. Discuss this with your district leaders.

REWARDS AND RECOGNITION 2726 GUIDE TO 2015 OHIO SCHOOL REPORT CARDS
Rewards and RecognitionOhio recognizes schools for maintaining high academic achievement among their students, including many from economically disadvantaged circumstances that can make learning difficult. Visit education.ohio.gov/Rewards-and-Recognition to view the full list of Reward Schools.
Schools of Promise – 98 recognized in 2013-2014 school year
These schools meet these criteria:
• Serve at least 40 percent economically disadvantaged students.
• Achieve proficient scores in reading and math with 80 percent or more of students in grades that took the 2013-2014 Ohio Achievement Assessments and Ohio Graduation Tests. This includes students who are economically disadvantaged and in racial subgroups.
• Score grades of A or B on the Ohio School Report Card for their Annual Measurable Objectives, to narrow performance gaps between student groups.
• Receive an A, B or C on student learning progress through the school year. Additionally, a grade of A or B on high school graduation rate, if the building is a high school.
High Performing Schools of Honor – 48 recognized in 2013-2014 school year
The High Performing Schools of Honor exceed the criteria of Schools of Promise. These schools must:
• Be Title I eligible and serve 40 percent or more economically disadvantaged students.
• Have 90 percent or more of all students score Proficient on the Ohio Achievement Assessments and Ohio Graduation Tests over the last five years.
• Have 80 percent of all subgroups who are Proficient in the most recent school year. Student groups include racial and ethnic, economically disadvantaged, students with disabilities and English language learners.
• If a high school, has a 90 percent graduation rate over the last five years.
• Earns a C or higher letter grade for Annual Measurable Objectives and student learning progress.
High Progress Schools of Honor – 27 recognized in 2013-2014 school year
The High Progress Schools of Honor made the greatest five-year gains in proficiency and graduation rates, although they may still have work to do to achieve at the level of High Performing Schools of Honor. These buildings must be Title I eligible and serve 40 percent or more economically disadvantaged students.

REWARDS AND RECOGNITION 27
Blue Ribbon Schools – 15 schools recognized in 2014 school year
The U.S. Department of Education recognizes Ohio elementary and secondary schools that make significant progress in closing achievement gaps or whose students achieve at the highest levels in the state.
The Ohio Department of Education nominates 15 public schools each year. At least five must have 40 percent or more students who qualify for free or reduced-price lunch.
There are two categories for nomination:
• Exemplary High Performing Schools – performing in the top 15 percent of schools in the state using state assessments in both reading and mathematics.
• Schools with Exemplary Improvement – showing the most progress in reducing achievement gaps and in improving student performance using state assessments in both reading and mathematics. In addition, at least 40 percent of the school’s students are from disadvantaged backgrounds.
The schools with 40 percent or more poverty may fall into either category. Schools with less than 40 percent poverty only qualify for the high performing category.
The National Title I Association selects examples of superior Title I school programs. Selected schools qualify in one of the following categories:
• Exceptional student performance for two or more consecutive years.
• Closing the achievement gap between student groups.
The association uses academic achievement of students and the creative and innovative programs that contribute to the school’s success for this national recognition.
These schools demonstrate a wide array of strengths. This includes team approaches to teaching and learning, focused professional development opportunities for staff, individualized programs for student success and strong partnerships between the school, parents and the community.
National Title I Distinguished Schools Program
The U.S. Department of Education recognizes schools and districts for their outstanding, comprehensive approaches to being green in learning and operations. Their efforts include reducing environmental impact and utility costs. Additionally, they promote better health and have effective environmental education such as civics and green career pathways.
Green Ribbon Schools – 2 recognized in 2015 school year

Ohio Department of Education
(877) 644-6338 | reportcard.education.ohio.gov | [email protected]
Ohio School Report Cards
Ohio Families & Education @OHEducation OhioEdDept