guide to experience mapping
TRANSCRIPT
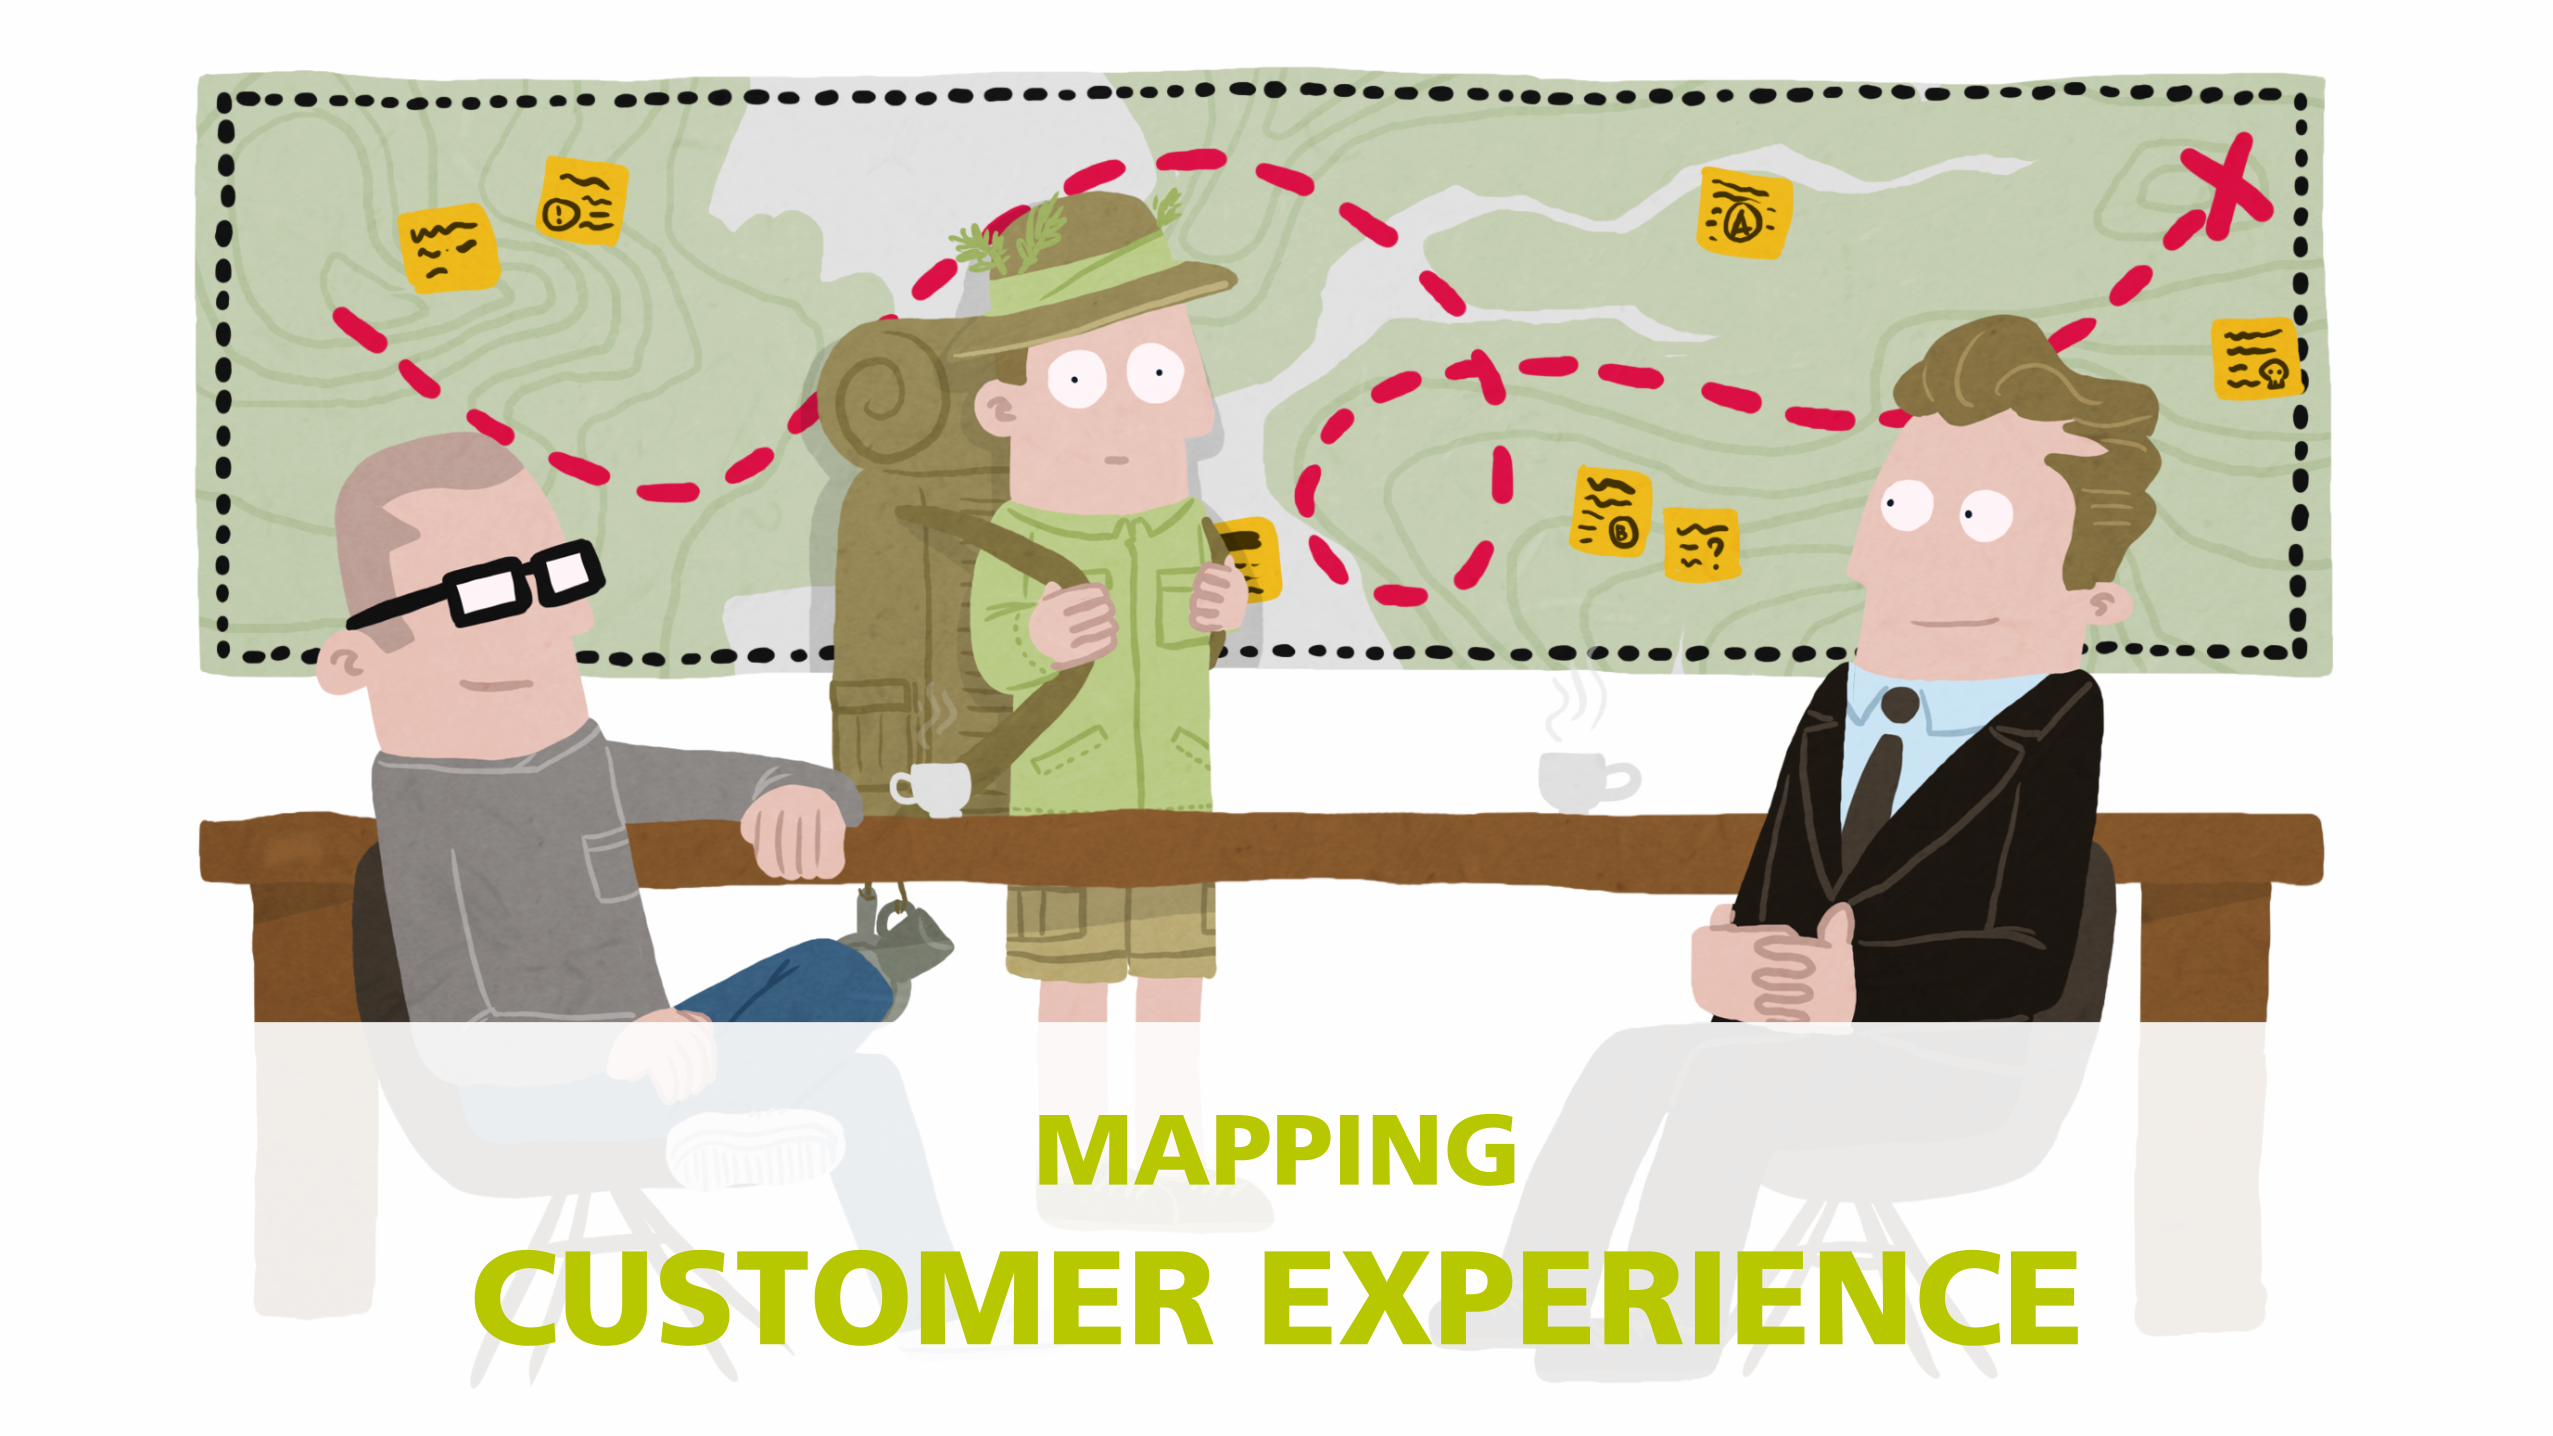
MAPPING CUSTOMER EXPERIENCE
This is a guide for mapping customer experiences.
It will guide you through the necessary steps to create Experience Maps by asking you 6 essential questions.

Ready? Let’s get started.
Question #1:
Which goal(s) do I want to achieve by using an Experience Map?
Goal (1/2)1
Structure2
Research3
Co-creation4
Visualisation5
Usage6
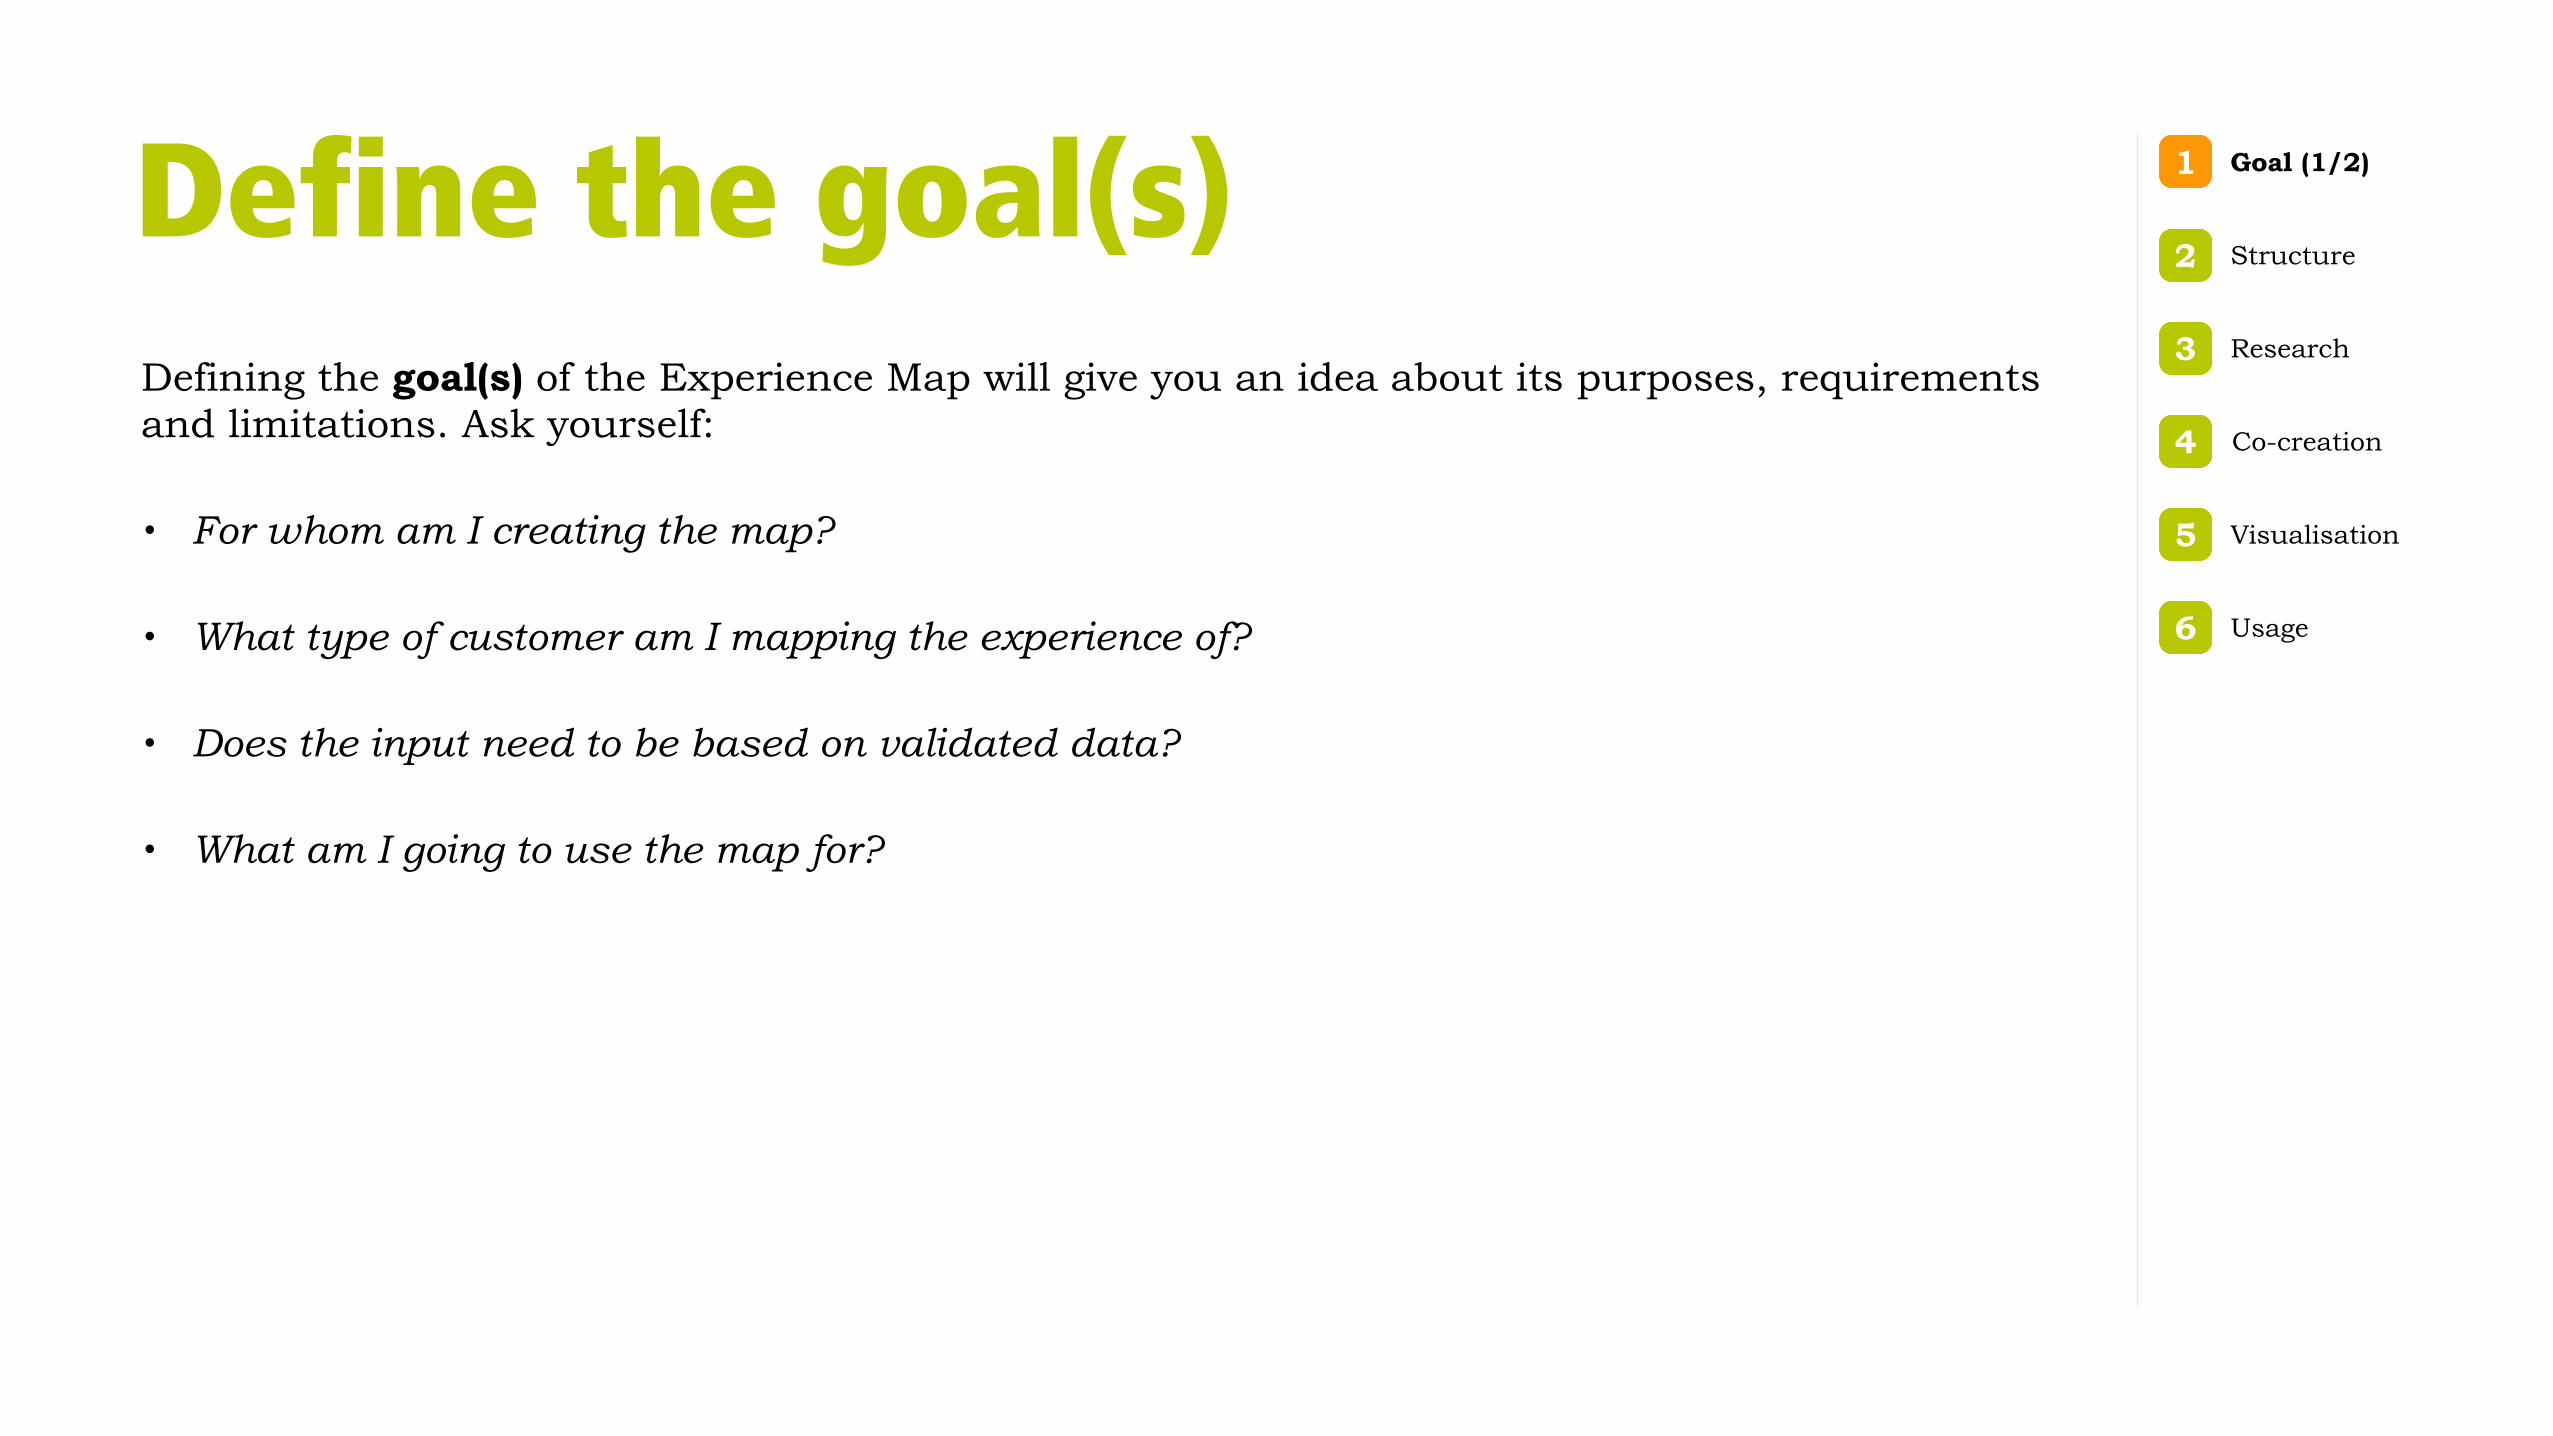
Define the goal(s)Defining the goal(s) of the Experience Map will give you an idea about its purposes, requirements and limitations. Ask yourself:
• For whom am I creating the map?
• What type of customer am I mapping the experience of?
• Does the input need to be based on validated data?
• What am I going to use the map for?
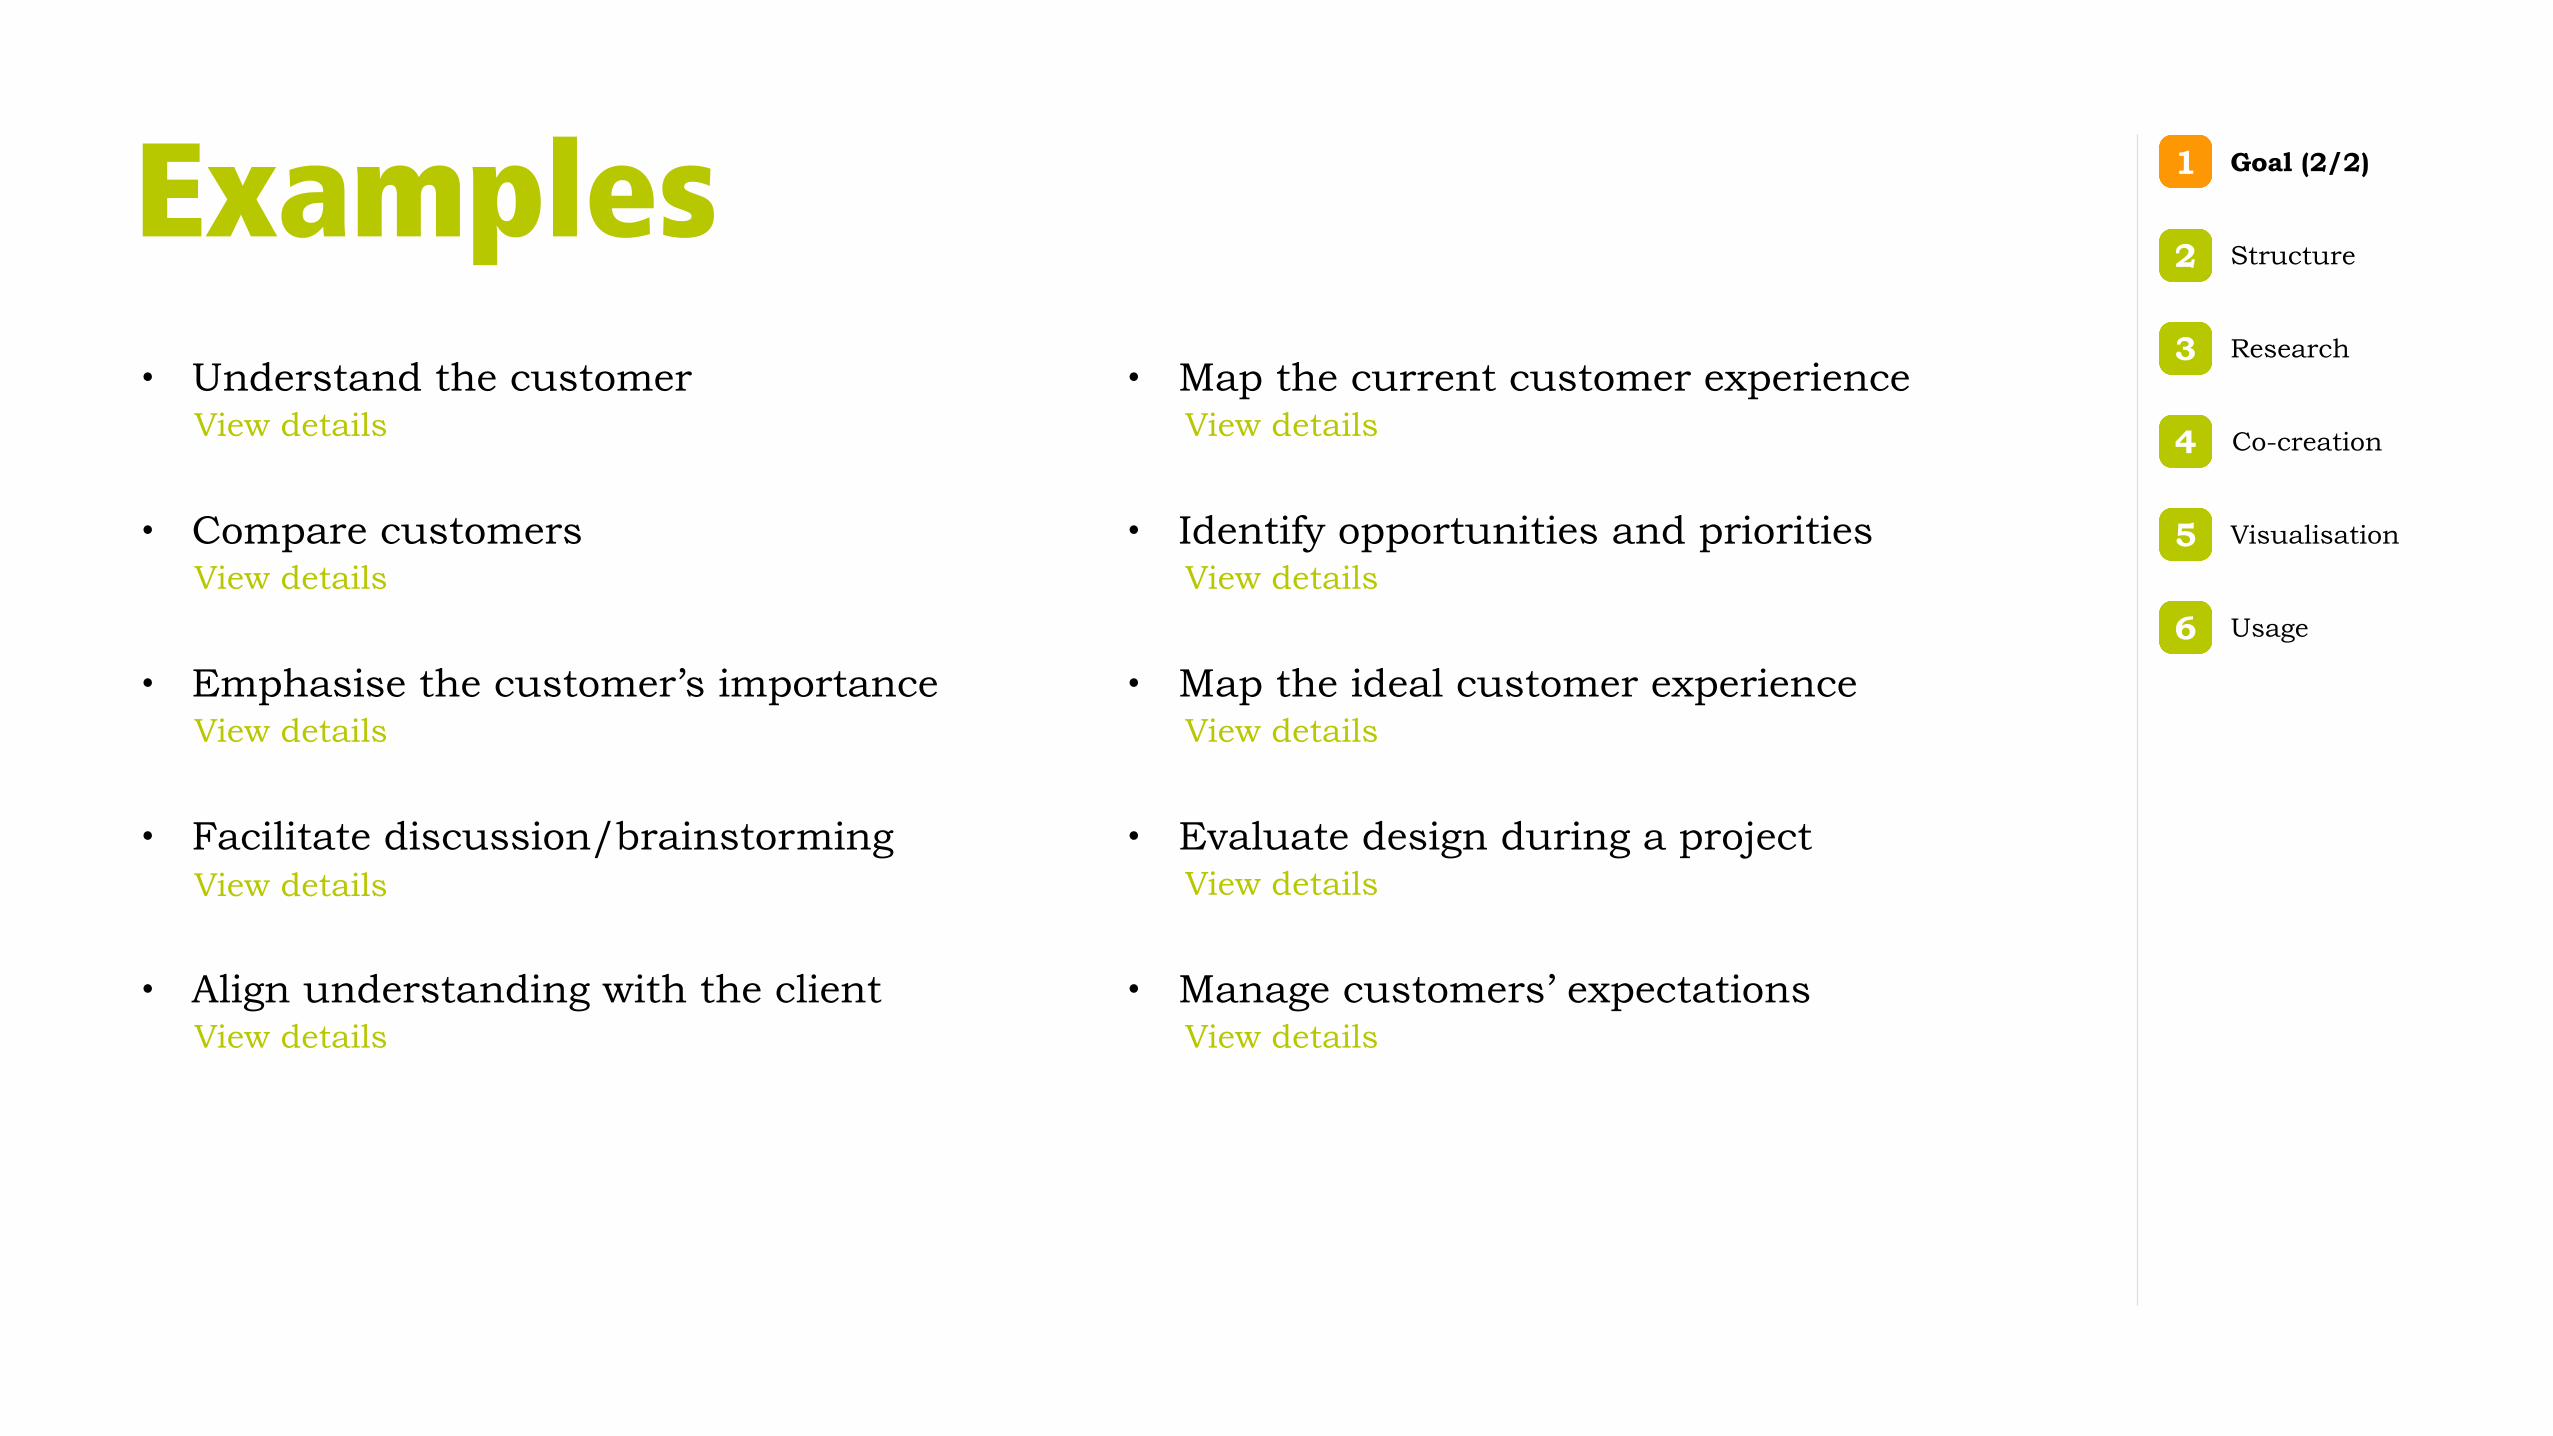
Examples• Understand the customer
• Compare customers
• Emphasise the customer’s importance
• Facilitate discussion/brainstorming
• Align understanding with the client
View details
• Map the current customer experience
• Identify opportunities and priorities
• Map the ideal customer experience
• Evaluate design during a project
• Manage customers’ expectations
View details
View details
View details
View details View details
View details
View details
View details
View details
Goal (2/2)1
Structure2
Research3
Co-creation4
Visualisation5
Usage6
Question #2:
Which structure should my Experience Map have to achieve my goal(s)?
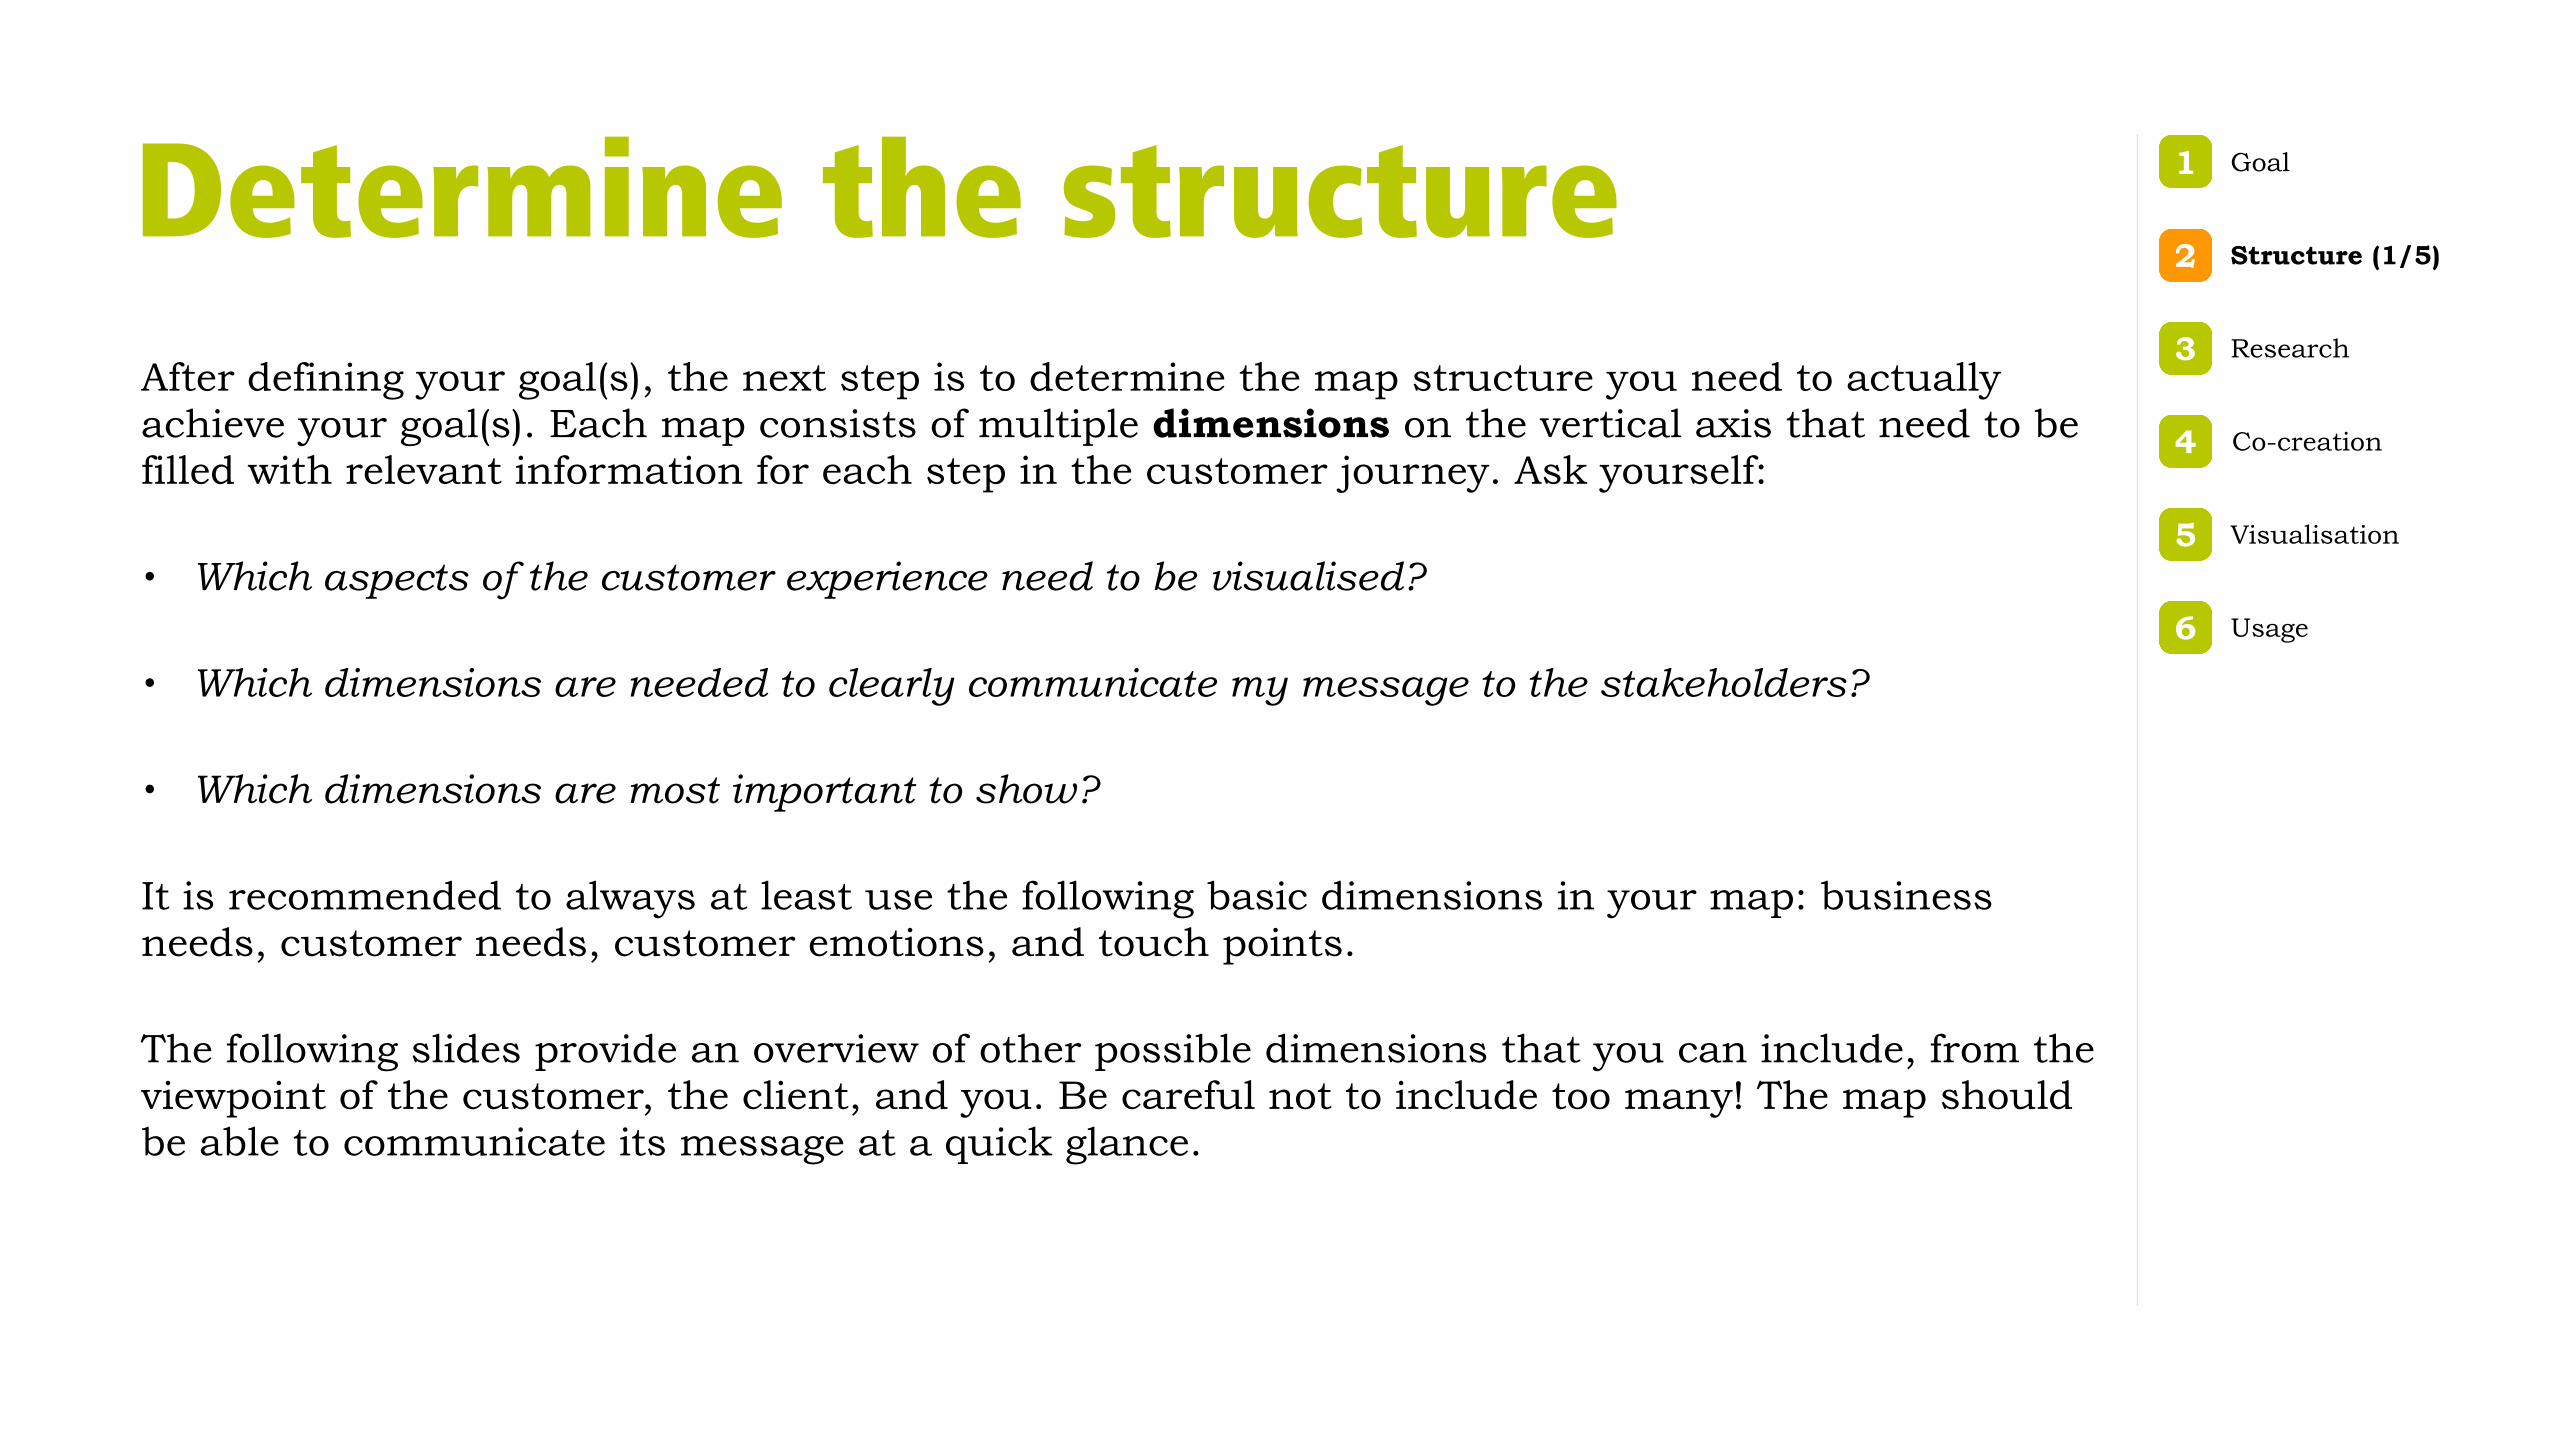
Determine the structureAfter defining your goal(s), the next step is to determine the map structure you need to actually achieve your goal(s). Each map consists of multiple dimensions on the vertical axis that need to be filled with relevant information for each step in the customer journey. Ask yourself:
• Which aspects of the customer experience need to be visualised?
• Which dimensions are needed to clearly communicate my message to the stakeholders?
• Which dimensions are most important to show?
It is recommended to always at least use the following basic dimensions in your map: business needs, customer needs, customer emotions, and touch points.
The following slides provide an overview of other possible dimensions that you can include, from the viewpoint of the customer, the client, and you. Be careful not to include too many! The map should be able to communicate its message at a quick glance.
Goal1
Structure (1/5)2
Research3
Co-creation4
Visualisation5
Usage6
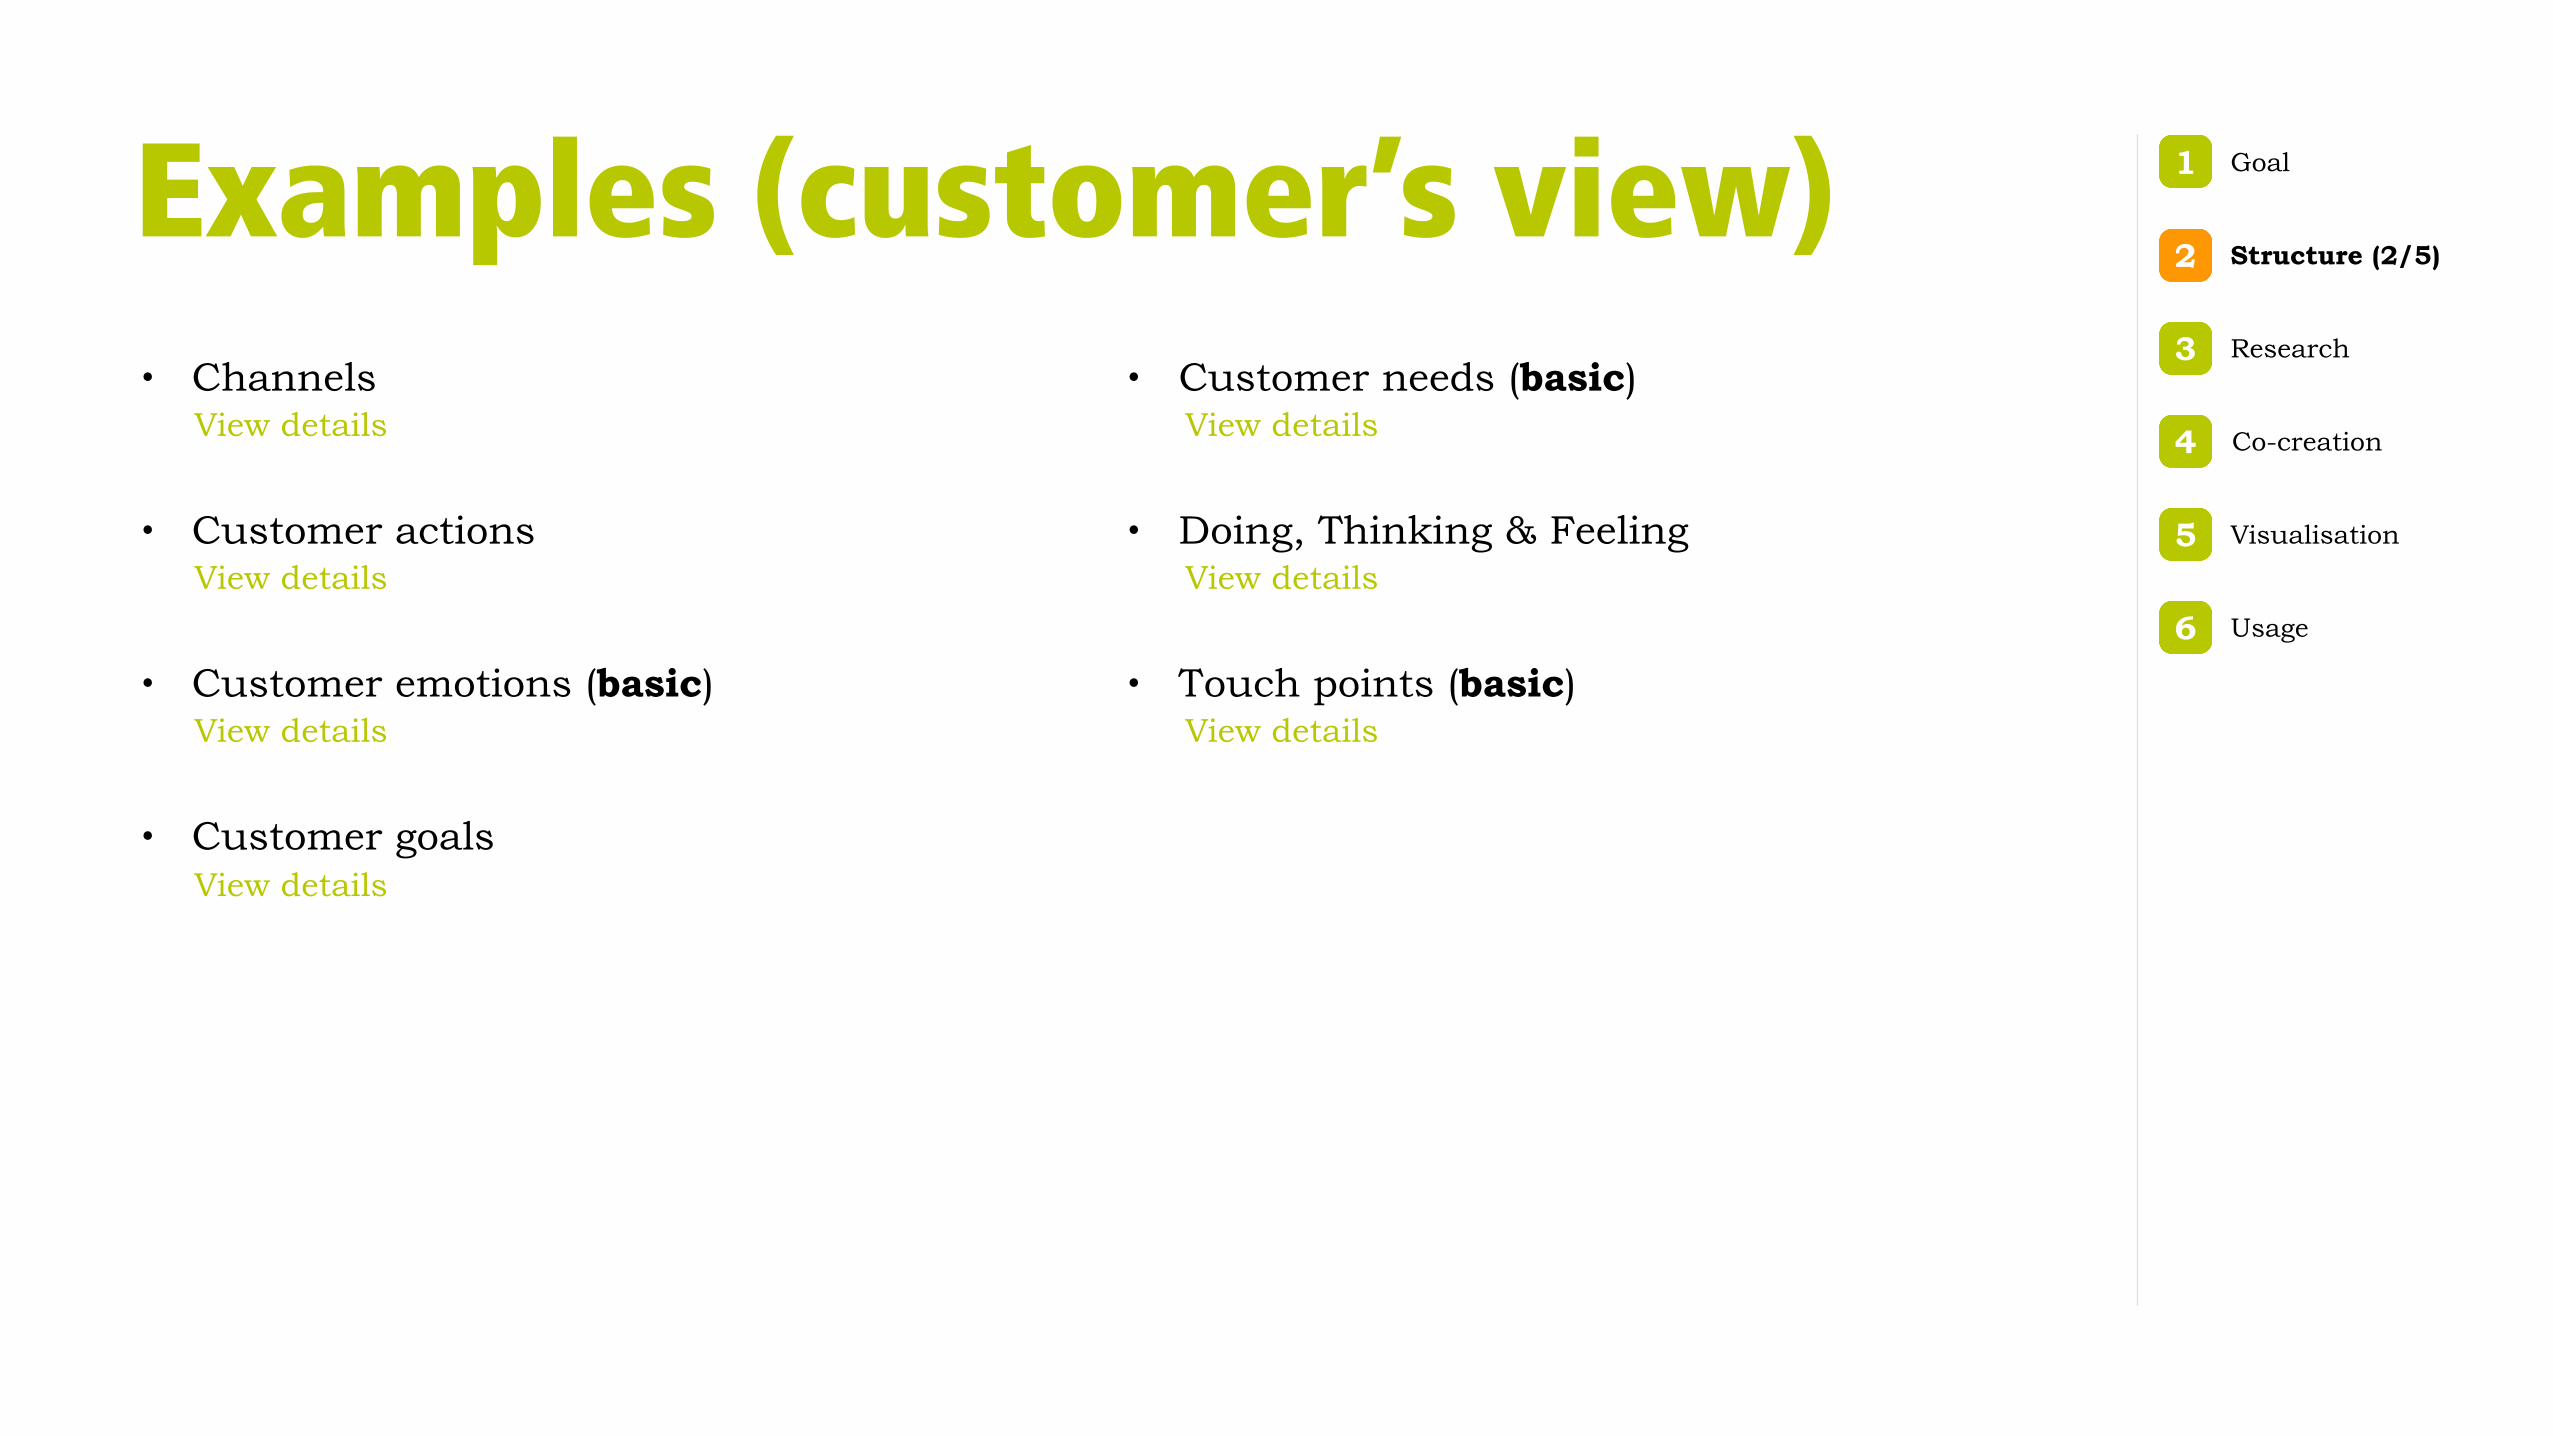
Examples (customer’s view)• Channels
• Customer actions
• Customer emotions (basic)
• Customer goals
View details
• Customer needs (basic)
• Doing, Thinking & Feeling
• Touch points (basic)
View details
View details
View details
View details
View details
View details
Goal1
Structure (2/5)2
Research3
Co-creation4
Visualisation5
Usage6
Examples (client’s view)• Answers
• Back-stage processes
• Brand promises
• Business goals
View details
• Business needs (basic)
• Content
• System
View details
View details
View details
View details
View details
View details
Goal1
Structure (3/5)2
Research3
Co-creation4
Visualisation5
Usage6
Examples (your view)• Benchmarks
• Wireframes
View details
View details
Goal1
Structure (4/5)2
Research3
Co-creation4
Visualisation5
Usage6
Examples (general)• Barriers
• Conditions
• Opportunities
• Questions
• Resources
View details
View details
View details
View details
View details
Goal1
Structure (5/5)2
Research3
Co-creation4
Visualisation5
Usage6

Question #3:
What do I need to learn about the customer?
Research the customerBefore starting to fill in your Experience Map, you need to get to know the customer. The structure that you determined in the previous steps will provide you with the necessary guidance for this research. For example, if your map needs to show ‘Customer needs’, your research should explicitly focus on uncovering these needs.
Some research techniques that you could use include contextual interviews, surveys, cultural probing, or available information from the client. Always use both qualitative and quantitative research methods. Ask yourself:
• What do I already know about the customer?
• What does my client already know about the customer?
• Which aspects of the customer do I still need to learn?
• Which qualitative techniques will I use to investigate these aspects?
• Which quantitative techniques will I use to investigate these aspects?
Goal1
Structure2
Research (1/2)3
Co-creation4
Visualisation5
Usage6
Pick a personaPersonas are fictional profiles that represent a particular group of customers. They can help you to empathise with the customer, and provide a solid basis for the information that you will put in the Experience Map. Furthermore, they can help your client to understand the customers’ needs, expectations, emotions and behaviours.
You can construct your own personas based on the results of your research. Sometimes your client will already have a persona ready. Always make sure to aks what these personas are based on before deciding to use them.
Goal1
Structure2
Research (2/2)3
Co-creation4
Visualisation5
Usage6
Question #4:
How do I determine the content of my Experience Map?
Co-create!You know the structure of your map, and have researched the customer. Now it is time to determine the content. Gather all your relevant stakeholders in a co-creation workshop, and start creating content together. Make sure to have enough space, sticky notes (at least five different colours), sharpies and sketching paper available.
You have the role of facilitator in the workshop: you create context, explain the goals, and guide the stakeholders through the process. Recruit a fellow colleague to take up the role of observer, photographer and/or note-taker.
The next slides will talk you through the necessary phases of a co-creation workshop.
Goal1
Structure2
Research3
Co-creation (1/8)4
Visualisation5
Usage6
1. Create contextYou give an introductory presentation in which you:
• Welcome the stakeholders;
• Give an introduction of the workshop;
• Discuss the goals of the workshop;
• Talk the stakeholders through your research.
Goal1
Structure2
Research3
Co-creation (2/8)4
Visualisation5
Usage6
2. OrganiseAfter giving the introduction, it is time to explain the procedure of the workshop.
If the group of stakeholders is too big for efficient discussion, divide them into teams of maximum 6 people.
Goal1
Structure2
Research3
Co-creation (3/8)4
Visualisation5
Usage6
3. Define CX stagesNow is the time to truly start co-creating!
Together with your stakeholders (or, if you have multiple teams, each team separately) decide upon the stages of the customer experience before, during and after the service. Use sticky notes to put these stages on a wall, window or large sheet of paper. This is the first draft of the horizontal axis of your Experience Map.
An example sequence of stages is as follows: Discover, Compare, Decide, Commit, Use, Leave.
Goal1
Structure2
Research3
Co-creation (4/8)4
Visualisation5
Usage6
4. Define dimensionsYou determined the horizontal axis, now it’s time for the vertical one.
Use a sticky note for dimensions that you determined earlier, and create the first draft of the vertical axis of your Experience Map. This is also the time to ask feedback about your pick of dimensions from the stakeholders. Update according to the new insights you acquire through discussion with them.
Goal1
Structure2
Research3
Co-creation (5/8)4
Visualisation5
Usage6
5. Define the lensNow is the time to introduce your persona. It can be used as a relevancy filter (a ‘lens’) when filling the map with information, to make sure everything adds value to the customer. Basically, for each cell that you fill, you should ask yourselves:
• What are the characteristics of the customer?
Additionally, when creating an Experience Map that will the show the ideal customer experience, you should always ask yourselves:
• What is the value proposition to the customer?
• On which design principles are the design solutions based?
Goal1
Structure2
Research3
Co-creation (6/8)4
Visualisation5
Usage6
6. Fill the map!Together with your stakeholders, you start brainstorming and discussing about the content of your map. You go on until each cell that can be filled, is filled. Depending on the goal, dimensions or lens that you determined earlier, some cells might not need to be filled, and some cells might contain a larger amount of information than others.
This phase of the workshop can be very lengthy. As a facilitator, it’s jour job to make sure to announce coffee breaks, and to keep everyone happy and energised in general. If needed, divide the workshop into multiple sessions. Only after all stakeholders agree on the content, the co-creation workshop ends.
If there are multiple teams, each team should fill their own map.
Goal1
Structure2
Research3
Co-creation (7/8)4
Visualisation5
Usage6
7. Share the resultsThis step is meant for workshops that have multiple teams of stakeholders.
Each team has made their own Experience Map out of sticky notes and discussion. Now, they need to share their results with the other teams. Learning from each other, and building upon each others’ ideas, everyone needs to come to terms about the contents of one final Experience Map.
Goal1
Structure2
Research3
Co-creation (8/8)4
Visualisation5
Usage6
Question #5:
What should my Experience Map look like?
Visualise your mapWell done, you pulled off the challenge of facilitating a co-creation workshop! Now it is time to start processing all the information you have gathered. This step is all about finding a way to visualise the results of the workshop in a compelling way. Sketching is a good way to explore different types of visualisations.
The map should communicate the takeaways (such as strategic insights or recommendations), the highs (delight points) and lows (pain points) of the customer experience, and the moments of truth (the moments that make or break the experience). Ask yourself:
• Which message should the map convey?
• What are the takeaways? The delight points? The pain points?
• What are the moments of truth?
• What should be immediately clear upon first glance?
• Which details may be discovered after closer inspection?
Goal1
Structure2
Research3
Co-creation4
Visualisation (1/1)5
Usage6
Question #6:
How am I going to use my Experience Map?
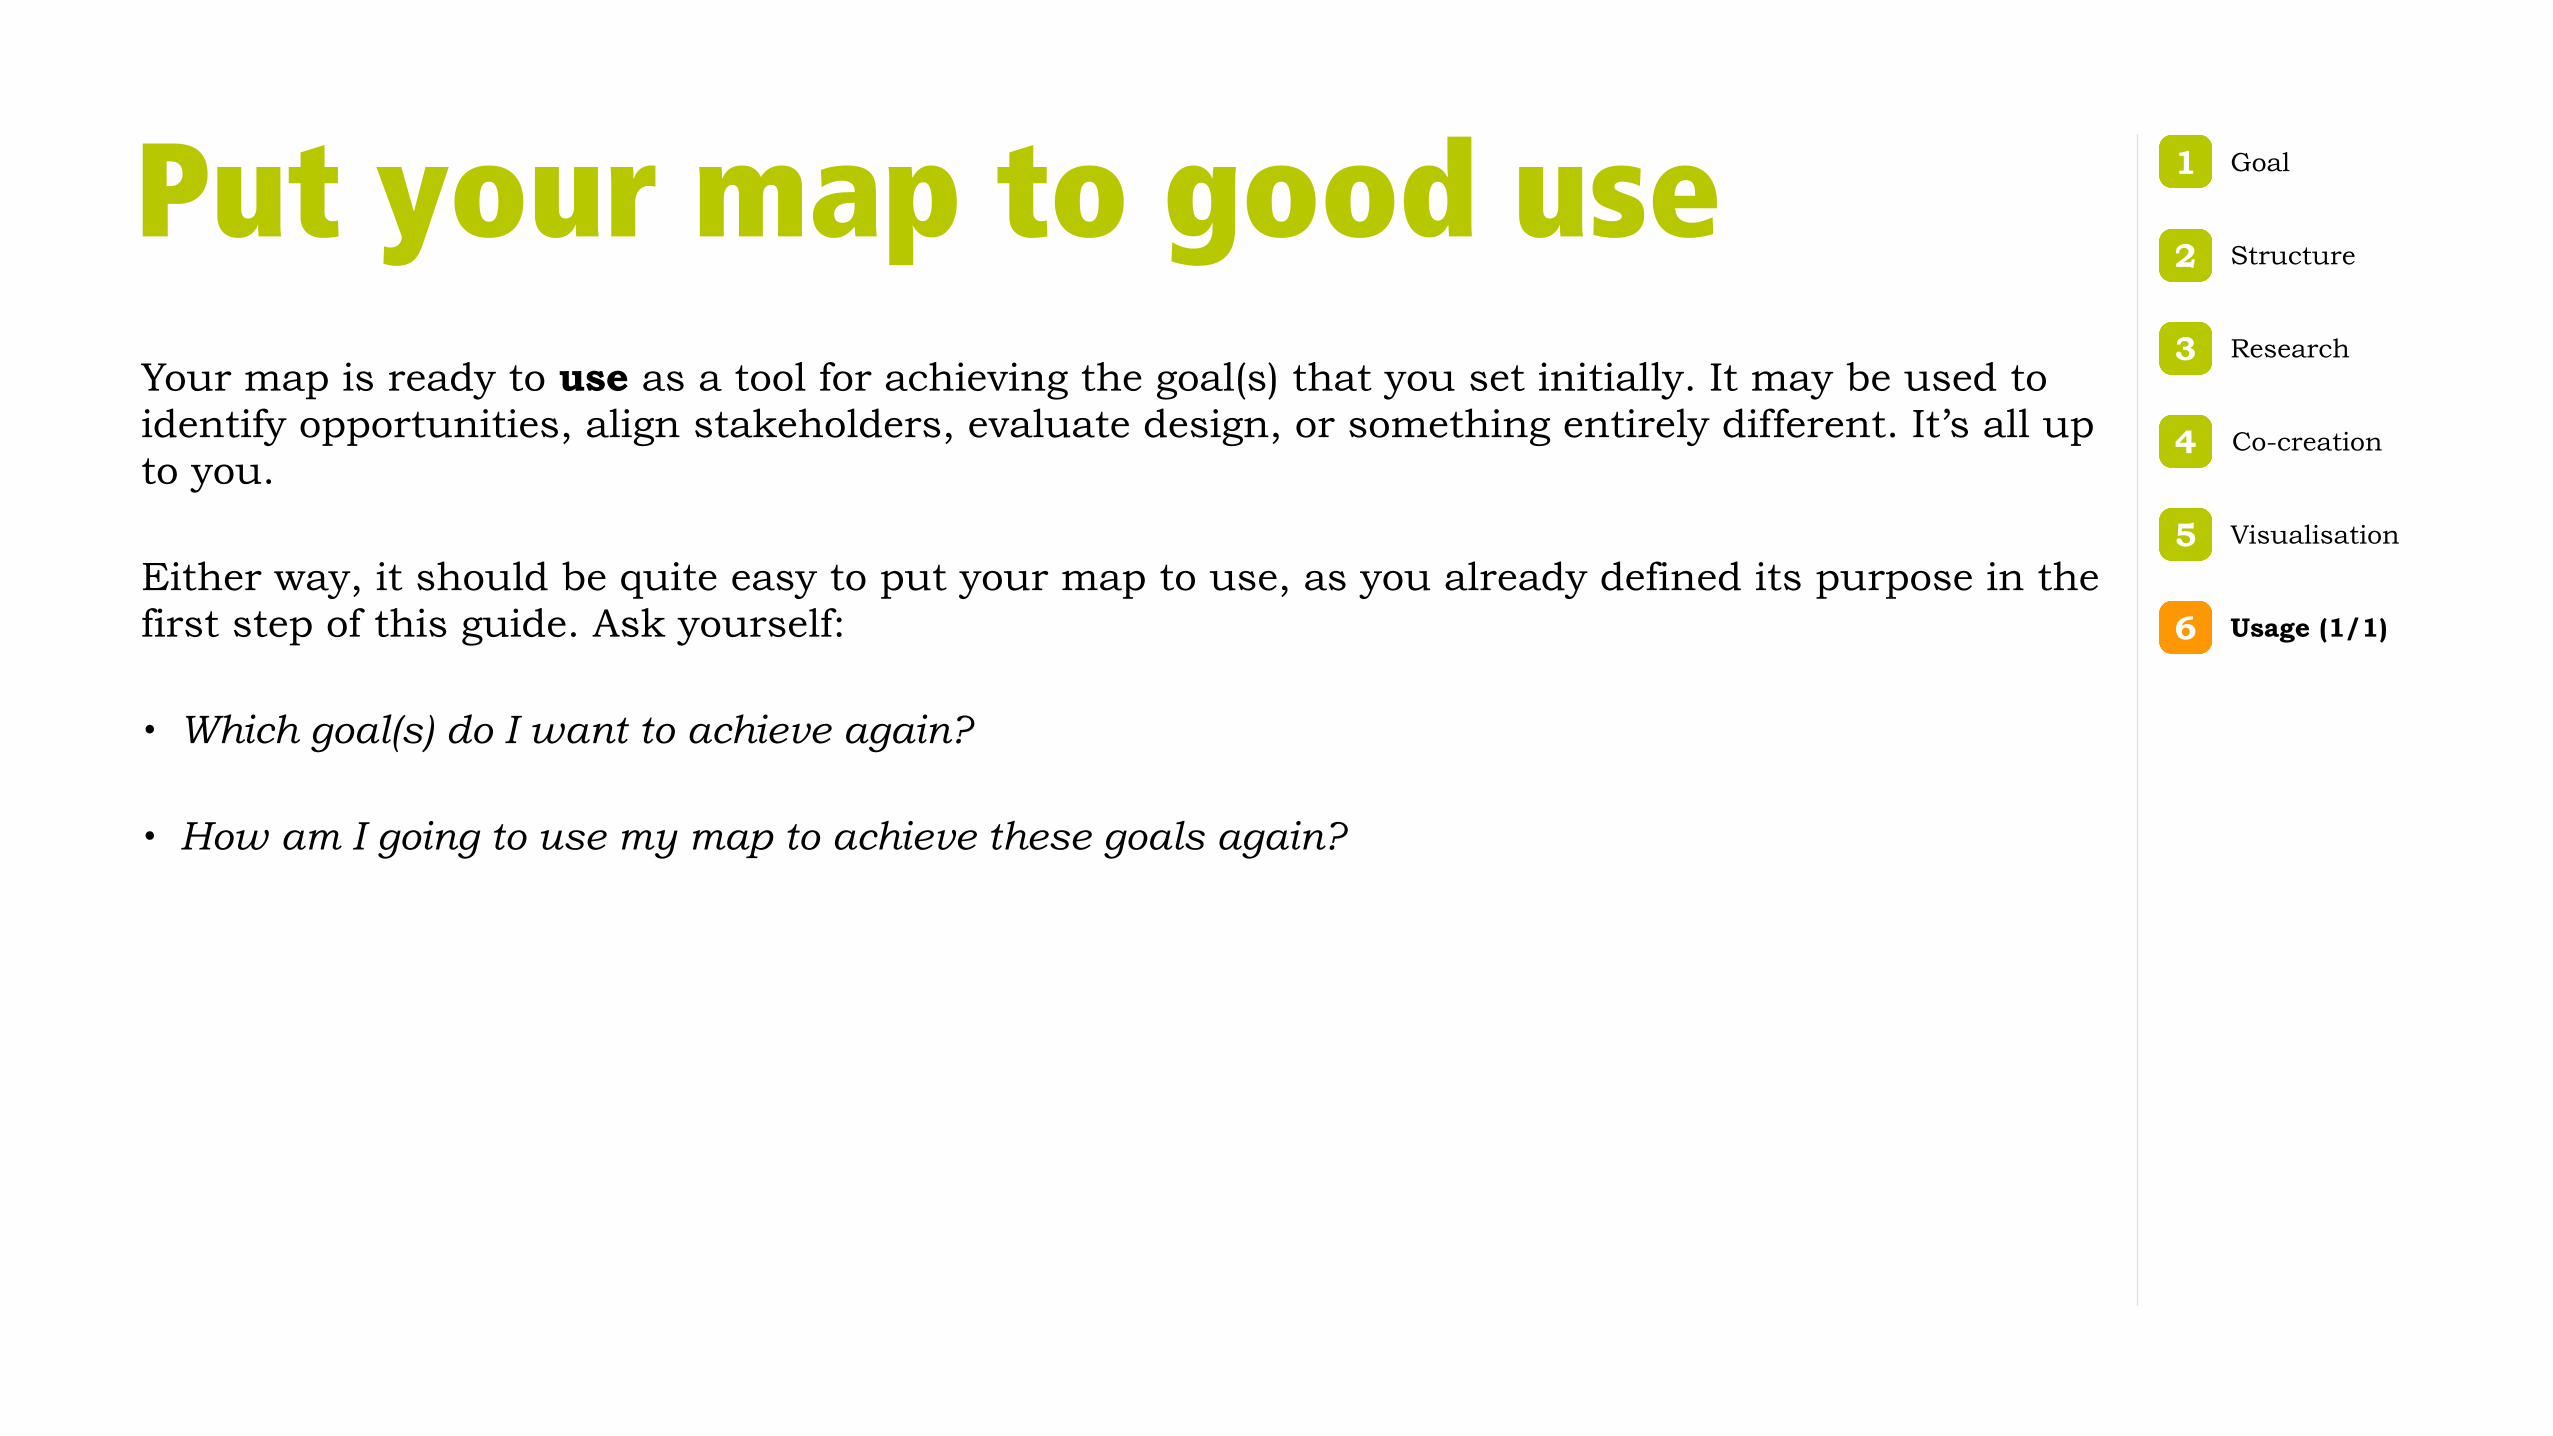
Put your map to good useYour map is ready to use as a tool for achieving the goal(s) that you set initially. It may be used to identify opportunities, align stakeholders, evaluate design, or something entirely different. It’s all up to you.
Either way, it should be quite easy to put your map to use, as you already defined its purpose in the first step of this guide. Ask yourself:
• Which goal(s) do I want to achieve again?
• How am I going to use my map to achieve these goals again?
Goal1
Structure2
Research3
Co-creation4
Visualisation5
Usage (1/1)6
That’s all, folks! These where all the steps. I promise.
Now, get out there and show them what your maps are made of :)
Oh, by the way. The next slides contain a bunch of detailed descriptions
of possible goals and dimensions. Use them well.
Happy mapping!
Goals
Goal #1: Understand the customer Experience Maps can be used to get to know or empathise with a customer, and the context in which this customer lives.
Consider using an Experience Map not as part of the delivery for your client, but just as a means to understand the service experience of the customer.
Back to overview
Goal #2: Compare customers Customer come in all shapes and sizes. Experience Maps can be used to compare different types of customers with each other.
One possible way is as follows. First, identify the central value proposition that appeals to each customer type. This gives you the baseline journey. Second, identify in this baseline journey the moments that have a unique value proposition to each customer type. These are the key moments where something extra can be offered to a certain type of customer. The resulting Experience Maps are then easy to compare with each other.
Back to overview
Goal #3: Emphasise the customer’s importance Due to the central focus on the customer in Experience Maps, using it may encourage your client to consider the customer’s needs, feelings and questions. The is especially true if the Experience Map is based on a persona.
Also, a common by-product of co-creating is that client often realises that the journey before or after the service is important as well.
Back to overview
Goal #4: Facilitate discussion/brainstorming Experience Maps can be used as a basis for discussion or brainstorming with your client, as it provides all stakeholders with a comprehensive and visual overview of the service.
Back to overview
Goal #5: Align understanding with the client Through the process of co-creation, a shared awareness and understanding starts to develop between you and the client.
You may gain insight in the client’s business in a playful manner, while your client gains insight in the (often surprising!) customer perspective.
Back to overview
Goal #6: Map the current customer experience One possible purpose of an Experience Map is to visually represent the current situation of the customer experience. This is a descriptive Experience Map.
After creating such a map, it can be used to identify opportunities for improvement (see next goal).
Important to keep into account is that the current situation is always subject to change. Not only will new insights emerge during the project, also throughout the years the needs and behaviours of customers and organisations will change due to technology, economy, etc.
Back to overview
Goal #7: Identify opportunities and priorities The visual overview of the customer’s experience that an Experience Map provides, can help to identify the opportunities where the experience can be enhanced. Some common opportunities are:
• Customer pain points (a ‘trough’ in the experience).
• Recurring problems.
• Inconsistent service quality throughout the customer journey.
• Service inefficiencies that might be removed.
• A lack of focus on before or after the customer journey.
• Possibilities for measuring and using contextual data to anticipate customers’ needs.
Back to overview
Goal #8: Map the ideal customer experience Creating an ideal Experience Map, in which all opportunities for enhancing the customer experience have been integrated, is a good basis to start communicating and actualising these opportunities. Basically, it is a vision of the service to the customer that the client wants (or at least should) provide.
When creating this map, always start with the current (descriptive) Experience Map before creating the ideal map. This is to avoid coming to an ideal service that is disconnected from reality.
Also, be mindful to clearly distinguish between the current information and the ideal information, to avoid confusions.
Back to overview
Goal #9: Evaluate design during a project Experience Maps can used to evaluate designs during a project. By having the map on the wall during the design process, you and your colleagues will have a clear reference point on which to base your design.
Moreover, it will be easy to check where your sketch, wireframe or concept design is located in the customer journey, and if it actually is in line with the customer’s goals and needs.
Back to overview
Goal #10: Manage customers’ expectations Experience Maps can be used as a tool to communicate to customers what their upcoming experience will be like. By showing the map to them, they will gain insights in what they can expect from the service.
Moreover, they can be informed about all the processes behind the scenes, which can be a way to gain more understanding from customers.
Back to overview
Dimensions
Dimension #1: Channels • Point of view: Customer
• Definition: A medium that the customer uses to interact with the service provider.
• Examples: physical store, mobile, web, etc.
Note: channels define the opportunities and constraints for the touch points, of which there can be multiple per channel.
Back to overview
Dimension #2: Customer actions • Point of view: Customer
• Definition: The steps that the customer takes to achieve his goals.
• Examples: choose flight, go to the bank, search for a hotel, etc.
Note: also referred to as ‘Doing’ in many Experience Maps.
Back to overview
Dimension #3: Customer emotions • Point of view: Customer
• Definition: What the customer feels, or wants to feel, during each step in the service experience.
• Possible ways of representations: words (e.g. frustrated, delighted, surprised), quantitative visualisations (e.g. scores, graphs, scales), quotes or icons.
Note: if the service results in positive emotions, it is likely that customers will want to repeat the experience.
Back to overview
Dimension #4: Customer goals • Point of view: Customer
• Definition: What the customer aims to achieve.
• Examples: reach my holiday destination, pay a fair price, get an answer to my question, etc.
Back to overview
Dimension #5: Customer needs • Point of view: Customer
• Definition: What the customer needs to achieve his goals.
• Examples: efficiency, social contact, reassurance, etc.
Back to overview
Dimension #6: Doing, Thinking & Feeling • Point of view: Customer
• Definition: A useful combination of dimensions that refers to the key behaviour (doing), the evaluations and expectations (thinking), and the emotions (feeling) of customers.
Back to overview
Dimension #7: Touch points• Point of view: Customer
• Definition: When and how the customer interacts with the service provider to fulfil a specific need.
• Examples: smartphone, desktop, search engine, etc.
Back to overview
Dimension #8: Answers• Point of view: Client
• Definition: How the needs of the customer are answered in the current service, or could be answered in an ideal service.
• Examples: provide reassurance, clear overview of offers, efficient process, etc.
Back to overview
Dimension #9: Back-stage processes• Point of view: Client
• Definition: The necessary processes of the service provider that are hidden from the customer.
• Examples: back-office, content management system (CMS), operations management, etc.
Back to overview
Dimension #10: Brand promises• Point of view: Client
• Definition: How and when the brand promises to the customer, made by the client, are met during the lifecycle of the service.
• Examples: be genuine, inspire optimism, bring people together, etc.
Back to overview
Dimension #11: Business goals• Point of view: Client
• Definition: What the client aims to achieve.
• Examples: improve customer service, increase conversion, reduce costs, etc.
Note: Key Performance Indicators (KPIs) may be used on the map to show how the client has been doing so far with reaching their goals.
Back to overview
Dimension #12: Business needs• Point of view: Client
• Definition: What the client needs to achieve his goals.
• Examples: funding, data analytics, alignment meetings, etc.
Back to overview
Dimension #13: Content• Point of view: Client
• Definition: What the client needs to achieve his goals.
• Examples: navigation, confirmations, instructions, etc.
Back to overview
Dimension #14: System• Point of view: Client
• Definition: The content, requirements and functionalities of the systems that are needed to provide the service to the customer.
• Example: content management system (CMS)
Back to overview
Dimension #15: Benchmarks• Point of view: You
• Definition: The content, requirements and functionalities of the systems that are needed to provide the service to the customer.
• Example: competitors’ designs, inspiration from different fields, etc.
Back to overview
Dimension #16: Wireframes• Point of view: You
• Definition: Visual representations of the design structure of an interface.
Note: placing these wireframes on the map will make it easier to communicate the purpose of the particular screen in the overall service.
Back to overview
Dimension #17: Barriers• Point of view: General
• Definition: Any things that may stand in the way of enhancing the customer experience.
• Examples: insufficient technology available, stubbornness, low budget, etc.
Back to overview
Dimension #18: Conditions• Point of view: General
• Definition: The minimal requirements for allowing the service to take place.
• Examples: sufficient staffing, weather conditions, etc.
Back to overview
Dimension #19: Opportunities• Point of view: General
• Definition: Opportunities where the experience can be enhanced.
• Examples: customer pain points, recurring problems, using data to anticipate customer needs, etc.
Back to overview
Dimension #20: Questions• Point of view: General
• Definition: Any questions that arise during the service design.
Back to overview
Dimension #21: Resources• Point of view: General
• Definition: Any information, materials or people that are needed by customer, client or designer.
• Examples: developers, budget, books, etc.
Back to overview