guide to gis for public gardens · alliance for public gardens gis iii this guide to gis for public...
TRANSCRIPT

Guide to GIS for Public Gardens: Botanical Gardens, Zoos, and Parks

T A B L E O F C O N T E N T S
C H A P T E R O N E
What is GIS?
C H A P T E R T W O
GIS at Public Gardens
C H A P T E R T H R E E
Is GIS Right for Your Garden?
C H A P T E R F O U R
GIS Project Planning
C H A P T E R F I V E
Recruiting and Training Staff
C H A P T E R S I X
Building the GIS
C H A P T E R S E V E N
Data Collection
C H A P T E R E I G H T
Map Publishing
C H A P T E R N I N E
Disseminating Your Data
17
17
21
35
39
47
59
69


Alliance for Public Gardens GIS i
F O R E W O R D
About 380,000 species of land plants have been named (1, 2), with an estimated 75,000 more awaiting discovery and description. The great majority of them are poorly known, often from a few preserved collections only. Worldwide, scientists are confronted with an urgent need to identify, inventory, document, and understand the diversity of these plants, even as it disappears in the face of habitat destruction and global climate change.
At a time of enormous global change, with a record human population of more than seven billion people growing by 200,000 net per day to an estimated 9.5 billion (3) by mid-century and demand for consumption rising still more rapidly, biodiversity in nature is under immense pressure, and all available means of conserving plants, animals, fungi and microorganisms, together with their genetic diversity, must be applied as vigorously as possible. Museum collections (herbaria) are a critical reference tool for building a more complete knowledge of the plant world and documenting it. Despite their important role, such collections often remain undervalued and insufficiently supported to the point that they may actually be at risk.
The living collections of plants in botanical gardens and arboreta are also of great importance for research and conservation but they are under-utilized for these purposes, with their value often not fully appreciated. Part of the reason lies in the fact that such collections are not well indexed, so that it is often difficult to tell whether an individual species is being cultivated somewhere and how that material was gathered in the first place. Because the climate is changing so rapidly that the numbers of many species are decreasing in nature and may be difficult to cultivate even in gardens in the future, botanists are turning increasingly to seed banks, where seeds or vegetative material is held at low temperatures (sometimes cryopreserved at -173°C with liquid nitrogen), where they may survive for hundreds of years.
Similarly, the zoos and aquaria of the world hold a major fraction of the world’s approximately 50,000 species of vertebrate animals. Their collections, whether living or in museums, are generally better documented than those in botanical gardens, with information about zoo and aquarium holdings often online. The problem of recording data about these holdings in a retrievable form is analogous to that for plants, and the prospects for cryopreservation or analogous methods being successful far less than for plants at current levels of knowledge. The data problems of parks are similar to those of botanical gardens and zoos, with the methods outlined in this book applicable to recording and caring for their living collections of plants. Doing so implies the potential for collections of plants in parks too to play a role in conservation and research – the trick, again, is knowing where, exactly, specific plant species can be found.
For plants, the situation is better than for other groups of organisms, with as much as a third of the world’s species currently protected within botanical gardens and arboreta, and about 20% of known species (non-overlapping to a considerable extent with the holdings of living collections) represented in seed banks. More than 3,000 botanical gardens and arboreta, along with hundreds of zoos and aquaria, span the globe and, as part of their core scientific missions, curate

Guide to GISii
documented living collections used for research and education and collaborate with one another and different kinds of scientific institutions on research projects that cross institutional boundaries.
In addition to collection maps and inventories, botanical gardens and zoos also have a wealth of geospatial data, such as images, publications, key nomenclatural information, and links to museum specimens, closely associated with their living collections. Much of this data is currently tracked in paper files or as alphanumeric text in desktop-based database fields. Geographic information systems (GIS) can serve as an excellent tool for gathering, organizing, and sharing this scientific information and helping users find that data by linking it to particular specimens on “searchable” online collection maps and inventory lists.
As geospatial data for these disparate but richly documented collections is captured within a standard digital infrastructure and linked via existing bioinformatics portals, new research opportunities will emerge. Likewise, once the single garden boundary ceases to be a limitation, new cross-institutional “collective collections” will be easier to imagine, build, and manage. This is already the case for a number of groups of vertebrate animals, where the world zoo holdings are documented for particular groups of animals and the overall genetic diversity can be monitored and maintained as efficiently as possible.
Zoos and public gardens undertake conservation activities throughout the world. To illustrate this point, the most recent survey (2011) of 184 AZA-accredited zoos and aquariums reported participating in 1,719 conservation, research, and education projects in 97 countries or regions. Collectively, zoos and aquariums spent more than $160 million on conservation and research (4). Botanical gardens also have active worldwide research programs in biodiversity inventory, phylogenetic studies, seed banking, and critical in situ and ex situ plant conservation projects. GIS offers new opportunities to integrate geospatial information between field research projects and the ex situ living collections at zoos and botanical gardens. GIS maps can also be essential tools for geographic and taxonomic gap analysis of the botanical garden collection, helping curators identify and prioritize the most critical new specimens to acquire, as well as providing analytical tools— built upon worldwide range maps for native species— to evaluate top priority sites for field collecting expeditions and ultimately for different levels of conservation.
Integration of GIS across the scientific enterprise will have additional impacts. In addition to their critical scientific functions, botanical gardens, arboreta, and zoos are also beloved by the public as places of respite, beauty and education. Nearly 200 million Americans visit zoos and botanical gardens each year—more attendance than the NFL, NBA and Major League Baseball combined (5). Memberships at public gardens, zoos, and aquaria exceed 3.5 million households, with dues providing more than $100 million in financial support. Virtually every group imaginable is reached through garden and zoo education programs for families, seniors, teens, preschoolers, and special-needs audiences.
In view of these visits, it can be seen that botanical gardens and zoos play a key role in educating the general public about plants and animals and helping them to understand scientific issues of public importance. The impact of global climate change on the loss of biodiversity, for example, is important for us all to understand; the exhibits, educational displays and events held in these institutions are important both in raising awareness and deepening understanding of the changes involved and their meaning for us.
Investment in critical digital infrastructure, then, promises to impact all aspects of the educational potential of these institutions, delivering new tools for visual display of information to support compelling educational narratives that connect the local specimen with the global story and inspire audiences to take action on critical, urgent global issues.

Alliance for Public Gardens GIS iii
This Guide to GIS for Public Gardens: Botanical Gardens, Zoos, and Parks, along with related online training opportunities, will help the botanical garden and zoo curators who wish to use GIS to map their plant collections more efficiently and effectively, link critical museum and environmental data sets via a geospatial framework, improve national standards of specimen curation and collection care, and permit both small and large gardens and zoos to participate in national and international scientific initiatives, such as the Global Biodiversity Information Facility (GBIF) and the NSF’s Assembling the Tree of Life (AToL) Initiative.
This book aims to provide support at every step in the process of mapping your facility and collections with GIS. To help with strategic decision making, the Guide to GIS for Public Gardens: Botanical Gardens, Zoos, and Parks provides botanical garden directors and other garden administrators with a discussion of the costs and benefits of embarking on a GIS program for your garden and considers other mapping alternatives briefly to help directors, facility managers, and curators assess if GIS is right for your garden or zoo.
Most of the Guide to GIS for Public Gardens: Botanical Gardens, Zoos, and Parks is specifically aimed at curators and GIS project leaders who are ready to move forward to put a new system into place. Beginning at a very general level, the Guide provides staffing and training guidelines, advice on work flow, recommendations on how to find the right people to get the job done, as well as offering suggestions about recruiting and working with GIS professionals, community volunteers, and student interns.
Most importantly, the Guide is designed to be a straightforward manual focused on both the technical and non-technical issues behind building a GIS for your public garden. Within its chapters, the authors attempt to answer both basic and more advanced questions: What is the ArcGIS Public Garden Data Model? How can it be used as a framework to begin to map your facilities and collections? What methods can be used to collect data in the garden? How do you import plant location and other data into the GIS and process this data correctly to ensure accuracy?
The national team working on the ArcGIS Public Garden Data Model project and related data management projects and the authors of this Guide aim to develop the overall capacity of botanical gardens and zoos to contribute toward the conservation of plant and animal diversity worldwide. By providing those who manage ex situ collections with access to mapping tools at low cost, we hope to help your garden increase public awareness, understanding, and concern for plants and their conservation by telling vivid stories and sharing knowledge via maps and other visual tools. Whether the “story” you are telling is where the trees needing major tree service work are located, showing visitors what the native range of a truly special wild-collected plant in your collection looks like, or simply illustrating what is in the collection and where it is, maps can be a powerful communication tool for both visitors and for managers.
If you are considering GIS as a possibility, we hope that you will find this guide to be a help. Whether you are new to the field or already an advanced GIS specialist, we hope you will get involved with the Alliance for Public Gardens GIS (APGG), a network of public garden staff dedicated to making geographic information systems easier to use for living collection management. The Alliance hosts an active discussion group on LinkedIn (nearly 400 members in March 2013, and growing) that provides peer-to-peer advice to botanical garden and zoo staff as they map and manage their beautiful, complex, and scientifically important living collections.

Guide to GISiv
It is a joy and a privilege to work with the collections of plants and animals in botanical gardens and zoos, and a genuine treat to see the pleasure and knowledge that visitors and as well as the participants in the activities of these institutions gain from their experiences. Contemporary ways of organizing knowledge about organisms generally and about the particular collections held in individual institutions give us ways to deepen that experience and make it more meaningful. The children who are inspired by the world of nature today are the ones who will help to make the world of the future sustainable, a permanent home for the biological diversity, including the human diversity, that make this planet such a wonderful habitat for us all.
Dr. Peter H. RavenPresident EmeritusMissouri Botanical Garden
Mary BurkeDirector of Planning and CollectionsUC Davis Arboretum
Selected References
1. Brummitt, Neil, Steven P. Bachman, and Justin Moat. “Applications of the IUCN Red List: Towards a Global Barometer for Plant Diversity.” Endangered Species Research 6 (2008):127-135.
2. Farabee, M. J. “Biological Diversity: Nonvascular Plants and Nonseed Vascular Plants.” 2004. 29 Jun. 2011. http://www2.estrellamountain.edu/faculty/farabee/biobk/BioBookDiversity_5.html
3. Population Reference Bureau. “2010 World Population Data Sheet.” 2001. http://www.prb.org/pdf10/10wpds_eng.pdf
4. AZA. 2011. “Association of Zoos and Aquariums—2011 Annual Report: Conservation Science.” http://www.aza.org/uploadedFiles/Conservation/Commitments_and_Impacts/2011ARCS.pdf
5. AZA. 2008. “Association of Zoos and Aquariums—The Collective Impact of AZA-Accredited Zoos and Aquariums.” http://www.aza.org/AboutAZA/CollectiveImpact1/index.html

Alliance for Public Gardens GIS v
P R E F A C E
Public garden staff who are considering using a GIS (geographic information system) for collec-tion management have often been stymied by the lack of training specific to their situation. Formal GIS training and certification programs are available through community colleges and universities. The many classes offered via the Esri online campus lead new users through a series of software suites, menu choices, toolbars, and palettes and explain how each is used to perform general mapping and data handling functions. However, no overview course has been available to explain how GIS is best applied for collection management at public gardens. (Note: the term “public garden” is used throughout this document to include botanical gardens, arboreta, display gar-dens, parks, historical landscapes, zoos, and theme parks.) This Guide to GIS for Public Gardens: Botanical Gardens, Zoos, and Parks is the result of a project that has brought together experi-enced GIS users from public gardens across the country to develop critically needed training and decision-making materials. This national collaboration, led by the UC Davis Arboretum, has made extraordinary progress and developed strong national and international support over the past several years. The project has produced:
• A shared, scalable GIS data model for public gardens, the ArcGIS Public Garden Data Model, a spatial database template for mapping plants, landscape features, and facilities and infrastructure.
• Free Esri software, free training and technical support, and free registration at the annual Esri User’s Conference for every zoo and botanical garden in North America for three years, under the terms of a Memorandum of Understanding between Esri, the maker of ArcGIS software, and the American Public Gardens Association (APGA).
• Online training resources on the Alliance for Public Gardens GIS Website:
Guide to GIS for Public Gardens: Designed for the curator, educator, facilities manager or other professional staff, this Guide provides an overview of how to decide if GIS is right for you and how to launch a new GIS project.
Training Videoss: A seven-part video course teaches you how to create a GIS at your own pace using the ArcGIS Public Garden Data Model.
Capacity Building Resources
o Presentation materials for curators who have been asked to present GIS to their Director or Board of Trustees, including an Microsoft PowerPoint presentation, a brochure and a white paper that make the case for GIS in public gardens.
o A white paper with suggestions about how to recruit GIS professionals as volun-teers at your garden.

Guide to GISvi
o A training curriculum for community volunteers and student interns, along with recruitment flyers.
• An online social network: The Alliance for Public Gardens GIS LinkedIn Group, with nearly 400 members, provides peer advice and suggestions for people using GIS to help manage public gardens.
This Guide is organized as both a practical instruction manual for building a GIS for your garden and as a guide that can help you think through some of the bigger issues. Some chapters address fundamental questions about whether GIS is right for your garden, how it might be used in your public garden, and how you will deal with funding the initial GIS investment. Other chapters pres-ent an overview of the tasks required to implement a GIS, once the decision has been made.
Although it is impossible to address all the ways that a GIS can be used in a public garden, we have tried to address the core features that most gardens will need to tackle: how to set up your maps initially, how to collect data using GPS or other mapping methods, how to import that field-collected data into the GIS, validate it, and produce useful lists, reports, and maps.
We hope that this Guide will help our public garden colleagues who are contemplating or currently working with GIS as they map their collections and facilities.
Mary BurkeMia IngoliaBrian MorganBarry Nickel

Alliance for Public Gardens GIS 1
C H A P T E R O N E
What is GIS?A geographic information system, or GIS, is an integrated system of computer hardware, software, data and trained personnel for analyzing and displaying all forms of geographically referenced information. GIS can also be thought of as a method to visualize data from a variety of sources in ways that reveal relationships, patterns, and trends. By combining the query and statistical analy-sis capabilities of a database with the visualization and geographic analysis benefits of maps, GIS helps to answer questions and solve problems by presenting your data in a way that is quickly understood and easily shared. Software is an integral part of a GIS, Global Positioning System (GPS) technology may be used to capture data for a GIS, and maps may be an output from a GIS, but none of these things by themselves is a GIS. In this chapter we will discuss what can be done with GIS, who uses it, and the benefits it provides.
What Can GIS Do?
GIS is an incredibly powerful platform that has been shown to have applications to nearly any industry or field of study. While a complete account of all of the things that GIS can do is beyond the scope of this publication, a summary of its major functions is presented here.
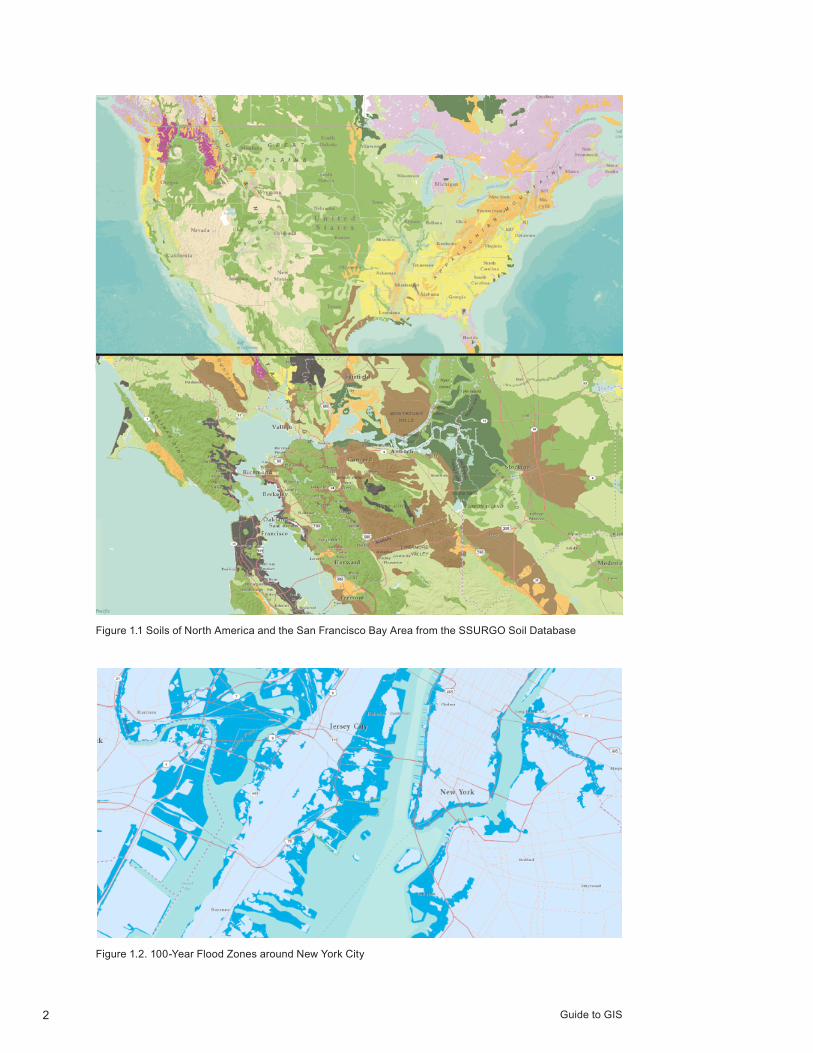
MAP-MAKINGOne of the most apparent functions of a GIS is its use as a tool for cartography, and since the inception of GIS in the 1960’s, map-making has been an integral part of it. GIS allows you to map where things are by creating a continuous and scale-free database of geographic data such as soil types of North America as shown in Figure 1.1 or average annual precipitation of the world. With this database you can then create a limitless number of maps that can be centered on any location, at any scale, and showing information of interest with various symbols that highlight specific characteristics.
In addition to this essential functionality, GIS can also be used to map quantities to find places that meet certain criteria. For example, public health officials might want to map the number of physi-cians per person in each census tract to identify areas that are not adequately served. In a similar fashion, GIS can also be used to map density by normalizing the data by area. In our physician example, if we just looked at the number of physicians per census tract, the larger tracts might have more physicians than the smaller ones, but some smaller tracts might have more physicians per square kilometer, thus a higher density.
Guide to GIS2
Figure 1.1 Soils of North America and the San Francisco Bay Area from the SSURGO Soil Database
Figure 1.2. 100-Year Flood Zones around New York City

Alliance for Public Gardens GIS 3
DECISION MAKINGAlthough GIS is unrivaled in its ability to make maps, its true power lies in its ability to query, ana-lyze, and report on data in support of the decision-making process. GIS can be used to monitor what is happening and to take action by querying what is inside or near a specific area, such as applying stiffer penalties to drug-related arrestees within 1,000 meters of a school. It can also be used to quantify events and plan for the future by analyzing distributions and summarizing data with statistics, such as determining high-risk flood zones based on the locations, frequency, and severity of past flooding, as shown in Figure 1.2. GIS can even be used to assess change and evaluate the results of an action by reporting on the mathmatecal differences between data from points in time, such as the number of businesses in an urban area in the years following major zoning changes.
ORGANIZATIONAL INTEGRATIONWhen multiple departments within an organization adopt the map and decision-making capabili-ties of GIS, data sets can be linked together by geography to facilitate interdepartmental informa-tion-sharing and communication as illustrated in Figure 1.3. Shared data can be collected once and used many times, and one department can benefit from the work of another. As communica-tion increases, redundancy is reduced, productivity is enhanced, and overall organizational effi-ciency is improved. For example, a utility company could integrate the customer and infrastructure databases so that when there is planned maintenance; affected customers can be easily deter-mined and notified. In addition, the utility company could attach photos, schematics, and as-built drawings to their infrastructure data, further increasing the efficiency of the system.
Figure 1.3. GIS for the Entire Organization

Guide to GIS4
Who Uses GIS?
It is estimated that approximately 80% of all data has a spatial component, and can therefore be used in a GIS. This has led to the adoption of GIS in industries as diverse as banking and wildlife conservation. An overview of how GIS is used in these different industries is presented here.
BUSINESSAll types of businesses can benefit from using GIS technology to support marketing, optimizing business openings and closings, segmenting consumer data, and managing fleets. Banks use GIS to enhance their understanding of risk, customer interaction, and economic conditions using models based on geography and demographics. Similarly, retail companies use it to improve the effectiveness and efficiency of operations by determining the right amount of goods and services to bring at the best time and price to meet market demand. Delivery service companies use GIS to ensure that fleet movement and maintenance schedules run efficiently using route analysis and real-time asset tracking.
GOVERNMENTGovernments of all sizes use GIS to analyze complex situations and create solutions across disciplines. GIS helps them increase efficiency, reduce costs, improve coordination, and deliver transparency and accountability. Local governments use GIS for planning and managing public works projects, analyzing election data, managing land assessment, and much more. Emergency managers use it for optimizing 911 dispatches, preparing for and responding to disasters, and for crime and investigative analysis for law enforcement. Transportation professionals use GIS for managing, planning, evaluating, and maintaining transportation systems by modeling travel demand, identifying noise regulation violations, and even planning scenic byways in recreational areas.
Figure 1.4. Biodiversity Hotspots in the United States

Alliance for Public Gardens GIS 5
EDUCATION & SCIENCEGIS provides scientists with tools to develop a greater understanding of our world and helps edu-cators prepare students to meet the demands of the modern workforce. Researchers from over 100 different academic disciplines that range from anthropology to zoology use GIS as an analyti-cal tool to understand the spatial patterns of ancient cultures and distributions of animal species. Educators in both K-12 and higher education include GIS in their curricula to help students gain valuable background knowledge and skills with which to face global challenges. GIS is even used by school administrators to help with facilities management, vehicle routing, district boundary mapping, and safety preparedness.
ENVIRONMENT & CONSERVATIONGIS is a tool that manages, analyzes, and models data from our environment so that we can make decisions based on that information to better conserve its resources and protect its biodiversity. GIS is used for our oceans to assist with exploration, ecosystem monitoring and management, predicting climate change, and even in optimizing and protecting the environment from energy ex-ploration. GIS is used for our land to investigate habitat encroachment and loss, model the impact of events like fires and droughts, monitor invasive species, and determine biodiversity hotspots as shown in Figure 1.4. With the assistance of GIS in understanding of our world’s species and natural processes, we can make well informed conservation decisions and take action.
NATURAL RESOURCESNatural resource managers rely on the analytical power of GIS to help make critical decisions about how to manage our limited resources responsibly. Foresters use GIS to help balance the needs of forests, society, and the pressures of economic efficiency. Mining companies use GIS to understand surficial and sub-surface geology to help operate mines responsibly and at optimum efficiency. Petroleum companies use GIS to decide where to drill a well, route a pipeline, build a refinery, and even reclaim a site. In all of these industries, GIS is used to help assure regulatory compliance, determine maintenance activities, and oversee daily operations.
UTILITIESGIS provides utility and telecommunications companies with a common platform to access busi-ness data, manage assets, update network information, integrate work orders, find customer infor-mation, and prepare reports. It is used for power management, electricity distribution, gas distribu-tion, television, internet and voice telecommunications, and water management. The companies responsible for these utility networks use GIS to help automate their workforces, plan and analyze their systems, ensure regulatory compliance, and respond to outages.
Benefits of GIS
GIS is being adopted by organizations of all sizes in almost every industry as they realize the economic and strategic value of GIS. The many benefits of using GIS are nearly beyond count, but a summary of the top five are presented here.
COST SAVINGS & INCREASED EFFICIENCYGIS is widely used to optimize maintenance schedules and daily fleet movements. Typical imple-mentations can result in a savings of 10 to 30 percent in operational expenses through reductions in fuel use and staff time, improved customer service, and more efficient scheduling as shown in Figure 1.5.
BETTER DECISION MAKINGGIS is the go-to technology for making better decisions about location. Common examples include real estate site selection, route and corridor selection, evacuation planning, conservation, and natural resource extraction. Making correct decisions about location is critical to the success of

Guide to GIS6
an organization. By integrating disparate data sources into one geodatabase, all of the pieces of information required to make an informed decision can be analyzed at the same time.
IMPROVED COMMUNICATIONGIS-based maps and visualizations greatly assist in understanding situations and in storytelling. They are a type of language that improves communication between different teams, departments, disciplines, professional fields, organizations, and the public. Databases are difficult to interpret, but a map can be worth a thousand words.
BETTER RECORDKEEPINGMany organizations have a primary responsibility of maintaining authoritative records about the status and change of geography. GIS provides a strong framework for managing these types of records with full transaction support and reporting tools.
MANAGING GEOGRAPHICALLYGIS is becoming essential to understanding what is happening, and what will happen in geograph-ic space. Instead of managing information in tabular databases, GIS allows us to visualize data in a map format and see relationships based on where things are. What was once a list of records can now be managed in a map showing the locations of each record along with all of the informa-tion it contains. Once we understand, we can prescribe action. This new approach to manage-ment, called managing geographically, is transforming the way that organizations operate.
Selected References
1. Clarke, Keith C. (2010). Getting Started with Geographic Information Systems (5 ed.): Prentice Hall Upper Saddle River.
2. Wade, Tasha, & Sommer, Shelly. (2006). A to Z GIS, An illustrated dictionary of geo-graphic information systems. Redlands, CA: ESRI Press.
3. Esri. (2013). What it GIS? Redlands, CA: Esri.
Figure 1.5. City of Woodland, CA Refines Water Crew Dispatch

Alliance for Public Gardens GIS 7
C H A P T E R T W O
GIS at Public Gardens The public garden community is comprised of botanical gardens, arboreta, display gardens, his-toric landscapes, zoos, and for-profit attractions that exist with a common mission to exhibit living collections, educate visitors, conserve biodiversity, and perform scientific research. In addition to this mission, a public garden must have a system for maintaining plant records, professional staff to do so, and must be open to the public. Since the establishment of the world’s first botanical gar-den in the 16th century, maps of the garden layout and the locations of plants within it have been important to garden staff, visitors, and researchers as shown in Figure 2.1. As mapping systems have evolved from pen and paper to CAD and now to GIS, the uses of garden maps have also changed and expanded from their traditional role in locating plants in the garden. Today public gardens use mapping systems for curating their living collections, tracking research, managing their facilities and landscapes, designing and planning their grounds, educating and orienting their visitors, and even fundraising and donor stewardship.
Living Collection
Public gardens maintain intensively documented plant collections. Many of the plants in these living collections have been grown from seeds, cuttings, and other propagules that have been wild-collected in field expeditions; some of the taxa protected in these collections are extremely rare in cultivation.
However, despite the intrinsic value of these special plants, a collection’s value to science is exactly proportional to the information it can provide to others. Plants need to be properly identi-fied and plants names tracked with few or no errors. If a specimen cannot be located on the site, or if no one knows that the garden holds that plant, or if details about a specimen’s identification or provenance are obscured by poor record-keeping, the plant is not useful to researchers.
Thus, documentation plays a central role in curating living collections. Information maintained by public gardens includes digital or paper maps to inventory and manage their living collec-tions, source histories such as provenance information for wild-collected plants, herbarium and image vouchers of accessioned plants to validate identity, detailed maintenance records, and other data related to programmatic use and inventory control. Curators struggle with a sometimes overwhelming burden of managing the complex information management needs of a living plant collection, often with inadequate funding. Because of inefficient work flows across the garden and error-filled data, the work load can be staggering for this typically small team.

Guide to GIS8
Because of the complexity of managing scientific names and other accession (“passport”) infor-mation, the curatorial staff at public gardens are often the first to request an investment in GIS from garden leadership. The adoption of GIS can help gardens to standardize work flows and save staff time across all departments.
In addition to reducing redundant data entry as well as errors in nomenclature and accession tracking, GIS can provide searchable Web-based digital collection maps, a fundamental tool that provides an at-a-glance inventory to help the curator track all the work that must be done to conserve or care for a particular plant or collection. For example, tree canopy work can be tracked within GIS, along with projected cost and priority ratings as sown in Figure 2.2.
With well-designed reports and maps produced by a GIS, curators can discuss alternatives and make decisions based on accurate collection inventories, summaries, and quick analyses of the current status of the collection and critical work pending. With GIS, maps can be produced on demand for special projects that other teams in education or planning are undertaking to help an-swer questions such as: where are the most critical specimens in this area? Why are they impor-tant? Will this proposed site change have an adverse effect on any critical specimens? Analytical GIS tools can help curators understand and address gaps in their own collection, as well as plan and manage multi-institutional collections such as those affiliated with the North American Plant Collections Consortium (NAPCC).
GIS can be used to track the many other planning documents and analyses that curators develop and archive, including wildlife plans and population surveys, natural reserve vegetation maps and management protocols, special studies such as cultural histories, horticultural and other conservation assessments, and overall museum-wide assessments of visitor services or educa-tional signage. In a shared GIS, information about the living collection is easily integrated with the base map (topography, structures, pathways, etc.) and facilities information (utilities, construction projects, work orders, etc.), helping the curator communicate and collaborate across departmental lines.
Figure 2.1. Map of the Botanical Garden of the University of Padua from 1591

Alliance for Public Gardens GIS 9
Figure 2.2. Distribution of Trees in Very Poor Condition at the UC Davis Arboretum
Living Collection Research
Like collections housed within other scientific museums, living plant collections are vital to biologi-cal research. For obvious logistical and financial reasons, researchers do not always have easy access to the plant material required for their work. In public gardens, the ex situ living plant col-lections collected from sites around the world are made accessible to scientists. Research ranging from molecular and genomic studies of phylogeny to plant physiology to climate change and ecol-ogy depends on access to these living specimens.
The primary literature in the sciences is replete with examples of studies that could not have been conducted without the use of living plant collections. For example, at UC Davis, researchers in evolution and ecology collected extensively from diverse plant taxa available in the UC Davis Arboretum to develop mathematical models to determine rates of evolutionary change based on differences in DNA sequences between species (1). At the Montgomery Botanical Center and the Arnold Arboretum of Harvard University alone, nearly 500 scientists accessed their living collec-tions for research purposes over a five-year period. During the same period, original research using these two gardens’ living collections appeared in over 100 articles published in the primary literature. These metrics are underestimates of actual use and impact, particularly in this modern molecular and database era. Searches in databases such as GenBank yield volumes of frequent-ly-used sequence data that can be traced back to accessions grown at these two institutions.
GIS, then, is a tool that is well suited to help connect biodiversity researchers with the plants main-tained by public gardens. These researchers may be interested in conducting research on speci-mens already in collections, partnering with gardens to develop or enhance ex situ collections
Guide to GIS10
for conservation work, or collaborating on research questions that would benefit from a shared venture between field researchers studying in situ populations together with inquiries based on ex situ collections.
However, it is still difficult for scientists to find and explore the living collections maintained by public gardens online. A shared geospatial framework for exchanging data would go a long way to-ward helping connect the valuable plants protected within living collections with the wider research community.
GIS can also be used to share the stories of the many research efforts already underway at public gardens, and inspire new research that makes use of these valuable but sometimes underused ex situ collections. In addition, curators can integrate research management with collections manage-ment. By using GIS as a central file system, curators can track which plant specimens have been used by researchers. Published journal articles, scientific reports, and other academic work based on the collections, along with required federal, state and local permits and approvals, researcher contact information, projected timelines, and any other details that curators track about research in the collection, can be linked to individual specimens or to entire collections, easing the task of retrieving and reporting on this information when it is needed.
When integrated with curatorial tools that automate data transfer, GIS can help curators upload garden inventory data to international indices of scientific materials held in public collections. Currently, it can be difficult for research scientists to discover what specimens are held within the walls of public gardens. As gardens provide more information to biodiversity clearinghouses, like GBIF, Botanic Gardens Conservation International (BGCI), and PlantCollections, these valuable research collections become more discoverable online.
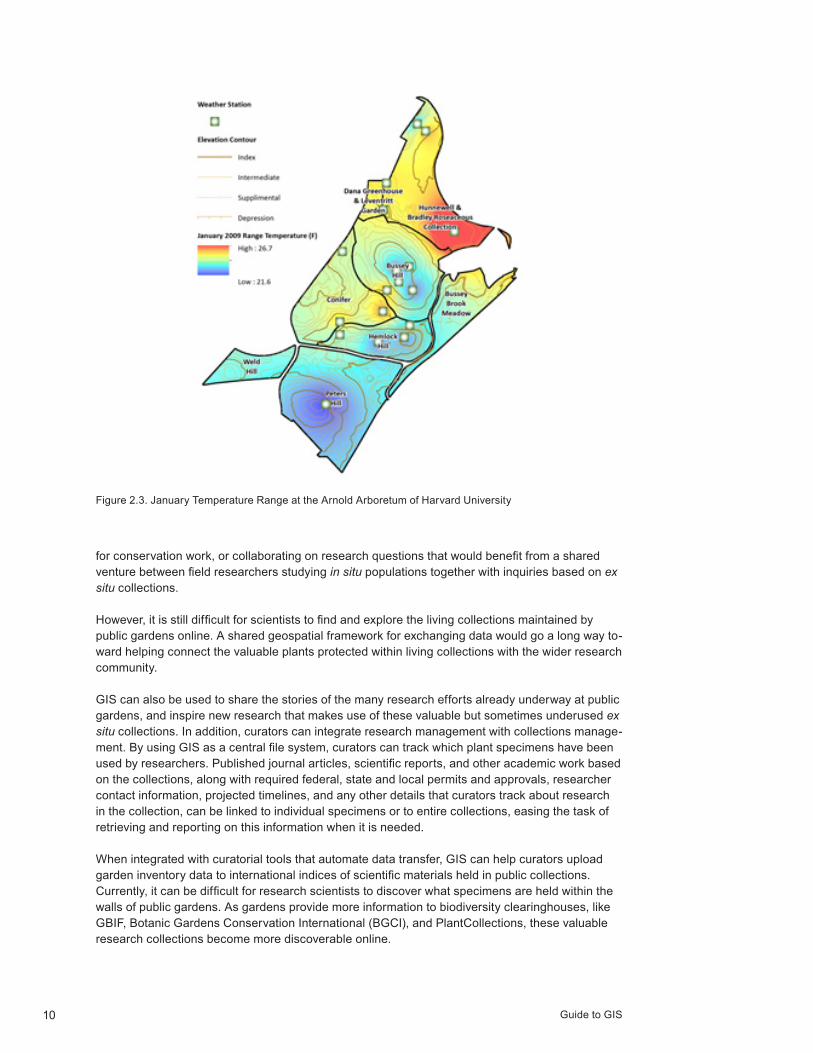
Figure 2.3. January Temperature Range at the Arnold Arboretum of Harvard University

Alliance for Public Gardens GIS 11
Integration of GIS tools allows researchers to access available range maps for plant species of special concern. This allows them to focus future collecting efforts to help ensure the survival of species that are at risk of disappearing as a result of climate change as well as other forms of anthropogenic disturbance.
As temperatures, rainfall patterns, and other climate factors shift, GIS climate data in the public domain can be overlaid on site maps of existing plant collections so garden curators can adapt care and management regimes to protect the plants in their collection as shown in Figure 2.3. This newly synthesized data set will help curators focus urgent discussions with professionals in other gardens about how they might most effectively use cross-institutional partnerships to conserve as much regional and global biodiversity as possible.
Facilities and Landscape Management
Facilities managers at public gardens use GIS for maintenance scheduling, work tracking, and emergency management, and to track in a single system all the information they maintain about the current condition of structures, irrigation and water systems, roads, paths, utilities, benches, drinking fountains, and restrooms. The compelling advantages of using GIS to manage facilities and infrastructure often drive the initial adoption because it is an operational area that quickly shows a return on investment. For example, at the San Diego Zoo Safari Park, the cost savings that resulted from more effective management practices returned the initial investment in GIS within less than five years.
Money is saved and costs are avoided when facilities managers can see at a glance the status of the maintenance and new construction work already underway, as well as the work planned for the near horizon. A work order system is often integrated with GIS, increasing the efficiency and productivity of the maintenance and repair staff. The maintenance department can detect trends
Figure 2.4. Facilities & Infrastructure at the Arnold Arboretum of Harvard University
Guide to GIS12
related to service requests, equipment management, graffiti removal requests, road and sidewalk pavement repairs and resurfacing, and asset inventories. A GIS facilities management module can track the age of buildings and other key utilities, like power and water, and allow managers to schedule maintenance in a timely manner as shown in Figure 2.4. Online maps shared via the GIS can be a helpful way to explain maintenance priorities and schedules.
Potential safety risks are easily highlighted on maps and tied to costs estimates; with prioritized work plans in place, management teams can be efficiently scheduled to reduce risks to visitors in cost-effective ways. Many gardens host thousands of people in a single day; as major public event spaces, they are required to have emergency management plans in place. GIS simplifies the plan-ning for major emergencies, including ways to move visitors to safe locations and routes into and out of the facility for regional emergency medical and fire teams. During the California wildfires of 2007, nearly 200,000 acres were ablaze around the San Diego Zoo Safari Park. Thanks to com-munication during the GIS planning process, when fire teams were dispatched to save the park, responding firefighters had the zoo’s GIS maps already on the screens in their trucks and could see at a glance where all hazardous materials were stored, where the fire refuges for the various animals were, and the recommended fire response routes into the 1,800-acre facility.
GIS can also be an invaluable tool for environmental management: for example, managers of storm water and storm sewer systems can use GIS to track water quality, detect and eliminate illegal discharge, and devise systems to better understand and then properly control storm water runoff. A network of smart sensors can be integrated with GIS to help track evapotranspiration, rainfall, and temperatures to inform proper settings for irrigation systems, as well as sound levels, air quality, and other environmental metrics that can be informative for managers of public spaces.
Communication and collaboration improve across the entire garden as outdated maps, reports, estimates, and lists once scattered across projects and departments are consolidated into a GIS. Errors are clearly identified as the information is aggregated and can easily be corrected. Historical information never before mapped and known only by long-term staff can be captured, included, and shared with everyone. If a GIS system is put in place to reduce costs and improve the efficiency of facilities management across the garden, the curatorial, educational, and other garden departments can benefit from the initial investments in GIS and create new layers of digital maps to track plant collections, visitor services, or to design and manage educational exhibits in the landscape.
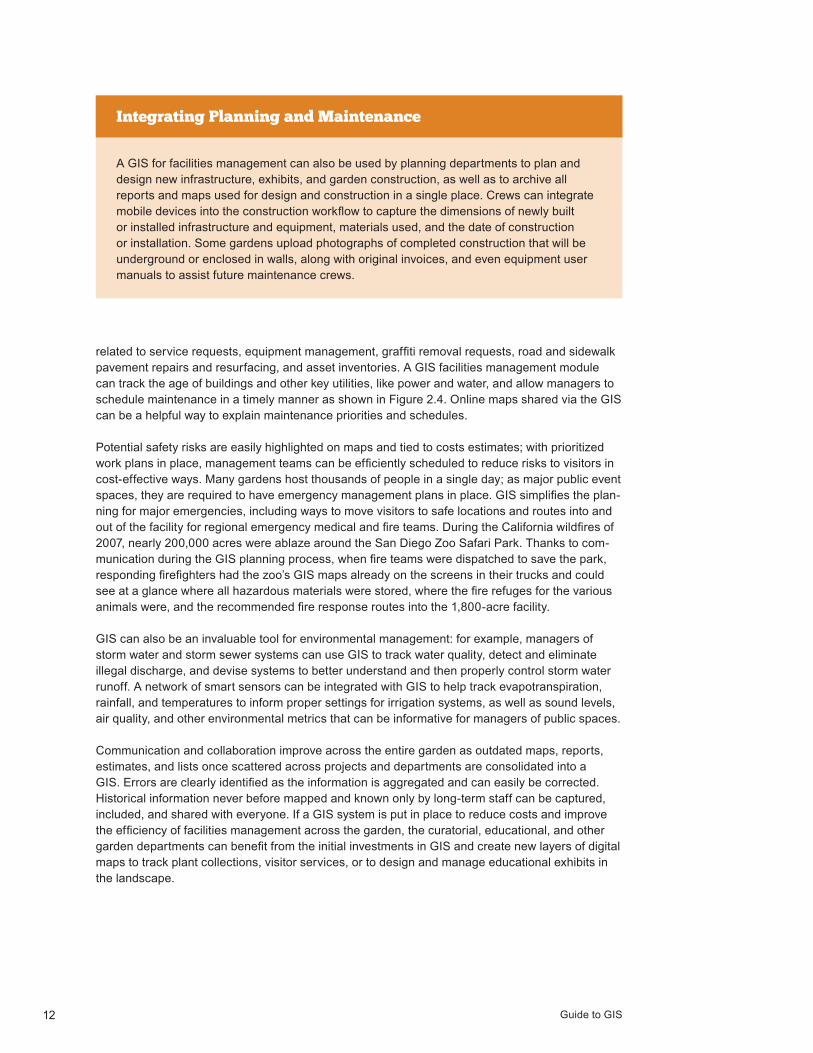
Integrating Planning and Maintenance
A GIS for facilities management can also be used by planning departments to plan and design new infrastructure, exhibits, and garden construction, as well as to archive all reports and maps used for design and construction in a single place. Crews can integrate mobile devices into the construction workflow to capture the dimensions of newly built or installed infrastructure and equipment, materials used, and the date of construction or installation. Some gardens upload photographs of completed construction that will be underground or enclosed in walls, along with original invoices, and even equipment user manuals to assist future maintenance crews.

Alliance for Public Gardens GIS 13
Planning and Design
Computer-aided design (CAD) software is widely used by landscape architecture firms: the drawing tools are excellent and final project plans can be readily transformed into construction documents and budget estimates, especially for smaller projects. However, when the scale of the project enlarges to that of a botanical garden, public park, urban greening corridor, or university campus, GIS is often integrated into the planning and design phase. Widely used by city and site planners, emergency services personnel, biologists, and civil engineers, GIS becomes an invalu-able tool for landscape architects, too. As GIS easily imports and exports CAD drawings, GIS is often integrated into the planning process for many landscape architects and designers.
Over the last ten years, thanks to major initiatives by federal, state, and local entities, the public and private information needed by planners and landscape architects such as site inventories (na-tive vegetation, wildlife habitat, cultural information, etc.), garden collection details (tree health and canopy cover, critical specimens, etc.), ownership and census information, boundaries, physical site analysis (soils, hydrology, slope and aspect, etc.), have been increasingly recorded as GIS layers in larger geodatabases maintained by cities, public utilities, public gardens, and universities. Many of these useful and freely available data sets, along with aerial photographs and topographic maps, can easily be added into the GIS for a particular public garden, and serve as base maps to manipulate and explore as planning begins, greatly reducing the startup costs for a large planning effort.
Most exhibit and garden design ideas begin with a careful understanding of the site and the pro-gram, including the educational goals of the exhibit, wayfinding and comfort needs of visitors, and equipment storage needs of the staff responsible for maintaining the garden once it is built. Alter-native concepts that fulfill all these competing needs are easily mocked up and explored using the highly fluid maps generated by the GIS. As layers are turned on or off, and features highlighted or hidden, flat areas can be easily identified along with shady and sunny exposures, natural water features, and sensitive cultural and biological areas. Thanks to GIS, what was once an over-whelming task of creating multiple maps to explore multiple alternatives and competing outcomes has become a more intuitive scenario planning process.
Figure 2.5. Geocaching in the Garden

Guide to GIS14
As a result of the transition to GIS, rather than static snapshots once every 10-20 years, public garden master plans are now living, flexible documents used to explore new alternatives as condi-tions and economic realities change. During the planning process, GIS can be used as an analyti-cal tool, to report on percent cover of an existing condition or to calculate distances, areas, and perimeters. Values can be assigned to critical areas for particular soil or native vegetation types and used to calculate ratings for suitability in order to compare one alternative to another. Cost estimates for the installation and maintenance for various alternatives can also be compared when stored within the GIS. Landscape architects can not only present colorful and beautiful renderings of creative designs that resolve multiple competing issues, but with the help of GIS are now able to provide clear metrics about project alternatives, and compare the costs and ecological, economic, functional, and scenic benefits of competing ideas.
Education and Interpretation
GIS can support the garden’s educational mission in many ways. Plant labels, range maps, and biological and conservation information shared with visitors all depend upon accurate curatorial records. Instituting GIS at a public garden drives data validation: errors in spelling, nomencla-ture, and geographic ranges stand out as the data is assembled in a single place and education programs are strengthened by these improvements. GIS goes a long way towards integrating the work of curators with the work of garden educators: plant lists, maps, photographs, publications, interpretive signs, audio and video podcasts, and links to online educational resources can all draw information from and in turn be stored in the geographic information system.
Shared games and family activities in the garden are powerful conduits for learning. Games help participants gather knowledge in a natural way and independently form connections and see potential relationships between discrete bits of knowledge, as they attempt to make guesses that will help solve puzzles. Games also encourage excitement, collaboration, and sharing among participants. Public gardens are natural places for location-aware games, and GIS can provide a platform for discovery and adventure games that families can play in the garden as shown in Figure 2.5.
A public garden setting also offers a wealth of opportunities for high school and college students to learn to use GIS or put their classroom learning into practice. In the 21st century, workers need more diverse skills than ever to compete in a global economy. Interns using GIS in all areas of garden operations can build valuable problem-solving skills, an understanding of scientific and mathematical principles, and a working knowledge of the technology that will help them transition into challenging and rewarding careers.
Fundraising and Donor Stewardship
Nearly all public gardens rely upon the generosity of their members and individual supporters for some or all of their funding. Getting to know members and donors, cultivating them through meaningful visits and garden experiences, and identifying new prospects are all critical parts of a fundraising strategy. Although rarely used in public garden fundraising, GIS has the potential to be a powerful tool to help the staff develop targeted approaches to this complex and time-consuming task.
GIS has long been used in the business community to discover and illustrate patterns, relation-ships, and trends. Commercial enterprises, and more recently, political action committees and universities, have discovered that they can combine the information they have in their files about current customers with sophisticated marketing data from third-party entities to generate lists and maps that can help identify and target likely new customers.
Alliance for Public Gardens GIS 15
For example, at Binghamton University (SUNY), the donation patterns and behaviors of alumni over a ten-year period were analyzed with GIS to create predictive models of alumni giving and inform a targeted strategy of outreach and fundraising that prioritized donor contacts and visits.
We are not aware of any public garden that has integrated GIS as a foundational tool of their fundraising strategy. This is not surprising since development staff and leadership typically excel because of their very strong people skills, not their technical skills. However, fundraising may be the operational area where the largest returns on investment could be realized. We await reports from the first public garden team that leaps into this new area of GIS use for gardens.
Conclusion
We understand that the scope of possibilities presented in this overview may be overwhelming; especially for a garden that is just considering GIS for the first time. It is worth remembering that GIS is a bit like a mechanic’s garage full of tools, benches, and equipment: for your own project, you will only need the few tools required to accomplish your own goals.
All GIS planning should be driven by the organization’s strategic direction. The purpose of any tool or technology, including geographic information systems, is simply to help the public garden staff meet important shared goals quickly, easily, and more affordably. The purpose of GIS in public gardens is to support and advance the mission of the garden.
Selected References
1. Magallon, S., & Sanderson, M. J. (2002). Relationships among seed plants inferred from highly conserved genes: sorting conflicting phylogenetic signals among ancient lineages. Am J Bot, 89(12), 1991-2006. doi: 10.3732/ajb.89.12.1991
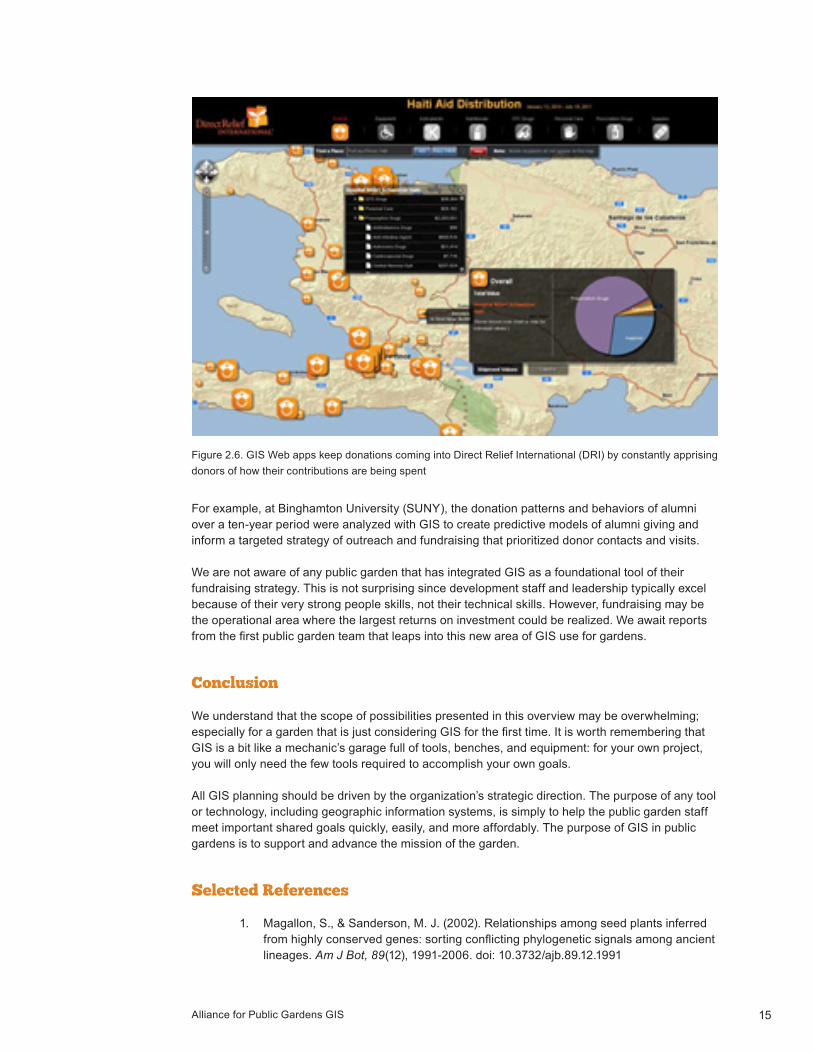
Figure 2.6. GIS Web apps keep donations coming into Direct Relief International (DRI) by constantly apprising donors of how their contributions are being spent

Guide to GIS16

Alliance for Public Gardens GIS 17
C H A P T E R T H R E E
Is GIS Right for Your Garden? “Place” turns out to be a great way of organizing information, especially for living research collec-tions which are housed not in cabinets or drawers, but on a physical site—a site that is embedded in a climatic zone, within a bioregion, and in a particular location. As collection records and other data sets are mapped, a single digital map can emerge as the central repository for all the data currently distributed in myriad databases, spreadsheets, documents, and file folders within differ-ent operational areas of the garden.
However, regardless of the benefits of GIS or any other mapping system, the demands of a pressing workload is a serious issue: although some large public gardens have more than 1,500 employees, more than half of the gardens in the United States have only one or two staff mem-bers. In more remote parts of the world, where some of the most important global conservation work is taking place, public garden staff may not even have access to reliable electricity every day. Clearly, when it comes to the “right” mapping tool, one size will not fit all.
Although our team has focused our own work in GIS, we recognize that a scalable approach to mapping is essential, so that both small and large gardens can “start where they are.” Public garden staff are encouraged to begin with the simplest software possible, using the least expen-sive tools that meet their institution’s immediate needs. Depending on purpose, funding, time, and expertise, many kinds of software can be used for these mapping and data linking tasks. Software for mapping living plant collections and linking them to accession information range from limited, but simple and appealing systems built upon Google Maps (PlantMapper, Atlantis Botanic Garden), and graphics software (Adobe Illustrator), to CAD-based systems (BG-Map, AutoCAD), to more complex open-source and commercial GIS software systems (GRASS, QGIS, ArcGIS). Each of these software tools is the right match for a particular need along a spectrum of mapping needs in public gardens. We encourage you to turn to experts in each of these software suites to help you learn more about these tools.
Why Did We Use GIS?
FOR SOME GARDENS AND ZOOS, GIS IS REQUIREDMany botanical gardens and zoos are part of larger organizations—for example, cities, municipali-ties, or campuses—that have already adopted Esri’s ArcGIS and allied products as their mapping software. For these institutions, use of Esri products is required to map the facilities and make the data available for other departments.
GIS HAS BECOME MORE AFFORDABLE AND EASIER TO USEThe recent Esri ArcGIS for Public Gardens donation program, the newly available ArcGIS Pub-lic Garden Data Model that provides a template for gardens just starting out, and many training opportunities from Esri and elsewhere have made it easier for gardens to adopt ArcGIS. ArcGIS Online is a new lightweight, cloud-based alternative that is attracting the attention of curators who do not have access to a technical team who can manage a GIS desktop or server for them.
Guide to GIS18
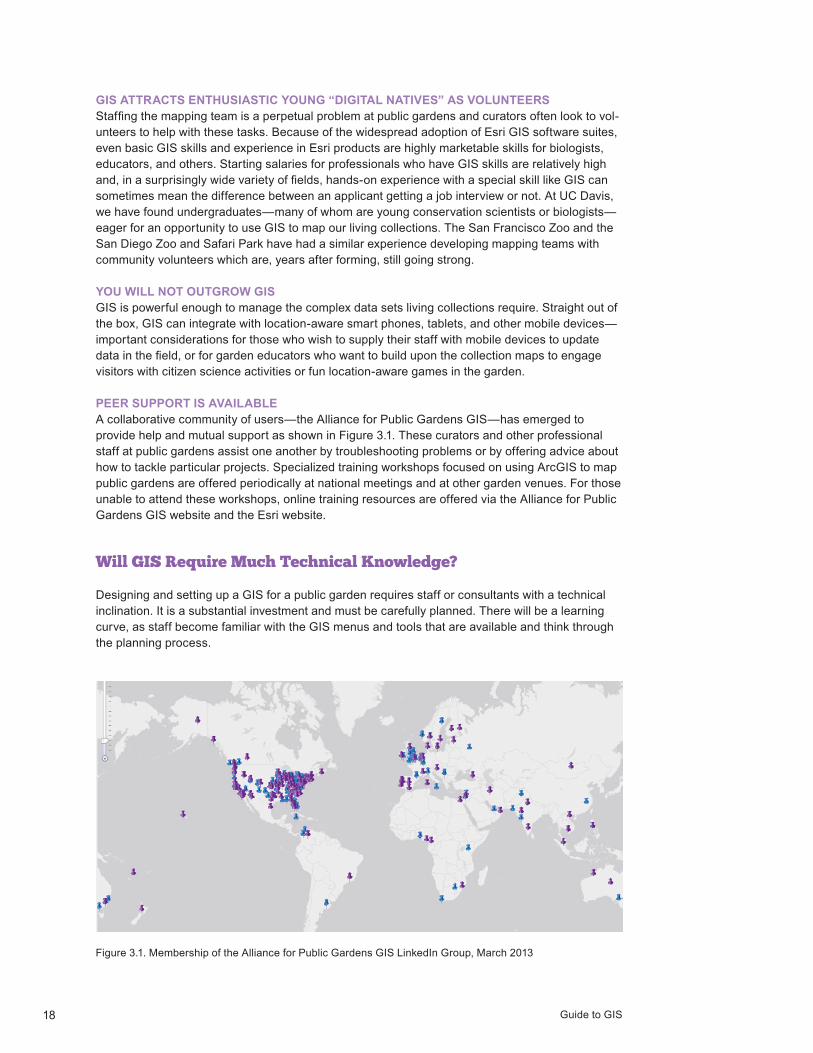
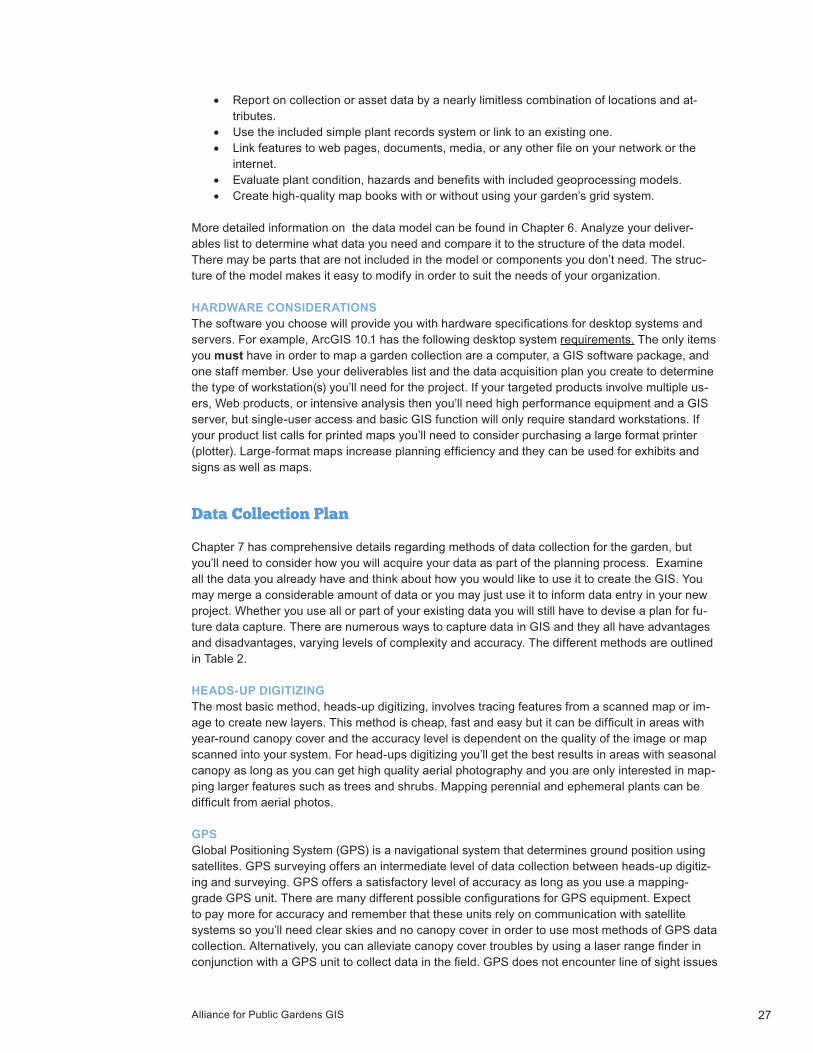
Figure 3.1. Membership of the Alliance for Public Gardens GIS LinkedIn Group, March 2013
GIS ATTRACTS ENTHUSIASTIC YOUNG “DIGITAL NATIVES” AS VOLUNTEERSStaffing the mapping team is a perpetual problem at public gardens and curators often look to vol-unteers to help with these tasks. Because of the widespread adoption of Esri GIS software suites, even basic GIS skills and experience in Esri products are highly marketable skills for biologists, educators, and others. Starting salaries for professionals who have GIS skills are relatively high and, in a surprisingly wide variety of fields, hands-on experience with a special skill like GIS can sometimes mean the difference between an applicant getting a job interview or not. At UC Davis, we have found undergraduates—many of whom are young conservation scientists or biologists— eager for an opportunity to use GIS to map our living collections. The San Francisco Zoo and the San Diego Zoo and Safari Park have had a similar experience developing mapping teams with community volunteers which are, years after forming, still going strong.
YOU WILL NOT OUTGROW GISGIS is powerful enough to manage the complex data sets living collections require. Straight out of the box, GIS can integrate with location-aware smart phones, tablets, and other mobile devices—important considerations for those who wish to supply their staff with mobile devices to update data in the field, or for garden educators who want to build upon the collection maps to engage visitors with citizen science activities or fun location-aware games in the garden.
PEER SUPPORT IS AVAILABLEA collaborative community of users—the Alliance for Public Gardens GIS—has emerged to provide help and mutual support as shown in Figure 3.1. These curators and other professional staff at public gardens assist one another by troubleshooting problems or by offering advice about how to tackle particular projects. Specialized training workshops focused on using ArcGIS to map public gardens are offered periodically at national meetings and at other garden venues. For those unable to attend these workshops, online training resources are offered via the Alliance for Public Gardens GIS website and the Esri website.
Will GIS Require Much Technical Knowledge?
Designing and setting up a GIS for a public garden requires staff or consultants with a technical inclination. It is a substantial investment and must be carefully planned. There will be a learning curve, as staff become familiar with the GIS menus and tools that are available and think through the planning process.

Alliance for Public Gardens GIS 19
Once the GIS is established, users with less technical expertise can learn the basics. As with all software, most people use only a few GIS tools for nearly all projects, and one can become adept at using those without becoming a high-end practitioner. Some people with a natural bent toward technical tools will become fascinated with GIS and all that it can do and may enthusiastically wish to learn more, but learning the fundamentals of GIS can be accomplished with some basic train-ing.
Is Now the Right Time?
Some basic requirements should be met to be successful with even a small GIS project. These questions will help you assess your readiness:
• Do you have stable electrical power? Not all remote public gardens and reserves do. If not, you can still come up with ways to use GIS periodically but you’ll need to do your project plan-ning carefully, or build your system on a mobile GIS platform.
• Do you have access to a (fast enough) internet connection?
• Do you have a network administrator or other technically adept person to work with? If so, involve them early.
• Most importantly, can you accommodate starting up a GIS in addition to your current projects and responsibilities? Weighing issues like time, money, and the pressure of competing proj-ects and responsibilities can save you a lot of trouble down the line.
If you cannot answer yes to all of the questions above, you may want to wait before embarking on a new journey that will require some learning, discovery, and start-up time. In the meantime, you can connect with a local GIS user group and learn more by seeing examples of work underway nearby, or connect with colleagues at the Alliance for Public Gardens GIS. A successful GIS is one that strengthens the entire organization by supporting the vision and goals of the garden and helps the staff do their work better, more easily, faster, and cheaper. GIS is widely used by the business community to improve efficiencies, aid planning and decision-making, enforce account-ability, and improve communication; it promises to have much the same impact in public gardens. Many of the work flows in public gardens are interrelated. Intelligent geographic information sys-tems can encapsulate the knowledge now dispersed throughout your organization, help you see patterns and trends, answer questions, and provide a foundation for good decision-making and planning across the entire enterprise.
Most geographic information systems are initially designed and implemented to serve a single, specific purpose at a garden—mapping the collection or the facility, for example. For example, cu-rators at smaller gardens are simply trying to answer two simple questions, with a high degree of accuracy, about plants in their collection: Where is it? What is it? Although costs can be consider-able, the benefits of using GIS to manage this single operational area are usually crystal clear: the living plant can be easily linked to accession information and to other botanical resources (her-baria, published journal articles, taxonomic and nomenclatural resources, etc.).
But, as has happened in many businesses, you may find that people in other departments—edu-cation, fundraising, exhibit and garden planning, event management— will begin to use the GIS to manage their own work. The initial investment in GIS design and training can be leveraged across the entire organization as the benefits of an enterprise GIS— a GIS designed to serve a wide range of audiences across many departments in your garden—become clear.

Guide to GIS20

Alliance for Public Gardens GIS 21
C H A P T E R F O U R
GIS Project PlanningA GIS can easily demonstrate its value and legitimize its place in your organization if it yields helpful products and creates efficient workflows. Better communication, well-informed decision-making, and effective collaborations should all be products of a successful GIS project. Sufficient planning will help avoid costly mistakes, save time, reduce redundancy, and provide assurance that the GIS meets your goals. A well-planned project will be delivered on time, within budget, and meet the expectations of your organization.
This chapter provides an overview of the steps involved in planning a GIS project, and issues and options you will need to take into consideration. The project plan you create using the guidelines in this chapter will serve as the roadmap to tell you where you’re going, how you’re going to get there, who and what you’ve got to work with, and when you are done.
When starting your project consider the following aspects of project design:
• Determining Your Objectives• System Design and Dataset Considerations• Data Collection Plan• Staffing Considerations• Getting Funding• Project Plan & Timeline
Determining Your Objectives
At the start of the planning process it is imperative to determine the needs of your organization and how GIS will help you meet your goals. Roger Tomlinson, the acknowledged “Father of GIS,” states “Knowing what you want to get out of your GIS is absolutely crucial to your ultimate suc-cess. Too often, organizations decide they want a GIS because they’ve heard great things from their peers in other organizations, or they just don’t want to get left behind technologically. So they invest considerable sums of money into technology, data, and personnel without knowing exactly what they need from the system. … When you try to develop a GIS without first seriously consid-ering the real purpose, you could find yourself with the wrong (expensive) technology and unmet needs.” (xiii)
A needs assessment can identify gaps in your current system and help to define your purpose. It is important to consider all the departments that will be impacted by the implementation of a GIS and to include key staff members from those areas when planning your project.

Guide to GIS22
Organize the key stakeholders into a steering committee to help answer questions and create your needs assessment. The committee should be comprised of leaders and managers in key opera-tional areas and experts from the areas you plan to incorporate. Including stakeholders in your planning process will ensure:
• that the GIS meets the needs of all staff and considers all areas of operations• a better acceptance of the project by creating trust• an understanding of the capabilities of the system.
When your committee meets, be prepared to outline your vision for the planning process. Analyze your organization’s strategic business plan beforehand to see how GIS fits into your mission state-ment and goals. Present your vision for the project and try to inspire people to see how GIS could work for them. Be prepared to demonstrate the abilities and functions of a GIS system and to educate participants about GIS and corresponding spatial terminology. Clearly define the role of each contributor on the committee and ask people to voice ideas, concerns, and criticisms. The purpose of your meeting(s) should be to establish your desired products, designating who will be responsible for the creation and maintenance of the system and products, and creating and final-izing the objectives of the project.
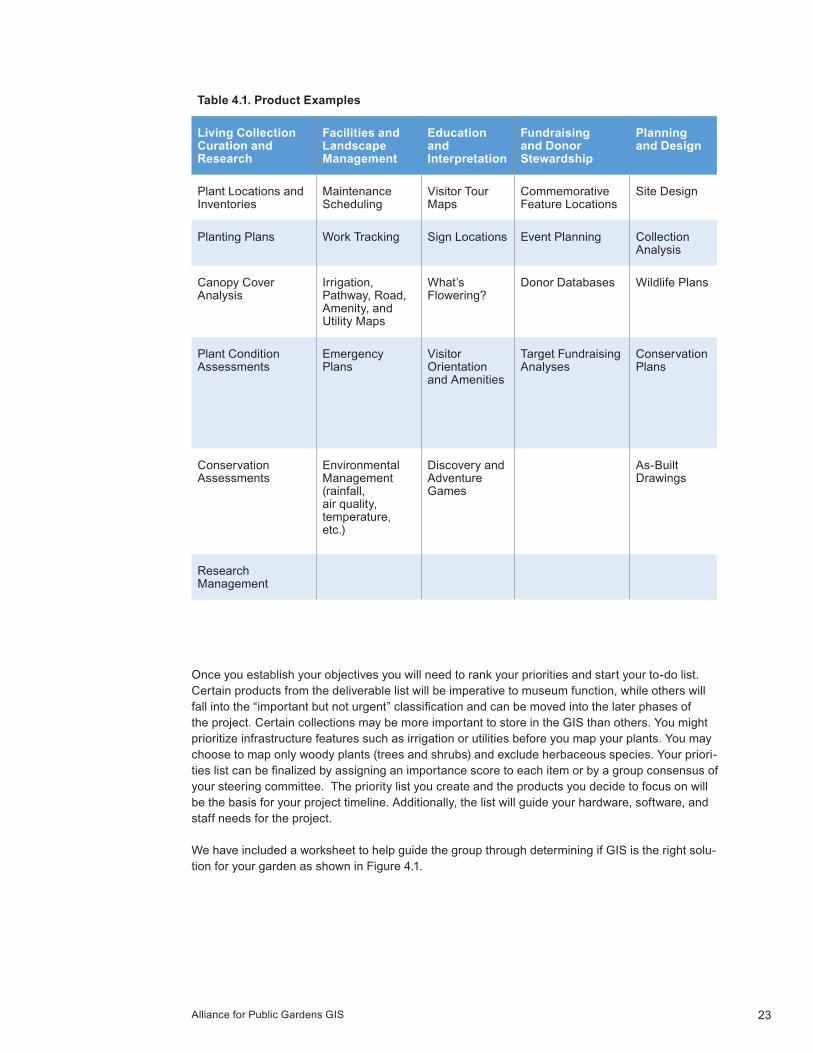
Considering how you want to use your data will aid your planning process and help to generate your project outline. Have people think about what products they use now in your current (legacy) system and if those products should instead be delivered by the GIS. Typical public garden products include plant inventories, planting plans, plant condition assessments, visitor tour maps, visitor amenity maps, utility and irrigation location information, and emergency plans as shown in Table 4.1. Brainstorm a list of products that you don’t have currently that could increase effi-ciency. It is important that you thoroughly educate your steering committee about the abilities and functions of GIS so that this portion of your meeting(s) is productive. Final products of your GIS may include quality paper maps and map books, digital “working” maps, Web maps, reports, and charts.
If your garden has been established for any length of time, you probably already have several products that you’ll want to replicate with GIS. A GIS’ greatest strength lies in its ability to tie mul-tiple facets (facilities, base map, amenity locations, plants, etc.) into one application that allows all users to access data from a central location. This means that you’ll be able to integrate informa-tion from different areas of your organization that were formerly independent, and you’ll have the ability to perform numerous types of analysis on that data.
Here are some questions to ask when evaluating your system to determine what you want to get out of your GIS:
• How do you currently document features in the garden? (plants, pathways, irrigation, planting beds, utilities, etc.)
• Why are you considering GIS, and how will it help?• What are the final products that you need?• Who is your audience?• What are your short, intermediate, and long-term goals for the system?
Alliance for Public Gardens GIS 23
Once you establish your objectives you will need to rank your priorities and start your to-do list. Certain products from the deliverable list will be imperative to museum function, while others will fall into the “important but not urgent” classification and can be moved into the later phases of the project. Certain collections may be more important to store in the GIS than others. You might prioritize infrastructure features such as irrigation or utilities before you map your plants. You may choose to map only woody plants (trees and shrubs) and exclude herbaceous species. Your priori-ties list can be finalized by assigning an importance score to each item or by a group consensus of your steering committee. The priority list you create and the products you decide to focus on will be the basis for your project timeline. Additionally, the list will guide your hardware, software, and staff needs for the project.
We have included a worksheet to help guide the group through determining if GIS is the right solu-tion for your garden as shown in Figure 4.1.
Table 4.1. Product Examples
Living Collection Curation and Research
Facilities and Landscape Management
Education and Interpretation
Fundraising and Donor Stewardship
Planning and Design
Plant Locations and Inventories
Maintenance Scheduling
Visitor Tour Maps
Commemorative Feature Locations
Site Design
Planting Plans Work Tracking Sign Locations Event Planning Collection Analysis
Canopy Cover Analysis
Irrigation, Pathway, Road, Amenity, and Utility Maps
What’s Flowering?
Donor Databases Wildlife Plans
Plant Condition Assessments
Emergency Plans
Visitor Orientation and Amenities
Target Fundraising Analyses
Conservation Plans
Conservation Assessments
Environmental Management (rainfall, air quality, temperature, etc.)
Discovery and Adventure Games
As-Built Drawings
Research Management

Guide to GIS24
Is GIS Right for You? Guided Worksheet
Before you invest time and money in purchasing the components of a GIS and training people to use it, be sure that it is right for your organization. Use this worksheet a guide to help determine if GIS would be a valuable tool for your garden.
What are the needs and goals of your organization?
How might GIS mapping help to achieve your organization’s needs and goals?
What spatial questions might you ask that GIS can help answer?
Do you currently have data stored via Excel, Access, Oracle, Filemaker, or any other type of spreadsheet or database? (describe)
What data will you need in order to deliver your desired products?
Boundary (garden sections, planting areas, etc.) Utilities Roads Signs (traffic, interpretive, plant labels, etc.)
Aerial Photography Structures Plant Information Amenities (bathrooms, trash cans, etc.)
Irrigation
Other Required Data:
Is this data feasible to obtain? If so, where and if not, why?
Do you have or can you obtain a computer with at least 2 GB RAM and a 2.2 GHz processor?
Are you willing and able to commit personnel and other resources towards training?
If you cannot commit the time and resources needed for staff for your GIS, do you have access to partners that can help deliver your GIS? (Student interns or volunteers)

Alliance for Public Gardens GIS 25
System Design and Dataset Considerations
Now that you’ve determined your deliverables, you’ll need to figure out the route you want to taketo provide your desired products. Look at your products and make a list of the data you’ll needto collect. Perhaps you are only interested in collecting base map (garden boundaries, pathways, etc), utility, and irrigation data or you might only want to capture the locations of trees in the gar-den and use aerial photography as your base map. The goal is to think critically about your project and what you’ll need to create the targeted products. Think about the volume of data you will need to store and how and where you’ll store it and remember that certain datasets will be larger than others. The simplest systems will only need approximately 20 GB (or less) of storage where as the most complex systems can use over 100 GB if they are utilizing ArcGIS server and storing numer-ous high-resolution aerial photographs. It is important to make data storage scalable because you’ll be continu- ing to add to the data as your garden changes and grows.
It’s likely that you already have data (accession records, existing maps, inventory lists, etc.) to incorporate into the GIS. Not all forms of plant records need to be stored in the GIS; examine the pros and cons of including each dataset. Although software and hardware may seem like a big in-vestment; data development, acquisition, and maintenance will far exceed any other costs of your project. This is why it is important to examine your current datasets, decide what you may or may not be missing, and devise a plan to efficiently convert the data into a usable GIS format. You may end up merging a large amount of data into the GIS from another digital form, or you might digitally scan in paper records, but it might end up being easier, cheaper, and more accurate to start from scratch and rebuild your database by performing a new inventory. In every instance your legacy system will still inform your GIS work. More information about GIS data collection can be found in Chapter 7 – Data Collection.
SOFTWARE CONSIDERATIONSOpen-Source GISOpen-source applications are free to the public and users have access to (and can therefore modify) the source code for the software. Typically, volunteer programmers create open-source software projects. GRASS, QGIS, and JUMP GIS are popular open-source GIS software pack-ages. Although open-source software does have a certain level of appeal, it tends to be difficult to work with and have limited features. We recommend that you take advantage of the free access to ArcGIS that Esri has offered to our community through the ArcGIS for Public Gardens donation program.
ArcGISArcGIS is the industry standard for geographic information systems and it is used by organizations and individuals to manipulate and study large data sets visually in order to grapple with increasing-ly complex social, economic, and environmental problems. ArcGIS is best suited to connect public gardens with the communities of biological scientists and conservation scientists they serve, as well as to the greater community in their local area.
Here are the main forces that are driving the use of ArcGIS in public gardens:
• Has over one million users worldwide• Used by government agencies and NGOs in over 200 countries• Used by 82% of the world’s cities (Dangermond, Nov. 2007)• Holds over 40% of the global market share for digital mapping/geographic information
systems• Widely adopted by federal, state, and regional governments in the United States, including:
Most US federal agencies and national mapping agencies All 50 US state health departments

Guide to GIS26
State, regional, and local governments Transportation agencies Public utilities
• Serves as the industry standard for mapping by most commercial and nonprofit enter-prises, including:
Forestry companies Schools and universities Many commercial business that use or analyze location information to conduct
business Many nonprofit organizationsthat work to make change across a broad range of
public health, environmental, political action, and human services fields• Scalability. Depending on the needs of the user, ArcGIS can be used in an online format,
single-user desktop format, or server format allowing multiple users concurrently.
System DesignWe recommend using the ArcGIS Public Garden Data Model as the starting point for your system design. The data model is an easily-adaptable, free and open-source template for implement-ing GIS projects at botanical gardens, zoos, and similar public landscapes.Designed for use with Esri’s ArcGIS software, it allows you to collect data, perform analyses, and create maps and reports in GIS without the need to completely design your own system. With the ArcGIS Public Garden Data Model you can:
• Start creating, importing, and collecting data quickly without the need to design your own GIS.
GIS on a MAC
GIS professionals typically use PCs because the most commonly-used GIS software package (ArcGIS) does not run natively on a Mac. Nevertheless, you still have several options for GIS if your organization uses Apple computers.
ArcGIS Online (ArcGIS.com)Online web mapping is a simple and easy way to use ArcGIS on either a Mac or a PC. It offers several appealing advantages over installing software locally on your workstation(s). Web maps can be opened in any browser, and Esri offers a gallery of free basemaps, basic measuring tools, and sharing (both public or within a specified group). You can search for and use data posted by community members or add your own data layers.
BootCampBootCamp runs on MacOS 10.4 and higher and allows the user to install the full version of Microsoft Windows on Mac computers by partitioning their hard drive. When the computer is started the user chooses to run MacOS or Windows. ArcGIS would have to be installed in the Windows partition.
Parallels Desktop for MacSimilar in concept to Bootcamp, Parallels also allows the user to install the full version of Windows on a Mac. It allows you to switch back forth between Windows and Mac applica-tions without having to restart your computer. Take into consideration that Parallels splits your computer’s memory between the two operating systems. Here again, ArcGIS needs to be installed on the Windows side of the computer.
Alliance for Public Gardens GIS 27
• Report on collection or asset data by a nearly limitless combination of locations and at-tributes.
• Use the included simple plant records system or link to an existing one.• Link features to web pages, documents, media, or any other file on your network or the
internet.• Evaluate plant condition, hazards and benefits with included geoprocessing models.• Create high-quality map books with or without using your garden’s grid system.
More detailed information on the data model can be found in Chapter 6. Analyze your deliver-ables list to determine what data you need and compare it to the structure of the data model. There may be parts that are not included in the model or components you don’t need. The struc-ture of the model makes it easy to modify in order to suit the needs of your organization.
HARDWARE CONSIDERATIONSThe software you choose will provide you with hardware specifications for desktop systems and servers. For example, ArcGIS 10.1 has the following desktop system requirements. The only items you must have in order to map a garden collection are a computer, a GIS software package, and one staff member. Use your deliverables list and the data acquisition plan you create to determine the type of workstation(s) you’ll need for the project. If your targeted products involve multiple us-ers, Web products, or intensive analysis then you’ll need high performance equipment and a GIS server, but single-user access and basic GIS function will only require standard workstations. If your product list calls for printed maps you’ll need to consider purchasing a large format printer (plotter). Large-format maps increase planning efficiency and they can be used for exhibits and signs as well as maps.
Data Collection Plan
Chapter 7 has comprehensive details regarding methods of data collection for the garden, but you’ll need to consider how you will acquire your data as part of the planning process. Examine all the data you already have and think about how you would like to use it to create the GIS. You may merge a considerable amount of data or you may just use it to inform data entry in your new project. Whether you use all or part of your existing data you will still have to devise a plan for fu-ture data capture. There are numerous ways to capture data in GIS and they all have advantages and disadvantages, varying levels of complexity and accuracy. The different methods are outlined in Table 2.
HEADS-UP DIGITIZINGThe most basic method, heads-up digitizing, involves tracing features from a scanned map or im-age to create new layers. This method is cheap, fast and easy but it can be difficult in areas with year-round canopy cover and the accuracy level is dependent on the quality of the image or map scanned into your system. For head-ups digitizing you’ll get the best results in areas with seasonal canopy as long as you can get high quality aerial photography and you are only interested in map-ping larger features such as trees and shrubs. Mapping perennial and ephemeral plants can be difficult from aerial photos.
GPSGlobal Positioning System (GPS) is a navigational system that determines ground position using satellites. GPS surveying offers an intermediate level of data collection between heads-up digitiz-ing and surveying. GPS offers a satisfactory level of accuracy as long as you use a mapping-grade GPS unit. There are many different possible configurations for GPS equipment. Expect to pay more for accuracy and remember that these units rely on communication with satellite systems so you’ll need clear skies and no canopy cover in order to use most methods of GPS data collection. Alternatively, you can alleviate canopy cover troubles by using a laser range finder in conjunction with a GPS unit to collect data in the field. GPS does not encounter line of sight issues

Guide to GIS28
that you might get with a total station and the equipment is much cheaper, but it is less accurate and still requires an investment.
TOTAL STATIONSophisticated and costly, a total station is a multi-purpose electronic surveying instrument capable of measuring horizontal distances, slope distances, vertical height differences, angles, and three-dimensional coordinates. This instrument combines the function of a transit, a level, and an electronic distance meter (EDM) to determine very accurate measurements of points on land. A total station can be used in thick canopy cover that would not be suitable for GPS measurements as long as line of sight is not an issue. Accuracy at this level does come with significant costs that might be out of reach for gardens with small budgets.
Staffing Considerations
The ultimate success of your project will depend on having a sufficient number of well-trained staff. Your GIS is dependent on the staff members that build, modify, and maintain it over time. It is important for each department affected by implementation to weigh in on staffing considerations. Having a GIS system is long-term operational cost that will need to be managed continuously into the future; the more complex your system, the more staff you will need to manage it. The size of your organization will help to determine the size and structure of your GIS staff; in a small gar-den, a single person may be able to take on the responsibilities that are carried out by numerous people in larger organizations.
You’ll want to designate a core group of GIS staff who will serve as the foundation to build and maintain your GIS and then determine who will be your end users. The end users will be affected by GIS implementation and often they will be the users of your GIS products, but they will not work in the system itself. Each staff position on the core team you build will have corresponding skill requirements. Your core group will be comprised of a GIS manager and one to many GIS analysts. After you determine your staffing needs for implementation and maintenance, you can evaluate the capabilities of existing staff and devise an appropriate training program or start planning to hire new staff members. Chapter 5 includes sample position descriptions for GIS staff and a discus-sion about using interns, volunteers, and consultants.
Funding Your GIS
Funding a GIS project can be a challenge, especially in the face of multiple competing needs. Although there is no single answer for every garden, there are some inventive ways to tackle this issue. The first and most common error curators make as they seek funding for GIS is to describe GIS, both to themselves and others, as a tool that will produce better and more accurate inven-tories of collections, exhibits, and gardens. Although this is decidedly true and a GIS will indeed yield immense benefits, describing the output of a GIS as better maps and lists is the narrowest possible view. This description completely fails to answer the truly important questions: Why are better maps and lists important? Who will they help?
Instead of better maps and lists, try to identify a real and understandable issue that is a compel-ling concern for science, or your public garden, or your city and region, and then embed GIS in the solution for addressing this issue. This somewhat unusual approach requires you to think beyond your immediate curatorial and garden management goals. It requires you to leave your desk and be proactive about finding new friends and partners within and beyond your garden who may share a wish to make your community a better place. You may discover that it will rarely work to present a complete project plan to a potential external project partner but, if you listen carefully and explore shared goals and possible problem-solving options together, then something amazing may result.
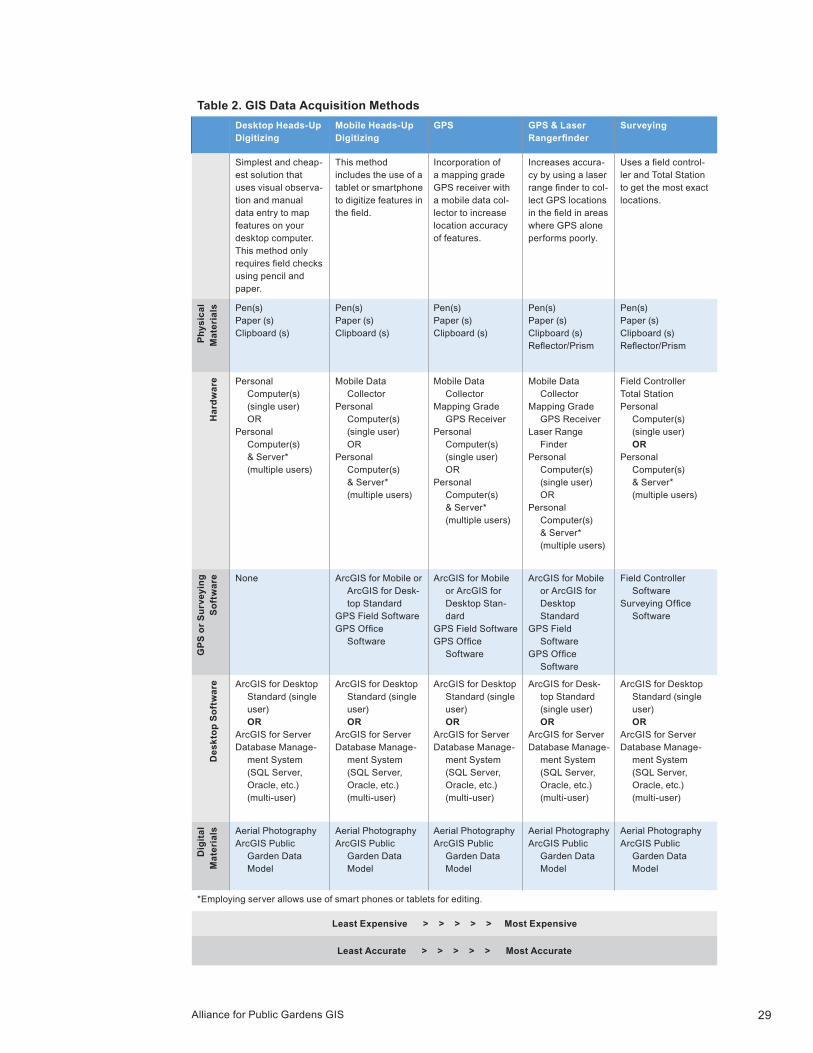
Alliance for Public Gardens GIS 29
Table 2. GIS Data Acquisition Methods Desktop Heads-Up
DigitizingMobile Heads-Up Digitizing
GPS GPS & Laser Rangerfinder
Surveying
Simplest and cheap-est solution that uses visual observa-tion and manual data entry to map features on your desktop computer. This method only requires field checks using pencil and paper.
This method includes the use of a tablet or smartphone to digitize features in the field.
Incorporation of a mapping grade GPS receiver with a mobile data col-lector to increase location accuracy of features.
Increases accura-cy by using a laser range finder to col-lect GPS locations in the field in areas where GPS alone performs poorly.
Uses a field control-ler and Total Station to get the most exact locations.
Phys
ical
M
ater
ials Pen(s)
Paper (s) Clipboard (s)
Pen(s) Paper (s) Clipboard (s)
Pen(s) Paper (s) Clipboard (s)
Pen(s) Paper (s) Clipboard (s)Reflector/Prism
Pen(s) Paper (s) Clipboard (s)Reflector/Prism
Har
dwar
e Personal Computer(s) (single user) OR
Personal Computer(s) & Server* (multiple users)
Mobile Data Collector
Personal Computer(s) (single user) OR
Personal Computer(s) & Server* (multiple users)
Mobile Data Collector
Mapping Grade GPS Receiver
Personal Computer(s) (single user) OR
Personal Computer(s) & Server* (multiple users)
Mobile Data Collector
Mapping Grade GPS Receiver
Laser Range Finder
Personal Computer(s) (single user) OR
Personal Computer(s) & Server* (multiple users)
Field ControllerTotal StationPersonal
Computer(s) (single user) OR
Personal Computer(s) & Server* (multiple users)
GPS
or S
urve
ying
So
ftw
are None ArcGIS for Mobile or
ArcGIS for Desk-top Standard
GPS Field SoftwareGPS Office
Software
ArcGIS for Mobile or ArcGIS for Desktop Stan-dard
GPS Field SoftwareGPS Office
Software
ArcGIS for Mobile or ArcGIS for Desktop Standard
GPS Field Software
GPS Office Software
Field Controller Software
Surveying Office Software
Des
ktop
Sof
twar
e ArcGIS for Desktop Standard (single user) OR
ArcGIS for ServerDatabase Manage-
ment System (SQL Server, Oracle, etc.) (multi-user)
ArcGIS for Desktop Standard (single user) OR
ArcGIS for ServerDatabase Manage-
ment System (SQL Server, Oracle, etc.) (multi-user)
ArcGIS for Desktop Standard (single user) OR
ArcGIS for ServerDatabase Manage-
ment System (SQL Server, Oracle, etc.) (multi-user)
ArcGIS for Desk-top Standard (single user) OR
ArcGIS for ServerDatabase Manage-
ment System (SQL Server, Oracle, etc.) (multi-user)
ArcGIS for Desktop Standard (single user) OR
ArcGIS for ServerDatabase Manage-
ment System (SQL Server, Oracle, etc.) (multi-user)
Dig
ital
Mat
eria
ls Aerial PhotographyArcGIS Public
Garden Data Model
Aerial PhotographyArcGIS Public
Garden Data Model
Aerial PhotographyArcGIS Public
Garden Data Model
Aerial PhotographyArcGIS Public
Garden Data Model
Aerial PhotographyArcGIS Public
Garden Data Model
*Employing server allows use of smart phones or tablets for editing.
Least Expensive > > > > > Most Expensive
Least Accurate > > > > > Most Accurate

Guide to GIS30
One of the most challenging issues is simply getting the funds for the equipment you need: com-puters, monitors, servers, GPS equipment, etc. However, if this technical equipment is used to create maps that are used for truly important or interesting projects, funding may be available from sources such as major donors, local corporations, foundations, or state and federal agencies.
Several imaginary scenarios explain this project-based approach. Imagine seeking funding for these proposals:
• Songbirds are in a state of rapid decline in urban areas across the United States. The plant collections at botanical gardens and zoos are often a refuge for relatively large populations of resident and migrating songbirds but little is known about their population size, the timing of the local migrations, and how they use the canopy of the garden’s trees and shrubs. A project is proposed to use GIS to map the tree collections at the botanical garden and, working in partnership with local bird biologists and nonprofit organizations that focus on birds, organize a volunteer effort to track the bird use at our garden. The findings of this citizen science project will be integrated with the work of local wildlife biologist at these universities and federal agencies. All data collected for this project will be shared with the Cornell Lab of Ornithology. The following digital and paper tour guides (with maps produced by GIS) will be produced for our garden’s educational exhibits …
• In the dry southwestern regions of the United States, wildfire is a constant concern for land managers. Our public garden is set in the middle of a large expense of native veg-etation that burns at a natural interval of every 15-20 years. In mid-summer, at the height of the fire season, our garden hosts many visitors and state and federal laws require a plan to manage these large crowds in the case of an emergency. We are proposing to map our facility with GIS and integrate these maps with the regional Fire Service GIS systems…
• STEM education is a national priority for elementary and high school students. A com-munity-centered GIS effort integrates science training with real world problem solving skills. Our team is proposing a partnership with science educators, K-12 science teach-ers, and GIS professionals working for the City Planning Department as advisors, to build a community mapping effort that will allow local students to participate in efforts to solve environmental and social problems at the city and regional level.
It’s important to be realistic: this approach will not get your entire facility or collection mapped in a single go. However, by focusing on a series of interesting projects, you will be able to fund the computers and mobile equipment you need and establish the foundation of a healthy and well-maintained GIS for your public garden. This broad approach will also help your team think creatively about what GIS can do for you and, most importantly, imagine all the ways that the lists, maps, pattern tracking, and analysis can help your garden address problems in your community. Best of all, although it will take time away from garden management, curators and horticulturists may find that working on team projects with wider impact can be an extremely rewarding experi-ence and help them see their collection in entirely new ways. It may also bring more help back to your garden, in both direct support and volunteer help.
Like other nonprofits that serve the community, public gardens have a deep well of good will in the community to draw upon, as we seek to start a new venture. There is hardly a city manager or GIS professional who does not have fond feelings about their local botanical garden or zoo. Invite people into your garden, give them a behind-the-scenes tour, explain your problems, explain your current thinking about how you are planning to solve these problems and then listen. Local GIS professionals may become advocates and help launch the entire mapping effort. As one curator said: “It was all I could do to control the volunteer GIS team. They were out here telling us where to stand and what to do, ordering orange vests, and insisting on coming in on Saturday to finish a section of the garden with their own equipment.”

Alliance for Public Gardens GIS 31
If you come up with a great project or have the support of your board and leadership, you will have the funding you need to build a GIS. But if you find you don’t, don’t stop moving forward because of the lack of money. The funding and help will come once you have a clear and focused plan and find the right local partners. When such a team does coalesce around you and your garden, do remember to treat these professionals and volunteers who help you map your collection as the major donors they are.
GRANT FUNDING When you have defined a few ideas for a focused project, it is time to approach funding partners. The Institute of Museum and Library Services (IMLS) is the the primary source of federal sup-port for the nation’s 123,000 libraries and 17,500 museums. IMLS has funded GIS projects that strengthen collection management and community outreach at public gardens. Although IMLS has many programs and opportunities that help with new technology, the “Museums for America” program is a funding source that is particularly well-suited to GIS collections management or edu-cational outreach projects between $5000 to $150,000.
IMLS Museums for America (MFA) grants support activities that strengthen museums as active resources for lifelong learning, as impor-tant institutions in the establishment of livable communities, and as good stewards of the nation’s collections. MFA grants can fund both new and ongoing museum activities and programs. Examples include planning, managing and conserving collections, improving public access, training, conducting programmatic research, school and public programming, producing exhibitions, and integrating new or upgraded technologies into your operations. [IMLS 2013]
IMLS has another program, “National Leadership Grants for Museums,” for larger projects— $50,000 to $500,000—that involve multiple museums or are designed to support innovative projects with broader impact.
IMLS National Leadership Grants (NLG) for Museums support projects that address current and future needs of the museum field and that have the potential to advance practice in the profession so that museums can improve services for the American public. Successful proposals will generate results such as models, new tools, research findings, services, practices, and/or alliances that can be widely used, adapted, scaled, or replicated to extend and leverage the benefits of federal investment. [IMLS 2013]
MATCHING FUNDS FOR IMLS GRANTSParterships within your community become especially important when applying for IMLS funding. In order to receive a Museums for America grant or to receive a National Leadership Grant for Mu-seums of $250,000 or more, you must provide funds from non-federal sources in an amount that is equal to or greater than the amount of the grant. NLG proposals requesting less than $250,000 in IMLS funds do not require cost share/matching. However, the cost sharing—the contribution your museum or larger community must provide—does not have to be cash outlays. In addition to direct financial support, contribution of property and services and in-kind contributions, such as staff or volunteer time that support project activities, may all be considered part of the match.
Commitments must be in place before the project is funded and careful record-keeping of staff, volunteer time, and donated services and property is required throughout the life of the grant proj-ect in order to verify that your museum “made the match.” Although this requirement can intimidate first-time grantees, any project that is important to your museum—and important enough to have the approval of the Director and/or Trustees to apply for national grants of this kind—usually natu-
Guide to GIS32
rally engages staff across the institution, donors, and outside supporters, commercial partners, and volunteers. The value of these in-kind contributions add up fast and most public gardens have no trouble meeting this requirement.
The National Science Foundation (NSF) and other federal agencies have also funded major infor-mation infrastructure projects that have supported GIS at botanical gardens and zoos that have a significant scientific staff or world conservation mission. However, successful NSF proposals usually require that the principal investigators are lead scientists at major universities with a great track record managing scientific projects with national or international impact. Although you may be involved as a partner or a leader in an NSF project, proposal preparation is difficult and the competition can be very high and is beyond the scope of this guide.
FOUNDATION FUNDING In contrast, foundations focused on your particular community or in the particular project area (e.g., songbird survival, childhood obesity, rare plant conservation) that your proposed GIS project is focused upon can be generous sources of support for both small and large projects. If you do find a foundation that funds projects in your area, it is certainly worth the time to read their Website and, if the match is a good one, to ask around for someone who may be willing to introduce you to program officers. It can take two to three years of relationship-building with foundation program officers before a project is funded. On the plus side, if the first project goes well, you may find that you now have a true partner in your community with both available funds and a genuine interest in working with you to achieve shared goals.
PARTNERSHIPS WITH LOCAL GIS PROFESSIONALSThere is one more critical aspect to finding funds to build a GIS in a public garden. Don’t limit your thinking to money: money is not the only or even the most important thing you need to start map-ping with GIS. Good will, local GIS experts willing to help, and freely-shared data that is already captured in GIS format somewhere can save you many thousands of dollars as you get started. Public gardens can often directly benefit from GIS work that has already been done by federal, state, and local agencies. For example, the professional GIS staff working for cities or utility com-panies may be happy to share aerial photographs or base maps that include your garden.
Project Plan and Timeline
PROJECT PLANThe project plan combines all your ideas for desired products, technical specifications, data scope and system structure. The plan illustrates what your garden needs from a GIS and what will be needed for the project in order to produce these results. The plan should be well organized, straightforward, thorough, and objective in order to win approval. You will be able to use this plan as a timeline, to secure permissions and funding, and to safeguard against failure once the project is underway. In order to be effective, the project plan must be used, reviewed, maintained, and updated. The steering committee can help revise and finalize the document. Demonstrate that you have considered your organization’s strategic plan and that you have thought out all of the aspects of the project, including how the GIS integrates with existing (legacy) systems. Show what will be your biggest obstacles for implementation and include an executive summary of your findings for less technically-minded people who are short on time.

Alliance for Public Gardens GIS 33
COMPONENTS OF THE PROJECT PLAN• Executive Summary• Targeted Products/Deliverables• System Design• Datasets• Software and Hardware• Data Collection Plan
• Staffing Considerations• Funding Considerations• Potential or Existing Obstacles• Timeline• Budget
Table 3. Sample Timeline for a GIS Project
TIMELINEUse the project plan to form a project timeline. The timeline serves as a mechanism to insure the project is completed on time and within your budget. List the activities, deliverables, and milestones from the plan and think about how long they will take. When constructing the timeline consider staff availability, historical time frames for similar past projects and system constraints in order to determine how long each will take. Create a monthly schedule based on the list with achievable goals. Your schedule should include project start and end dates, activity duration estimates, and deliverables and milestones. Schedule time for project initiation, hiring staff, and purchasing equipment, and remember that data entry will take up the bulk of the time spent on the project. See Table 3 for a sample timeline of a short GIS project. Your project timeline will vary considerably based on the volume and type of data you decide to collect.
BUDGETThe foundation of your budget comes from your deliverables list. With the deliverables list as your guide, you’ll know what you want to buy (materials, travel, and equipment) and who you have to hire to get the job done (salary costs and consultant fees). The budget duration should correspond with the timeline and all of the one-time costs will fall within the timeline’s start and end dates. Once the initial project timeline ends, there will be recurring costs for maintenance. Staffing and system maintenance will be the biggest costs in the long run. Your budget is a prediction and it may change as the project progresses. Also, remember that GIS projects are information technol-ogy products and IT is never really a one-time expense. The GIS will be an ongoing and per-manent element of your garden once you adopt it. You will need to upgrade and change as your hardware ages and technology evolves.

Guide to GIS34
Conclusion
Although it may be tempting to plunge in and forego the planning process, project planning will enable your project to attain its desired goals, and it is a necessary prerequisite for success. The planning process can seem arduous but in the long run it will pay to think carefully about each step and clearly define what you want to get out of your GIS and what you’ll need in order to reach your goals. Planning will help to avoid failure and insure the project is delivered on time and within budget. Planning also helps to secure funding and sets you up for success with potential donors. The project plan is the framework on which the actual resource plans and cost breakdowns are mapped. It makes explicit each stage and activity and helps your organization to accomplish its strategic goals. One final word of advice: a good plan is also flexible. Change is inevitable and you must plan to accommodate the bumps you will encounter as you build and shape your next era of information management.
Selected References
1. Caplan, Joel. Is GIS Right for you Guided Worksheet. GIS for Public Safety. 2010
2. Dangermond, Jack. Personal Communication. 2007.
3. Tomlinson, Roger. Thinking About GIS: Geographic Information System Planning for Managers. Third Edition. 2007.

Alliance for Public Gardens GIS 35
C H A P T E R F I V E
Recruiting and Training Staff
Recruiting
Recruiting staff, volunteers, or interns is a labor-intense activity that is very costly for any organi-zation. Conduct your recruitment process carefully from start to finish and try to attract the right candidates for the position and for the culture of your organization. Poor recruiting choices can prove expensive and even lead to project failure.
When spreading the word about the position do the obvious—post the announcement on your website, publish it in your institution’s newsletters, advertise in your local newspaper—but be cre-ative and target your recruitment efforts to your intended candidate pools. Tap existing networks of listservs, encourage employee referrals, promote on the job boards of professional societies (Ecological Society of America, Botanic Gardens Conservation International, American Public Gardens Association, California Society for Ecological Restoration and use social media platforms like LinkedIn, Google+, and Facebook to advertise the position. Once you cast a net far and wide, a posting will usually get picked up and advertised by some of the bigger job sites like Monster.com or Indeed.com that would normally charge you to post.
Staff Responsibilities
The staff members you recruit (from within your organization or otherwise) will be forming your “core” GIS user group. If you are recruiting someone from outside your organization The job description is the first point of contact for potential candidates. Developing a robust job description attracts the right people and helps your organization determine the importance of the position. It should clearly outline the details, responsibilities, and activities of the position. Set clear expecta-tions in a summary statement, include a detailed description of the functions of the position, and outline information on the necessary experience you need in order for your project to succeed. Don’t lose sight of the importance of defining the culture of your company and finding someone whose personal skills match. Check references to get different perspectives of the person you are considering.
We have included short summaries outlining the skills to look for when recruiting a GIS Manager, GIS analysts, and/or GIS interns and volunteers.
GIS MANAGER A GIS manager has many of the skills you would find in an IT person, only their skill set will be tailored to GIS. Often GIS managers are former GIS analysts who have advanced their skills over time. Their technological know-how will include GIS system administration, system design, planning, and possibly programming. A smaller garden might only have a GIS manager and no other core GIS staff. The manager can work with a combination of volunteers, student staff, or

Guide to GIS36
interns who will serve as analysts to maintain the system. A larger garden might have two to five staff members who work with the GIS in some capacity; the manager will be in charge of oversee-ing those staff and developing a system that works for staff in multiple departments on numerous projects.
Sample Job Description – GIS ManagerThe GIS manager oversees and directs the development, installation, integration, and maintenance of the GIS system. This position requires at least five years of experience as an advanced GIS technician with demonstrated ability in the design, development, analysis, and application of ArcGIS databases. The ideal candidate will have significant experience with project design, work plan development, database systems, and appli-cation development. The manager will be responsible for the installation of a new GIS network, executing conversions from the current dataset into the GIS, troubleshooting the new system, and training all relevant staff members. Advanced knowledge and expe-rience with GPS or surveying equipment, software, and hardware is essential. Excellent interpersonal, leadership, and organizational skills are required. Successful candidate must have a B.S/M.S. in geography, plant sciences, or related field with demonstrated knowledge of GIS systems. Knowledge and experience with plant records at botanical gardens is a plus.
GIS ANALYSTThe duties of a GIS analyst can vary greatly depending on the organization, but an analyst should have solid knowledge of GIS technology and how it can be applied at your organization. An analyst may have special knowledge in application development, GIS administration, or hardware management, but most analysts are primary users who are responsible for map production, data maintenance, and/or GIS analysis. Many analysts do not have degrees in geography but they do possess prior experience with GIS systems. Small public gardens might only have one paid GIS staff member and, in that instance, your garden can train interns or volunteers to serve as the analysts to help maintain your system.
Sample Job Description – GIS AnalystThe GIS analyst is responsible for the development of GIS data and GIS information products. Responsibilities include GIS database creation, GIS maintenance, data collec-tion, performing spatial analyses, and data quality control. The analyst uses cartographic, horticultural, and technical skills to create a geographic inventory of the garden collec-tion and will regularly interact with other garden staff to define data needs and produce custom GIS maps. The successful candidate must have a B.S/M.S. in geography, plant sciences, or related field with a demonstrated one to two years of experience with GIS systems. Familiarity with GPS/surveying data collection is desired. Knowledge and expe-rience with plant records at botanical gardens is a plus.
INTERNS AND VOLUNTEERSMany public gardens rely on volunteers and interns in every area of operations and several gar-dens use them to help maintain their GIS. With some luck you will be able to recruit student interns who already have some experience with GIS. Use your local community college or university as a starting point. Experienced volunteers can be harder to locate, but you can invest more time in training them because their term of service will often be longer than that of an intern. When you are selecting people, look for those with critical thinking abilities, organizational skills, and techno-logical aptitude. Student interns (paid or unpaid) and volunteers can be used for data entry, map-ping new plantings, updating base map features, creating map documents, or almost any project requiring basic GIS skills. Adequate training will be the key to success when utilizing their help.

Alliance for Public Gardens GIS 37
The Alliance for Public Gardens GIS Website provides a detailed training curriculum for the creation of a GIS community volunteer program that includes recruitment materials, training PowerPoints, cost estimates, and materials lists. The site also has information about finding GIS professional volunteers (GeoMentors) who can help with specific projects at your garden.
GIS CONSULTANTSIf your existing staff doesn’t have the knowledge or skills to get a GIS up and running and your budget won’t allow for hiring a full-time staff member, hiring a consultant is an option for the initial setup. If you decide to go with a consultant, designate a key member of the GIS steering commit-tee as the contact person for your consultant. The contact person needs to have knowledge of all parts of the system and should be available throughout the entire design process. The consultant needs to have GIS knowledge equivalent to that of a GIS manager. Ask for references in order to see examples of other projects they have done. Set up a timeline of project deliverables specific to the work of the consultant, map out a clear plan for system integration and transition, and request documentation of the process for future reference.
Training
Whether you hire new staff or build your team with existing staff members, each participant needs to be working towards your collective goal. Adequate training properly equips people with the skills they need to make projects succeed. Your organization might have all the software and hardware necessary but it is useless without the proper staff to setup and maintain it. Investing in your staff will in turn make them more invested, help to create a sense of loyalty, and improve work quality.
Many university or community colleges have GIS certificate programs that can provide basic training. Typically, these programs are set up for professionals, with shorter, rigorous courses that cover a wide range of material in a short time frame. Many of the programs have a focus on envi-ronmental management; these can be of benefit to entry or intermediate-level GIS users who lack formal education in geography or GIS.
The APGA–Esri partnership provides free access to training for all APGA member institutions and includes Esri virtual campus courses, Esri press publications, and registration to the Esri Interna-tional User Conference. There is a variety of instructor-led, self-paced, online, or in-person train-ing courses available via Esri’s virtual campus, and they have designated “foundational courses” for those new to GIS to get up to speed. Along with paper presentations by GIS users from a diverse range of backgrounds, the International User Conference offers a unique opportunity to participate in technical workshops on a wide variety of topics and vast range of technical exper-tise.
On the Alliance for Public Gardens GIS website there is an extensive suite of garden-centric train-ing materials for GIS collection mapping. Materials include handouts from past training workshops introducing participants to the process of creating digitial collection maps with GIS, instructional training videos demonstrating many basic tasks of GIS mapping, as well as case studies that give insight into how other gardens are leveraging the power of GIS.

Guide to GIS38

Alliance for Public Gardens GIS 39
C H A P T E R S I X
Building the GISOnce the funding, staffing, and equipment for your GIS project are in place, the time has come to begin building the GIS. The most basic form of a GIS is made up of three main components: a database, the data in it, and one or more maps that display the data. More advanced systems may contain Web services and applications for sharing information on the internet and much more. In this chapter we will focus on the database and data components, while maps, Web services, and applications will be covered in the chapters that follow.
GIS Databases
The foundation of a GIS is the database that serves as a container to store the data that is displayed in the maps, Web services, and applications. A database is comprised of two primary parts, the database management system (DBMS), which is commonly thought of as the data-base software, and the data model that organizes the data stored in the database in a way that attempts to represent reality.
DATABASE MANAGEMENT SYSTEMSMany gardens use database management systems such as Microsoft Access or FileMaker Pro to store, query, and report on their plant records. These DBMS require that each garden create its own data model to organize its plant records into tables of similar types of information, such as accessions, that contain attributes for each record in the table, such as the accession number and source.
Plant Records Systems
The majority of public gardens use plant records systems such as BG-BASE or IrisBG that are developed, supported and licensed through commercial vendors. These systems are considered software applications that combine the functionality of a DBMS with a data model, data entry forms, and report templates that are designed specifically for storing, querying, and reporting on plant records. These products greatly reduce the time and effort required to implement and use a plant records system, thus making them the pre-ferred choice at many gardens. While some of these applications may have the ability to store and display spatial data, they do not replicate the mapping and analysis functionality of a full-featured GIS.
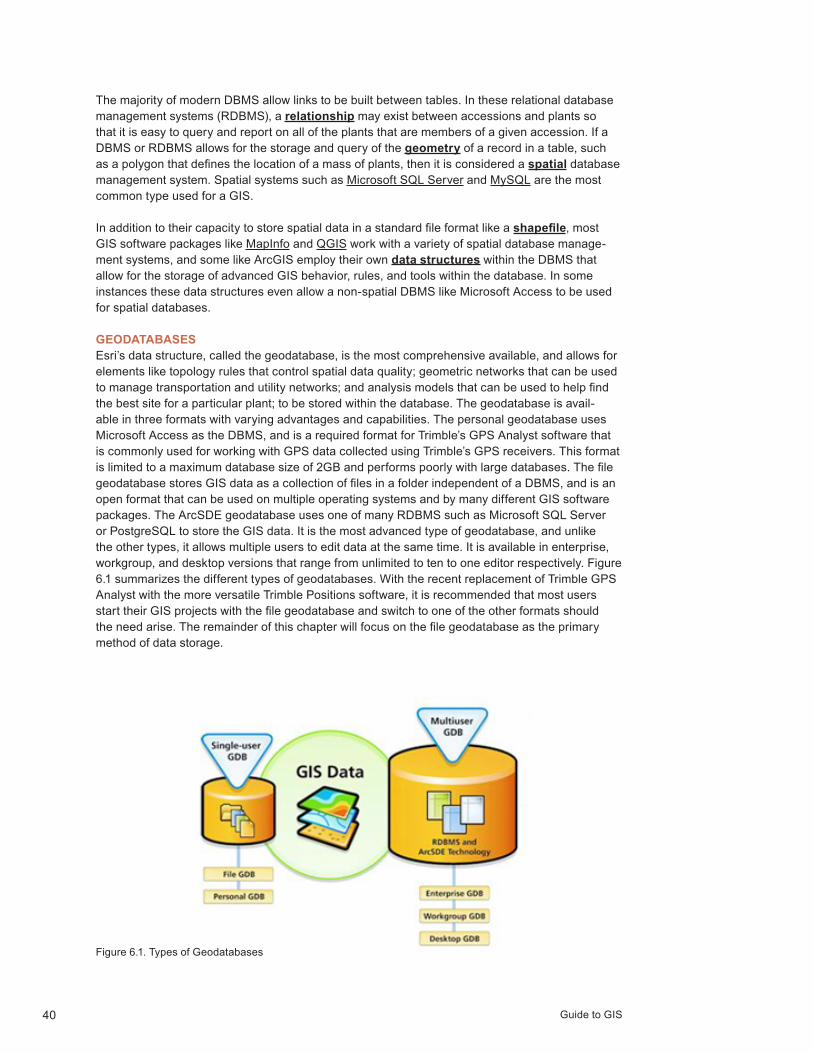
Guide to GIS40
The majority of modern DBMS allow links to be built between tables. In these relational database management systems (RDBMS), a relationship may exist between accessions and plants so that it is easy to query and report on all of the plants that are members of a given accession. If a DBMS or RDBMS allows for the storage and query of the geometry of a record in a table, such as a polygon that defines the location of a mass of plants, then it is considered a spatial database management system. Spatial systems such as Microsoft SQL Server and MySQL are the most common type used for a GIS.
In addition to their capacity to store spatial data in a standard file format like a shapefile, most GIS software packages like MapInfo and QGIS work with a variety of spatial database manage-ment systems, and some like ArcGIS employ their own data structures within the DBMS that allow for the storage of advanced GIS behavior, rules, and tools within the database. In some instances these data structures even allow a non-spatial DBMS like Microsoft Access to be used for spatial databases.
GEODATABASESEsri’s data structure, called the geodatabase, is the most comprehensive available, and allows for elements like topology rules that control spatial data quality; geometric networks that can be used to manage transportation and utility networks; and analysis models that can be used to help find the best site for a particular plant; to be stored within the database. The geodatabase is avail-able in three formats with varying advantages and capabilities. The personal geodatabase uses Microsoft Access as the DBMS, and is a required format for Trimble’s GPS Analyst software that is commonly used for working with GPS data collected using Trimble’s GPS receivers. This format is limited to a maximum database size of 2GB and performs poorly with large databases. The file geodatabase stores GIS data as a collection of files in a folder independent of a DBMS, and is an open format that can be used on multiple operating systems and by many different GIS software packages. The ArcSDE geodatabase uses one of many RDBMS such as Microsoft SQL Server or PostgreSQL to store the GIS data. It is the most advanced type of geodatabase, and unlike the other types, it allows multiple users to edit data at the same time. It is available in enterprise, workgroup, and desktop versions that range from unlimited to ten to one editor respectively. Figure 6.1 summarizes the different types of geodatabases. With the recent replacement of Trimble GPS Analyst with the more versatile Trimble Positions software, it is recommended that most users start their GIS projects with the file geodatabase and switch to one of the other formats should the need arise. The remainder of this chapter will focus on the file geodatabase as the primary method of data storage.
Figure 6.1. Types of Geodatabases

Alliance for Public Gardens GIS 41
DATA MODELSOnce a database management system and/or data structure is selected, the next step required to build a GIS is to determine how the data will be organized within the database. The goal of this phase of the project is to determine how objects or features in the garden, such as plants and planting beds, are represented in the geodatabase, what information such as name and condition will be recorded about each feature as attributes, and what relationships, like “planting beds con-tain plants”, exist. While it is possible to create new feature classes or add attributes and relation-ships as necessary, it is preferable to design the database before collecting any data so that all of the data required for the project has a well-thought-out home within the geodatabase.
To simplify this task, the Alliance for Public Gardens GIS worked with an international team of liv-ing collection managers and GIS experts to create the ArcGIS Public Garden Data Model, a free and open-source template designed for Esri’s ArcGIS software. This data model defines feature classes, attributes, and relationships for many different types of garden features including plants, structures, water features, soil types, and more as shown in Figure 6.3. It also defines a set of topology rules to help find errors when, for instance, a plant is located on top of pavement, as well as attribute domains to control data quality that appear as a drop-down list of valid values for a field. We recommend that public gardens use this data model as a starting point for their GIS projects, and then customize it as necessary. This approach saves money and provides the added benefit of a support network of over 200 institutions worldwide that are using the model.
GIS Data
With a data model ready to store your garden’s spatial data, you can start collecting data to load into it, but first it is important to understand the various types of spatial data you will be working with. There are many types of data that can be used with a GIS. A brief overview of the most com-mon types is presented below.
VECTOR DATAThe most common type of spatial data, vector data, comes in the form of points, lines, and polygons. Point vector data is made up of a single set of coordinates that define the horizontal location (x and y) and the optional vertical location (z) of a point in space. Points are used to rep-resent features that have no dimensions or are too small to show at a given map scale. In public gardens, plants, signs, and irrigation heads are represented as points. Line vector data is made up of multiple vertices, each with their own set of coordinates, which are connected by straight or curved segments to form a line. Lines are used to represent linear features that have one dimen-sion, and therefore length, or are too narrow to show at a given map scale. In public gardens, utility lines and fences are represented as lines. Polygon vector data is also made up of multiple
Shapefiles
Many GIS users prefer to use a long-standing data structure for their spatial data called a shapefile. This open format allows a single spatial database table to be stored and distributed independently of a comprehensive database in a spatial DBMS. While this standard format is used frequently, it does not offer the relational capabilities, data quality control, and other key features available in most spatial DBMS. The best strategy is to limit the use of shapefiles to data sharing activities, and to use them only when this format is specifically requested when sharing data.
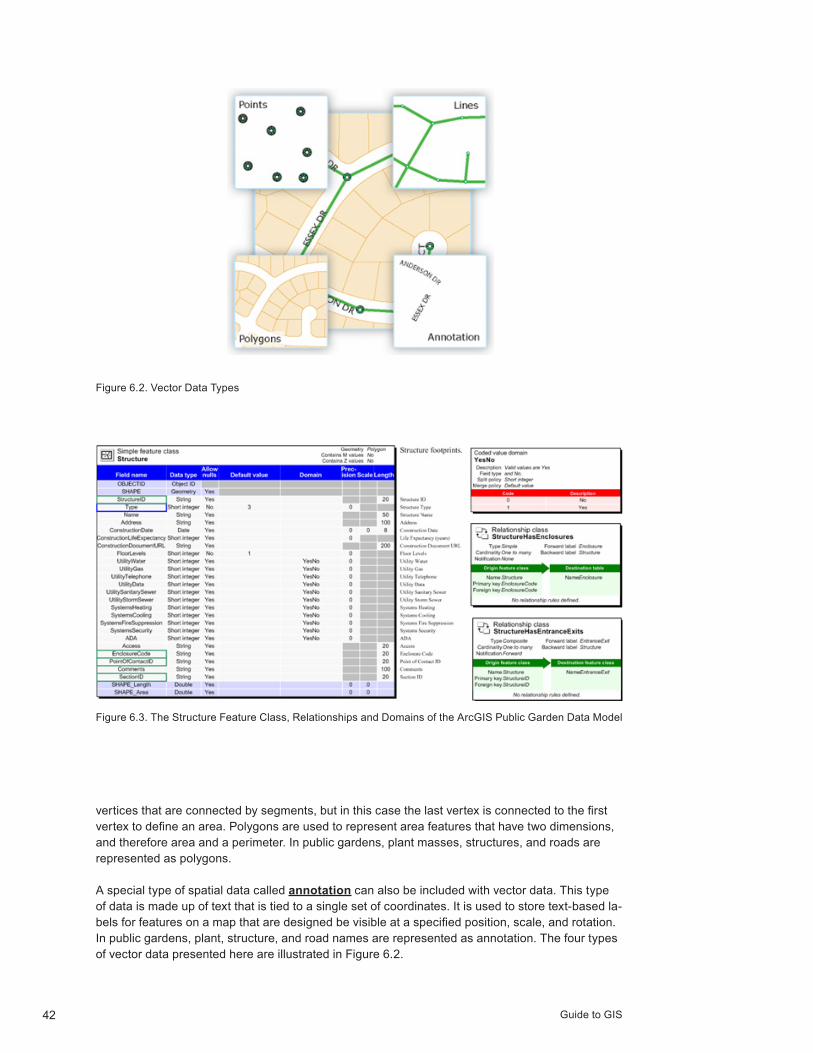
Guide to GIS42
vertices that are connected by segments, but in this case the last vertex is connected to the first vertex to define an area. Polygons are used to represent area features that have two dimensions, and therefore area and a perimeter. In public gardens, plant masses, structures, and roads are represented as polygons.
A special type of spatial data called annotation can also be included with vector data. This type of data is made up of text that is tied to a single set of coordinates. It is used to store text-based la-bels for features on a map that are designed be visible at a specified position, scale, and rotation. In public gardens, plant, structure, and road names are represented as annotation. The four types of vector data presented here are illustrated in Figure 6.2.
Figure 6.3. The Structure Feature Class, Relationships and Domains of the ArcGIS Public Garden Data Model
Figure 6.2. Vector Data Types
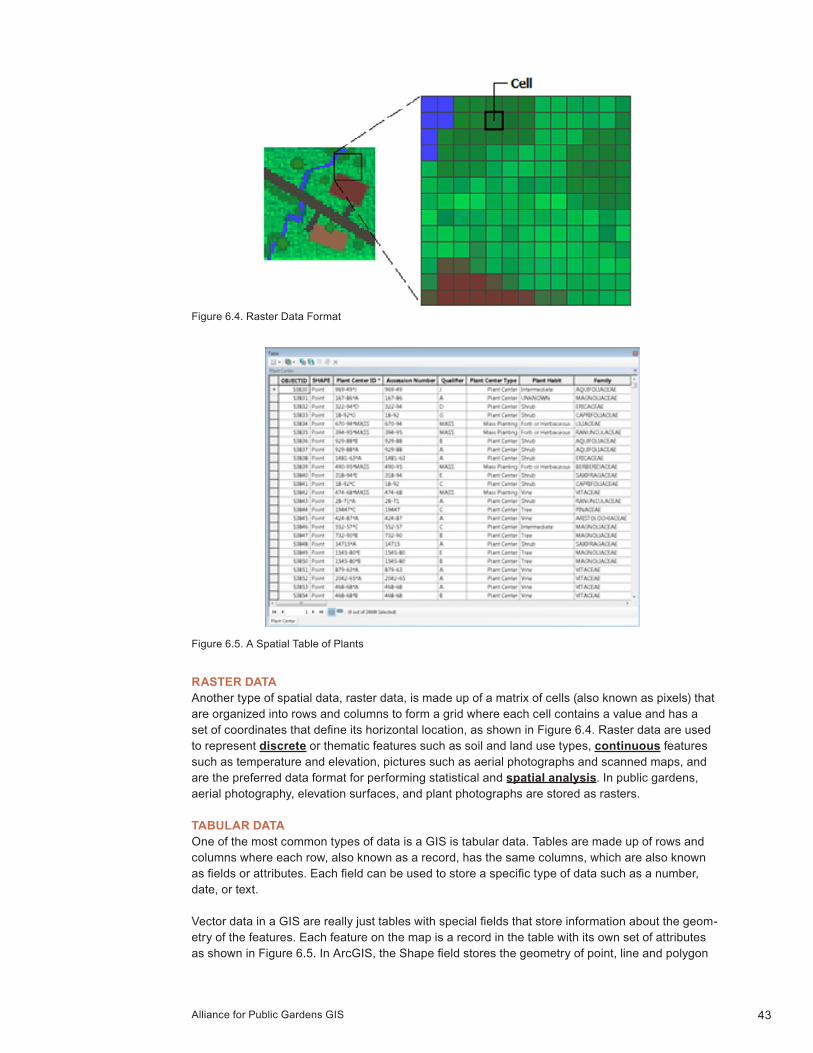
Alliance for Public Gardens GIS 43
Figure 6.4. Raster Data Format
RASTER DATAAnother type of spatial data, raster data, is made up of a matrix of cells (also known as pixels) that are organized into rows and columns to form a grid where each cell contains a value and has a set of coordinates that define its horizontal location, as shown in Figure 6.4. Raster data are used to represent discrete or thematic features such as soil and land use types, continuous features such as temperature and elevation, pictures such as aerial photographs and scanned maps, and are the preferred data format for performing statistical and spatial analysis. In public gardens, aerial photography, elevation surfaces, and plant photographs are stored as rasters.
TABULAR DATAOne of the most common types of data is a GIS is tabular data. Tables are made up of rows and columns where each row, also known as a record, has the same columns, which are also known as fields or attributes. Each field can be used to store a specific type of data such as a number, date, or text.
Vector data in a GIS are really just tables with special fields that store information about the geom-etry of the features. Each feature on the map is a record in the table with its own set of attributes as shown in Figure 6.5. In ArcGIS, the Shape field stores the geometry of point, line and polygon
Figure 6.5. A Spatial Table of Plants

Guide to GIS44
data, and the BLOB field stores the geometry of annotation. Each table also contains a unique identifier number field that is maintained by the GIS software. In ArcGIS, this is usually called the ObjectID field.
In addition to the spatial tables that are associated with vector data, tables can be non-spatial, meaning that the records in the table do not have any geometry associated with them. The records in these tables can be associated with records in another table though a common field known as a key. These associations can be made in several ways, including by joining or relat-ing tables temporarily in your map or by creating relationship classes in your geodatabase that maintain more permanent associations. For example, you could associate a table of plant mainte-nance history records with plants by using the id number assigned to each plant in both tables.
CAD DATAUnlike vector, raster and tabular data, computer-aided design (CAD) data as shown in Figure 6.6 is not a native format to GIS, but rather one that is supported and can be opened without being imported or converted. CAD is a system of hardware and software used by design professionals to design and document real-world objects, and is commonly used in the engineering, architecture, surveying, and construction industries. CAD systems generate digital data that can serve a range of purposes—from a design plan that is printed as a drawing or submitted as a legal document, to a repository for ongoing as-built information. Public gardens will frequently have several datasets in this format, and can choose to either work with them directly in their GIS software, or convert features into a native GIS format where they can be edited and additional attributes can be added to them. We recommend that you convert data that you will work with on a regular basis, such as a surveyed base map showing the locations of trees and pathways in the garden, to a GIS format, while leaving data that will be accessed infrequently, such as a plan for a new exhibit, in its native format. Additional information on importing CAD data is provided in the next chapter.
Map Projections
No discussion of GIS data would be complete without a discussion of map projections since they dictate how GIS data is tied to a real-world location. Map-makers have always struggled with the problem of representing the curved surface of the Earth on a flat surface like a piece of paper,
Figure 6.6. CAD Data for the Santa Barbara Botanic Garden
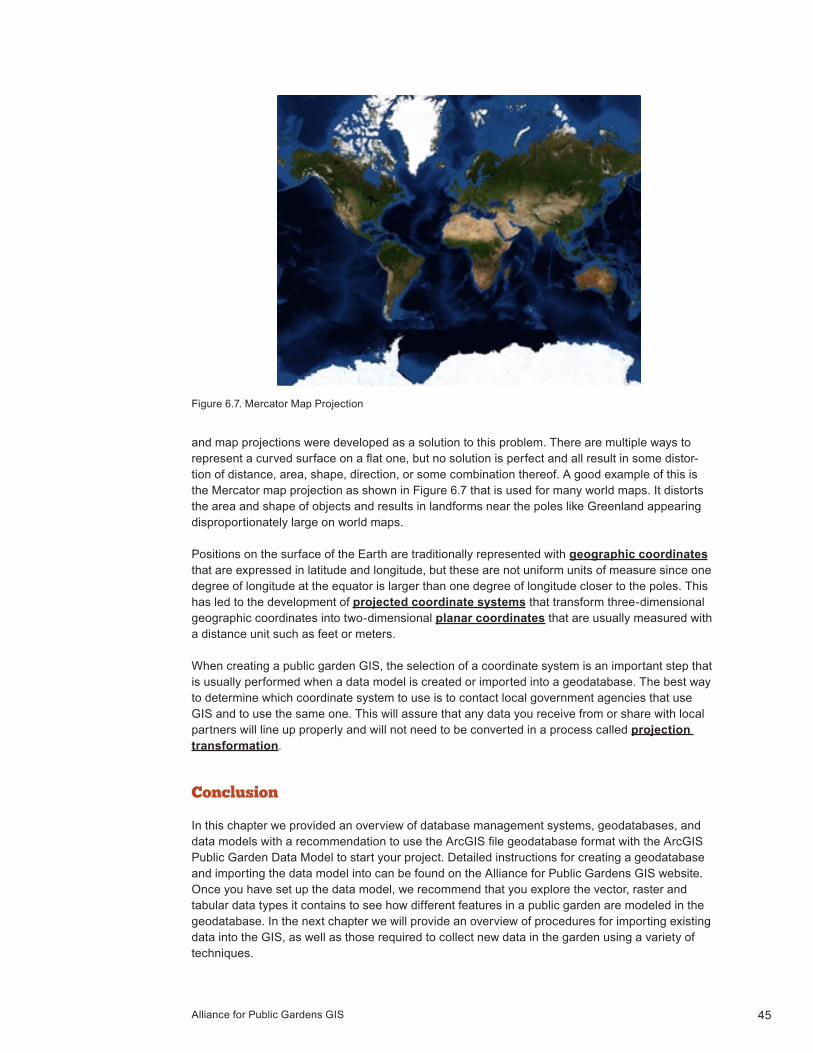
Alliance for Public Gardens GIS 45
and map projections were developed as a solution to this problem. There are multiple ways to represent a curved surface on a flat one, but no solution is perfect and all result in some distor-tion of distance, area, shape, direction, or some combination thereof. A good example of this is the Mercator map projection as shown in Figure 6.7 that is used for many world maps. It distorts the area and shape of objects and results in landforms near the poles like Greenland appearing disproportionately large on world maps.
Positions on the surface of the Earth are traditionally represented with geographic coordinates that are expressed in latitude and longitude, but these are not uniform units of measure since one degree of longitude at the equator is larger than one degree of longitude closer to the poles. This has led to the development of projected coordinate systems that transform three-dimensional geographic coordinates into two-dimensional planar coordinates that are usually measured with a distance unit such as feet or meters.
When creating a public garden GIS, the selection of a coordinate system is an important step that is usually performed when a data model is created or imported into a geodatabase. The best way to determine which coordinate system to use is to contact local government agencies that use GIS and to use the same one. This will assure that any data you receive from or share with local partners will line up properly and will not need to be converted in a process called projection transformation.
Conclusion
In this chapter we provided an overview of database management systems, geodatabases, and data models with a recommendation to use the ArcGIS file geodatabase format with the ArcGIS Public Garden Data Model to start your project. Detailed instructions for creating a geodatabase and importing the data model into can be found on the Alliance for Public Gardens GIS website.Once you have set up the data model, we recommend that you explore the vector, raster and tabular data types it contains to see how different features in a public garden are modeled in the geodatabase. In the next chapter we will provide an overview of procedures for importing existing data into the GIS, as well as those required to collect new data in the garden using a variety of techniques.
Figure 6.7. Mercator Map Projection

Guide to GIS46

Alliance for Public Gardens GIS 47
C H A P T E R S E V E N
Data CollectionNow that a GIS database has been created, a data model has been implemented, and an over-view of the various types of GIS data has been provided, it is time to begin collecting data and adding it to the GIS. This chapter provides an overview of the process of assembling existing data, determining what new data needs to be created or collected, importing existing data, and creating and collecting new data through a variety of methods.
Working with Existing Data
The first step in creating a GIS for a public garden is to assess what data you already have avail-able, and what new data will need to be created or collected. Most gardens have a surprising amount of data in both digital and paper formats that can be added to the GIS. At this stage of the process, aerial photography, site surveys, collection maps, plant records, garden photographs, as-built drawings, and any other form of data that shows where garden features are located or that
Figure 7.1. 1947 Hand-drawn Collection Map from the Arnold Arboretum of Harvard University

Guide to GIS48
contain descriptive information about them should be assembled. Each piece of data should be evaluated for its currency and accuracy to determine what will be useful information to have in the GIS, and prioritized by the order it should be added to the GIS based on its level of usefulness in accomplishing the goals of the project.
For example, aerial photography that is more than five years old will be useful to have in the GIS to examine historic conditions in the garden, but may not be current enough to use as a back-ground for maps or to digitize features from. In this case, importing this aerial photography can be assigned a lower priority than more current data, but obtaining new imagery should be a high priority. Aerial photography will be further discussed in the next section. In another example, many gardens have hand-drawn maps of their collections that show the locations of plants as deter-mined by measuring their position relative to other objects in the garden as shown in Figure 7.1. While these maps contain valuable historic information that can be used in the GIS, the locations of the plants on these maps may not be accurate enough to use as the primary source of plant location information. In this case, scanning and georeferencing these maps can be assigned a lower priority, but collecting new, more accurate plant location data using heads-up digitizing, GPS, or by surveying should be a high priority. Collecting new data will be further discussed later in this chapter.
AERIAL PHOTOGRAPHYWhen creating a new GIS in any industry and for any purpose, adding aerial photography is a great place to start, and should be one of the highest priority tasks. Aerial photography is usually captured by aircraft with high-resolution cameras and high-accuracy GPS units that record the location of each image as it is captured. These images are then corrected for camera distortions, georeferenced to their location on the ground, and then further corrected using elevation data to remove terrain distortions in a process called orthorectification. Aerial photography is tradition-ally captured on clear days during the leaf-off season to minimize obstructions caused by clouds and vegetation. This process results in very clear and accurate raster images that can be used to digitize features as small as nine inches square (58 cm2). To use aerial photography for this
Figure 7.2. Aerial Photography for the UC Davis Arboretum & Public Garden
Alliance for Public Gardens GIS 49
purpose, be sure that it covers the entire area of the garden, is orthorectified, and is of sufficient resolution to discern the features to be mapped. Aerial photography with a resolution or pixel size of six inches (15 cm) or less is preferred for this purpose.
To obtain new aerial photography for a garden, first try contacting the planning department of the local government. They will usually be able to provide the imagery to public gardens for free. If this strategy does not work, searching the internet for “download aerial photography” should yield several options for downloading imagery for the garden. Some of these choices will be free, while others may charge a fee per image. The last option is to find a commercial vendor that can collect new imagery for the garden. This option can be very expensive and should be used only as a last resort. Another option is to use the Add Basemap tool in ArcGIS to add Esri provided aerial photography to a map via the internet. These basemaps tend to perform poorly over slow internet connections and may not be of sufficient resolution for digitizing purposes.
Aerial photography for a garden may come in one or many files that are in one of many coordinate systems and file formats. Regardless of these differences, all of the image files should be loaded into the geodatabase for permanent storage and access. The Aerial Photography Catalog raster catalog of the ArcGIS Public Garden Data Model can be used to store all of the images for one year, as well as all of the images for any other years that may be available. Please search the ArcGIS help documentation for “loading data into a raster catalog” for assistance with this task.
BASEMAP DATAOnce aerial photography has been added to the GIS, the next high-priority task is to add base-map information. In public gardens, a basemap generally refers to all of the features on the ground that when mapped create a seamless map that covers the entire garden. Typical features that are part of a public garden basemap include collection boundaries, structures, pavement, trails, water features, planting beds, turf, and any other features that are large enough to map as polygons as shown in Figure 7.3. The basemap serves as the background for most map products produced with the GIS on which other thematic data such as line features like fences and point features like plants are drawn on top of.
There are three primary strategies for creating a basemap for a public garden. The first strategy is to trace features from aerial photography in a process called heads-up digitizing. This is a relatively quick and inexpensive way to create a basemap, but is only as accurate as the resolu-tion of the aerial photography allows and the person performing the digitizing. More information on heads-up digitizing can be found later in this chapter. The second strategy is to have the garden mapped by a professional surveyor. This strategy is time consuming and rather expensive, but re-sults in a high-accuracy basemap that traditionally is delivered to the garden in a computer-aided
Layers in a GIS
GIS organizes geographic data into a series of thematic layers that contain data that are referenced to real-world locations. This allows multiple layers to be overlaid on each other and disparate data to be integrated and analyzed. For example, a city might have thematic layers for buildings, roads, utility networks, and aerial photography. These layers could be overlaid so that the buildings, roads, and utilities are shown on a background of aerial photography. This would then allow the city to analyze the integrated data to determine which buildings would be affected by a major fire, which roads to close for such an event, and which utilities to shut off. Any geodatabase feature class or raster can be added to a map as a layer.
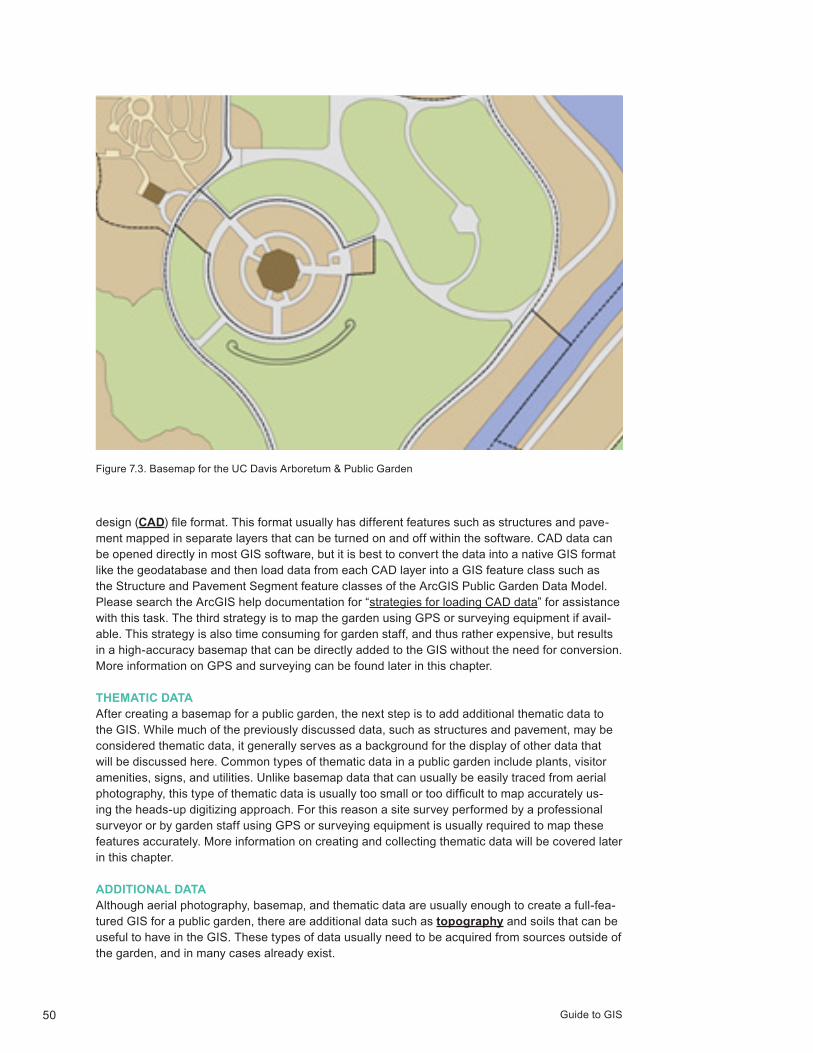
Guide to GIS50
design (CAD) file format. This format usually has different features such as structures and pave-ment mapped in separate layers that can be turned on and off within the software. CAD data can be opened directly in most GIS software, but it is best to convert the data into a native GIS format like the geodatabase and then load data from each CAD layer into a GIS feature class such as the Structure and Pavement Segment feature classes of the ArcGIS Public Garden Data Model. Please search the ArcGIS help documentation for “strategies for loading CAD data” for assistance with this task. The third strategy is to map the garden using GPS or surveying equipment if avail-able. This strategy is also time consuming for garden staff, and thus rather expensive, but results in a high-accuracy basemap that can be directly added to the GIS without the need for conversion. More information on GPS and surveying can be found later in this chapter.
THEMATIC DATAAfter creating a basemap for a public garden, the next step is to add additional thematic data to the GIS. While much of the previously discussed data, such as structures and pavement, may be considered thematic data, it generally serves as a background for the display of other data that will be discussed here. Common types of thematic data in a public garden include plants, visitor amenities, signs, and utilities. Unlike basemap data that can usually be easily traced from aerial photography, this type of thematic data is usually too small or too difficult to map accurately us-ing the heads-up digitizing approach. For this reason a site survey performed by a professional surveyor or by garden staff using GPS or surveying equipment is usually required to map these features accurately. More information on creating and collecting thematic data will be covered later in this chapter.
ADDITIONAL DATAAlthough aerial photography, basemap, and thematic data are usually enough to create a full-fea-tured GIS for a public garden, there are additional data such as topography and soils that can be useful to have in the GIS. These types of data usually need to be acquired from sources outside of the garden, and in many cases already exist.
Figure 7.3. Basemap for the UC Davis Arboretum & Public Garden

Alliance for Public Gardens GIS 51
Topographic data can be useful for site planning and water runoff analysis, and usually comes in the form of contour lines that connect points of equal elevation and spot elevations that show the elevation at a given location. However, sometimes this data will come in the form of a digital elevation model (DEM) which is a continuous raster that contains an elevation value for every pixel or cell in the image. Contour lines and spot elevations can be used to create a DEM and vice versa, so both formats are acceptable sources of topographic data as shown in Figure 7.4. When looking for topographic data, be sure that the interval for contour data or the cell size for DEM data is small enough to be useful for the scale of a public garden. Contour data with an interval of 3 feet (1 meter) or less or DEM data with the same cell size constraints should be sufficient. Topographic data is usually available through a local GIS clearinghouse that may be available at the city, county, or state/province level of government. Try searching the internet for the name of your jurisdiction and GIS data in the format of “City of Davis GIS data.” If this approach does not yield any suitable data, having a professional survey performed is the next best approach. The El-evation Contour and Elevation Point feature classes of the ArcGIS Public Garden Data Model can be used to store contour line and spot elevation data respectively. Please search the ArcGIS help documentation for “about loading data into existing feature classes and tables” for more informa-tion on loading data into the data model.
Soil data can be useful for assessing planting conditions and water drainage. In the United States, good quality soil data is available for the majority of the country through the Department of Agri-culture’s Natural Resource Conservation Service (NRCS). Soil data from the SSURGO program is the most accurate, and can be downloaded directly through the NRCS Soil Data Mart website. It comes in the form of a polygon shapefile and a Microsoft Access database that contains the attri-bute data for the polygons that define each soil map unit. The shapefile can be loaded into the Soil SSURGO feature class of the ArcGIS Public Garden Data Model in the same manner as contour data. The feature class can then be linked to the Access database for the attribute information. Instructions are included for linking the data with each soil data download. In addition to SSURGO soil data, which may be at too coarse a scale for many public gardens, soil data can also be acquired for a public garden by having soil sample analysis performed by a professional. This data may be provided in the format of a polygon soil map of the garden or simply as points showing the
Figure 7.4. DEM, Contour Lines, and Spot Elevations

Guide to GIS52
locations of each soil sample and the analysis results. The Soil and Soil Sample feature classes of the ArcGIS Public Garden Data Model are designed to store this information once received, and can be loaded by following the same procedures as for loading contour data.
Creating and Collecting Data
After all of the existing data for a public garden has been assessed and added to the GIS, it will be clear what data needs remain and what data will have to be created or collected in the garden. This section covers the different techniques available to public gardens for performing this task and the methods necessary to do so.
TECHNIQUESThere are three techniques available to public gardens for creating and collecting new data: heads-up digitizing, GPS, and surveying. Each technique has its advantages and limitations that pertain to the level of accuracy that can be achieved and the time and costs associated with it.
Heads-Up DigitizingHeads-up digitizing is the fastest and least expensive technique, but the least accurate. It involves tracing features from orthorectified aerial photography in desktop GIS software like ArcGIS. This technique is best suited to creating data for features when the level of accuracy is less important such as collection boundaries, pavement, and planting beds. The majority of features included in the basemap fall in to this category, and it is recommended that in the absence of a site survey, that most gardens create as much basemap data as possible with this technique and then use GPS or surveying to map features that are not visible in aerial photography. Heads-up digitizing from aerial photography with a pixel size of six inches (15 cm) will result in in accuracies of roughly the same measure if the person digitizing is very careful, but mapping a single point feature should only take around a minute or two to place the point and enter attribute information. To perform heads-up digitizing, simply add the feature class to be mapped as a layer to the GIS, begin the ed-iting process, and trace the features of interest from the photography as shown in Figure 7.5. Once tracing is complete, enter attribute information about the feature and save the changes. For more information on how to perform heads-up digitizing, please search the ArcGIS help documentation for “what is editing.”
Figure 7.5. Heads-Up Digitizing
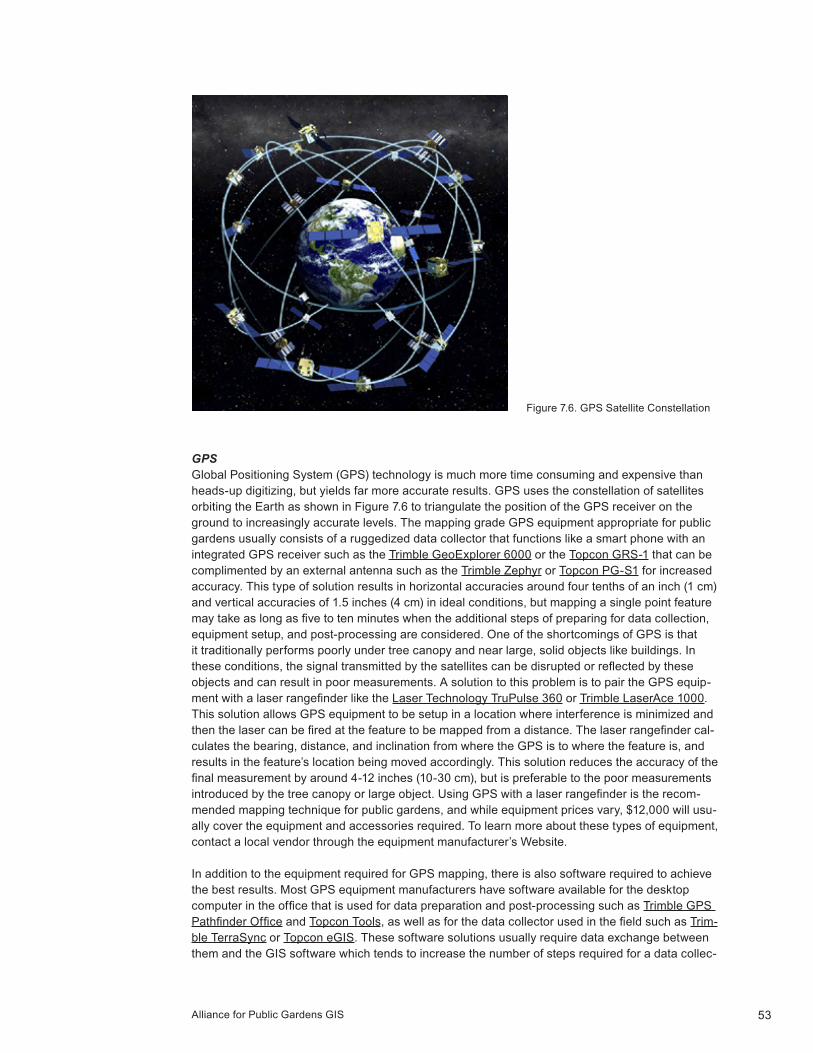
Alliance for Public Gardens GIS 53
GPSGlobal Positioning System (GPS) technology is much more time consuming and expensive than heads-up digitizing, but yields far more accurate results. GPS uses the constellation of satellites orbiting the Earth as shown in Figure 7.6 to triangulate the position of the GPS receiver on the ground to increasingly accurate levels. The mapping grade GPS equipment appropriate for public gardens usually consists of a ruggedized data collector that functions like a smart phone with an integrated GPS receiver such as the Trimble GeoExplorer 6000 or the Topcon GRS-1 that can be complimented by an external antenna such as the Trimble Zephyr or Topcon PG-S1 for increased accuracy. This type of solution results in horizontal accuracies around four tenths of an inch (1 cm) and vertical accuracies of 1.5 inches (4 cm) in ideal conditions, but mapping a single point feature may take as long as five to ten minutes when the additional steps of preparing for data collection, equipment setup, and post-processing are considered. One of the shortcomings of GPS is that it traditionally performs poorly under tree canopy and near large, solid objects like buildings. In these conditions, the signal transmitted by the satellites can be disrupted or reflected by these objects and can result in poor measurements. A solution to this problem is to pair the GPS equip-ment with a laser rangefinder like the Laser Technology TruPulse 360 or Trimble LaserAce 1000. This solution allows GPS equipment to be setup in a location where interference is minimized and then the laser can be fired at the feature to be mapped from a distance. The laser rangefinder cal-culates the bearing, distance, and inclination from where the GPS is to where the feature is, and results in the feature’s location being moved accordingly. This solution reduces the accuracy of the final measurement by around 4-12 inches (10-30 cm), but is preferable to the poor measurements introduced by the tree canopy or large object. Using GPS with a laser rangefinder is the recom-mended mapping technique for public gardens, and while equipment prices vary, $12,000 will usu-ally cover the equipment and accessories required. To learn more about these types of equipment, contact a local vendor through the equipment manufacturer’s Website.
In addition to the equipment required for GPS mapping, there is also software required to achieve the best results. Most GPS equipment manufacturers have software available for the desktop computer in the office that is used for data preparation and post-processing such as Trimble GPS Pathfinder Office and Topcon Tools, as well as for the data collector used in the field such as Trim-ble TerraSync or Topcon eGIS. These software solutions usually require data exchange between them and the GIS software which tends to increase the number of steps required for a data collec-
Figure 7.6. GPS Satellite Constellation
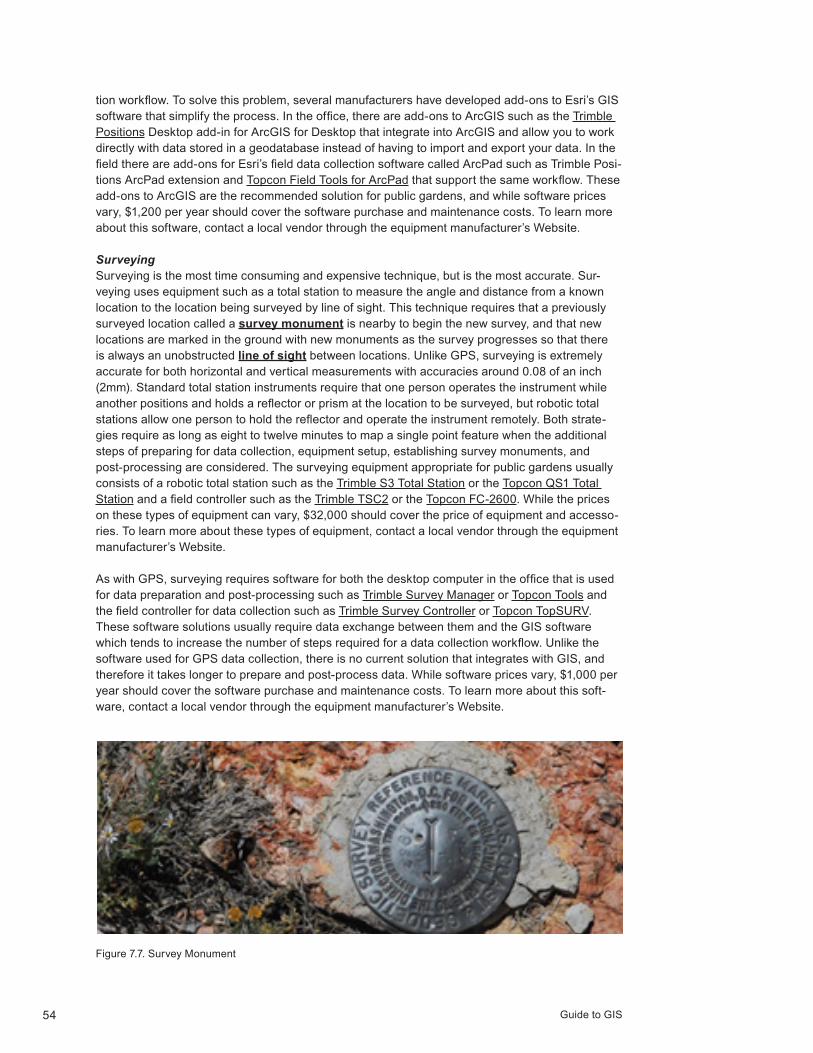
Guide to GIS54
tion workflow. To solve this problem, several manufacturers have developed add-ons to Esri’s GIS software that simplify the process. In the office, there are add-ons to ArcGIS such as the Trimble Positions Desktop add-in for ArcGIS for Desktop that integrate into ArcGIS and allow you to work directly with data stored in a geodatabase instead of having to import and export your data. In the field there are add-ons for Esri’s field data collection software called ArcPad such as Trimble Posi-tions ArcPad extension and Topcon Field Tools for ArcPad that support the same workflow. These add-ons to ArcGIS are the recommended solution for public gardens, and while software prices vary, $1,200 per year should cover the software purchase and maintenance costs. To learn more about this software, contact a local vendor through the equipment manufacturer’s Website.
SurveyingSurveying is the most time consuming and expensive technique, but is the most accurate. Sur-veying uses equipment such as a total station to measure the angle and distance from a known location to the location being surveyed by line of sight. This technique requires that a previously surveyed location called a survey monument is nearby to begin the new survey, and that new locations are marked in the ground with new monuments as the survey progresses so that there is always an unobstructed line of sight between locations. Unlike GPS, surveying is extremely accurate for both horizontal and vertical measurements with accuracies around 0.08 of an inch (2mm). Standard total station instruments require that one person operates the instrument while another positions and holds a reflector or prism at the location to be surveyed, but robotic total stations allow one person to hold the reflector and operate the instrument remotely. Both strate-gies require as long as eight to twelve minutes to map a single point feature when the additional steps of preparing for data collection, equipment setup, establishing survey monuments, and post-processing are considered. The surveying equipment appropriate for public gardens usually consists of a robotic total station such as the Trimble S3 Total Station or the Topcon QS1 Total Station and a field controller such as the Trimble TSC2 or the Topcon FC-2600. While the prices on these types of equipment can vary, $32,000 should cover the price of equipment and accesso-ries. To learn more about these types of equipment, contact a local vendor through the equipment manufacturer’s Website.
As with GPS, surveying requires software for both the desktop computer in the office that is used for data preparation and post-processing such as Trimble Survey Manager or Topcon Tools and the field controller for data collection such as Trimble Survey Controller or Topcon TopSURV. These software solutions usually require data exchange between them and the GIS software which tends to increase the number of steps required for a data collection workflow. Unlike the software used for GPS data collection, there is no current solution that integrates with GIS, and therefore it takes longer to prepare and post-process data. While software prices vary, $1,000 per year should cover the software purchase and maintenance costs. To learn more about this soft-ware, contact a local vendor through the equipment manufacturer’s Website.
Figure 7.7. Survey Monument

Alliance for Public Gardens GIS 55
PREPARING TO COLLECT DATAOnce a data collection technique is selected and the necessary equipment and software is ac-quired it is time to prepare for data collection. The first step in this process is to determine what features in the garden will be mapped. Depending on how much existing data is available and how much data has been digitized from aerial photography, this could be as comprehensive as mapping everything on the ground including both basemap data such as structures, pavement and water features and additional thematic data such as plants, visitor amenities, and utilities, or may just be limited to what cannot be captured using heads-up digitizing. In most cases, collecting data in the field should be limited to the latter case and only features that are obstructed from view or too small to capture from aerial photography should be mapped in the field. For many mapping projects, this may be limited to just plants or even just woody plants that will be long-term features in the garden.
Once the features to be mapped are selected it is important to determine which attributes of those features will be collected while in the field. It is best to limit these attributes to only those that must be captured in the field or are needed to differentiate one feature from another. For instance, when mapping plants, only the name of the plant is required to differentiate one plant from another, but if the plant is misidentified in the field, other information such as an accession number is useful if available. If a recent inventory is not available, then recording condition and size may also be of in-terest. No matter which features and attributes will be mapped, it is important to determine a map-ping strategy before beginning the process. One possible strategy is to map all of the features of one type such as structures or plants at a time. This strategy assures that one layer in the GIS will be completed before moving on to map the next. A second strategy is to map every feature in one part of the garden such as a defined section or plant collection at a time. This strategy requires that the garden boundary that will be used to limit data collection has been defined and will assure that everything in that area will be mapped before moving on to map the next area.
Once the data to be collected has been selected and a mapping strategy has been determined, the next step is to get the GIS data prepared for use in the field. Data collector software for GPS and field controller software for surveying vary greatly between vendors and products, but many of these solutions allow data to be checked out from the GIS and copied to the mobile device. This generally requires that the feature classes from the geodatabase that will store the features to be mapped are added to the desktop software and then transferred to the field data collection software so that when data on a particular feature is collected, the attributes or fields are available for data to be entered during the mapping process. An example workflow for collecting plant and bench locations using Trimble and Esri products would involve adding the Plant Center and Bench feature classes of the ArcGIS Public Garden Data Model to a new map document in ArcGIS as layers, selecting the symbology, choosing the fields that store the information that will be collected in the field, checking out the data using the Trimble Positions Desktop add-in for ArcGIS, and then transferring the checked out data to the device for data collection using ArcPad with the Trimble Positions ArcPad extension. Please see the documentation for your data collection software to determine the workflow required for this step of the process.
COLLECTING DATA IN THE FIELDOnce all of the preparation activities have been completed, the next step is to begin mapping fea-tures in the garden. The process required for this will vary greatly depending on the data collection technique being used and the type of equipment. GPS data collection without a laser rangefinder can usually be accomplished by one person that operates the equipment. This scenario requires that the equipment be setup in an area with a clear view of the sky to let the GPS connect to satel-lites within view and setting the height of the GPS receiver or antenna before mapping can begin. Once the satellites are connected, point features may be mapped by placing the GPS receiver or antenna over the center of the feature, collecting GPS positions, and then entering attribute data for the feature. Line and polygon features will require that GPS positions be collected for each bend or corner of the feature to create vertices similar to tracing a feature using heads-up digitiz-

Guide to GIS56
ing. Once all the vertices have been captured then attribute information may be entered. Adding a laser rangefinder to the GPS equipment changes the process slightly since the combined equip-ment may be setup at a distance from the features being mapped by using a tripod as shown in Figure 7.8. Using a laser rangefinder with the GPS can be accomplished by one person, but if there are low hanging branches on a tree or other plant material in the way, it can be helpful to have another person to clear these obstacles, or better yet to hold a reflector in combination with a brush filter on the laser that will assure that other plant material does not interfere with the mea-surement. When a second person is added to the team, this person can relay attribute information to the equipment operator to expedite the mapping process. Please see the documentation for your equipment and software for more information on this step of the mapping process.
Surveying with a robotic total station proceeds in similar fashion as GPS except the beginning of each mapping period must be at a location with a previously surveyed monument. Once the instrument is in position, it must be leveled, instrument and prism heights entered, and initial coordinates entered as shown in Figure 7.9. From this location, features within a clear line of sight of the instrument can be mapped by holding a reflector or prism over the center of point features or the vertices of line or polygon features. Once the point or all of the vertices have been captured then attribute information may be entered. When all of the features visible from the current survey monument have been mapped a new survey monument must be established in a suitable location for mapping the next group of features. Traditional total stations will require one person to operate the instrument and another to position and hold the prism, but in this case the prism holder can relay information to the instrument operator. Please see the documentation for your equipment and software for more information on this step of the mapping process.
In both surveying and GPS mapping it is a good idea to keep a record of what has been mapped. This can be accomplished by marking mapped features on a printed version of an old collection map or by simply drawing and marking off features as the mapping progresses to create a sketch map. When mapping plants it also a good idea to take size measurements of each plant mapped. This may be a diameter at breast height (DBH), canopy spread, or height measurement, or all three. Record keeping and taking measurements are good tasks for the reflector or prism holder, and makes a two person team ideal.
Figure 7.8. GPS Data Collection with a Laser Rangefinder
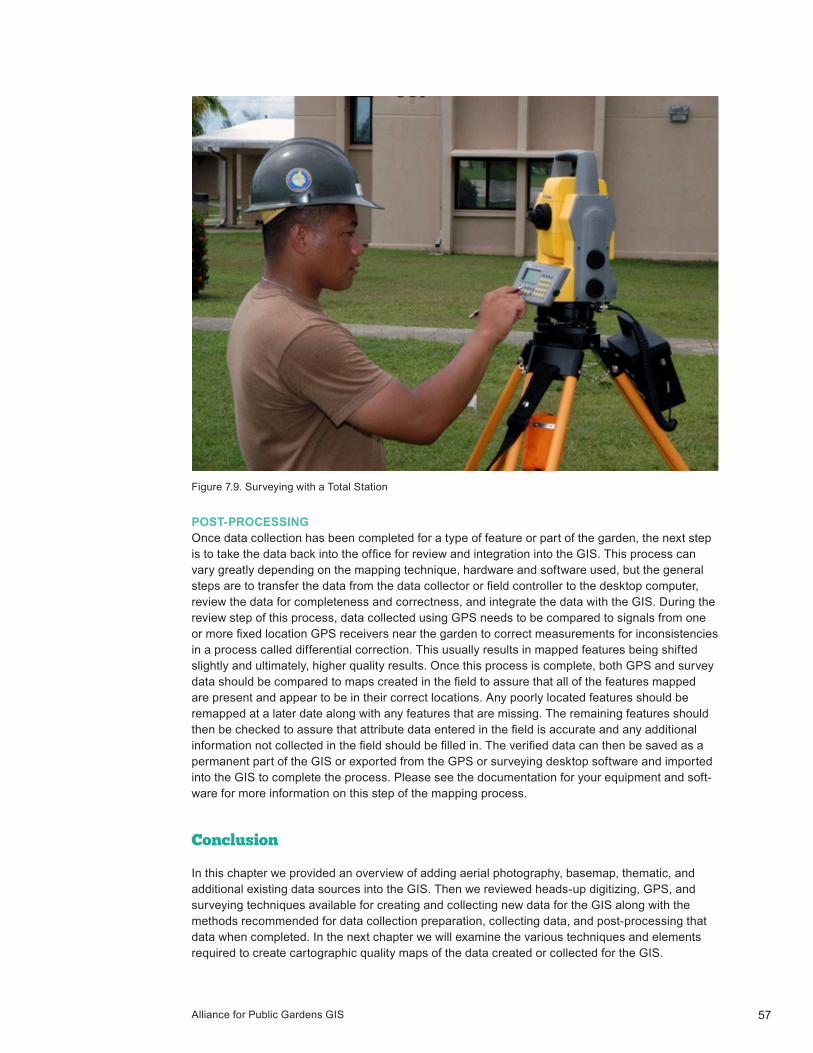
Alliance for Public Gardens GIS 57
POST-PROCESSINGOnce data collection has been completed for a type of feature or part of the garden, the next step is to take the data back into the office for review and integration into the GIS. This process can vary greatly depending on the mapping technique, hardware and software used, but the general steps are to transfer the data from the data collector or field controller to the desktop computer, review the data for completeness and correctness, and integrate the data with the GIS. During the review step of this process, data collected using GPS needs to be compared to signals from one or more fixed location GPS receivers near the garden to correct measurements for inconsistencies in a process called differential correction. This usually results in mapped features being shifted slightly and ultimately, higher quality results. Once this process is complete, both GPS and survey data should be compared to maps created in the field to assure that all of the features mapped are present and appear to be in their correct locations. Any poorly located features should be remapped at a later date along with any features that are missing. The remaining features should then be checked to assure that attribute data entered in the field is accurate and any additional information not collected in the field should be filled in. The verified data can then be saved as a permanent part of the GIS or exported from the GPS or surveying desktop software and imported into the GIS to complete the process. Please see the documentation for your equipment and soft-ware for more information on this step of the mapping process.
Conclusion
In this chapter we provided an overview of adding aerial photography, basemap, thematic, and additional existing data sources into the GIS. Then we reviewed heads-up digitizing, GPS, and surveying techniques available for creating and collecting new data for the GIS along with the methods recommended for data collection preparation, collecting data, and post-processing that data when completed. In the next chapter we will examine the various techniques and elements required to create cartographic quality maps of the data created or collected for the GIS.
Figure 7.9. Surveying with a Total Station

Guide to GIS58

Alliance for Public Gardens GIS 59
C H A P T E R E I G H T
Map PublishingNow that you have acquired, collected, and imported geographic information into a geodatabase, the logical next step is to analyze and present that information in visual form. The traditional approach of condensing data from a database into a series of graphs, pie charts, or summary tables loses the richness that geographic content actually provides. When data can be tied to a geographic location and represented in a well-crafted visual form, it reveals new and interesting characteristics about the mapped phenomenon.
The cartographic design process involves more than assembling data and graphical elements on a page. Maps are visual representations developed with a specific purpose and function in mind and constructed using materials and tools, much like those of an architect. Creating maps with the highest visual impact requires an understanding of the tools cartographers use to transform spatial data into stimulating modes of communication.
While previous chapters have highlighted the raw materials needed to construct a map, i.e. the geographic content, this chapter will focus on the tools used to build maps.
Map Form and Function
Matching a map’s form to its function requires a careful consideration of the purpose of the design, the intended audience, and the balance of legibility over comprehensiveness. As the cartographer, you should be acutely aware of how function informs design and the influence it will have on the map reader’s ability to comprehend, analyze, and interpret your map’s message.
Broadly speaking, maps can be classified as general purpose, thematic, or navigational, with each differing in their primary function and design form. Maps that serve as a reference library for geographic content and are focused on the location of different features rather than a certain theme are called general purpose or reference maps. On reference maps, no particular feature is emphasized. An example would be a general base map of a public garden with natural (contours, hydrography, vegetation) and cultural (buildings, pathways, administrative boundaries) features displayed with equal visual prominence.
In contrast, maps that stress the geographical distribution of a specific subject are referred to as thematic maps. In this case, the primary function of the map is to highlight a particular qualitative or quantitative theme over its geographical context such that the theme stands out above other supporting information.

Guide to GIS60
Maps showing the different collections across a botanical garden, the distribution of valley oak of different sizes, or weed density by garden section are all good examples. Many thematic maps also serve to persuade the map reader and can play an important role in decision making. A map intended for potential donors may highlight the working status of trails to convince the readers to donate to the garden so that the damaged trails can be repaired.
If a map is to serve as a tool for navigation, that is, its primary function is to aid in wayfinding, then it can be considered a navigational chart. Brochures, kiosks, and signs with maps that help guide on-foot travelers through a garden represent a form of navigational chart. Such maps are designed to orient readers to the physical space by emphasizing pathways, locations of interest, walking tours, and “you are here” symbols.
Tools for Building Maps
In order to present data in a meaningful way, a map must allow the reader to distinguish between different map features and intuitively understand their meaning within the context of the whole map. To achieve this goal, cartographers manipulate and combine symbols and visual variables like shape, size, pattern, orientation, or color to increase their clarity and enhance their interpreta-tion.
SYMBOLOGYSpatial data is presented on a map through the use of graphic symbols. The goal of the mapmaker is to effectively adjust visual variables (shape, size, pattern, or color) so that map data can be eas-ily read and interpreted.
Symbology is selected based on the format of the data (vector vs. raster, point vs. polygon), whether it is quantitative or qualitative, and the role the data should play in the cartographic nar-rative. A major consideration is whether the features are to be a primary focus or serve a second-ary, supportive role in the map. For example, a thematic map of donor benches might symbolize benches using larger point sizes with bolder colors while the surrounding pathways and buildings are represented with muted colors and thinner outlines. In this case, the donor benches are con-sidered primary symbols and designed to stand out from the background. In contrast, the path-ways and buildings serve a secondary role and are used to orient the reader while attracting little attention.
Primary and secondary symbology in maps are used to promote figure-ground relationships and create a visual hierarchy that is used to differentiate between map features given their relative importance to the map’s purpose. “Figures” are mapped features that advance in the visual field (thus are more important), while the “ground” includes lower-priority features that should recede. A well-designed figure-ground relationship separates different parts of a map to produce a natural order in the visual field. Such hierarchy helps map readers distinguish between different kinds of map data and understand what data layers are most important.
In the previous example, larger point sizes and bolder colors against a muted background helps to increase visual contrast and promote the map reader’s ability to see the most important features, e.g. donor benches. Successful map designers concentrate on the match between the nature of the data, the visual characteristics of the map symbols, and their importance to the message.
Symbol TypeAs mentioned previously, the choice of graphic symbols will vary depending on the data and its level of measurement. For raster data, the symbol options are limited to variations in color since the spatial unit is a single cell. However, for vector data the symbols can vary considerably as the choices can be tied to different feature dimensions or types. In GIS, map symbols are associated

Alliance for Public Gardens GIS 61
with a particular feature type: marker symbols, representing point features; line symbols, repre-senting arcs, routes, and outlines of polygonal data; and fill symbols, for filling polygons with solid color, gradients, or patterns. The map symbol you choose is largely influenced by the feature type; for example, the set of symbols and visual variables for points are generally different from those for line or polygon features.
Level of MeasurementGenerally, data are distinguished by whether they record differences in kind (i.e. qualitative; nomi-nal) or differences in magnitude (i.e. quantitative; ordinal, interval, ratio). Qualitative data can be differentiated and grouped into categories, but there is no logical order or hierarchy. For example, there is no natural order or ranking that can be derived from vegetation type. On the other hand, quantitative data describes relative magnitude. Elevation, temperature, road class, and other ranked data would be classified as quantitative in cartographic terms. The choice of symbolization for a particular type of data should align with its level of measurement and reflect how features are related to each other, either by type or magnitude.
Visual VariablesOnce the representation type and measurement associated with a feature are identified, then a symbol appropriate for that particular combination can be constructed using visual variables. Visu-al variables that are used for data display include shape, size, pattern, and color (hue, value, and saturation). Shape is provided by the symbol’s form, like a square or circle, while size is a change in its geometric dimensions. Both are well suited to point and line phenomena. Patterns are graphic marks used as symbols for areal and linear features, like hashed patterns or dashed lines. Hue refers to the quality that distinguishes one color from another, like red or blue; value refers to the relative lightness or darkness of that color; and saturation refers to the degree of grayness in the color. Combining visual variables provides a rich set of options from which a symbol can be created that, if done well, best represents the phenomenon being mapped.
Given the endless combinations available, symbols follow a continuum with choices on one end of the spectrum better for emphasizing qualitative and the other quantitative differences. Visual vari-ables that are best for emphasizing differences in type, or qualitative data, are: color hue, shape, and pattern. Visual variables that are best for emphasizing differences in magnitude, or quantita-tive data, are: size, color value, and color saturation.
As you can guess, there is an almost infinite range of choices in designing effective symbols using visual variables. For example, varying shape and color hue are by far the most common variables used to differentiate points qualitatively while color hue or pattern is often the best choice for lines and polygons.
For quantitative data, changes in symbol size, color value, or saturation can be used to distin-guish the rank or quantitative progression of features. Maps that differentiate by size based on a range of values are referred to as graduated (or proportional) symbol maps. In this case, larger symbols are used to represent higher data values. Graduated symbol maps use range-grading to group data into classes and symbol size to represent the order of change. Proportional symbol maps scale symbols by the data’s relative magnitude such that the exact quantitative relationships between features are maintained, i.e. a tree twice the size as another will have a symbol twice as large. For polygon data, graduated colors are most often used to distinguish changes in magni-tude.
In practice, multiple visual variables like shape, size, and color are also combined to create com-plex symbolization. For example, to show qualitative and quantitative differences among a single set of features, say plants, one may vary shape to differentiate by growth habit (tree or shrub) while simultaneously using size and color to emphasize changes in magnitude (canopy size). In this case, trees could be symbolized using circles whose size gradually increases and color

Guide to GIS62
changes from light to dark yellow while shrubs use light to dark green squares whose size also vary with increasing canopy size.
Symbols are not limited to abstract geometric shapes, like circles or squares. Nominal data, such as classes of plants, can be represented using symbols that more closely resemble the feature being mapped. Such symbols are referred to as mimetic symbols or pictograms and attempt to portray the character of the mapped feature graphically. Pictograms are especially useful where the feature being represented has unambiguous characteristics. In the previous example, we might replace the circle and square with pictograms that are more representative of branching patterns of trees and the bushy appearance of shrubs. Common libraries of abstract and mimetic symbols are available in GIS software when installed. Custom symbols can also be imported into the system or created using the available symbol editor.
The choice between a symbol that is either abstract or mimetic often depends on the map’s intended audience and their expected expertise on the subject. For a novice audience, appropriately chosen mimetic symbols may provide greater interpretative support, as their shape gives a clue to their meaning, whereas abstract symbols may serve an audience of experts who want to concentrate on the data relationships portrayed. Pictogram should be used carefully and conservatively as too many intricate icons can overwhelm the reader and confuse the map.
COLORBesides the geographic content that constitutes the map, color is one of the most important aspects of cartographic design. In map design, color plays a significant role in promoting figure-ground relationships and visual contrast. The colors used to display particular types of data can affect how they are interpreted and alter the feel of the map. For example, warm colors (magenta, red, yellow, orange) tend to make features stand out or appear to advance forward while cool colors (blue, cyan, green, violet) make features recede or appear to move back. Some color pairs are harmonious (adjacent on the color wheel) while others are complementary (opposite on the color wheel) and promote tension when paired together. Variations in the color of a feature or its surroundings can change the map reader’s sense of the feature represented. This is an artifact of the way the human brain interprets color. So while it opens design options up, color can also complicate a map.
Color ModelsFor the creation of different colors, there are three major color models used in GIS software. The most common is the RGB (red, green, blue) color model. The RGB model is an additive color system where any particular color is formed by superimposing the relative intensity (emitted light) of the three primary colors red, green, and blue. Each of the three colors can vary in intensity from 0 to 256 and the three can be combined to produce a palette of 16.8 million different colors (256 x 256 x 256). For example, black is produced when all three primaries are coded as zero (no inten-sity) while white is produced when all three primaries are set to 255 (full intensity).
Cartographic Representations
Symbology in ArcMap has an additional option to use cartographic representations: rules for symbolizing geographic features that are stored as a property of the feature class in the same database as the features, thus allowing the symbology to persist across proj-ects.

Alliance for Public Gardens GIS 63
The complement to the RGB model is the CMY(K) model, based on the primary colors cyan (C), magenta (M), and yellow(Y) with the addition of black (K) for true black ink in printing. The specification of a color in the CMY model is based on percentages and behaves opposite to that of the RGB model, because the CMY model uses reflected versus emitted light. In CMY, white is produced when all three primary colors are coded as zero, while black results from a full combina-tion of the three primary colors. Generally speaking, RGB is used for maps intended to be viewed on a monitor and CMYK is used for maps intended to be printed.
One attractive alternative to the RGB/CMY(K) color space that is the HSV color model, which uses the three components of color (hue, saturation, and value) to specify colors. Hue is what we normally call color, i.e. green is a different hue than blue. It is also defined as the dominant wave-length of light making up that color. Value is the perceived lightness or darkness of a color and is determined by the amount of light that reflects from a color. Saturation is a measure of the pure-ness or vividness of a hue. Conceptually, it is the amount of grey in a color, with lower saturation values producing colors more muddy and greyish.
HSV is especially good for cartographic design because working directly with the visual compo-nents of color is more intuitive than the other color models, which are designed for the technology of production.
Color ChoiceColor conventions on maps vary widely with few established cartographic standards, but there are some basic principles to follow when deciding how to assign colors to features. For recognizable features there should be a relationship between the color chosen, the data it is portraying, and the expectations of the map reader. For example, water is universally represented in blues, forested areas in green, bare lands in browns, and deserts in yellow. Beyond that, choice should be fo-cused on presenting data clearly and in ways that parallel the logical structure of the map.
Qualitative color schemes primarily use hue to represent categorical differences in map features. The goal is to emphasize differences by using unique hues without suggesting that data is ordered in any particular way. It is especially important that the qualitative color scheme maintains similar contrast with the background of the map to avoid inadvertently misrepresenting one category as more important than another. For example, a map reader may mistake features symbolized with a light hue next to features of darker hues as less important when mapped on a white background. This is a function of how the human brain perceives certain color combinations. The simplest way to avoid this is to ensure that the hues maintain a similar contrast with the background color of the map by also controlling the value and saturation of each color. If you are mapping more than five qualitative categories, you will have to access a greater range of colors by also taking advantage of saturation and value along with hue.
Experienced cartographers tend to use highly saturated colors sparingly in much of their work since more vivid colors will stand out strongly from other features on the map. However, if small polygons need to be emphasized then increased saturation can help advance those features in the map (remember figure-ground relationships). For large areas, colors of lower saturation tend to work best; otherwise the areas will overpower the map’s appearance.
Color value and saturation can be used to suggest quantitative differences and are frequently used to represent data on an ordinal or numerical scale. Cartographic convention associates lower values with lighter colors and higher values with darker colors. In sequential color schemes the emphasis is on variation in value (lightness) as opposed to hue since changes in hue imply qualitative differences. Single-hue themes use a single color but vary value and/or saturation to produce a sequential color scheme, such as light purple to dark purple, while multi-hued themes progress from a light value of one hue to a darker value of another, e.g. light yellow to dark blue.

Guide to GIS64
Diverging schemes are helpful for demonstrating different extremes in data by combining two se-quential themes at a midpoint that might represent some minimal, average, or threshold value. In this scheme, light colors tend towards the midpoint of the scheme and the two extremes towards diverging darker hues. Diverging schemes can employ a symbol to represent a critical or “no change” class or this can be dropped to create a sharp critical break between extremes.
When designing quantitative schemes, the number of visual steps or classes is also an important consideration. Research has shown that the human brain has difficulty differentiating between more than seven (plus or minus two) values of the same hue. This gives rise to the guiding prin-ciple that, at least for single-hue themes, quantitative color schemes should have fewer classes, perhaps four to six. As color perception is strongly modified by size and surrounding color, such a convention is particularly appropriate for quantitative maps with both large and small features, since larger areas of color tend to dominate visual perception.
Choosing the “right” color combination for a map is not a trivial issue and depends on many things. While some colors combinations can adversely affect map interpretation, there are other combinations that create nice effects which are complimentary and pleasant to look at, or accen-tuate figure and subdue background. As any cartographer will tell you, color choice can be a very time-consuming process, but it is rewarding when an especially beautiful map is produced.
ResourcesColorBrewer2.org provides an intuitive web-based tool for choosing appropriate color schemes for qualitative and quantitative data in maps, including sequential and diverging color schemes. Adobe Kuler is a general purpose color tool from Adobe that has thousands of community-submit-ted color themes to choose from and the ability to create custom themes for a map (or any other graphic project). Both provide recommendations specified in different color models that can be directly translated to GIS or graphics design software. Two recommended texts that engage color and mapping in detail are Allan Brown and Wim Feringa’s Colour Basics for GIS Users (2002) and Cindy Brewer’s Designing Better Maps (2005).
TYPOGRAPHYAll maps are made of symbols with colors but no map can be understood without some form of text on it as well. Type is used both within the mapped area (e.g., as map labels) and within other marginal map elements (e.g., in the title and legend).
Type VariationLike visual variables in symbology, type characteristicssuch as typeface, form, size, and color vary according to the function and purpose of the type. Typeface is the personality of the map and refers to the design character of the type itself (e.g. Arial or Times New Roman) and to the font, or character set, including alphanumeric and other punctuation characters. There are several ways of grouping fonts but the most common way of classifying them is based on the design characteris-tics of the individual letters. Three main groups of typefaces are serif, sans serif, and display fonts. Serif fonts have finishing strokes at the end of most letters while sans serif fonts do not have these finishing strokes. Display fonts, which include decorative letterforms such as script and calligra-phy, have limited use in map design since they can be difficult to read and draw undue attention to themselves.
A basic guideline with regards to the choice of fonts is that a single map should have relatively few fonts, usually no more than two; one serif and one sans-serif. Fonts can start to interact and clash if too many are included, resulting in a confusing and amateur-looking map. One style convention that cartographers have developed over time is using serif fonts for labeling physical features (e.g. rivers) and sans serif fonts for cultural features (e.g. cities). Fonts should complement each other to maintain harmony while remaining legible but relatively inconspicuous.

Alliance for Public Gardens GIS 65
Variations in type form, including type weight (bold, regular, light), type width (spacing), type style (Roman, italic), and type case (lower, upper, mixed) are also used with some basic cartographic rules in mind. For example, type weight or size can imply quantitative differences in map features, e.g. bold or larger sizes for city names and regular or smaller sizes for township names. However, most cartographers use bold judiciously if at all and defer to size variation, since bold type implies significance and can inadvertently draw too much attention to text. Another cartographic conven-tion is the use of an italicized type style for labeling hydrological features (rivers, water bodies, glaciers).
Type case can also be used as a way to emphasize features. In general, uppercase fonts denote a distinction between different-sized features and are often used to label areas of large extent such as mountain ranges. Paired with exaggerated spacing between characters and words, uppercase lettering can be used to great effect to emphasize features of large areal extent. Nonetheless, uppercase letters are more difficult to read in general so cartographers tend to use them carefully and sparingly.
Type color can also be varied for the labeling of different map features. It is common to use hues for labels that are similar to the mapped features, such as blue labels for blue rivers, or to em-phasize quantitative differences like gray labels for villages and black labels for cities. But when considering color choice, the level of visual contrast between the text, the mapped feature, and map background should be carefully assessed. If a map background contains a variety of hues (as many complex maps would likely have), color choice for labeling a particular feature should clearly indicate the feature it refers to while still maintaining legibility and visual hierarchy. Labels should remain unobtrusive elements.
To avoid potential conflicts, cartographers will sometimes turn to using text effects, such as halos and shadows. Halos surround text with a uniformly-sized color while shadows are an offset graph-ic copy of the text rendered in a contrasting color. Halos can make the text more legible against a background and thus easier to read. Typically, you will want the halo or shadow to be as unobtru-sive as possible. Creating effective halos that match multiple backgrounds can be a considerable challenge and at times you may find greater success modifying the color of polygons, lines, and type directly to achieve the desired effect. ArcGIS also provides an alternative to halos called symbol-level masking that can be especially useful in such situations.
Type PlacementWhen considering the design and placement of text on a map, we must recognize the main types of labels found on a map. Map labels can generally be distinguished as either dynamic or an-notation. Since label placement can be considered one of the most time consuming aspects of cartographic design, cartographers have expended a great deal of effort in trying to automate the process. Dynamic labeling uses algorithms to automatically generate labels based on rules and relationships that determine the best location to place a label. For example, properties of a “trail” feature class can be set to ensure that all labels are centered on a trail using 8-point Candara font with 1-point halos and separated from other competing labels by 20 points. Setting these properties and placement rules globally is much more efficient than designing and placing labels individually.
However, automated label placement poses a number of difficulties. Labeling algorithms must strive to place text so that labels are always legible, do not overlap, are clearly associated with the feature they represent, and still adhere to standard cartographic conventions. As competition for space intensifies, automated labeling routines struggle to meet all these criteria and their effi-ciency quickly breaks down. This is especially true when conflicts have no logical solution (at least programmatically speaking) or exceptions to the rule make sense (i.e., that what is ‘best’ in one context is not necessarily the ‘best’ in all contexts). Dynamic labels cannot be selected or adjusted individually to resolve these case-by-case issues.

Guide to GIS66
If the final results from dynamic labeling engines are not satisfactory, an attractive alternative is the use of stored annotation. Converting dynamic labels to stored annotation freezes the place-ment and properties of the label by storing the position and type characteristics with the label itself. This allows for the refining of individual labels. Annotation can be stored as part of a map (map annotation) or within a geodatabase as a separate feature class (geodatabase annotation). The latter is resoundingly the best choice if the annotation is to be used across multiple mapping projects. Both forms of annotation will generally render faster than dynamic labeling as the pro-gram does not need to do the conflict analysis for every screen redraw.
Best practices for labels that have been developed over time include:• Label points to the right but slightly above the point feature. In cases of conflict, then the
sequence of preference is below right, above left, below left, centered above, centered below. Label lines above the feature if possible and parallel to the general trend of the line. To improve legibility, labels are best placed in a relatively flat section where the text can be easily read. Repeat labels for longer features. Text for lines should never be placed upside down. Interestingly enough, dynamic labeling engines have a particularly difficult time resolving label placement with respect to linear features.
• Label areas horizontally or along the polygon’s longest axis. In the latter, curving the text along splines and increasing letter and word spacing so that it stretches across the whole area can improve appearance.
• Where possible, avoid placing type over other graphical marks or map components, like linework. The problem of conflicting type and linework can be mitigated using halos and symbol-level masking.
ResourcesA useful web-based tool for exploring design and placement of text on a map is Typebrewer. The website allows users to experiment with variations in typography to assess the general impact that different approaches have on the overall appearance of a map. For those who want to learn more about the principles of map typography should also consult Cindy Brewer’s Designing Better Maps (2005) or Thematic Cartography and Geographic Visualization, 3rd Edition (2009) by Terry Slocum and colleagues.
MARGINALIA AND OTHER ELEMENTSA complete map design includes elements beyond the symbolized and annotated features. Mar-ginal elements like the legend, scale bar and north arrow are situated along the margins of the mapped area and provide important contextual information to the map reader.
LegendThe map legend explains the language of the map by providing definitions for the symbols used. Legends should be placed in open, inconspicuous areas in an effort to minimize clutter and reduce tension with the remainder of the map. Wording, arrangement and alignment of legend content should be designed with clear and concise goals. Data in the legend should match exactly the way it appears on the map. Symbols should not be bigger or smaller, of different orientation, or different color. If a symbol represents one feature on the map, it should be singular in the legend (a point symbol representing a single tree should be labeled in the legend as “Tree”, not “Trees”). Consistency is important here as the legend is critical for conveying the distinctive characteristics of the map.
While ArcGIS provides basic tools for generating legends using wizards, many mapping proj-ects will require you to create custom legends. To do so requires converting existing legends to graphics, ungrouping, and modifying individual elements. A drawback of this strategy is that the conversion process severs the link between the data and legend, i.e. modifications in the map will no longer be reflected in the legend automatically. In this instance, updates to the legend will need to be done manually when features and symbology are altered in the map. If creating custom

Alliance for Public Gardens GIS 67
legends, it is recommended to do so at the end of the map design process to reduce the number of manual updates required.
Scale and Direction IndicatorsMap scale and directional indicators are elements that are common but not necessary on all maps. These marginal elements should be included only if distance and direction are important or are unclear in a particular map. When covering large geographic regions using particular map projections, it is possible that the map scale and direction can vary across a map. If they vary enough, it may be wise not to communicate scale or direction on the map at all.
When appropriate, map scale can be communicated three different ways: graphically (e.g. a scale bar), as a representative fraction (absolute scale), or stated textually. The modern convention is to use the graphic method since it will remain correct when a map is reproduced at a different size than the original (scanned, shrunk, enlarged, etc.). Representative fractions (e.g. 1:24,000) and statements (e.g. one inch = 200 feet) are not useful in these situations due to the fact that the change in a map’s size alters the stated relationship.
If using scale bars, they should be simple and unadorned. In many maps there only needs to be two divisions with a number indicating the distance between the two endpoints. No subdivisions are necessary either since the scale bar is intended as a general reference to geographic extent in these maps. If the map’s primary purpose is to measure distance, like navigational charts, then a more detailed scale bar with subdivisions and distance units is appropriate. In either case, use well-rounded numbers, e.g. 1, 5, 10, etc., that can easily be used by the map reader and keep the layout form simple and compact. The font used for the scale should also be small and conform to the other typefaces chosen for the map.
A north arrow is cartographic convention that is not needed on all maps. If the map’s primary purpose is navigation or its orientation has been rotated so that north is not up, then including a north arrow is an appropriate addition. Like the scale bar, its size should not be dominant; a plain style with small dimensions is preferred. Often the north arrow will be situated next to or centered above the scale bar for convenience, but decisions on placement can be based on available space and the need to balance layout.
A common addition to maps where finding location is of concern is the use of reference grids, especially in large-scale maps. A reference grid is a simple network of vertical and horizontal lines that form squares of equal dimensions across a map. Public gardens use grids on plant collection maps to locate plants in the index. Grids also help with scale for drawing in new features in the field. Some gardens have grids in the garden denoted with survey monuments; these are usually depicted on collection maps as well.
Conclusion
This chapter described the basic process of cartographic design and explored the tools used by cartographers to accurately and effectively convey information to the map reader. This included how to manipulate symbols and visual variables to create effective and intuitive symbology; how to successfully annotate features to endow meaning to mapped features; and how to use marginal supporting elements to complete a map composition. Remember, cartography is an enterprise of storytelling and the appearance and arrangement of map elements constitute the context, spine, and structure of the narrative. A well-crafted map can be compelling, engaging, and informative and the secret is in the careful attention to design.

Guide to GIS68
Selected References
1. Brown, Allan and Feringa, Wim. (2002). Colour Basics for GIS Users.
1. Brewer, Cindy. (2005). Designing Better Maps.
1. Slocum, Terry and colleagues. (2009). Thematic Cartography and Geographic Visu-alization, 3rd Edition.

Alliance for Public Gardens GIS 69
C H A P T E R N I N E
Disseminating Your DataOne of the most important capabilities of GIS is the ability to publish and disseminate large amounts of geographic information to large numbers of people. The medium for sharing informa-tion can take many forms and the particular choice is tightly coupled with the demands and techni-cal capabilities of the intended audience.
The traditional way of distributing spatial data has been through printed publications. The demand for printed output has played a significant role in GIS and print maps continue to serve a variety of organizational needs. However, sharing information on the Web has drastically improved the accessibility and usability of geographic content. Digital representations and delivery of map sare quickly replacing traditional hard-copy reproduction and opening many new opportunities. The Internet is making it possible to not only distribute maps to a larger audience but also introduce new ways of visualizing and interacting with data in the display.
Print Reproduction
Maps designed for print media, also known as hard copy maps, are printed or otherwise trans-ferred onto either paper or a synthetic material (e.g., plastic) using ink or toner. Print reproduction serves an important role in the communication of an organization’s geographic content and can support a range of business needs, from marketing to maintenance. Hard-copy products range from one-off maps to map books to highly detailed large-format products. The choice of format is ultimately tied to the demands of the intended audience and how that map product will be viewed by the end user. In this section, we will discuss the production of non-standard print products rel-evant (and useful) to the public garden setting, namely map books and oversize maps.
MAP BOOKSA map book is a collection of map pages based on an index grid that are printed or exported together as a single document (think of a Thomas Guide road atlas). Many of the pages contain maps, but other pages may contain supporting text, tabular information, tables of contents, or title pages. Map books are commonly used by firefighters, assessors, utility workers, and many others that regularly rely on locating features in the field to do their jobs. In public gardens, map books can be used by horticulturalists and other staff charged with the maintenance or management of collections and other assets on the grounds. The documents can result in increased job effec-tiveness by making it easier to locate specific features while in the field. When deploying global positioning systems or other mobile mapping devices is cost prohibitive, printed map books can serve as an attractive alternative.

Guide to GIS70
In ArcGIS, creating a map book is a relatively simple process. Data-driven pages use the features from an index layer to create a series of layout pages from a single map. The index layer is a fea-ture class used to define the range of custom page extents or areas of interest (AOI), just like the index used in a road atlas or similarly indexed document. The index layer can represent a regular grid, as often seen in road atlases, or be based on irregular extents defined by point, line, or polyg-onal features. Regardless the system, a collection of software routines is then used to iterate over the index and generate a series of reference maps.
A benefit to using data-driven pages is that a single layout defines the map composition for every page. Static elements (e.g. position of map elements) stay the same on each page of the map series while dynamic parts of the layout (e.g. geographic extent, map scale, scale bar, and text) are allowed to change. This can result in a significant reduction in effort since map design and composition is completed only once. Further efficiencies can be found by developing custom tools using the arcpy.mapping Python module. The module provides a scripting framework to extend the capabilities of data-driven pages and automated map production through the programmatic manipulation of map documents, map layers, and/or print and export procedures.
The toughest part of building a map book is developing a consistent tiling scheme and choos-ing and symbolizing features so that they are easily interpreted by end users. Individual maps should cover a sensible area and scale, with slightly overlapping neighboring tiles. Adjacent tiles should be labeled and referenced in the margins to facilitate easy navigation away from a tile. The maps should display enough data to be useful in the field with symbology and labels designed to maximize readability and legibility. Those interested in more detailed instructions or general guid-ance on building map books should consult the myriad of tutorials provided by Esri on the subject, including the ArcGIS Help system and training options under the Esri Virtual Campus.
OVERSIZEMap books and other standard print maps are useful for many situations, but it is often easier to convey a message using oversize (or large-format) maps. Large-format prints, or posters, can serve a variety of purposes in a garden setting, supporting research, management, marketing, and education. For example, large-format prints might be used to present the results of research and data analysis, as tools for exploring data and evaluating the condition of assets (i.e. searching for patterns that should be investigated), or as plans for organizing donors and increasing public support. Whatever the role, the goal is to promote visual thinking and communication. In particu-lar, the oversize format opens design options and often helps convey the intended message more easily.
Oversize prints that are useful to public gardens might include summary posters created by sci-ence and research staff to effectively communicate their work to professional colleagues; detailed maps used by horticulturalists and grounds staff to assess the distribution of scientific collections or evaluate sections of the utility infrastructure; marketing posters intended to increase a garden’s visibility or to promote unique events; or interpretive signs or maps to enhance an educational program.
Producing an oversize map can be rather costly and time consuming. Large-format print produc-tion requires specialized hardware, paper, and ink as well as dedicated staff time to manage both printing activities and hardware maintenance. However, if you have a regular need to print over-size documents (over two feet wide), investing in a wide-format printer can be a great choice. The regular use of professional production houses and copy centers can be expensive such that build-ing in-house capacity can be beneficial in the long term. While purchasing a large-format printer has a high initial overhead, the low per-page cost can lead to considerable savings in the end. SOME TECHNICAL CONSIDERATIONS
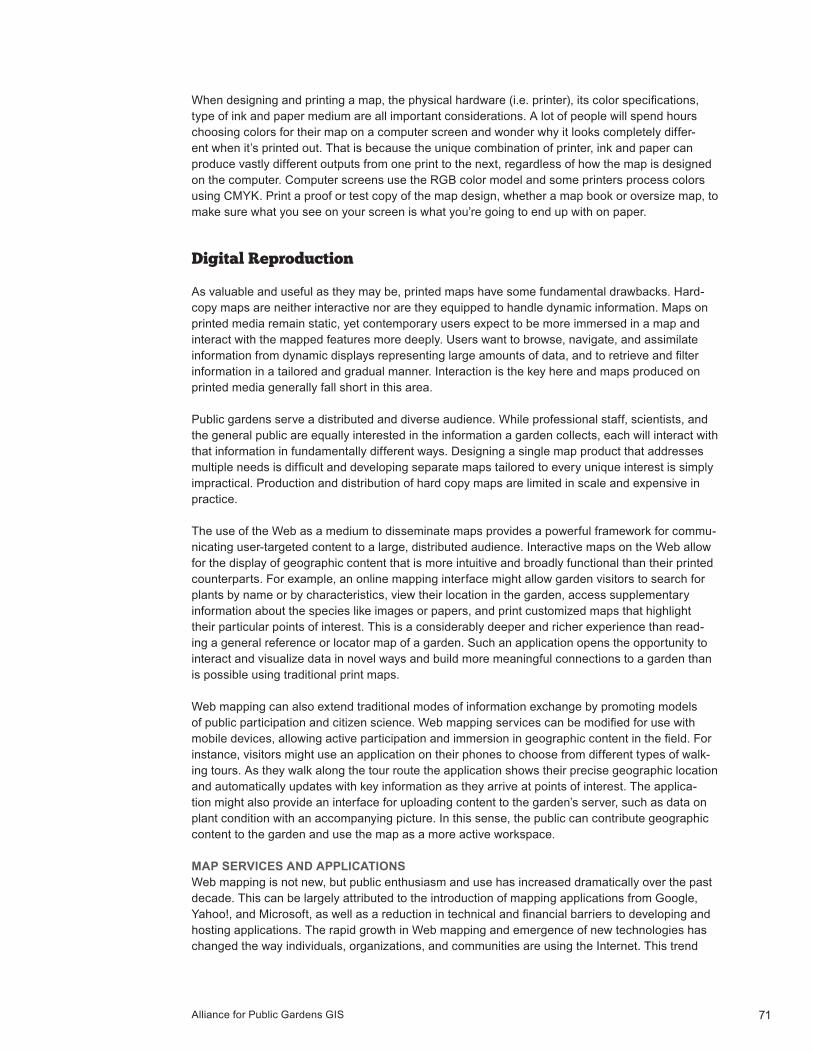
Alliance for Public Gardens GIS 71
When designing and printing a map, the physical hardware (i.e. printer), its color specifications, type of ink and paper medium are all important considerations. A lot of people will spend hours choosing colors for their map on a computer screen and wonder why it looks completely differ-ent when it’s printed out. That is because the unique combination of printer, ink and paper can produce vastly different outputs from one print to the next, regardless of how the map is designed on the computer. Computer screens use the RGB color model and some printers process colors using CMYK. Print a proof or test copy of the map design, whether a map book or oversize map, to make sure what you see on your screen is what you’re going to end up with on paper.
Digital Reproduction
As valuable and useful as they may be, printed maps have some fundamental drawbacks. Hard-copy maps are neither interactive nor are they equipped to handle dynamic information. Maps on printed media remain static, yet contemporary users expect to be more immersed in a map and interact with the mapped features more deeply. Users want to browse, navigate, and assimilate information from dynamic displays representing large amounts of data, and to retrieve and filter information in a tailored and gradual manner. Interaction is the key here and maps produced on printed media generally fall short in this area.
Public gardens serve a distributed and diverse audience. While professional staff, scientists, and the general public are equally interested in the information a garden collects, each will interact with that information in fundamentally different ways. Designing a single map product that addresses multiple needs is difficult and developing separate maps tailored to every unique interest is simply impractical. Production and distribution of hard copy maps are limited in scale and expensive in practice.
The use of the Web as a medium to disseminate maps provides a powerful framework for commu-nicating user-targeted content to a large, distributed audience. Interactive maps on the Web allow for the display of geographic content that is more intuitive and broadly functional than their printed counterparts. For example, an online mapping interface might allow garden visitors to search for plants by name or by characteristics, view their location in the garden, access supplementary information about the species like images or papers, and print customized maps that highlight their particular points of interest. This is a considerably deeper and richer experience than read-ing a general reference or locator map of a garden. Such an application opens the opportunity to interact and visualize data in novel ways and build more meaningful connections to a garden than is possible using traditional print maps.
Web mapping can also extend traditional modes of information exchange by promoting models of public participation and citizen science. Web mapping services can be modified for use with mobile devices, allowing active participation and immersion in geographic content in the field. For instance, visitors might use an application on their phones to choose from different types of walk-ing tours. As they walk along the tour route the application shows their precise geographic location and automatically updates with key information as they arrive at points of interest. The applica-tion might also provide an interface for uploading content to the garden’s server, such as data on plant condition with an accompanying picture. In this sense, the public can contribute geographic content to the garden and use the map as a more active workspace.
MAP SERVICES AND APPLICATIONSWeb mapping is not new, but public enthusiasm and use has increased dramatically over the past decade. This can be largely attributed to the introduction of mapping applications from Google, Yahoo!, and Microsoft, as well as a reduction in technical and financial barriers to developing and hosting applications. The rapid growth in Web mapping and emergence of new technologies has changed the way individuals, organizations, and communities are using the Internet. This trend

Guide to GIS72
has begun in the public garden setting with organizations like the UC Davis Arboretum and Arnold Arboretum of Harvard University developing innovative, collaborative applications that are funda-mentally changing how people interact with their living collections data. Here we will explore the basic technology behind these applications and the diversity of options available to public gardens interested in adopting a Web mapping framework.
Although static maps displayed as an image on a Web page are quite common, they aren’t techni-cally Web applications at all. Web mapping is really focused on the development of interactive applications and can be defined as the process of designing, implementing, generating, and deliv-ering dynamic maps on the Web. While they vary in implementation and technical specifications, almost all Web-based maps are viewed through a Web browser or other software application. Map services are special Web services that extend the World Wide Web infrastructure by providing the means for software to remotely communicate geographic content with other software applications using standard Web technology. Map services can serve pre-rendered or dynamic map images, raw spatial data, or specialized functionality for geoprocessing like routing and other analyses.
Since Web mapping development is an enterprise driven by Web technology, it is intimately con-nected to Web architectures and protocols. The core functionality behind a map service is based on client-server technology, where georeferenced information is exchanged between a remote server and a client computer over a network. Under the basic client-server model, data exchange occurs when a request from software installed on a client computer (e.g. a Web browser) is re-ceived on a remote server and an installed application or service (e.g. Web/GIS server) responds back to the client with the requested information (Figure 9.1). The standard components used to create, publish, and access a map service include a Web server for receiving requests from cli-ents using standard Web protocols (e.g. Apache or Microsoft Internet Information Services (IIS)), a Web mapping server for hosting and interfacing with available map services (e.g. MapServer or ArcGIS for Server), and a Web mapping application to request and access content and func-tionality provided by the map service (e.g. a Web page). Under this basic design, map services provide an efficient and effective approach to serving spatial data, functionality, and maps over the Internet.
The current market for developing map services and serving Web maps is rich with options. There are numerous platforms and development frameworks available, with each differing in cost (mon-etary and labor) and functionality. On the client side, development languages such as JavaScript, Adobe Flex, Silverlight, ActiveX controls, and Java Applets are widely used to consume map ser-vices and develop interactive Web mapping applications. On the server side, languages like .NET, PHP, Perl, and Python are often used in combination with open source or proprietary Web and GIS server platforms to serve mapping applications on the Web. Design and functionality of an ap-plication is largely constrained by which Web mapping architecture is adopted and the framework used for development. For example, Map Server, GeoServer and MapGuide are free platforms that are fairly popular in the open source community. While affordable and relatively customizable, development can be tedious given how map construction (layers, cartography) and application code are developed under these frameworks. Platforms like MapServer excel at rendering spatial data as simple Web maps with display and query capabilities, but for developing more advanced applications with geoprocessing (analysis) or feature editing they tend to fall short.
An attractive alternative to open source software is ArcGIS for Server, Esri’s server environment for sharing GIS resources on the Web. ArcGIS for Server is a full-featured GIS system that al-lows for an organization to expose all of its spatial data, maps, and geoprocessing tools as Web services to be consumed by desktop and mobile platforms. When already invested in ArcGIS at the desktop level, ArcGIS for Server is a very robust option for delivering Web maps since it seam-
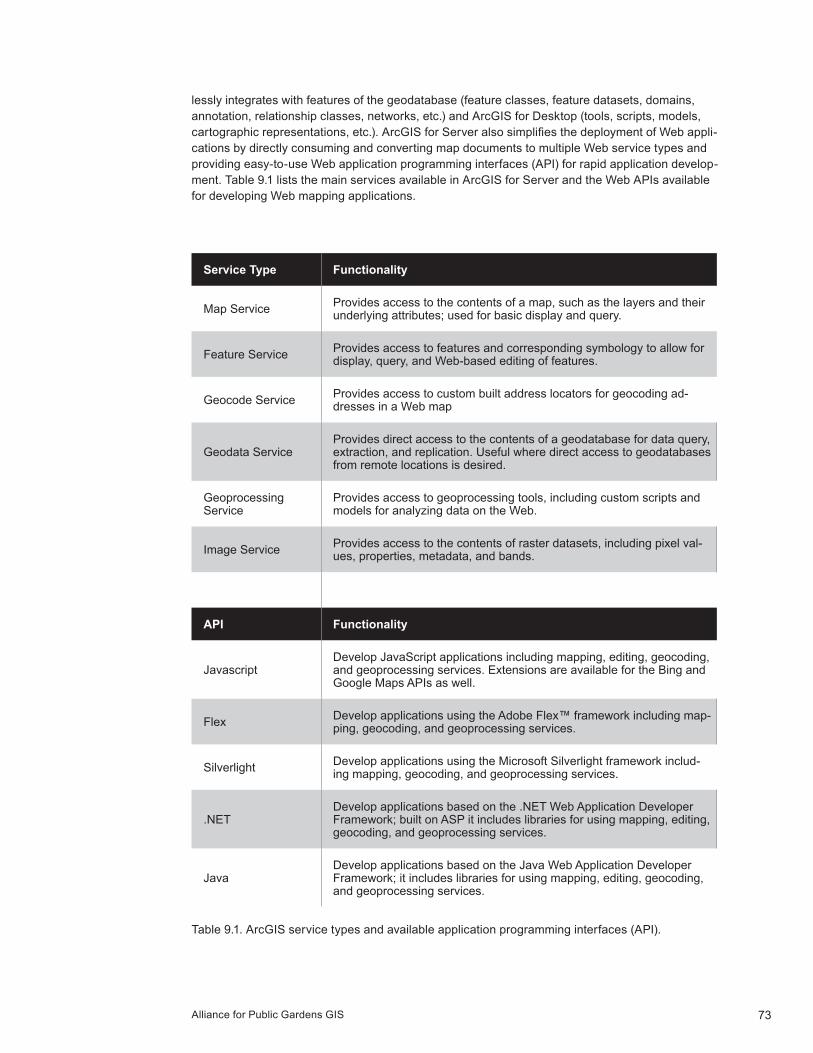
Alliance for Public Gardens GIS 73
lessly integrates with features of the geodatabase (feature classes, feature datasets, domains, annotation, relationship classes, networks, etc.) and ArcGIS for Desktop (tools, scripts, models, cartographic representations, etc.). ArcGIS for Server also simplifies the deployment of Web appli-cations by directly consuming and converting map documents to multiple Web service types and providing easy-to-use Web application programming interfaces (API) for rapid application develop-ment. Table 9.1 lists the main services available in ArcGIS for Server and the Web APIs available for developing Web mapping applications.
Service Type Functionality
Map Service Provides access to the contents of a map, such as the layers and their underlying attributes; used for basic display and query.
Feature Service Provides access to features and corresponding symbology to allow for display, query, and Web-based editing of features.
Geocode Service Provides access to custom built address locators for geocoding ad-dresses in a Web map
Geodata ServiceProvides direct access to the contents of a geodatabase for data query, extraction, and replication. Useful where direct access to geodatabases from remote locations is desired.
Geoprocessing Service
Provides access to geoprocessing tools, including custom scripts and models for analyzing data on the Web.
Image Service Provides access to the contents of raster datasets, including pixel val-ues, properties, metadata, and bands.
API Functionality
JavascriptDevelop JavaScript applications including mapping, editing, geocoding, and geoprocessing services. Extensions are available for the Bing and Google Maps APIs as well.
Flex Develop applications using the Adobe Flex™ framework including map-ping, geocoding, and geoprocessing services.
Silverlight Develop applications using the Microsoft Silverlight framework includ-ing mapping, geocoding, and geoprocessing services.
.NETDevelop applications based on the .NET Web Application Developer Framework; built on ASP it includes libraries for using mapping, editing, geocoding, and geoprocessing services.
JavaDevelop applications based on the Java Web Application Developer Framework; it includes libraries for using mapping, editing, geocoding, and geoprocessing services.
Table 9.1. ArcGIS service types and available application programming interfaces (API).

Guide to GIS74
Web APIs provide the added advantage of creating mapping applications on various programming platforms (Javascript, Adobe Flex, Silverlight, Java, and .NET) regardless of the map service(s) they reference. This simplifies the development process by separating map services from applica-tion development thus allowing for the “reuse” of map content and code in multiple Web maps. The availability of these APIs also enables the easy “mashup” of other data and services on the Web to create Web applications that are rich in content. For example, a Web map showing the collections in a public garden could incorporate other services to enhance the overall appearance and func-tionality of the application. In this case, a base map hosted by Esri could be integrated with the garden’s collections map service as well as the Flickr and Wikipedia APIs to create an application that allows a visitor to pinpoint plant specimens (from the garden) overlaid on aerial imagery (from Esri) and retrieve photos (from Flickr) and additional descriptions of that plant (from Wikipedia). In this sense, the Web application is creating a completely new service by combining content (or services) from multiple sources. Mashups of this sort are popular fixtures on the internet, due in part to the increased availability and popularity of open APIs by Google and other related technol-ogy vendors.
The Web mapping applications developed and hosted by the Arnold Arboretum of Harvard (Col-lection Researcher) and the UC Davis Arboretum (Collection Mapper) are excellent examples of ArcGIS for Server-based Web applications. Both application reference multiple map services hosted by their respective gardens and are programmed using one of the available APIs pro-vided by Esri, namely the ArcGIS Adobe Flex API and .Net Application Development Framework, respectively. The resulting applications provide a unique (and customizable) experience for visitors wanting to explore their living collections. For example, a researcher might search the collections as part of a larger scientific study, taking advantage of built-in links to scientific papers and other content related to a target specimen. A casual visitor, on the other hand, might create a custom walking tour by locating specific plants in the arboretum and printing a custom map that highlights their particular points of interest. Regardless of the user, the applications offer novel ways to inter-act with and visualize the plant collections otherwise impractical using traditional methods.
The possibilities for Web maps in public gardens are infinite and go beyond curating collections or public display. Applications for searching and downloading data, spatial analysis, real-time visual display, or collaborative mapping are simple extensions that are reasonably attainable using the ArcGIS for Server platform. For example, functionality could be incorporated that identifies sensitive areas using data on plant specimens, site characteristics (topography, soils, hydrology, temperature), and man-made infrastructure (buildings, paths, hardscape). Results based on such an analysis could be used as a decision support tool for prioritizing mitigation strategies. Real-time Web maps (i.e. maps that update at regular intervals) might also be developed that display water use based on sensor data collected at specific junctions along a utility network. Facilities staff could use such an application to aid in the management of a garden’s infrastructure and rectify potential water usage problems. In addition, an interface for collaborative mapping might be devel-oped that includes the ability to upload or directly modify content in a garden’s GIS system, such as plant condition or supplementary content like pictures. The options are practically unlimited and ultimately a function of a garden’s need and ability to conceive and implement a Web-based solution.
While the previous topics all require that the application be managed and developed by a garden, or someone contracted to do so, those without the technical knowledge or capacity can still take advantage of Web mapping technology using hosted services and maps. Hosted services are map services that an organization publishes and manages for another group, thus relieving them of the need to install a server and specialized software. Esri’s ArcGIS Online is a subscription-based service that allows subscribers to upload geographic content to their “cloud” and have it hosted as services. The services can then be consumed by a Web-mapping application developed using one of the available APIs or through predefined mapping applications hosted by Esri at ArcGIS.
Alliance for Public Gardens GIS 75
com. While limited in scope, hosted services and map applications offer an attractive alternative for organizations with limited in-house expertise and capabilities with Web architecture and/or ap-plication development.
An emerging technology trend is the development of Web maps for display on mobile comput-ing devices, such as smart phones, tablet computers, Global Positioning System (GPS) devices, and other hardware. Mobile maps extend the reach of the traditional GIS system into the field, allowing organizations to significantly expand how they can share and use their spatial data. For instance, in addition to standard Web-mapping capabilities, mobile mapping applications can also display context- and location-based information using positioning technologies (GPS, cell-based) embedded in the devices. In a public garden setting, an application on a visitor’s mobile phone that is GPS enabled might be configured to automatically present the user with photos, videos, or information as they approach key points of interest . Garden staff could also use a mobile applica-tion to locate different assets (collections, utilities, etc.) and update information on their status in real time and with greater accuracy than using printed map books and field notes translated back in the office.
The biggest challenge in developing such applications is rethinking and redesigning for effective display on the small screen of a mobile device. Beyond that, development workflows are similar to that of standard Web maps. Esri provides useful frameworks for creating mobile applications based on the Apple iOS, Android, and Windows Mobile operating systems under their ArcGIS for Mobile software development kits. Arnold Arboretum of Harvard has successfully developed and deployed a mobile mapping application that allows visitors to search their collections, upload pho-tos via Flickr to be viewed on the map, and link to specific plants found in the landscape. It mimics their main Web mapping application in look and functionality but is optimized to perform on small mobile devices.
Conclusion
In general, GIS is progressing toward the creation of dynamically interactive online maps with relatively powerful interface capabilities. New visual display and database access capabilities are yielding more graphically sophisticated and broadly functional maps, with an increasingly diverse set of potential applications. This trend is now emerging in the public garden setting. While print production remains an important information product, the use of Web maps will vastly increase the accessibility and usability of geographic content to the point that maps will serve as active work-spaces at gardens. This will further promote novel and innovative ways to visualize and interact with one’s collections. For public gardens, GIS is opening many new opportunities and expansion to the web has the potential to revolutionize the way gardens share their information with others.
