guide to pennsylvania occupational wages wages/wages_gu… · introduction . this publication...
TRANSCRIPT

Guide to Pennsylvania Occupational
Wages For additional information, please contact:
Center for Workforce Information & Analysis (CWIA) Call: 1-877-493-3282; Fax: 1-717-772-2168
E-mail: [email protected] www.workstats.dli.pa.gov
INTRODUCTION
This publication represents a comprehensive collection of Pennsylvania wage data to be used as a reference for educators, PA CareerLink® staff, career counselors, Workforce Development Boards, economic developers, program planners, and others. The information was collected through the Occupational Employment Statistics (OES) program, as administered by the Center for Workforce Information & Analysis (CWIA) in cooperation with the US Department of Labor’s Bureau of Labor Statistics (BLS). The CWIA has provided several extensions to the official OES data series. These include the “Entry” and “Experienced” wages and all county and Workforce Development Area (WDA) wage publications. These additional products have not been validated by BLS and are not, therefore, official BLS data series. The CWIA feels, however, that they provide additional information that is useful to the users of CWIA data. For detailed information on how wage data are collected and data definitions, please see the Technical Notes.
ACKNOWLEDGEMENT
We are grateful to all the employers who responded to the OES annual report and made this publication possible.
April 2018 Page 2 Center for Workforce Information & Analysis
HOW THE WAGE INFORMATION CAN BE USED Making Career Decisions Different work settings can lead to differences in earnings:
• A heavy-duty truck driver earns on average $6.12 per hour more than a light-duty truck driver. • Cooks working in fast food establishments receive an average hourly wage of $10.10 per hour; cooks employed by
institutions such as schools or hospitals earn an average hourly wage of $13.55. Level of education attained can lead to differences in earnings:
• A mechanical engineer, who needs a bachelor's degree, has an average hourly wage of almost $42.00 – almost 60 percent more than a mechanical engineering technician who must have an associate degree.
Wage data can show how job experience can lead to differences in earnings:
• Police patrol officers can expect an average hourly wage of $31.95. When promoted to police detectives, the average hourly wage jumps to $40.86.
• Experienced elementary school teachers earn $76,210 per year, substantially more than entry-level teachers who earn $43,700.
Making Business Decisions Setting wage rates:
• When considering bringing printing functions "in-house", an employer needs to perform a cost analysis. Looking at the average and median wages for printing-related occupations, such as graphic artists or printing press operators, will help the employer estimate costs.
Making comparisons:
• Employers experiencing a high rate of employee turnover can compare wages they pay their employees to averages in the area.
Relocating:
• An employer who is considering moving into an area can utilize the available wage data to determine wage costs in the prospective location.
April 2018 Page 3 Center for Workforce Information & Analysis

These Wages Should Not Be Used For The Following: Davis-Bacon Act and Pennsylvania Prevailing Wage Act – the Davis-Bacon Act requires construction contractors for publicly funded contracts of more than $2,000 to pay the local prevailing wage. If the contract is federally funded, prevailing wages may be obtained from the US Department of Labor, Wage and Hour Division office in Philadelphia at 215-861-5830. If the contract is state or local government-funded, contractors should visit the Prevailing Wage Division of the Pennsylvania Department of Labor & Industry at www.portal.state.pa.us/portal/server.pt/community/prevailing_wage. The Service Contract Act (SCA) – applies to every contract entered into with the US or the District of Columbia, the principal purpose of which is to furnish services in the US through the use of employees. Service contracts through government contract work, which exceed $2,500, are subject to the SCA. To obtain information regarding the SCA, visit the website at www.dol.gov/compliance/laws/comp-sca.htm. Foreign Labor Certification (FLC) Act – the FLC program is designed to assure that the admission of foreign workers into the US on a permanent or temporary basis will not adversely affect the job opportunities, wages and working conditions of US workers. To obtain information regarding the FLC program, visit the US Department of Labor Employment and Training Administration’s website at www.foreignlaborcert.doleta.gov/about.cfm. For actual prevailing wages, visit the website at www.foreignlaborcert.doleta.gov/pwscreens.cfm.
April 2018 Page 4 Center for Workforce Information & Analysis

TIPS ON USING THIS PUBLICATION
Choosing and Finding the Correct Occupation
When identifying wages for a particular occupation, make sure the occupational title actually refers to the occupation for which wages are being sought. Definitions for each occupation are available from BLS at www.bls.gov/soc/2018/soc_2018_definitions.pdf. When in doubt, refer to the occupation’s definition.
Selecting the Wage Statistic to Use
This publication contains average, median, mid-range, entry, and experienced-level wages for about 800 occupations. Listed explanations of each statistic to assist you in determining which to use: Average wage refers to mean wage in this publication. This is probably the most commonly used statistic. However, it can be deceiving if there is an excessive amount of employment in the occupation at very low or very high wage levels. These circumstances pull the average down or up, respectively. Median wage is the midpoint wage. If there is a large difference between the average wage and the median wage, due to a high proportion of employees receiving either low or high wages, the median is a more representative statistic. Entry wage is representative of the wage paid to persons who are just beginning a new job and have no previous experience in the occupation. Experienced wage is representative of the wage paid to persons with a number of years of experience in the occupation. Mid Range represents the range within which the middle 50 percent of all employees in this occupation are paid. One-quarter are paid less and one-quarter are paid more. This is also a commonly used statistic. A person considering a career in an occupation can reasonably expect to be paid somewhere within the mid-range.
April 2018 Page 5 Center for Workforce Information & Analysis

Comparing Wages Between Different Areas One of the main benefits of the occupational wage data from the OES program is that it can be compared to occupational wages for other areas of Pennsylvania and to other states’ OES wage data. Identical forms, occupational definitions, and estimating methods were used in every area in every state. Wages for many areas of Pennsylvania can be obtained by contacting CWIA. Statewide and Metropolitan Statistical Area (MSA) occupational wages for all states and all MSA’s in the US are available at the BLS web site: www.bls.gov/oes.
Confidentiality of Employer Information Confidentiality guidelines are strictly observed. These guidelines are intended to preserve the anonymity of firms that participate and require that data for a particular occupation are suppressed: when fewer than three firms responded for an occupation in a particular industry; when any one firm represents more than 50 percent of the employment in an occupation; or when two firms combined represent more than 75 percent of the employment in an occupation.
The wage data in this publication, and many other categories of workforce information in Pennsylvania, are available at:
Center for Workforce Information & Analysis (CWIA) Call: 1-877-493-3282; Fax: 1-717-772-2168
E-mail: [email protected] www.workstats.dli.pa.gov
April 2018 Page 6 Center for Workforce Information & Analysis

TECHNICAL NOTES
METHODOLOGY
The OES program, conducted in cooperation with the US Department of Labor’s BLS, is a semi-annual solicitation of approximately 8,000 randomly selected Pennsylvania employers designed to collect second quarter and fourth quarter employment and wage data for up to approximately 800 occupations.
Types of Businesses Included
The scope includes establishments in: agricultural services; mining; utilities; construction; manufacturing; wholesale and retail trade; transportation and warehousing; information, finance, insurance, and real estate; educational services; health care; accommodation and food service; other services; and government.
Sample Stratification
The sample of employers is stratified by area, industry, and size class. Three Years of Data Are Combined
Each semi-annual panel represents only one-sixth of the sample for the full three-year OES sample plan. The program is designed to produce estimates based on three full years of data. Utilizing three years of data significantly reduces sampling error, but requires the adjustment of the earlier two years of wage data to the current time period using the national Employment Cost Index (ECI).
Adjusting Wages to Current Year
Two tools that can be used to adjust wages in this publication to the current year are listed below: Consumer Price Index (CPI) - the CPI is a measure of the prices paid by urban consumers for a fixed market basket of consumer goods and services. The index allows a calculation of the average change over time in consumer prices. CPI data are collected in 87 urban areas including the Philadelphia-Camden-Atlantic City, PA-DE-NJ-MD region and the Pittsburgh, PA region. Information on the CPI is on the web at: www.bls.gov/cpi. Employment Cost Index (ECI) - considered the best measure of wages over time at the national level, this series is updated quarterly and shows both benefit changes as well as payroll changes. Information on the ECI can be found at: www.bls.gov/ect.
April 2018 Page 7 Center for Workforce Information & Analysis
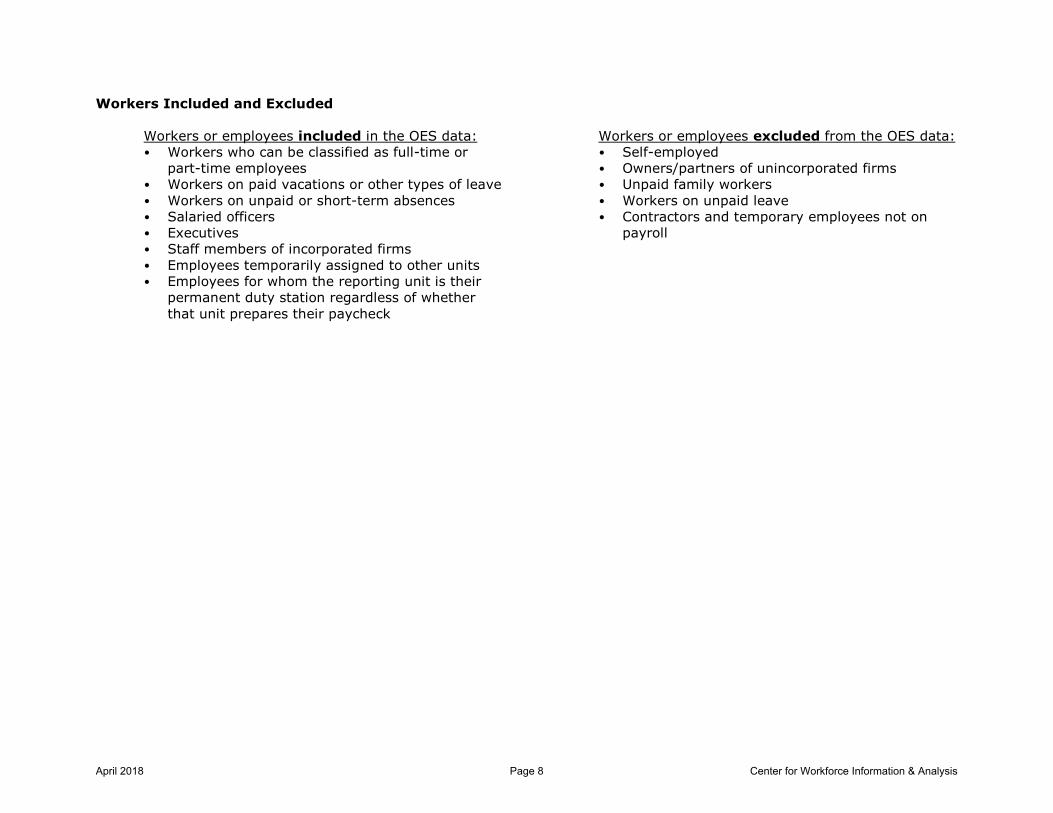
Workers Included and Excluded Workers or employees included in the OES data: • Workers who can be classified as full-time or
part-time employees • Workers on paid vacations or other types of leave • Workers on unpaid or short-term absences • Salaried officers • Executives • Staff members of incorporated firms • Employees temporarily assigned to other units • Employees for whom the reporting unit is their
permanent duty station regardless of whether that unit prepares their paycheck
Workers or employees excluded from the OES data: • Self-employed • Owners/partners of unincorporated firms • Unpaid family workers • Workers on unpaid leave • Contractors and temporary employees not on
payroll
April 2018 Page 8 Center for Workforce Information & Analysis
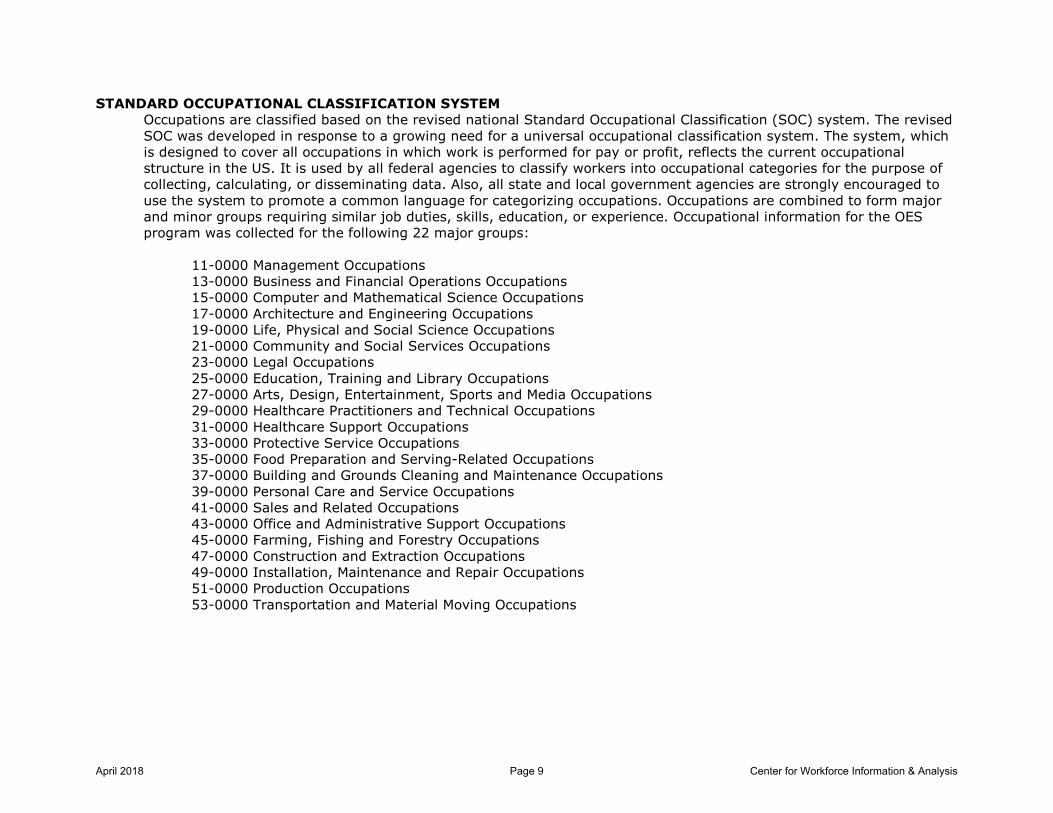
STANDARD OCCUPATIONAL CLASSIFICATION SYSTEM Occupations are classified based on the revised national Standard Occupational Classification (SOC) system. The revised SOC was developed in response to a growing need for a universal occupational classification system. The system, which is designed to cover all occupations in which work is performed for pay or profit, reflects the current occupational structure in the US. It is used by all federal agencies to classify workers into occupational categories for the purpose of collecting, calculating, or disseminating data. Also, all state and local government agencies are strongly encouraged to use the system to promote a common language for categorizing occupations. Occupations are combined to form major and minor groups requiring similar job duties, skills, education, or experience. Occupational information for the OES program was collected for the following 22 major groups:
11-0000 Management Occupations 13-0000 Business and Financial Operations Occupations 15-0000 Computer and Mathematical Science Occupations 17-0000 Architecture and Engineering Occupations 19-0000 Life, Physical and Social Science Occupations 21-0000 Community and Social Services Occupations 23-0000 Legal Occupations 25-0000 Education, Training and Library Occupations 27-0000 Arts, Design, Entertainment, Sports and Media Occupations 29-0000 Healthcare Practitioners and Technical Occupations 31-0000 Healthcare Support Occupations 33-0000 Protective Service Occupations 35-0000 Food Preparation and Serving-Related Occupations 37-0000 Building and Grounds Cleaning and Maintenance Occupations 39-0000 Personal Care and Service Occupations 41-0000 Sales and Related Occupations 43-0000 Office and Administrative Support Occupations 45-0000 Farming, Fishing and Forestry Occupations 47-0000 Construction and Extraction Occupations 49-0000 Installation, Maintenance and Repair Occupations 51-0000 Production Occupations 53-0000 Transportation and Material Moving Occupations
April 2018 Page 9 Center for Workforce Information & Analysis

WAGE COLLECTION Wages for the OES program are straight-time gross pay, exclusive of premium pay and benefits.
Included Wages • Base Rate • Commissions • Tips • Deadheading Pay • Guaranteed Pay • Hazard Pay • Incentive Pay • Longevity Pay • On-Call Pay • Piece Rate • Portal-to-Portal Rate • Production Bonus • Cost-of-Living Allowance
Excluded Wages • Attendance Bonus • Back Pay • Draw • Holiday Premium Pay • Jury Duty Pay • Lodging Payments • Meal Payments • Merchandise Discounts • Nonproduction Bonus • Overtime Pay • Perquisites • Profit Sharing Payment • Relocation Allowance • Tuition Repayments • Severance Pay • Shift Differential • Stock Bonuses • Tool Allowance • Vacation Pay • Weekend Pay • Uniform Allowance
April 2018 Page 10 Center for Workforce Information & Analysis

Wages are collected in 12 wage intervals. Employers report the number of employees in an occupation for each wage range. The following were used to collect the 2017 Wages:
Interval Hourly Wage Annual Wage
A Under $9.25 Under $19,240
B $9.25 to $11.74 $19,240 to $24,439
C $11.75 to $14.74 $24,440 to $30,679
D $14.75 to $18.74 $30,680 to $38,999
E $18.75 to $23.99 $39,000 to $49,919
F $24.00 to $30.24 $49,920 to $62,919
G $30.25 to $38.49 $62,920 to $80,079
H $38.50 to $48.99 $80,080 to $101,919
I $49.00 to $61.99 $101,920 to $128,959
J $62.00 to $78.74 $128,960 to $163,799
K $78.75 to $99.99 $163,800 to $207,999
L $100.00 and over $208,000 and over
April 2018 Page 11 Center for Workforce Information & Analysis

EDUCATIONAL ATTAINMENT The BLS provides information about entry-level education, related work experience, and typical on-the-job training requirements for each of several-hundred occupations. The following abbreviations indicate the education and experience required for entry into an occupation:
Abbreviation Education/Experience Level Description
PhD/PROF Doctoral or professional degree
MD+ Master's degree plus experience
MD Master's degree
BD+ Bachelor's degree plus experience
BD Bachelor's degree
AD+ Associate degree plus experience
AD Associate degree
PS+ Postsecondary training plus experience
PS Postsecondary training or apprenticeship
WK EXP HS diploma plus work experience
LT OJT Long-term training or apprenticeship
MT OJT Moderate-term on-the-job training
ST OJT Short-term on-the-job training
TBD Education level not yet determined
N/A Education level not available at this time
April 2018 Page 12 Center for Workforce Information & Analysis
APPENDIX
Data Definitions Average Wage: Average wage in this publication refers to the mean wage. As noted on page 11, wage data in the OES program are collected and grouped in 12 intervals. The number of employees in an occupation that are paid at each wage interval is multiplied by the mid-point of the interval. These products are then summed and the sum is divided by total employment for the occupation to obtain a mean hourly wage for the occupation. Hourly wages are converted to annual wages by multiplying by 2,080 hours. Median Wage: The median wage is the 50th percentile of the distribution of wages; 50 percent of workers in an occupation earn wages below and 50 percent earn wages above the median wage. The wage interval containing the median wage is located using a cumulative frequency count of employment across wage intervals, and then interpolating within the interval. Entry Wage: The mean of the lower-third of the wages for an occupation. This calculation is provided as a proxy for an entry-level wage. Experienced Wage: The mean of the upper two-thirds of the wages for an occupation. This calculation is provided as a proxy for an experienced-level wage. Mid Range: These data provide information on the range of wage rates for the middle 50 percent of workers when wages are ranked from lowest to highest. The two wage rates displayed are the 25th and 75th percentiles of the distribution, respectively. Occupations: Occupational titles, codes, and definitions are based on the Standard Occupational Classification (SOC) coding system. Information on SOC, including occupational definitions, is available on the BLS web site at www.bls.gov/oes. Education Level: The education, experience, and on-the-job training typically required for entry into an occupation. See page 12 for definitions.
April 2018 Page 13 Center for Workforce Information & Analysis
Metropolitan Statistical Area (MSA): An economically integrated region within which workers may readily change jobs without changing place of residence. For most of the nation, this region contains a total metropolitan population of 100,000 and has at least one city or US Census-designated "urbanized area" with at least 50,000 residents. Workforce Development Area (WDA): A labor market area that is usually a group of contiguous counties, where employment, training and educational services are provided. Established through the Workforce Innovation and Opportunity Act to provide services for dislocated workers and other eligible individuals, Pennsylvania’s WDAs are based on common geographic and economic factors. Wage Area: Indicates the geographical level for which the occupational wage is provided within the county wage publications only. When county wages are not available, the wage for the smallest available geographic area (WDA, MSA or PA) that includes the county is substituted.
April 2018 Page 14 Center for Workforce Information & Analysis

Pennsylvania CountiesErie
Crawford
Warren McKean Potter Tioga Bradford Susquehanna
Wayne
Pennsylvania Counties
Clinton
Forest
VenangoMercer
Clarion Jefferson
ElkCameron
Lycoming
Sullivan
Pike
Luzerne
Wyoming
Lackawanna
Armstrong
IndianaBeaver
LawrenceButler
Clearfield
Centre
NorthamptonMifflin Schuylkill
Lehigh
Columbia
Montour
Snyder
Union
Northumberland
Carbon
Monroe
Washington
Allegheny
Westmoreland
Cambria
Huntingdon
BlairLebanon
Cumberland
Perry
Juniata
Dauphin
Montgomery
Berks Bucks
Lehigh
Greene Fayette BedfordSomerset FranklinFulton YorkAdams Lancaster Chester Delaware
Philadelphia
April 2018 Page 15 Center for Workforce Information & Analysis

Elk
Tioga
Erie
York
Potter
Centre
Berks
Bradford
Butler
Lycoming PikeClinton
Bedford
Warren
Clearfield
McKean
Blair
Crawford
Indiana
Luzerne
Somerset
Wayne
Fayette
Bucks
LancasterFranklin
Chester
Clarion
Schuylkill
Cecil
Monroe
Cambria
Burlington
Venango
Morris
Huntingdon
Greene
Allegheny
Adams
Sussex
Washington
Jefferson
Westmoreland
Mifflin
Fulton
Forest
Armstrong
Beaver
Susquehanna
Sullivan
Salem
Union
Juniata
CarbonColumbia
Lehigh
Snyder
WyomingCameron
Lebanon
Lawrence
Warren
New Castle
Hunterdon
Montgomery
Lackawanna
Somerset
Gloucester
NorthumberlandNorthampton
Camden
Essex
Delaware
Union
Montour
Philadelphia
Perry Dauphin
Cumberland
MercerTrumbull
Mahoning
2010 MSA Configurations
!(1
!(2
!(3
!(4
!(5
!(6
!(7
!(8!(9
!(10
!(11
!(12
!(13
!(14 !(15
!(16
!(17
!(18
!(19
!(20
1 - Allentown-Bethlehem-Easton, PA-NJ MSA (10900)2 - Altoona, PA MSA (11020)3 - Bloomsburg-Berwick, PA MSA (14100)4 - Chambersburg-Waynesboro, PA MSA (16540)5 - East Stroudsburg, PA MSA (20700)6 - Erie, PA MSA (21500)7 - Gettysburg, PA MSA (23900)8 - Harrisburg-Carlisle, PA MSA (25420)9 - Johnstown, PA MSA (27780)10 - Lancaster, PA MSA (29540)
11 - Lebanon, PA MSA (30140)12 - Newark, NJ-PA Metro Division (35084)13* - Philadelphia-Camden-Wilmington, PA-NJ-DE-MD MSA (37980)14 - Pittsburgh, PA MSA (38300)15 - Reading, PA MSA (39740)16 - Scranton--Wilkes-Barre--Hazleton, PA MSA (42540)17 - State College, PA MSA (44300)18 - Williamsport, PA MSA (48700)19 - York-Hanover, PA MSA (49620)20 - Youngstown-Warren-Boardman, OH-PA MSA (49660)
* Includes:i - Montgomery-Bucks-Chester Metro Division (33874)ii - Philadelphia Metro Division (Philadelphia and Delaware Counties) (37964)
April 2018 Page 16 Center for Workforce Information & Analysis

Workforce Development Areas
Mercer
Lawrence
Washington
Greene
Beaver
Indiana
Butler
Armstrong
Somerset Bedford Fulton
Huntingdon
Cambria
Blair
Jefferson
Clearfield
Elk
McKean
Cameron
Potter Tioga
Sullivan
Bradford
Wyoming
Susquehanna
Centre
Clinton
Mifflin
Union
Snyder Northumberland
Columbia
Lycoming
Montour
Franklin Adams York
Perry
Juniata
Cumberland
Dauphin Lebanon
Lancaster County WDA
Berks County WDA
Chester County WDA
Delaware County WDA
Philadelphia County WDA
Montgomery County WDA
Bucks County WDA
Lehigh
Northampton Schuylkill
Luzerne
Lackawanna County WDA
Carbon
Monroe
Pike
Fayette
Westmoreland
Clarion
Crawford
Erie
Venango
Warren
Forest
Allegheny
Lehigh Valley WDA
South Central WDA
Central WDA
Southern Alleghenies WDA Southwest Corner WDA
Tri County WDA
West Central WDA
Three Rivers WDA
Westmoreland/ Fayette WDA
Northwest WDA North Central WDA Northern Tier WDA
Luzerne-Schuylkill Counties WDA
Pocono Counties
WDA
Wayne
April 2018 Page 17 Center for Workforce Information & Analysis