guide to sisc metrics v 1-2.1 - stewardship index to sisc metrics.pdf ·...
TRANSCRIPT

Guide to SISC Metrics and Calculator (Beta Version 1.1)
Page 1 of 41
User’s Guide to SISC Farm Level Metrics and Calculator
(Beta Version 1.1) December 9, 2011
© 2011 Ag Innovations Network on Behalf of the Stewardship Index for Specialty Crops.

Guide to SISC Metrics and Calculator (Beta Version 1.1)
Page 2 of 41
User’s Guide to SISC Metrics – Farm Level The Stewardship Index for Specialty Crops (SISC) is pleased to present the SISC Metrics and Calculator (Beta Version 1.1) for the specialty crop industry. This guide contains a summary of each metric along with a step-‐by-‐step manual for inputting data into the Calculator.
Table of Contents I. Introduction ......................................................................................................................................... 1
II. Metrics ................................................................................................................................................. 5
Energy Use Metrics .............................................................................................................................. 5
Nutrient Metrics .................................................................................................................................. 5
Soil Metrics .......................................................................................................................................... 6
Water Use Metrics ............................................................................................................................... 6
III. Guidance for Pilot Participants ............................................................................................................ 1
Information on Pilot Testing ................................................................................................................ 7
Definitions of Total Farmed Area and SISC Management Area ........................................................... 8
Reporting Timeframe ......................................................................................................................... 10
IV. Step by Step Calculator Instructions .................................................................................................. 13
Overview and Tips for Use ................................................................................................................. 13
Section 1 – General Information ........................................................................................................ 14
Section 2 – Management Area Information ...................................................................................... 15
Section 3 – Nutrients ......................................................................................................................... 16
Section 4 – Soil Organic Matter ......................................................................................................... 17
Section 5 – Water Use ....................................................................................................................... 18
Section 6 – Pesticide Embedded Energy ............................................................................................ 20
Section 7 – Farm Energy Use ............................................................................................................. 22
Section 8 – Energy Allocation Worksheet .......................................................................................... 23
Section 9 – Energy Results ................................................................................................................. 26
Section 10 – Metric Dashboard ......................................................................................................... 26
Appendix A – Confidentiality Policy ........................................................................................................... 27
Appendix B – Technical Notes and References .......................................................................................... 32
Appendix C – Nutrient Analyses of Some Organic Materials ..................................................................... 40
Appendix D – N-‐P-‐K Values of Commercial Fertilizers ............................................................................... 41

Guide to SISC Metrics and Calculator (Beta Version 1.1)
Page 3 of 41
I. Introduction About the Stewardship Index SISC is a multi-‐stakeholder initiative to develop a system for measuring sustainable performance throughout the specialty crop supply chain. The project is an unprecedented collaboration amongst the nation’s most influential grower organizations, Non Governmental Organizations (NGOs), and buyers of specialty crop products. SISC aims to establish a common suite of outcomes-‐based metrics to enable operators at any point along the supply chain to benchmark, compare, and communicate their own performance in meeting sustainability goals. About the SISC Metrics (Beta Version 1.1) Metric Development The SISC Metrics (Beta Version 1.1) are a subset of a longer list of metrics developed by SISC participants over the last two years and piloted on farms across the country in 2010. During the piloting process last year, we received 58 datasets from 35 growers for 18 crops across 8 states. The process of getting direct feedback from growers was extremely valuable. SISC used this feedback to hone the data inputs required for metrics and to identify a smaller number of metrics deemed by the SISC Coordinating Council to be the most complete and of greatest utility to growers. A strict data confidentiality policy and non-‐disclosure agreement was used to protect the confidentiality of growers’ data. SISC will continue to develop and pilot other sustainability metrics to be added to the SISC Metrics as appropriate. The current suite of metrics is intended for use in wide scale piloting, to learn more about the utility and practicality of the metrics, and to collect enough data that we can test assumptions about the value of sharing anonymized, aggregated data with the pilot participants for the purpose of peer-‐to-‐peer learning and benchmarking. Acknowledgements The SISC Metrics are the result of many hours volunteered by hundreds of people who participated in metric development discussions, on-‐farm pilots, research and SISC governance. We thank everyone who has taken the time to participate in this effort. Development of the SISC Calculator and accompanying Guide was coordinated by staff from SISC Coordinating Council organizations, including: Andrew Arnold, SureHarvest; Dana Gunders and Jonathan Kaplan, Natural Resources Defense Council; and Daniella Malin, Sustainable Food Lab. In addition many other SISC participants and other experts provided input in developing these documents: For their contributions to the Energy Use and Energy Allocation metric worksheets, we thank Marty Matlock and Prathamesh Bandekar, University of Arkansas; Stewart Ramsey, HIS Global Insight; Burelson Smith, United Fresh Produce Association; and Karen Klonsky, UC Davis. For their contributions to the Soil Organic Matter and Nutrients metric worksheets, we wish to thank Meagan Schipanski, Penn State; Susan Andrews, Natural Resource Conservation Service, USDA; and Doug Karlen, Agriculture Research Services, USDA, who provided an Excel version of the Soil Management Assessment Framework (SMAF).
We thank the following individuals for their invaluable feedback on the Calculator: Stephanie Aschmann, Natural Resources Conservation Service; Kumar Venkat, CleanMetrics; Steve Balling, Del Monte Foods,

Guide to SISC Metrics and Calculator (Beta Version 1.1)
Page 4 of 41
Leigh Morrow, McCain Foods; Chuck Benbrook, the Organic Institute; Matt Angell, Strategic Farming; Steve Locke, SureHarvest; Dan Sonke, Campbell Soup Co.; Chris Storm, Vino Farms; Steve Savage, Savage & Associates; Hank Giclas, Western Growers; John Keeling, National Potato Council; Jim Knutzon, Farm Fresh Direct; Tim York, Markon Cooperative; Kathy Means, Produce Marketing Association; Hal Hamilton, Sustainable Food Lab; Nikki Rodoni and Jocelyn Gretz, Gill’s Onions; and Larry Jacobs, Jacobs Farm / Del Cabo. Acknowledgement of the contributors listed here does not signify their endorsement or approval of the SISC Metrics, Calculator or Guide.

Guide to SISC Metrics and Calculator (Beta Version 1.1)
Page 5 of 41
II. Metrics The SISC Metrics (Beta Version 1.1) includes metrics for energy, nutrients, soil, and water. Below is an explanation of each metric and relevant calculations. Many of the metrics can be considered on a per-‐area or per-‐yield basis. A user may choose to view metrics with one denominator or the other depending on their needs. Further explanation of how each metric is calculated, data sources, and how the data provided will be used is provided in Appendix B – Technical Notes and References. Energy Use Metrics Crop production requires a substantial amount of fuel and electricity to power farm machinery and irrigation. In addition, a sizeable amount of energy is required to produce fertilizers and pesticides, particularly those fertilizers containing nitrogen. Energy production is resource-‐intensive regardless of the production method. As energy costs rise, energy will continue to be an important agricultural input to track. The SISC energy metric includes direct energy from fuel and electricity and indirect energy in the form of energy required to produce fertilizers and pesticides (“embedded energy”). Because growers of multiple crops often do not know how much fuel and electricity was used any particular crop, we have developed a tool to help allocate data to a particular crop or management area. This may also be useful to growers of a single crop who would like to estimate energy use by field. By Unit of Production By Area
Energy Use Metric
1a. Total BtU/ ton harvested 1b. Total BtU/ acre planted
Total BtU: Direct energy (fuel + electricity) + indirect energy (energy utilized to produce fertilizers and pesticides)
Nutrient Metrics Nitrogen and phosphorous are key nutrients for crop production. Nutrients transported off the farm pose an economic loss to the grower and can have detrimental impacts to surface and groundwater quality. Nitrogen lost to the atmosphere as nitrous oxide (N2O) is a potent greenhouse gas, with ~300 times the warming potential of carbon dioxide (CO2). The SISC nutrient metrics are the total amounts of nitrogen and phosphorous applied, with the aim of increasing the efficiency of nutrient use in crop production. Nitrogen and phosphorous were chosen as they are widely recognized as pollutants and are a higher priority for environmental improvement than potassium. By Unit of Production By Area
Nutrient Metrics
2a. Pounds nitrogen applied/ton harvested 3a. Pounds phosphorous applied/ ton harvested
2b. Pounds nitrogen applied /acre planted 3b. Pounds phosphorous applied/acre planted
Pounds nitrogen and phosphorous: sum of all synthetic and organic N and P fertilizers applied.

Guide to SISC Metrics and Calculator (Beta Version 1.1)
Page 6 of 41
Soil Metrics Soil Organic Matter (SOM) is the organic fraction of soil excluding non-‐decomposed plant and animal residues.1 SOM is usually measured by the amount of Total Organic Carbon (TOC) present in the soil. Increasing amounts of SOM, and hence organic carbon, provide significant agronomic and environmental benefits including improved nutrient delivery to plants, water retention, drainage, and resistance to disease and erosion. A soil’s ability to store SOM varies greatly depending on climate, soil texture and soil type. To normalize against this variability, SOM is compared with a site-‐specific estimate of the soil’s potential to hold SOM. The SISC soil metric is the measured TOC of the soil divided by that soil’s potential to store organic carbon, as modeled using USDA’s Soil Management Assessment Framework (SMAF). By Unit of Production By Area
Soil Metric 4. Soil organic matter / soil organic matter potential
Soil organic matter requires lab test. Soil organic matter potential is calculated using the Soil Management Assessment Framework.
Water Use Metrics Water is already in short supply in parts of the world and will become increasingly scarce as populations increase and climate change continues to alter weather patterns. It is also increasing in cost in many places. Therefore, efficient irrigation is a critical component of sustainable crop production. The SISC water use metric has two components: 1) a Water Use Efficiency metric, which measures the total amount of water used to produce the crop; and 2) a Simple Irrigation Efficiency metric, which measures the amount of water applied to the crop relative to the crop’s water need resulting from transpiration and soil evaporation (ETc)2. This provides a different perspective on water efficiency by taking into account the specific crop and climate conditions. By Unit of Production By Area
Water Use Metric
5a. Acre-‐inches applied water/ton harvested 6. Acre-‐inches applied water/ETc
5b. Acre-‐inches applied water/acre planted
-‐ Applied water: Total ground and surface water applied. -‐ ETc: Amount of water lost to transpiration and soil evaporation during the growing
season.
1 USDA Fact Sheet, “Soil Quality Indicators” http://soils.usda.gov/sqi/assessment/files/toc_sq_biological_indicator_sheet.pdf 2 The Simple Irrigation Efficiency metric will be included in a future version of the calculator and described in detail in the accompanying User’s Guide.

Guide to SISC Metrics and Calculator (Beta Version 1.1)
Page 7 of 41
III. Guidance for Pilot Participants
Information on Pilot Testing
Goals The Stewardship Index is committed to developing sustainability metrics that are scientifically valid and practical for use by individual operators. In this context, we are asking growers of all types and sizes to test the metrics. Through this effort we hope to assess the following:
Viability and time requirements of collecting data Usefulness of the metrics to the grower for improving business operations and efficiency Usefulness and integrity of the metrics for evaluating sustainable performance Potential for growers to meaningfully compare to others within specific regions and operation
types (requires enough participants in peer group so that data can be sufficiently anonymized) Usability of calculator tool Usefulness of the data to buyers
Scope of 2011 Pilot Testing The Stewardship Index will seek to pilot the metrics for diverse crops, operations and regions around the country. We will target six crops in our pilot testing in an effort to obtain enough pilot results in each crop to assess the utility of comparing data and the extent of variation. These are: tomatoes, potatoes, leafy greens, strawberries, citrus, and winegrapes. Growers of other crops are welcome to participate as well, and this list may grow as others express interest in participating. The Stewardship Index requests pilot participants to test the full set of metrics to the extent feasible. However, we welcome participation even if all metrics cannot be completed. Data Confidentiality The Stewardship Index has developed a policy to preserve the confidentiality of the data that is contributed by volunteer pilot participants while enabling the sharing of anonymized data and lessons learned with the SISC community. The balance between confidentiality and data sharing is as follows: First and foremost, SISC is fully committed to preserving the confidentiality of individual data contributed by pilot participants and will not disclose data that can be attributed to an individual person, company, farm or facility to any party, including other Stewardship Index partners. However, under certain circumstances, SISC may share data, feedback, and other pilot results that are anonymized and cannot directly or indirectly be attributed to a particular pilot participant. Pilot feedback about the experience of piloting, such as the difficulty, usefulness, availability of data, etc, is generally not considered confidential but will likewise be anonymized. Quantitative performance data collected from pilot participants, e.g. pounds of nitrogen applied per acre, may be shared by the Coordinating Council that governs SISC if a majority of each of the three stakeholder groups (growers, buyers, NGOs) agree to do so, and, again, only if the data are fully anonymized. Pilot participants are required to sign a statement acknowledging they understand and accept the terms of this policy. The policy in full can be found in Appendix A.

Guide to SISC Metrics and Calculator (Beta Version 1.1)
Page 8 of 41
Definitions of Total Farmed Area and SISC Management Area Total Farmed Area SISC defines the Total Farmed Area as an area owned or rented by the farming business that shares resources such as machinery, water, or staff. The Total Farmed Area can be comprised of one or more Management Areas, but does not include things like roads, creeks, and houses. Operations in different states or regions should be reported as separate farms. In Figure 1 below, the Total Farmed Area includes two SISC Management Areas and two “non-‐reporting” areas that are not part of the SISC pilot.
Figure 1. Total Farmed Area example
SISC Management Area A SISC Management Area can be a collection of fields, a field, or a block within a field. The size and number of SISC Management Areas is determined by the grower based on his or her needs and in consideration of the guidelines below: • A field is considered a single SISC Management Area when multiple crops are rotated in succession
on the same ground and harvested in the reporting year. Example: Broccoli and lettuce are harvested in the same field in 2011. This field should be considered a single SISC Management Area because both crops are grown on the same ground in the same reporting year. See Figure 2.
SISC MA1: lettuce (10 acres) SISC MA2: broccoli (10
acres)
Non-‐Reporting #1 (12 acres)
Non-‐Reporting #2 (22 acres)

Guide to SISC Metrics and Calculator (Beta Version 1.1)
Page 9 of 41
Figure 2: Broccoli and Lettuce in a Single Management Area
• Different crops grown concurrently on different ground are considered different SISC Management Areas. Example: Cabbage is grown on one field and broccoli is grown on an adjacent field during the same season. Both crops are harvested in 2011. As indicated in Figure 3 below, each field is considered a separate SISC Management Area.
Figure 3: Cabbage and Broccoli in Separate Management Areas
Non-‐Reporting Non-‐Reporting
Broccoli (harvested May, 2011) Lettuce
(harvested Sep 2011)
Single SISC Management Area
Cabbage
Broccoli
Non-‐Reporting
Two separate SISC
Management Areas

Guide to SISC Metrics and Calculator (Beta Version 1.1)
Page 10 of 41
• Several blocks or fields may be considered a single SISC Management Area when the same crops are grown, managed together, and harvested in the same reporting year. If a grower chooses to aggregate multiple fields growing the same crop into a single SISC Management Area, the SISC metrics will provide data about those fields in aggregate.
Example: A grower has three separate fields where potatoes were harvested in 2010. The fields were under the same general management routine and the grower doesn’t need field-‐specific metric results. As shown in Figure 4 below, all three fields may be aggregated and considered as one SISC Management Area.
Figure 4: Three Fields Defined as a Single Management Area
• Growers producing multiple crops may choose to pilot SISC metrics on one or more of those crops. Reporting Timeframe
To facilitate consistent and comparable use of the SISC metrics, specific periods are prescribed for collecting the data needed for each metric. The section below describes the reporting intervals for each metric, explains terms used in the SISC Calculator and provides examples for reporting intervals in different scenarios. Note that the reporting intervals are automatically provided by the SISC Calculator so it is not essential for the user to learn all the details described below. Reporting Year. The reporting year for a SISC-‐measured crop is the calendar year in which a crop is harvested, regardless of when the data are calculated or shared.
Example: Crop A is harvested in October 2011 but the grower reports it to SISC or another party in 2012. The reporting year for this crop is 2011 because that is when it was harvested. Example: Crop B is planted in November 2010 and harvested in April 2011. The reporting year for this crop is 2011 because that is when it was harvested.
Start and end dates for data collection. The data collection interval is different for different metrics, as described in Table 2 below. The SISC calculator automatically calculates the correct reporting intervals based on the harvest dates provided by the user.
Potato #1
Potato #2 Non-‐
Reporting
Single SISC Management Area
Potato #3
Guide to SISC Metrics and Calculator (Beta Version 1.1)
Page 11 of 41
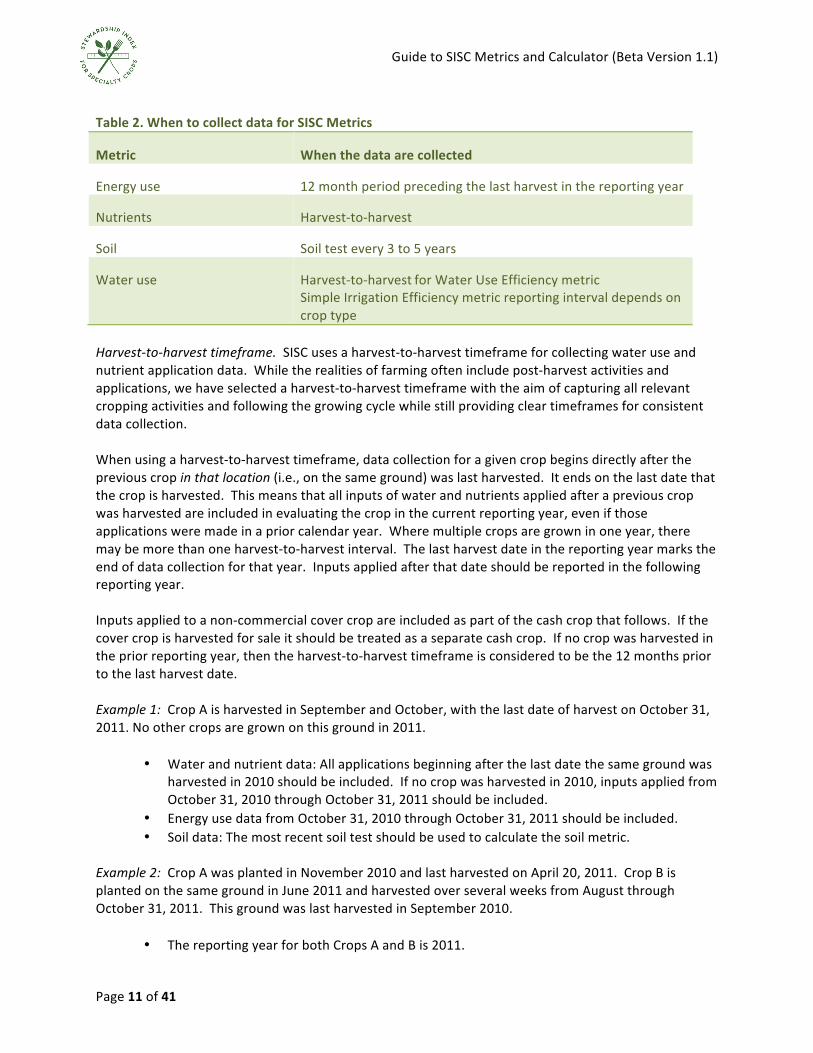
Table 2. When to collect data for SISC Metrics
Metric When the data are collected
Energy use 12 month period preceding the last harvest in the reporting year
Nutrients Harvest-‐to-‐harvest
Soil Soil test every 3 to 5 years
Water use Harvest-‐to-‐harvest for Water Use Efficiency metric Simple Irrigation Efficiency metric reporting interval depends on crop type
Harvest-‐to-‐harvest timeframe. SISC uses a harvest-‐to-‐harvest timeframe for collecting water use and nutrient application data. While the realities of farming often include post-‐harvest activities and applications, we have selected a harvest-‐to-‐harvest timeframe with the aim of capturing all relevant cropping activities and following the growing cycle while still providing clear timeframes for consistent data collection. When using a harvest-‐to-‐harvest timeframe, data collection for a given crop begins directly after the previous crop in that location (i.e., on the same ground) was last harvested. It ends on the last date that the crop is harvested. This means that all inputs of water and nutrients applied after a previous crop was harvested are included in evaluating the crop in the current reporting year, even if those applications were made in a prior calendar year. Where multiple crops are grown in one year, there may be more than one harvest-‐to-‐harvest interval. The last harvest date in the reporting year marks the end of data collection for that year. Inputs applied after that date should be reported in the following reporting year. Inputs applied to a non-‐commercial cover crop are included as part of the cash crop that follows. If the cover crop is harvested for sale it should be treated as a separate cash crop. If no crop was harvested in the prior reporting year, then the harvest-‐to-‐harvest timeframe is considered to be the 12 months prior to the last harvest date. Example 1: Crop A is harvested in September and October, with the last date of harvest on October 31, 2011. No other crops are grown on this ground in 2011.
• Water and nutrient data: All applications beginning after the last date the same ground was
harvested in 2010 should be included. If no crop was harvested in 2010, inputs applied from October 31, 2010 through October 31, 2011 should be included.
• Energy use data from October 31, 2010 through October 31, 2011 should be included. • Soil data: The most recent soil test should be used to calculate the soil metric.
Example 2: Crop A was planted in November 2010 and last harvested on April 20, 2011. Crop B is planted on the same ground in June 2011 and harvested over several weeks from August through October 31, 2011. This ground was last harvested in September 2010.
• The reporting year for both Crops A and B is 2011.

Guide to SISC Metrics and Calculator (Beta Version 1.1)
Page 12 of 41
• Water and nutrient data: All inputs applied from September 2010 through April 2011 should be attributed to Crop A. All inputs applied from the time after Crop A’s harvest in April until Crop B’s harvest is finished in October should be attributed to Crop B. (Anything applied after harvesting Crop B should be reported with the first crop harvested in 2012).
• Energy use data: The energy metric for both crops should be calculated based on energy use between October 2010 and October 2011.
• Soil data: The most recent soil test should be used to calculate the soil metric. Three-‐year rolling average. SISC recognizes that fluctuations in weather, pest pressure, climate, markets, and other variables will change metric results from year to year. In the future, to better reflect the on-‐going sustainability performance of an operation, SISC metrics will be presented both for the reporting year and as a three-‐year rolling average for each metric. For perennials, this will be the last three reporting years. For crops which are rotated, the last three harvests of the same crop are used for this average (regardless of when they were harvested). It may take more or less than three years to collect three data points for specific crops, depending on how often they are rotated. SISC users may report metric results with less than three years of data points until three years or more have been collected. SISC may revisit whether three years is the appropriate timeframe to capture natural variations.

Guide to SISC Metrics and Calculator (Beta Version 1.1)
Page 13 of 41
IV. Step by Step Calculator Instructions This section provides step-‐by-‐step instructions for completing the SISC Calculator. Data item numbers correspond with those in the calculator. Overview and Tips for Use Data for the Calculator is collected using a Microsoft Excel spreadsheet. If you prefer, you may provide data via paper by printing the spreadsheet and filling each field in. If you are not able to print, you may obtain a paper copy by contacting [email protected]. Tips • Navigating the Tool: The calculator is divided into several tabs. You can switch among tabs by
clicking on navigation (“Go to…”) buttons, clicking on the sections at the top of the page, or clicking on tabs at the bottom of the page.
• Required Fields: An asterisk (*) denotes boxes that are required for the calculator to work appropriately.
• Color Coded Boxes: o Blue Boxes: Indicate data entry fields. o Gray Boxes: Indicate calculated or default fields that are used to calculate the final metric.
In some cases, if you have better data, the calculator allows you to overwrite these fields. Otherwise, you may use the defaults provided.
o Yellow Boxes: Indicate help boxes or additional instructions. These yellow help boxes are included next to certain sections and will pop up when you select data entry cells.
• Results: Go to the final page -‐ “Metric Dashboard”-‐ to see your results. For multiple crops, results from the energy allocation worksheet can be seen on the “Energy Results” page.
• Feedback: Feedback can be given at any time by clicking on the "Feedback" buttons or the "Feedback" tab.
• Assistance: If you have any questions while using the calculator, you can always contact us at [email protected] or (707) 331-‐1810.
Calculator Layout The calculator has the following tabs:
About the Index – This page has general information on the calculator. No data input is required on this page. General Information – Complete this page with data that applies to the reporting farm enterprise. See “Definition of Total Farmed Area and SISC Management Area” above for more information on what to include for your farm. Management Areas – Complete this page with data that applies to one or more specific SISC Management Areas within your farm operation. The calculator allows for reporting on up to 3 different SISC Management Areas, each on a separate tab.

Guide to SISC Metrics and Calculator (Beta Version 1.1)
Page 14 of 41
Energy Use – Complete this page with data on your farm’s energy use. Energy Allocation Worksheet – Use this worksheet to develop estimates of energy use unless you already know the specific fuel and electricity data for the reported crops. That is, use this worksheet if:
• You are reporting on more than one crop per SISC Management Area. • You are not currently collecting electricity or fuel data at the resolution of your
Management Area(s). (E.g., you know your whole farm’s electricity use, but not for the specific SISC Management Area).
Energy Results – The estimates of how much direct energy (fuel and electricity) should be allocated to each field, as well as total indirect energy, are displayed on this page. No data input is required. Metrics Dashboard – Your metric results are displayed on this page using the data you have provided. No data input is required on this page.
Feedback – This page collects your feedback on each metric section. Please share; your feedback will help us improve the tool and understand how well it works for your situation.
Compost and Fertilizer Reference Sheets – These sheets are for reference to help you estimate if you do not know the N-‐P-‐K value of your compost or fertilizer.
Section 1 – General Information 1.1: Company Name Provide information for the reporting business. 1.2-‐1.9: Contact Information Provide contact information for the individual overseeing involvement in the SISC pilot. 1.10: Reporting Year* Enter the calendar year for which you are reporting. This designates your reporting year. Only crops harvested during the reporting year will be analyzed in the calculator. For reporting on crops harvested in a different year, create a new calculator file or save an existing calculator file as a different file using Excel’s ‘Save As’ function. See “Reporting Timeframe” above for more detail. 1.11: Date of Last Harvest in Reporting Year* Enter the date when the last harvest was completed for this reporting year. If reporting on multiple SISC Management Areas, enter the date of whichever harvest was latest. 1.12-‐1.19: Farm Information Provide the name and location for the farm addressed in this report. Please see the section “Definition of Total Farmed Area and SISC Management Area” above for more information about what to include in your farm and SISC Management Areas. In this section, provide the total cropped area of the farm, * Required field

Guide to SISC Metrics and Calculator (Beta Version 1.1)
Page 15 of 41
including cropped areas for which you are not reporting. If you are not reporting on some cropped areas, we hope you will share your reasons for excluding them. Section 2 – Management Area Information 2.1: SISC Management Area Name Enter a name for this Management Area. 2.2: Total Acres in SISC Management Area Enter total acreage of cropped land in this Management Area. See the section above entitled “Definition of Total Farmed Area and SISC Management Area” for clarity on how to define your Management Area. 2.3: Number of Crop Rotations in SISC Management Area* Enter the number of crops which were harvested during the reporting year on this Management Area. Do not include crops planted during the reporting year but harvested in a subsequent year. Non-‐commercial cover crops grown in between cash crops are attributed to the subsequent cash crop and should not be included here as a separate crop. If the cover crop itself is sold, it should be reported as a separate crop. 2.4: Date of last harvest in previous reporting year* Enter the date harvest ended during the previous reporting year (e.g., last harvest in 2010 if the reporting year is 2011). All inputs applied after this date count towards this reporting year and should be included in data entered in the calculator. If no crop was harvested in the prior year then enter the date that corresponds to one year before the current year harvest. 2.5: Cropping Information* Provide area planted, date of completion, and tons harvested for the crop grown on this Management Area. If more than one crop was planted during the year, you must enter the crops in chronological order with the earliest crop being “Crop 1.”
Crops: Select your crop from the drop-‐down menu. If your crop is not on the list, select “other” and enter your crop on the feedback page. Acres planted: Enter the acres planted in this SISC Management Area for each crop. Date harvest completed: Enter the last date of harvest for each crop in mm/dd/yy format. These should all be in the reporting year. Tons harvested: Enter the number of tons harvested and sold from this SISC Management Area for each crop (U.S. short tons).
* Required field

Guide to SISC Metrics and Calculator (Beta Version 1.1)
Page 16 of 41
Section 3 – Nutrients 3.1: Total amounts or per acre rate* Choose whether you’d like to enter nutrient product data as a total quantity applied to entire SISC Management Area or as a rate per acre. 3.2: Nutrient Product Information Enter information for each nutrient product applied during the reporting timeframe for the crop(s) harvested in this SISC Management Area, as indicated by the calculator. The calculator will specify the correct reporting interval for the crop(s) based on the current and previous harvest dates (or will start 12 months prior to the current harvest if no crop was harvested in the previous year). Complete each row with the information below, entering data for each product in a separate row. Multiple applications of the same product in the same reporting interval can be combined to reduce data entry. However, applications of the same product in different reporting intervals must be entered on separate rows.
Date Range Select the date range during which the product was applied. If applied during multiple date ranges, enter the product on a separate row for each period.
Product Select the fertilizer product applied for each application. Enter blends and composts or manures as described here. If you are unable to find your product, please help us to improve this tool by listing that product in the Nutrient Feedback section.
Synthetic Blends -‐ If the product is a blend, choose “Synthetic Blend” from the drop-‐down list and enter the N-‐P-‐K values in the section below. A list of N-‐P-‐K values for most commercial fertilizer products is provided in Appendix D. If the product is in the drop-‐down list, simply select the product and enter the units and amount applied. Compost and Manure -‐ For compost and manure, select the appropriate material and enter N-‐P-‐K below if known. If N-‐P-‐K is not known, select values according to the appropriate feedstock from the table in Appendix C.
Amount Applied* Enter the amount of product applied to this SISC Management Area, either as total or rate per acre, according to what you selected in 3.1 above. You may enter the amount in any of the units provided in the list in the next column. IMPORTANT: Be sure to enter information that is consistent with your selection above at 3.1. Unit of Amount Applied* Select the units used to express the amount of fertilizer applied. Units are provided for both liquid and dry applications.
* Required field

Guide to SISC Metrics and Calculator (Beta Version 1.1)
Page 17 of 41
N, P2O5, and K2O* Enter the % N, % P2O5, and % K2O for blended fertilizer products. This is commonly known as the “N-‐P-‐K ratio” and can be found on the fertilizer label expressed as “XX-‐XX-‐XX.” It is not necessary to enter an N-‐P-‐K value if you select the product from the product drop down list. For your reference a table of many commercial fertilizers is found in Appendix D, organized by company name. (Note: the “P” and “K” in the N-‐P-‐K ratio on the label in fact represent P2O5 and K2O.) For compost, list N-‐P-‐K from a compost analysis, if known. If not known, refer to the table in Appendix C for estimated N-‐P-‐K values for your feedstock. Crop The crop “receiving” this application will be identified by the calculator and shown here.
Embedded Energy An estimate of the energy required to produce the total amount of fertilizer used (for all acres) is calculated and shown here in millions of BtUs.
Section 4 – Soil Organic Matter The soil metric requires that a soil sample be sent to a lab in order to evaluate Total Organic Carbon (TOC). Follow your lab’s instructions for collecting a soil sample. Lab results for TOC should be obtained at least every 5 years. USDA has a helpful factsheet about Total Organic Carbon and its importance as an indicator at http://soils.usda.gov/sqi/assessment/files/toc_sq_biological_indicator_sheet.pdf . 4.1: Soil Test Date Enter the date of the most recent soil test conducted, as well as the previous one. 4.2: Lab Test Method Select the method used by the laboratory to determine the results. The lab should use the dry combustion method to determine TOC. In Western states, this may include a testing method that accounts for soil carbonates. If you already have a lab test for Soil Organic Matter (SOM) using a Weight Loss on Ignition lab method, your lab may be able to convert this to TOC if it has a correction curve for your soil type. If this is the case, you should ask your lab to calculate this conversion. Several new soil carbon tests enable growers to measure change in soil organic carbon over a shorter time span, making this measurement more useful for gauging the benefit of land management practices. One is microbial biomass carbon, measured with a fumigation-‐extraction technique. Another method estimates carbon by measuring beta-‐glycosidase. While these methods are typically not available in commercial labs, they are often used by researchers and will also work for the soil metric. * Required field

Guide to SISC Metrics and Calculator (Beta Version 1.1)
Page 18 of 41
4.3 TOC Reported by Lab* TOC should be reported as a percent of carbon and entered in the calculator as a number between 0 and 100. 4.4: Soil Series Name* Soil series can be determined by locating your farm soil maps via the USDA’s Web Soil Survey. Follow these steps to determine the dominant soil series for your site. If tests are conducted in different locations, different soil series names may apply.
1. Visit NRCS’s Web Soil Survey at: http://websoilsurvey.nrcs.usda.gov/app/HomePage.htm . 2. Click on the green button that says “Start WSS”. 3. Click on the map near your farm. Keep clicking until you have zoomed into the particular field
where you took your soil sample. The map may load slowly. 4. Once the map is at the scale where you can select your field, click on the “AOI” (Area of Interest)
button and draw a rectangle or other shape around your field. (The rectangle button requires your field to be horizontal on the map. If this is not the case, choose the AOI button with a polygon shape, which will allow you to draw your own shape. Double click on the last corner of the shape to tell the program you are done drawing.)
5. Once your field is outlined, click on the “Soil Map” tab almost at the top of the screen, next to the “Area of Interest” tab.
6. Your soil series name can be found in the “Map Unit Legend” section on the left side of the screen, under “Map Unit Name.” Click on the name to see more information on this specific field.
7. Select the soil series name in the appropriate place in the Stewardship Index calculator. If a field contains multiple series, choose a dominant series to use.
4.5 Soil Texture* Enter your soil texture type. If not known, you may refer to information from the Web Soil Survey map above or see the USDA NRCS guide to soil texture in Appendix B. Section 5 – Water Use 5.1: Method for measuring applied water Select the method used to measure applied water. Include all irrigation events from the end of the previous harvest to the current harvest (i.e., harvest-‐to-‐harvest timeframe specified above). In order to maintain sufficient accuracy and precision, growers may select from one of the following water conveyance methods, based on irrigation conveyance type, that have been pre-‐approved for calculating applied water. Determination of “applied water” must be measured at the field (SISC Management Area) level. Method 4 provides a way to estimate field-‐level usage if actual measurement has not been performed. Approved methods for measuring applied water are listed here, with more detail on each provided below.
1. Irrigation District Reporting (with approved measurement devices)

Guide to SISC Metrics and Calculator (Beta Version 1.1)
Page 19 of 41
2. Closed Conduit Measuring Devices (aka pressurized pipe) 3. Standard Open Channel Measuring Devices for Surface Irrigation 4. Alternative to Direct Measurement: Using Power Records
Note: The standard for precision is +/-‐ 6% (Based on California Department of Water Resources standards).
1. Irrigation District Reporting If water is delivered by an irrigation district, district measurements may be used if each of the following conditions apply:
• Water is measured directly by an approved measurement device (see below). • Water is measured at the field/block level. • The field being measured is the same as where the crop is grown.
2. Closed Conduit Measuring Devices (aka Pressurized Pipe) If water is delivered through pressurized pipe, whether groundwater or surface water, to irrigation devices such as drip or center-‐pivot irrigation, then the following technologies are acceptable. Note that the pipeline must be flowing full to work properly and the water user must demonstrate a reliable method of recording total flows with a display unit.
• Mechanical in-‐line propeller meter • Insertion type electromagnetic meter • Full profile magnetic type flow meters, such as acoustic transit-‐time or Doppler flow meter.
3. Standard Open Channel Measuring Devices for Surface Irrigation If water is delivered via gravity-‐fed surface irrigation, such as flood or furrow irrigation, then the following methods are acceptable:
• Flow gates or control structures with an accurate rating curve and level sensors in an adjacent stilling well. Approved devices include:
o Sharp-‐crested weir o Undershot or Waterman gate (with up-‐ and downstream water levels) o Parshall flume o Trapezoidal flume o Ramped broad-‐crested weir (or ramped flume)
• Acoustic Doppler Flow Meter (ADFM) • A propeller meter for systems using gated pipe. An acoustic sensor or a pressure transducer
can be used for measuring the head on the meter.
4. Alternative to Direct Measurement: Using Power Records3 If none of the direct measurement methods is appropriate, then a grower may use extrapolation from power records to estimate the annual diversion from a pump as an alternative measurement method. The following conditions apply in order to qualify to use this method. Derivation of the Power Consumption Coefficient (PCC) is required, which is the ratio of the number of kilowatt-‐hours needed to pump an acre-‐foot of water. This number is unique to each
3 Excerpted from Idaho Department of Water Resources, “Minimum Acceptable Standards for Open Channel and Closed Conduit Measuring Devices.” October 2009

Guide to SISC Metrics and Calculator (Beta Version 1.1)
Page 20 of 41
well or pumping plant due to physical aspects of the system and can be applied to the year-‐end power records to determine the total acre-‐feet pumped. To determine the rate of flow, a portable measuring device, such as a non-‐invasive ultrasonic flow meter can be used. Simultaneous with the flow measurement, power is measured using the utility’s kilowatt-‐hour meter. A qualified individual with the necessary equipment will be required to perform these measurements. Because systems wear and water levels change, the flow-‐to-‐power ratio may change over time. Therefore, the power consumption coefficient must be re-‐calibrated at least once every three years. Pumps must be single speed, not variable rate or variable frequency. CONSTRAINTS: If any of the following are true, a different method must be utilized as then power records are unlikely to yield acceptable results:
• If the well flows (artesians) so that water can be diverted when the pump is off. • The electrical meter also records power used by other devices not integral to the
irrigation system. • The electrical meter records power used by more than one pump. • Variable frequency drives operate the pump, resulting in variable flow rates. • The energy supplied to the pump cannot be accurately and reliably measured. For
example, most diesel and propane driven pumps do not have provisions to measure the fuel used by the engine.
• The flow rate from the pump varies significantly due to changes in demand or operation. For example, pumps that discharge into a pressurized system sometimes and then open discharge at other times, or pumps that supply multiple pivots and/or other discharge points, would likely have flow rates that change considerably. These changes generally alter the flow to power ratio, causing inaccurate estimates of diversions.
5.2-‐5.3: Applied water quantity For each crop grown on this SISC Management Area, enter the per-‐acre volume of applied water for all irrigation events that occurred during the reporting interval specified by the Calculator. Be sure to indicate both the units used and the amount of water applied. Note: Crop Evapotranspiration A separate worksheet will be provided to calculate SISC’s Simple Irrigation Efficiency Metric, which requires a calculation of crop evapotranspiration . Section 6 – Pesticide Embedded Energy Although SISC does not currently have a pest management metric, data on pesticide use is required to calculate the energy embedded in applied pesticides. The calculator provides an approximate estimate of energy embedded in the application based on the type and amount of the product applied (see Technical Notes in Appendix B). Note that because actual values for pesticide embedded energy are not publically available, SISC is piloting a method to approximate embedded energy in pesticide products as described in Appendix B.

Guide to SISC Metrics and Calculator (Beta Version 1.1)
Page 21 of 41
6.1: Total amounts or per acre rate* Choose whether you’d like to enter pesticide product data as a total quantity applied to the entire SISC Management Area or as a rate per acre. 6.2: Pesticide Product Information Enter information for each pesticide product applied during the reporting time frame for the crop(s) harvested in this SISC Management Area, as indicated by the calculator. The calculator will specify the correct reporting interval for the crop(s) based on the current and previous harvest dates (or will start 12 months prior to the current harvest if no crop was harvested in the previous year). Multiple applications of the same product in the same reporting interval can be combined to reduce data entry. However, applications of the same product in different reporting intervals must be entered on separate rows.
Date Range * Select the date range during which the product was applied. If applied during multiple date ranges, enter the product on a separate row for each period.
Search by name or EPA registration number?* The calculator includes a database of pesticide products registered by U.S. EPA. You may search this database by product name or by EPA registration number using a drop-‐down menu. If you choose “by name”, the calculator will select the product based on the name you provide; if you choose “by EPA reg” the calculator will select the product based on the EPA registration number you provide.
Product Name Select the product name from the list if you have chosen to search by product name. If your product is found, the name and EPA registration number will appear in the gray boxes below your entry. Be sure to check that the EPA registration number looks right. If you have selected to search by EPA registration number you can ignore this field.
EPA Registration Number Enter the EPA registration number for your product if you have chosen this search method. If your product is found, the name and EPA registration number will appear in the gray boxes below your entry. Be sure to check that the product name looks right. If you have selected to search by product name you can ignore this field. Unit of Amount Applied* Select the units used to express the amount of pesticide applied. Units are provided for both liquid and dry applications. The calculator expects a weight-‐based unit for dry products. If you try to enter a volume-‐based unit for a dry product, the calculator will show “NA” under the Btu field and an error message on the right will request that you use a weight-‐based unit. Amount Applied* Enter the amount of product applied in this SISC Management Area, either as total or rate, depending on what you selected in 6.1 above and using the unit you specified.

Guide to SISC Metrics and Calculator (Beta Version 1.1)
Page 22 of 41
IMPORTANT: Be sure to enter information that is consistent with your selection above at 6.1. Crop The crop “receiving” this application will be identified by the calculator and shown here. No entry is required. Embedded Energy An estimate of the energy required to produce the total amount of fertilizer used (for all acres) is calculated and shown here in millions of BtUs. No entry is required.
Section 7 – Farm Energy Use Note: Data may be entered at the level of the Total Farmed Area or individual SISC Management Areas. Data should be reported for the 12-‐month period which ends with the date the last harvest was completed. The appropriate date range is specified by the calculator above the data entry table (i.e., above the entry fields for items 7.1 through 7.5). 7.1: Total Annual Electricity Use Select whether you would like to enter data for the Total Farmed Area or for the individual SISC Management Area(s). Enter total annual electricity use for the dates specified above the data entry table (the field where this data should go will turn blue once you make your selection). If your electricity bills do not coincide with these dates, prorate the electricity for the period of time included in the reporting year. Example: Your electric bill covers the period from October 15 through November 15, 2011 but your last date of harvest that year is October 25, 2011. The electricity should be prorated to include 10 of the 30 days in the billing period, which is 30% of the bill. If the bill is for 1000 kWh, 300 should be included in reporting year 2011 and the rest would be included in electricity for the 2012 reporting year. 7.2-‐7.5: Total Fuel Use For each fuel, select whether you would like to enter data for the Total Farmed Area or for the individual SISC Management Area(s). Enter total annual fuel use for the dates specified above the data entry table for diesel and gasoline fuels. Include both stationary sources (e.g. irrigation pumps) and mobile sources (e.g. farm equipment). On-‐road vehicles should not be included. If you use other fuels on your farm for either stationary or mobile equipment, please select the fuel type and enter the total annual usage. If you are unable to find the fuel on the drop down list, please indicate this in the feedback section. 7.6: Do you need to use the energy allocation calculator? The Energy Allocation Worksheet helps determine how much of your total fuel and/or electricity should be attributed to each crop. You are required to use this calculator unless you meet one of the following conditions:
1. You are reporting on one crop and one management area only, and that crop is the main user of electricity and fuel at your site.

Guide to SISC Metrics and Calculator (Beta Version 1.1)
Page 23 of 41
2. You are reporting on multiple management areas, know the electricity and fuel use of each management area, and are growing only one crop per management area (i.e., no rotation during reporting year).
If you meet one of these conditions, you do not need to complete the Energy Allocation Worksheet and should continue to the Contracted Service selection below. If you have more than one crop rotation in the year but feel you have good estimates of fuel and electricity use for each crop, please contact us to determine an easy way to transmit that information. The calculator is not currently set up to allow for this. Contracted Services (NOTE: This section will only appear if you have selected “no” in 7.6 above) Fuel from contracted services is included in the total fuel for the energy use metric. If you are completing the calculator for only one crop on one SISC Management Area AND know your data at the level of that Management Area, a section will appear on this worksheet asking you for data on contracted services. Otherwise, you will be asked to complete this information as part of the Energy Allocation Worksheet and Sections 7.6 and 7.7 will not appear. 7.6: Aerial Applications Enter the total number of aerial applications conducted during the reporting year. 7.7: Other Contracted Activities Complete a row for each activity contracted to a third party. If you have requested fuel data from the contractor, you may enter that directly into the gray box in the “Estimated Diesel Use” column. Otherwise, enter your best guess as to the number of operations and machinery horsepower used each activity.
Activity: Select the activity category that best describes the contracted service. If not found, select “other” and enter in the box to the right. Number of operations: Enter the number of operations of this activity conducted in the SISC Management Area. If you have requested fuel data from the contractor, you may skip this box. Horsepower: Enter you best estimate of the horsepower for the machinery used to conduct this operation. If you have requested fuel data from the contractor, you may skip this box. Estimated Diesel Use: This box will be calculated using the information entered in the previous two columns. If you’ve requested data from your contractor, you may override the calculation and enter that data here.
Activity Description If “other” was selected for the activity, please enter a short activity description here. Section 8 – Energy Allocation Worksheet

Guide to SISC Metrics and Calculator (Beta Version 1.1)
Page 24 of 41
This worksheet is designed to help you estimate how much fuel and electricity went to each crop if data is only known at the level of the Total Farmed Area (or SISC Management Area for multiple crop rotations). NOTE: You are only required to complete this section if your total fuel and electricity use was used to grow multiple crops. The worksheet asks for data on your farm machinery and how much it was used for each general farm management activity. This information is used to estimate diesel use for each crop. Similarly, the worksheet also asks for information on your main irrigation pumps in order to estimate electricity and/or fuel use from those sources. This information is used to estimate how much of your total energy use (fuel and electricity) should be attributed to a particular crop. If your fuel and electricity use is also used for non-‐reported crops, i.e., crops that are not part of the SISC pilot, you will be asked to describe some activities on the non-‐reported crops as well so that total energy use can be allocated to the SISC piloted crops. 8.1: Non-‐Reported Crop Area If your Total Farmed Area fuel or energy data includes crops that are not part of the SISC pilot (i.e., not reported on in the calculator), please enter the planted acreage and water applied for each non-‐reported area that shared in your total fuel and electricity use. This information can be estimated, rather than measured. If two or more non-‐reporting fields are managed similarly, they can be entered as a single field (i.e. one column) with the acreage of both fields added together. If space provided is inadequate, please note this in the feedback section. Example: You are reporting on one management area in this calculator, but there are three management areas on the farm. The only electricity data you have is your utility bill, which covers all three management areas. In this section, you would list the acreage of the two non-‐reporting areas and an estimate of how much water was applied to each area (can be a general estimate). 8.2: Farm Machinery Complete a row for each tractor or other farm machinery that is a major component of your fuel use. Though the lines say “Tractor”, you may enter other farm machinery in those rows—just select "Other machinery" from the list. If you operate more machinery than can be entered in the space provided, enter the largest and/or most frequently used. Default values are provided for horsepower, efficiency, and specific fuel consumption, but they may be overridden by entering data manually.
Tractor
Select the type of tractor that most closely describes yours. If the horsepower is not exactly right, it can be adjusted in the next column. For machinery other than tractors, select “Other machinery”.
Horsepower
Default values are provided for horsepower, but may be overridden by entering data manually. Therefore, if you have a 140HP 2WD tractor, select the 130 HP 2WD tractor from the list in the tractor column, and then enter 140 in the horsepower column. Fuel Consumption Default values are provided for fuel efficiency in gallons per hour, but may be overridden by entering data manually if you know your fuel efficiency more specifically.

Guide to SISC Metrics and Calculator (Beta Version 1.1)
Page 25 of 41
Fuel Type Diesel is the default fuel type, but other fuel types may be selected from the drop down list. Specific Fuel Consumption Default values are provided for specific fuel consumption in gallons per horsepower-‐hour, but may be overridden by entering data manually if you know your data more specifically.
8.3 Farm Irrigation Equipment Complete a row for each irrigation pump or booster used within the area for which you reported fuel and electricity (e.g. if you reported electricity at the Total Farmed Area level, include this information for all pumps on the farm). Though the rows say “Pump”, you may enter boosters here as well. Later, you will select the pump and booster used on each SISC Management Area. Power Source Select the power source used by the pump. Well Lift
Enter the depth, or total vertical distance that the pump moves water to the surface, in feet. Pressure Enter the pressure at the well head in PSI (pounds per square inch). Total Dynamic Head This field is calculated using the well lift and pressure information provided to estimate the “total dynamic head” of the pump. You may override this and enter data manually if you know this information.
8.4: Other Electrical Equipment The SISC on-‐farm metrics are not meant to include packing, shipping, or processing activities in the metric results. However, you may only receive one electrical bill with total electricity usage for your whole facility. In this section, please enter any major electricity users that are not directly associated with your farming operation. This includes cold storage and refrigeration, sorting and packing facilities, drying facilities, etc. Please describe the facility and estimate its electricity use. This will be subtracted from the total electricity you entered on the Energy Use page if you listed that energy use as “Total Farmed Area.” In the future, we hope to provide a more accurate way to estimate electricity use for these types of facilities as well. Your description of the facility will help us to improve this tool. 8.5: Estimated Use of Machinery, Irrigation and Contracted Services Information about machinery use and water applications is needed for both SISC-‐reported crops and fields where energy was used to produce crops that are not part of the SISC pilot. This information can be estimated, rather than measured. Information about contracted services for non-‐reporting fields is not required.

Guide to SISC Metrics and Calculator (Beta Version 1.1)
Page 26 of 41
If two or more non-‐reporting fields are managed similarly, they can be entered as a single field (i.e. one column) with the acreage of both fields added together. Irrigation For each SISC Management Area, select the pump and booster used on that area that corresponds to the information you entered in the previous “Farm Irrigation Equipment” section above. You may select up to two pieces of equipment. Tractor Passes In each category of farm management activities, select the main tractors and machinery used from the list of machinery that you entered in the previous section. Then enter the approximate number of passes conducted by each tractor type used. Repeat for each SISC Management Area. Enter approximate passes for contracted services separately and estimate tractor type used. Aerial Application Enter the total number of aerial applications for each crop. When finished, go to the “Energy Results” page to see the breakdown of your fuel and electricity.
Section 9 – Energy Results This page provides the results from the Energy Allocation Worksheet. You will find total energy use by crop and how that energy is broken down by source. The weighting factors created from the information you provided are included here. For fuels, weighting factors for diesel are assumed for all other fuel types. If you feel these weighting factors are inaccurate for the other fuels, you may change the numbers on this sheet, and the factors you enter will be used in the final results. Section 10 – Metric Dashboard After all that hard work, click on the Metric Dashboard to see your results! You may select to see results by acre or by yield in the blue box at the top.

Guide to SISC Metrics and Calculator (Beta Version 1.1)
Page 27 of 41
Appendix A – Confidentiality Policy
Stewardship Index for Specialty Crops Pilot Program Confidentiality Policy
I. Background and Rationale
The Stewardship Index for Specialty Crops (SISC) is a stakeholder collaboration of leading grower organizations, food buyers, trade associations and public interest organizations developing sustainability metrics for the specialty crop industry. SISC will not develop pass-‐fail standards, but will instead develop outcomes-‐based metrics so that all industry participants can measure their current level of performance, compare to their industry peer group, and benchmark continual improvement over time. SISC relies on volunteers from industry to test or “pilot” draft metrics in their operations to evaluate the metrics’ utility and practicality for users. SISC has developed this policy to preserve the confidentiality of the data that is contributed by volunteer pilot participants, while enabling the sharing of anonymized data and lessons learned with the SISC community. As described below, the balance between confidentiality and data sharing is as follows: First and foremost, SISC is fully committed to preserving the confidentiality of individual data contributed by pilot participants and will not disclose data that can be attributed to an individual person, company, farm or facility to any party, including other SISC members. However, SISC may share data, feedback and other pilot results that are truly anonymized, i.e., when the data cannot directly or indirectly be attributed to a particular pilot participant, under certain circumstances. Pilot feedback about the experience of piloting, e.g., difficulty, usefulness, availability of data, is not considered confidential (so long as it is anonymized). Quantitative performance data collected from pilot participants, e.g., pounds of nitrogen applied per acre, may be shared by the Coordinating Council that governs SISC if a majority of each of the three stakeholder groups (growers, buyers, NGOs) agree to do so, and, again, only if the data are fully anonymized. This policy seeks to advance the following goals: a. Provide assurance that SISC will not release data from pilot participants that can be attributed to
a particular participant; b. Enable SISC participants to freely exchange the lessons learned from the experiences of people
using and testing SISC metrics; c. Enable the SISC Coordinating Council, at its discretion, to share anonymized data from the pilots
if it deems that sharing this information will be beneficial to the project or of interest to pilot participants, Metric Review Committee workgroups or others. Figure 1, attached, provides one possible example of how such data might be presented.
II. Definitions a. ”Anonymized data” means data that cannot directly or indirectly be attributed to any individual
person, company, farm, or facility.

Guide to SISC Metrics and Calculator (Beta Version 1.1)
Page 28 of 41
b. “Confidential Information” means any data provided by a Discloser that 1) quantitatively
describes the participant’s business operations, including the calculation of SISC metrics and their sub-‐parts, for their farm or facility (quantitative performance data); or 2) can be attributed to any specific person, company, farm or facility. Confidential Information may include information that is transferred, manipulated, or used in writing, orally, electronically, or by drawings or inspection of samples, equipment or facilities. Exceptions: 1) Process data collected by the Data Administrator from a SISC pilot participant that describes
the process of using SISC metrics (but not the quantitative metric calculations or their sub-‐parts, which are confidential as described above) is not Confidential Information. See II.h. below for a definition of “Process data.”
2) Any material, data or information that is or becomes generally known or available to the public through no act or failure to act on the part of Administrators’ employees, volunteers, independent contractors, and board members is not confidential Information; and
3) Data or information that is the subject of a written permission to disclose provided by the Discloser is not Confidential Information.
c. “Coordinating Council” means the body of supplier, buyer, and NGO organizations/companies
responsible for making significant decisions to advance the SISC project including the approval of draft and final metrics. (For a list of Coordinating Council members, go to http://www.stewardshipindex.org/current_participants.php.)
d. “Data Administrator” means an Ag Innovations Network employee or other contractor approved
by SISC to manage pilot data. e. “Discloser” means any SISC pilot participant who provides Confidential Information to the Data
Administrator. f. “Eligible Recipient” means any SISC participant who has signed an approved binding Non-‐
Disclosure Agreement (NDA) with the Data Administrator, including but not limited to members of the Coordinating Council and Metric Review Committee workgroups, who receive Confidential Information in relation to the SISC pilot program.
g. “Metrics Review Committee” means the body of individuals who participate in the development
of metrics and/or monitor the metrics development process. (For a list of Metric Review Committee members, go to http://www.stewardshipindex.org/metrics_review_committee.php)
h. “Process data” means written or verbal feedback describing the pilot participant’s experience in
using the metrics, including cost, difficulty, complexity, utility, value, merit, suggested improvement, experience or other learning.
III. Collecting and maintaining data from pilot participants The Data Administrator shall invite pilot participants to submit data describing their operations as calculated with SISC metrics and their sub-‐parts and may review, analyze and maintain such data in accordance with this policy. Prior to accepting data from any participant, the Data Administrator will

Guide to SISC Metrics and Calculator (Beta Version 1.1)
Page 29 of 41
obtain a written (including electronic mail) acknowledgement from the Discloser confirming that the Discloser understands and consents to this Data Confidentiality Policy. The Data Administrator and other Recipients authorized to receive Confidential Information shall hold in confidence all Confidential Information in any form or medium disclosed or made available to them in confidence and/or used by them in the conduct of their duties and responsibilities with regard to SISC, regardless of whether such Confidential Information is (a) marked as confidential or secret or otherwise designated as proprietary, or (b) disclosed verbally, reduced to writing, and marked confidential. All such recipients of Confidential Information shall take precautions to prevent any unauthorized disclosure or use of any Confidential Information as described by this policy. Confidential Information shall remain confidential and subject to the terms of this Policy both during and after participation in the SISC pilot program. IV. Sharing process data The Data Administrator may share anonymized process data collected from pilot participants with the greater SISC community or other party. By definition, process data does not include quantitative data describing the business operations, metric calculations or data used to calculate SISC metrics. The Data Administrator may share only process data that is fully anonymized, and cannot be attributed to a particular person, company, farm or facility. Process data that can be attributed to an individual person, company, farm or facility is Confidential Information and cannot be shared or disclosed (unless a different exception applies, as described in Section I.b.3 or is required by law as described in Section VI). V. Sharing anonymized quantitative performance data Quantitative performance data includes the measurement of a farm or facility’s operations using SISC’s metrics, the sub-‐parts of SISC metrics and the data used to calculate these metrics and sub-‐parts. Examples include units of energy consumed, volume of water used or applied to crops, pounds of nitrogen applied to land, etc. Performance data may include the final metric calculation (e.g., the ratio of Btus per unit of production) or may include the sub-‐parts (e.g., the values for fuel and electricity consumed; crop yield, etc). As described above, this type of data is Confidential Information and may not be shared or disclosed except under the conditions described below.
a. Sharing anonymized data with an Eligible Recipient. The Data Administrator may share anonymized quantitative performance data with Eligible Recipients, as defined above, who have signed a binding non-‐disclosure agreement. Prior to sharing this information, the Data Administrator shall ensure that the data are fully anonymized and that no number, calculation or other information can be attributed to a particular person, company, farm or facility.
b. Sharing anonymized quantitative performance data with other parties. Upon a majority vote from each of the three SISC Coordinating Council stakeholder groups (i.e. a majority each of the grower, buyer and NGO organizations on the Council), the Council may freely share anonymized performance data with Metric Review Committee members, pilot participants, or other parties or the public, so long as this data is fully anonymized. See Figure 1, attached, for one possible example of such data.
VI. Intellectual property This Policy does not grant or imply any license to individuals to use for their personal or business activities, any proprietary information or intellectual property, regardless of whether it is deemed confidential under this Policy.

Guide to SISC Metrics and Calculator (Beta Version 1.1)
Page 30 of 41
VII. Limitations This Policy is not intended to preclude the disclosure of Confidential Information under any of the following circumstances: a. In response to a valid order of the court or other governmental body of the United States or any
political subdivision thereof, provided, however, that the party intending to disclose Confidential Information first gives written notice to the Discloser so they may seek to obtain a protective order requiring that the Confidential Information be used only for the purposes for which the order was issued and the disclosing party uses reasonable efforts to have such information be treated as confidential and under seal); or
b. Disclosure is otherwise required by law. VIII. Violations Recipient shall immediately give notice to Discloser of any unauthorized use or disclosure of Confidential Information. Recipient shall assist Discloser in remedying any such unauthorized use or disclosure of Confidential Information. Violations of the Confidentiality Policy are considered very serious and may result in removal from the project and/or legal liability. Figure 1: Sample presentation of anonymized quantitative performance data collected from SISC pilot participants.
Disclaimer: The data above were collected through pilot projects seeking to evaluate proposed Stewardship Index for Specialty Crops Metric. These data are preliminary, have been collected as part of a learning process designed to evaluate the validity of the Metric themselves, and may not be indicative of the region or industry represented.

Guide to SISC Metrics and Calculator (Beta Version 1.1)
Page 31 of 41
Confirmation and Acceptance of SISC Pilot Data Confidentiality Policy I have read and understood the attached SISC Pilot Data Confidentiality Policy. I hereby agree to share the data from my piloting effort with Ag Innovations Network, its representative, under the terms of this policy. Printed name: ____________________________________________ Signature: ____________________________________________ Date: ____________________________________________

Guide to SISC Metrics and Calculator (Beta Version 1.1)
Page 32 of 41
Appendix B – Technical Notes and References Energy As described above, the SISC energy metrics includes direct energy use (fuel and electricity) and the embedded energy in pesticide and fertilizer products. Electricity
• All electricity is included whether purchased or generated on-‐site. • Electricity data at the farm or SISC Management Area level is allocated following the allocation
method described below. • Electricity data is collected in kilowatt hours (kWh), as this is how it is typically reported on
utility bills. It will be converted to BtUs using the standard conversion of 3412.3 BtU/kWh. Fuel
• Fuel for stationary equipment and off-‐road mobile farm equipment is included. On-‐road vehicle fuel is not included.
• Fuel data at the farm or SISC Management Area level is allocated following the allocation method described below.
• Fuel energy values are converted to BtUs using data from the EPA’s Greenhouse Gas Inventory Protocol .4
• Fuel used by contractors to perform contracted services is included. Data is not required to be collected from contractors, but rather can be estimated using the allocation method described below.
Allocation Method The method for allocating fuel and electricity uses management information to determine approximate weighting factors which are then applied to the user’s actual data for fuel and electricity totals to estimate use by crop. Therefore, it is important to note the goal of the weighting exercise is to determine relative usage among crops, not to estimate actual usage. The exception to this is contracted services, for which these estimates are used in place of actual fuel use. Fuel
!"#$!"#$ ! = (!"#$ℎ!"#$ !"#$%&!"#$ !×!"#$%& !"#$ !"#!"#$) + !"#$!"#$%&'$() !"#$%&"' Where:
!"#$ℎ!"#$ !"#$%&!"#$ ! =!"#$ !"#$%&#'!"#$ !!"#$ !"#$%&#'!"" !"#$%
Fuel Estimates
4 US E.P.A. Office of Air and Radiation, “Direct Emissions from Mobile Combustion Sources”, Climate Leaders Greenhouse Gas Inventory Protocol Core Modular Guidance, EPA 430-‐K-‐08-‐004, May 2008

Guide to SISC Metrics and Calculator (Beta Version 1.1)
Page 33 of 41
Fuel estimates used in the weighting factor equation above are derived by summing the approximate fuel usage for several categories of activity. To minimize data requirements, this approach is only applied to diesel use. The weighting factors developed for diesel are then applied to any other fuels used. Users are given the option of manually adjusting the weighting factors for other fuels if they know the diesel factors are not representative of, for instance, their gasoline use. The following equation illustrates how fuel estimates for each activity categories are derived and then summed:
!"#$ !"#$%&#'!"#$ ! = (!!!"#$!%"×!"#!"#$!%" ×!"#$!"#$%&'!(× !"#$%&!"#$%&'!( ) + !"#$!""#$%&#'( Where:
HPtractor = Tractor Horsepower (entered by user) SFCtractor = Specific Fuel Consumption = Fuel Efficiency (gal/hr)/ Horsepower A default value of .0793 gal/hr-‐hp is used unless the user specifies another value for fuel efficiency, horsepower, or specific fuel consumption5 Timeoperation =Approximate time per acre for that category of activity. Values for this were derived by averaging values of activities for each category from the UC Davis Cost Return studies for tomatoes, potatoes, strawberries, and romaine lettuce hearts, as listed in Table 3.
Table 3. Average Operation times for Activity Categories Operation Average Time
(hrs/acre) Land preparation 0.27 Planting 0.44 Fertilizer application 0.28 Pest and weed control 0.39 Other cultivation practices 0.44 Harvesting 0.89
Numberoperation = Number of operations made by that tractor type for each activity category (entered by user) Fuelirrigation = Fuel used by irrigation pumps. See Irrigation Pumps below.
Contracted Services Fuel used by contractors to conduct contracted services is estimated using the same approach as above. Users are asked to estimate tractor type and horsepower for each activity. Fuel for aerial applications is included in contracted services. Electricity Allocation
5 This Specific Fuel Consumption value is the median of the values provided in: Grisso, et al. “Predicting Tractor Fuel Consumption.” University of Nebraska – Lincoln. 2004. http://digitalcommons.unl.edu/biosysengfacpub/164

Guide to SISC Metrics and Calculator (Beta Version 1.1)
Page 34 of 41
Similar to fuel, electricity is allocated by deriving weighting factors for each crop. As electric irrigation pumps consume a significant portion of the electricity used on most farms, weighting factors are derived by estimating electricity use by each electric pump, attributing it to crops watered by each pump according to the water quantities pumped. Irrigation Estimates The equation for calculating irrigation energy is:
!""#$%&#'( !"#$%&!"# =
!"#!!""# + !"#$$%"!!"#× 2.311 3960
!""#$#%&$!!"#!×!""#$#%&$!!"#$% ×!"#$% !"#$%&%!!"#$%&"× 27,154
60×!"#
Where:
2.311 = the standard conversion factor from psi to feet of water (a measure of pressure) 3,960 = the standard conversion factor from feet of water to horse power: hp = gallons per minute/3960. We assume gpm is 1. Efficiency!"#! = 0.58, an average taken from research published by the Texas Agricultural Extension Service (Table 3.6) Efficiency!"#$% = Power efficiency values for the following energy sources are used:7
• Electricity = 85% • Diesel = 30% • Natural gas = 20%
27,154 = the standard conversion from acre inches to gallons 60 = minutes per hour gpm = gallons per minute. A value of one is assumed.
Fertilizer Embedded Energy Fertilizer data is collected as total amounts for each product applied during the harvest-‐to-‐harvest period for each crop. The energy used to produce each type of fertilizer is derived as follows. Synthetic Fertilizers
• Energy to produce fertilizers is taken from a 2009 International Fertilizer Industry Association Report.8 Values are taken from the “World Today” column of the Energy Consumption in Selected Fertilizer Processes and Products table.
• Embedded energy in blended products is calculated by multiplying the volume of each nutrient in the blend by a coefficient. Coefficients were derived by averaging the different forms of each nutrient weighted according to their total production. Therefore the following equation is used:
6 New, L. Pumping Plant Efficiency and Irrigation Costs, Texas Agricultural Extension Service. See http://itc.tamu.edu/documents/extensionpubs/L-‐2218.pdf. 2 ibid 8 International Fertilizer Industry Association, “Fertilizers, Climate Change and Enhancing Agricultural Productivity Sustainably,” First edition, IFA, Paris, France, July 2009. Annex 1. Energy consumption in selected fertilizer processes and products. http://www.fertilizer.org/ifa/HomePage/SUSTAINABILITY/Climate-‐change

Guide to SISC Metrics and Calculator (Beta Version 1.1)
Page 35 of 41
!!"#$% = %! 48.9!"!"
+ %!2!5 1.7!"!"
+ %!2! 5.8!"!"
∗430!"#!"1 !"!"
Compost
• The value for embedded energy from compost production includes the energy required to turn
and process feedstock into compost. The feedstock itself was considered a byproduct, and thus no additional energy for feedstock production is included.
• Data is derived from the California Air Resources Board Composting Protocol (Aug 2010)9. A table in the report expresses overall fuel and non-‐irrigation electricity use per ton of compost feedstock for three separate windrows. Average values from these three windrows were used to estimate fuel and electricity use, as illustrated in the equation below.
• The process energy to produce compost is considered to be 148,996 BtU/ton compost. This value was arrived at using the following equation:
. 36 gal diesel !"#,!""" !"#!"# !"#$#% + 7.2 kWh !"#$ !"#!"#
ton feedstock ×
2 tons feedstock1 ton compost
= 148,996BtU
ton compost
Pesticide Embedded Energy The embedded energy estimates produced by the SISC calculator are approximate and may not be accurate for specific pesticide ingredients. While the method may be a reasonable approximation for many pesticides, it may significantly under or over-‐estimate embedded energy for some products (particularly for minerals, biopesticides, and oils). The Stewardship Index will continue to assess this methodology. Pesticide use data is collected by the calculator as total amounts for each product applied during the harvest-‐to-‐harvest period for each crop. The methodology for estimating embedded energy is based on a 2009 study by researchers at Cranfield University (Audsley et al 2009)10, which finds that the energy used to produce pesticide active ingredients can be approximated based on the chemical’s year of discovery (older chemicals are less energy intensive to manufacture per unit of weight than newer chemicals because of increasing complexity). The authors use previously published energy estimates for specific pesticide ingredients by Green (1987)11 to arrive the following equation:
! = −399 + 10.8 (! − 1900)
Where:
E = MJ/kg active ingredient Y = year of reported discovery
9 California Air Resources Board, “Proposed Method for Estimating GHG Emissions Resuctions from Compost from Commercial Organic Waste.” Aug 2010. Table 2, “Process Emissions from Compost Production” , p YY-‐11 10 Audsley, E. et al., “Estimation of the greenhouse gas emissions from agricultural pesticide manufacturing”, Cranfield University, August 2009. 11 Green, M.B., “Energy in pesticide manufacture, distri ution and use”. In Z.R. Helsel (ed) Energy in Plant Nutrition and Pest Control. Elsevier, Amsterdam, 1987. p. 165-‐177

Guide to SISC Metrics and Calculator (Beta Version 1.1)
Page 36 of 41
Using this approach, embedded energy is calculated as follows:
• Active ingredients are categorized into 5-‐year bands by year of discovery, for which energy is calculated using the Cranfield University equation above. Following the authors method, ingredients introduced prior 1940 are estimated as being produced in 1940. The year of introduction for 914 active ingredients was provided to the Stewardship Index by Benbrook Consulting, drawing from the FootPrint Database.12
• Embedded energy is calculated for each active ingredient for nearly 17,000 pesticide products registered by EPA (including those cancelled after 2005). Pesticide product data was provided by Benbrook Consulting, drawing EPA’s Pesticide Product Information System (PPIS).13 For each product, the embedded energy for each pesticide active ingredient was calculated and summed.
• Embedded energy for active ingredients for which no year of discovery was provided is assumed to be 475 MJ/Kg (median value for embedded energy among the most used pesticides in the United Kingdom, as calculated in the Cranfield paper).
• Data characterizing the density of pesticide products was downloaded from the California Department of Pesticide Regulation to estimate weight per volume for liquid pesticide products (the EPA PPIS database does not include density or specific gravity). Density of the formulated product was obtained from CDPR for approximately 8,000 of the pesticide products in the PPIS data14; Benbrook Consulting also provided density data for approximately 4000 products. Density for all other wet products in the EPA database for which density was not provided by CDPR or Benbrook Consulting, are assumed to have a formulation density of 9.11 lbs per gallon (derived by averaging densities of the products in the data provided by Benbrook Consulting). Wet products are those characterized in the PPIS data as Emulsifiable Concentrate, Flowable Concentrate, Invert-‐Emulsifiable Conc, Oils (no added pesticide), Pressurized Liquid, Ready-‐to-‐
12 Data provided by Benbrook Consulting on August 22, 2011. See http://sitem.herts.ac.uk/aeru/footprint. 13 See http://www.epa.gov/pesticides/PPISdata/ , “Product Formulation” 14 See http://www.cdpr.ca.gov/docs/label/prodtables.htm

Guide to SISC Metrics and Calculator (Beta Version 1.1)
Page 37 of 41
Use Solution, Soluble Concentrate, and Formulation Unidentified. Using the specified or assumed product density, BtU per gallon of product is also calculated for all wet products.
The Cranfield method is intended for synthetic pesticides (ie organic compounds) and is not applicable to predict the energy embedded in inorganic compounds such as sulfur, copper sulfate, kaolin, etc. As a result, embedded energy estimates calculated by the SISC Calculator for inorganic pesticide active ingredients may not be reasonable. SISC is currently reviewing this issue. In version 1.1 of the Calculator, compound-‐specific embedded energy values are included for two widely used inorganic pesticide ingredients: sulfur and lime: Sulfur EPA estimates that 90-‐95% of recovered sulfur is derived by the Claus process, which converts H2S to sulfur. 15 USGS estimates that agriculture uses at least 50% of the world’s elemental sulfur production. Assuming then that most agricultural sulfur is derived by the Claus process, we assume that the energy requirements of the process may serve as a proxy for embedded energy of sulfur in pesticide products. The Landbank UK estimated in 1994 that the Claus process requires 2.0 MJ heat and 0.1 MJ of electricity to produce 1 kg of sulfur.16 Thus, we use an embedded energy value for sulfur of 2.1 MJ/kg (903 Btu/lb). Lime SISC averaged embedded energy values published by the Ecoinvent Centre for two different lime manufacturing processes: Lime extracted from algae and lime produced as a byproduct of carbonation17. The un-‐weighted average of these values is 0.8 MJ/kg (344 Btus/lb). Nutrients The SISC calculator collects data in the form of the “N-‐P-‐K ratio” for both organic and synthetic fertilizers. Data is collected as total amounts for each product applied during the harvest-‐to-‐harvest period for each crop. Pounds of nitrogen and phosphorus applied are determined by summing all product applications for each crop’s harvest-‐to-‐harvest period. Synthetic fertilizers: • Because the “P” in the N-‐P-‐K ratio listed on fertilizer labels actually signifies the percent content of
P2O5, the following coefficient is used to convert pounds P2O5 to pounds P: 1 lb P2O5 = .44 lbs. P18
15 AP 42, Fifth Edition, Vol I, Section 8.13, “Sulfur Recovery,” EPA (1994), http://www.epa.gov/ttnchie1/ap42/ch08/final/c08s13.pdf 16 “The Phosphate Report Life Cycle Study: Lifecycle Assessment of Domestic Laundry Detergent Builders,” Landbank UK (1994), p. 46. Accessed via Centre Europeen d’Etudes des Polyphosphates (CEEP), a sector group of the European Chemical Industry Council (CEFIC), http://www.ceep-‐phosphates.org/Files/Document/53/part02_p046-‐050.pdf 17 Thomas Nemecek and Thomas Kagi, “Life Cycle Inventories of Agricultural Production Systems: Version 2.0 (2007),” Ecoinvent Centre, pp. 82-‐83 & 214.

Guide to SISC Metrics and Calculator (Beta Version 1.1)
Page 38 of 41
• An average density of 11.11 lbs/gal is used to convert liquid fertilizers into dry weight. This value was derived by averaging the density of several common liquid fertilizers as published by the Fluid Fertilizer Foundation. 19
Organic fertilizers • Where a nutrient analysis has been conducted, the N-‐P-‐K value from this analysis should be used. • Where growers do not know the nutrient value of the material, they may estimate values using a
nutrient analysis table from the Western Fertilizer Handbook, which is referenced in the calculator.20 • While it is recognized that organic fertilizers often have slow release properties, at this time SISC
does not attribute applications to multiple crops. Therefore, the entire nutrient value is attributed to the cultivated crop or subsequent crop if land is not cultivated at time of application. The benefits of the slow release should be visible when using the three-‐year average values, and SISC may revisit this component in the future.
Soil SISC ‘s soil metric is the measured total organic carbon of the soil divided by that soil’s potential to store organic carbon, as modeled using USDA’s Soil Management Assessment Framework (SMAF). A score approaching 1 (or 100%) indicates that the soil has realized its full potential to hold soil organic matter. While SMAF provides a suite of quantitative indicators for measuring different aspects of soil quality, the SISC metric and calculator use only the TOC indicator contained in SMAF.21 SMAF adjusts a soil’s TOC holding potential based on climate, soil series and soil texture. USDA has developed a national dataset for using SMAF, coding specific regions, soil types and textures into classes for use with SMAF. These data were also provided to SISC by USDA and are included in the SISC calculator.22 The SISC calculator requires the user to identify the soil series, soil texture and climactic region from drop down menus. Climactic regions are defined in the USDA data set for SMAF. The SISC calculator identifies the possible climactic regions for a given SISC Management Area depending on the county it resides in and includes them on a drop-‐down menu for selection by the user. The user is directed to USDA’s Web Soil Survey to find the soil series and texture for the sampled soil if these are not already known. Water
18 Mikkelsen, Robert, “Math Anxiety: Fertilizer Calculations”. International Plant Nutrition Institute Insights. Jan 2011 19 “Estimated Physical Characteristics of Fertilizer Material”, Fluid Fertilizer Foundation, http://www.fluidfertilizer.com/pdf/Fluid%20Characteristics.pdf 20 “Nutrient Analysis of Some Organic Materials”, Western Fertilizer Handbook–Ninth Edition, 2002, Table 15, p. 319-‐320 21 An Excel version of SMAF was provided to SISC by Doug Karlen at USDA’s Agriculture Research Services on March 23, 2011. An online version of SMAF is also hosted at http://soilquality.org/tools/smaf_intro.html, although this site was not functioning at the time of publication. More information about SMAF can be found in: Andrews, S., Karlen, D., Cambardella, C., Soil Management Assessment Framework: A Quantitative Soil Quality Evaluation Method, Soil Sci. Soc. Am. J. 68:1945–1962 (2004) (see http://ddr.nal.usda.gov/bitstream/10113/9094/1/IND43661863.pdf). 22 Data provided on April 5, 2011 by Susan Andrews, National Leader of the Soil Ecology Branch, National Soil Survey Center, Natural Resource Conservation Service, USDA.

Guide to SISC Metrics and Calculator (Beta Version 1.1)
Page 39 of 41
[SISC is currently developing a methodology and calculator for estimating Simple Irrigation Efficiency, which requires calculation of crop evapo-‐transpiration. The methodology will be included here.]

Guide to SISC Metrics and Calculator (Beta Version 1.1)
Page 40 of 41
Appendix C – Nutrient Analyses of Some Organic Materials Data from Western Fertilizer Handbook–Ninth Edition, 2002, Table 15, p. 319-‐320 Source %N %P2O5 %K20 Non-‐Composted Poultry (dry) Turkey/rice hull litter 1.75 2.65 1.85 Fresh broiler/rice hull 3.90 2.55 2.65 Fresh layer 3.95 6.25 3.35 Aged layer 2.15 8.20 3.95 Non-‐composted dairy/steer (dry) Fresh dairy separator solids 2.15 0.85 0.60 Fresh dairy corral scrapings 2.35 1.30 0.70 Aged Dairy separator solids 2.05 0.65 0.40 Aged steer corral scrapings 1.30 1.55 3.30 Composts (dry) Brioler/rice hull compost 1.90 4.30 2.50 Dairy 1.35 1.35 2.85 Dairy/gin trash 1.55 1.10 2.85 Dairy/steer 1.65 0.85 2.55 Dairy/poultry 1.70 1.95 3.30 Gin trash 2.25 0.80 2.50 Vermicompost 1.00-‐3.40 .07-‐.25 .77-‐1.41 Bulky organic materials (dry) Alfafa hay 2.50 0.50 2.10 Bean straw 1.20 0.25 1.25 Grain straw Cotton gin trash 0.60 0.20 1.10 Seaweed (kelp) 1.65 0.55 1.90 Winery pomace 0.20 0.10 0.60 1.50 1.50 0.75 Concentrated organic materials (as received) Alfafa meal 2.00-‐3.00 .50-‐1.00 1.00-‐3.00 Cottonseed meal 6.00-‐7.00 .40-‐3.00 1.00-‐2.00 Blood meal 10.00-‐14.00 1.00-‐2.00 .60-‐1.00 Bone meal 0-‐2.00 10.00-‐14.00 0 Hoof and horn meal 10.00-‐14.00 1.00-‐2.00 0 Fish meal 5.00-‐12.00 3.00-‐8.00 2.00-‐4.00 Fish emulsion 5.00-‐6.00 1.00-‐2.00 1.00-‐2.00 Kelp meal 1.00-‐1.50 .10-‐.50 2.00-‐4.00 Feather meal 12.00 0 0 Bat guano 8.00-‐13.00 2.00-‐5.00 .05-‐2.00 Sewage sludge (dried biosolids) .10-‐17.60 .10-‐14.30 .10-‐2.60 Tankage (dried animal residue) 7.00 8.60-‐10.00 .50-‐1.50

Guide to SISC Metrics and Calculator (Beta Version 1.1)
Page 41 of 41
Appendix D – N-‐P-‐K Values of Commercial Fertilizers Data from the California Department of Food and Agriculture (CDFA) Fertilizing Materials Program Note: The table below is a sample of the full table (15 pages), which can be found on the SISC website at:
www.stewardshipindex.org/pilot_materials.php
Firm Name Product %N %P %K 3 TIER TECHNOLOGIES LLC Huma-Cal Plus XL 6-0-0 6 0 0 3 TIER TECHNOLOGIES LLC Nitro 21-0-0 21 0 0 3 TIER TECHNOLOGIES LLC Growth 16-4-8 16 4 8 3 TIER TECHNOLOGIES LLC Maintain 8-16-8 8 16 8 3 TIER TECHNOLOGIES LLC Establish 5-16-12 5 16 12 3 TIER TECHNOLOGIES LLC Root & Groom 3-16-15 3 16 15 ACADIAN AGRITECH Acadian Organic Marine Plant Extract Powder 1-1-17 1 1 17 ACADIAN AGRITECH ACADIAN 100% LIQUID SEAWEED CONCENTRATE 0.3-0.0-
5.0 0.3 0 5 ACADIAN AGRITECH ACADIAN MARINE PLANT EXTRACT POWDER 1.0-1.0-17.0 1 1 17 ACADIAN SEAPLANTS LIMITED EXCITE SEAWEED SOLUBLE SEAWEED EXTRACT
POWDER 1-1-17 1 1 17 ADVANCED AGRICULTURE TECHNOLOGIES LTD
FTi-7 Super Growth Formula 11.38 3.89 16.01
ADVANCED PLANT NUTRITION LLC
APN FRUIT 15-0-9 15 0 9
AGRAKEY SOLUTIONS LLC UNLOK 25-0-0 25 0 0 AGRI TREND LLC Green Leaf 4-30-8 4 30 8 AGRI TREND LLC GREEN LEAF 0-28*-26 0 28 26 AGRI TREND LLC AGRI TREND SOLUBLE 12-26-26 12 26 26 AGRIMAR CORP GOEMAR CALIBRA 0-3-2 0 3 2 AGRIMAR CORP GOEMAR MZ 63 5-0-0 5 0 0 AGRIMAR CORP GOEMAR RHIZOPHOS 0-26-5 0 26 5 AGRIMAR CORP GOEMAR BM 86 5-0-0 5 0 0 AGRIMAR CORP GOEMAR HEADSET 6-0-0 6 0 0 AGRIUM ADVANCED TECH (US) INC
BERRY SELECT CONTROLLED RELEASE FERTILIZER 18-6-12 18 6 12
AGRIUM ADVANCED TECH (US) INC
BERRY SELECT CONTROLLED-RELEASE FERTILZIER 18-8-13 18 8 13
AGRIUM ADVANCED TECH (US) INC
BERRY SELECT CONTROLLED RELEASE FERTILIZER 22-7-10 22 7 10
AGRIUM ADVANCED TECH (US) INC
POLYON NPK 18-6-12 SGN 300 18 6 12
AGRIUM ADVANCED TECH (US) INC
POLYON NPK 19-6-12 SGN 300 19 6 12
AGRIUM ADVANCED TECH (US) INC
POLYON NPK 20-6-13 SGN 300 20 6 13
AGRIUM ADVANCED TECH (US) INC
POLYON MAP 10-47-0 SGN 310 10 47 0