guide to traffic generating developments. updated traffic surveys
TRANSCRIPT
Supersedes/Amends TDT 2013/04 Published August 2013
Technical Direction For traffic, safety and transport practitioners OPERATIONAL POLICY – GUIDELINES – ADVICE
TDT 2013/
04aGuide to Traffic Generating Developments Updated traffic surveys Introduction The Guide to Traffic Generating Developments was first released in 1991. It was revised in 2001 and is in the process of being further revised. It provides guidance on a number of matters related to the traffic impacts of land use developments, most notably on matters relating to traffic generation and parking. Its audience extends beyond that of traffic authorities (RMS and Councils) and is widely used throughout Australia.
Over the past few years a number of surveys have been undertaken to update trip generation and parking information as part of the Guide. This Technical Direction provides a summary of the updated information. The information herein should be used to supplement the current Guide and replace those sections of the Guide indicated. The information is provided in two parts; (i) a very brief summary below and (ii) more extended summaries in Appendices A-H. More detailed information may be obtained by referral to the RMS Library where reports on each land use may be found.
Summaries of land use traffic generation Low density residential dwellings
Eleven surveys were conducted in 2010, six within the Sydney urban area and five within regional NSW. The results of the surveys were as follows:
Rates Daily vehicle trips = 10.7 per dwelling in Sydney, 7.4 per dwelling in regional areas Weekday average evening peak hour vehicle trips = 0.99 per dwelling in Sydney (maximum 1.39), 0.78 per dwelling in regional areas (maximum 0.90). Weekday average morning peak hour vehicle trips = 0.95 per dwelling in Sydney (maximum 1.32), 0.71 per dwelling in regional areas (maximum 0.85). (The above rates do not include trips made internal to the subdivision, which may add up to an additional 25%).
Distribution List: Director, Infrastructure Development; RMS Development Managers; RMS Land use/Planning Officers; Councils; Land & Environment Court Officers and Consultants.
For further enquiries www.rms.nsw.gov.au I E [email protected]
Amendment: Required Action (Pg 3) amended. Approved: R O’Keefe, Mgr Traffic Policy, Guidelines & Legislation RMS. 13.298 1 (22 pages)
UNCONTROLLED WHEN PRINTED
Guide to Traffic Generating Developments – updated traffic surveys | August 2013 2 (22 pages) UNCONTROLLED WHEN PRINTED
High density residential flat dwellings
Ten surveys were conducted in 2012, eight within Sydney, and one each in the Hunter and Illawarra. All developments were (i) close to public transport, (ii) greater than six storeys and (iii) almost exclusively residential in nature. The weekday trip generation rates were as follows:
Weekday Rates SydneyAverage
Sydney Range
Regional Average
Regional Range
AM peak (1 hour) vehicle trips per unit 0.19 0.07-0.32 0.53 0.39-0.67 AM peak (1 hour) vehicle trips per car space 0.15 0.09-0.29 0.35 0.32-0.37 AM peak (1 hour) vehicle trips per bedroom 0.09 0.03-0.13 0.21 0.20-0.22 PM peak (1 hour) vehicle trips per unit 0.15 0.06-0.41 0.32 0.22-0.42 PM peak (1hour) vehicle trips per car space 0.12 0.05-0.28 0.26 0.11-0.40 PM peak (1 hour) vehicle trips per bedroom 0.07 0.03-0.17 0.15 0.07-0.22 Daily vehicle trips per unit 1.52 0.77-3.14 4.58 4.37-4.78 Daily vehicle trips per car space 1.34 0.56-2.16 3.22 2.26-4.18 Daily vehicle trips per bedroom 0.72 0.35-1.29 1.93 1.59-2.26
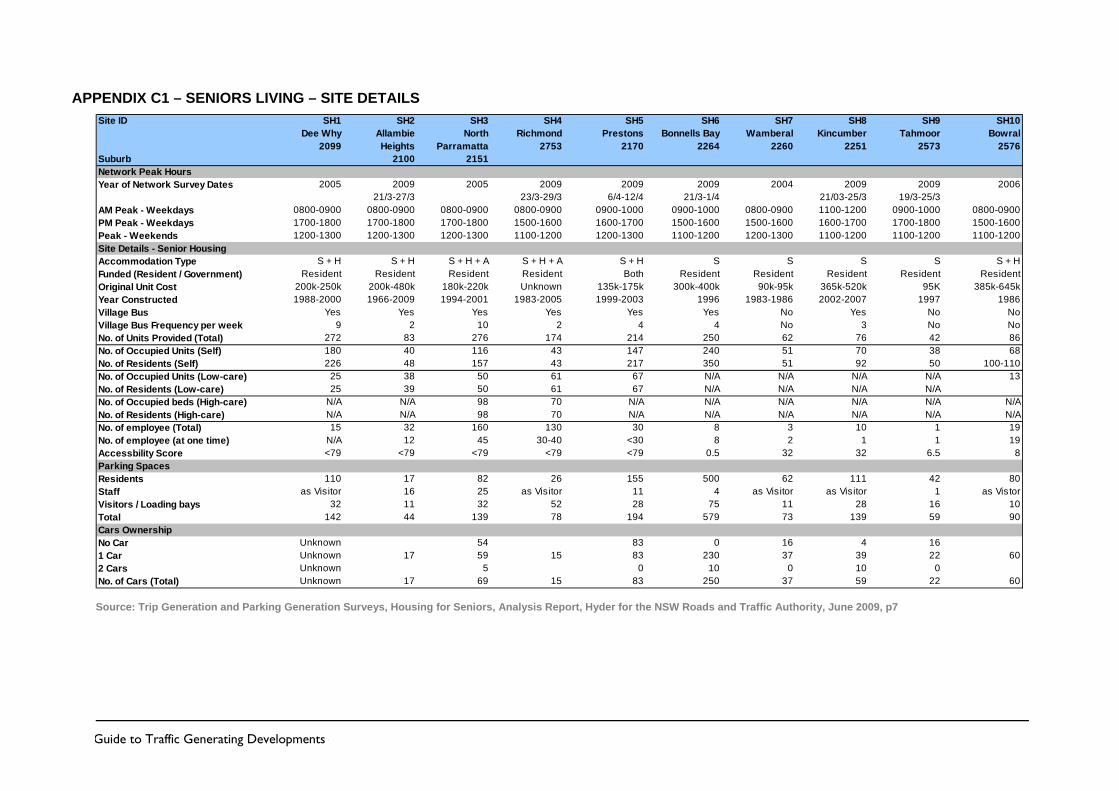
Housing for seniors
Ten surveys were conducted in 2009, five within the Sydney urban area and five in regional New South Wales. Summary trip generation rates were as follows:
Weekday daily vehicle trips = 2.1 per dwelling Weekday peak hour vehicle trips = 0.4 per dwelling (Note that morning site peak hour does not generally coincide with the network peak hour)
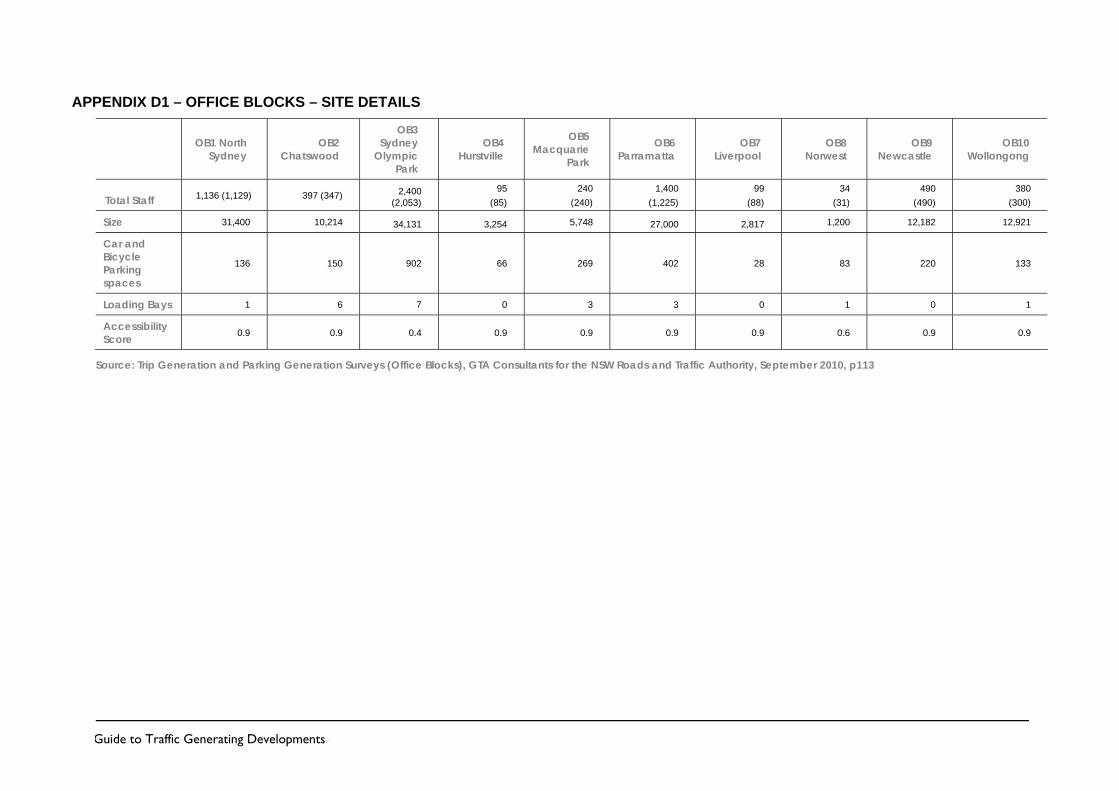
Office blocks
Ten surveys were conducted in 2010. Eight of the surveys were conducted within the Sydney urban area and one each in Newcastle and Wollongong. The Sydney sites provided a range of locations with two inner ring sites, four middle ring sites and two outer ring sites. Most had access to the rail network. Summary trip generation rates were as follows:
Daily vehicle trips = 11 per 100 m2 gross floor area Morning peak hour vehicle trips = 1.6 per 100 m2 gross floor area. Evening peak hour vehicle trips = 1.2 per 100 m2 gross floor area.
Business parks and industrial estates
In 2012 eleven of these two types of sites were surveyed, four within the Sydney urban area, four within the Lower Hunter, one in the Illawarra and one in Dubbo. Summary vehicle trip generation rates were as follows:
Weekday Rates Sydney Average
Sydney Range
Regional Average
Regional Range
AM peak (1 hour) vehicle trips per 100 m2 of GFA. 0.52 0.15-1.31 0.70 0.32-1.20 PM peak (1 hour) vehicle trips per 100 m2 of GFA. 0.56 0.16-1.50 0.78 0.39-1.30 Daily total vehicle trips 4.60 1.89-10.47 7.83 3.78-11.99
Guide to Traffic Generating Developments – updated traffic surveys | August 2013 3 (22 pages) UNCONTROLLED WHEN PRINTED
Shopping Centres Extensive surveys of shopping centres were conducted in 1978, 1990 and again in 2011. The latter survey involved ten larger shopping centres, seven in the Sydney metropolitan area and one each at Mittagong, Shellharbour and Tuggerah. Peak hour trip generation rates are as follows:
Peak Hour Generation Rate (vehicles per 100m2 GLFA) Range in Total Floor Area (GLFA – m2) Thursday
(V(P)/A) Friday
(V(P)/A) Saturday PVT (A)
Sunday
0 – 10,000 12.3 12.5 16.3 10,000 – 20,000 7.6 (6.2) 6.2 (6.7) 7.5 (7.5) (6.6) 20,000 – 30,000 5.9 (6.0) 5.6 (5.9) 7.5 (7.0) (6.3) 30,000 – 40,000 4.6 3.7 6.1 40,000 – 70,000 (4.4) (4.4) (5.5) (4.6)
70,000+ (3.1) (4.0) (3.6) (3.2) * Figures in brackets refer to 2011 surveys. Other figures are as per 1978 and 1990 surveys. Caution should be used in comparing the data in that they reflect changes in shopping behaviours. Seasonally adjusted rates appear to be in the order of 3-5% higher than the quoted 2011 rates.
Bulky goods retail stores
Six surveys were conducted in 2009. Two of the surveys were conducted within the Sydney urban area (one electrical goods and one furniture) and four within regional New South Wales (two electrical goods and two furniture). Summary vehicle trip rates are as follows:
Weekday daily vehicle trips = 17 (including 1 heavy) vehicles per 100 m2 of gross floor area) Weekday peak hour vehicle trips = 2.7 vehicles per 100 m2 of gross floor area. (note that the morning site peak hour during weekdays does not generally coincide with the network peak hour.) Weekend day daily vehicle trips = 19 vehicles per 100 m2 of gross floor area (minimal heavy vehicles) Weekend day peak hour vehicle trips = 3.9 vehicles per 100 m2 of gross floor area.
Major hardware and building supplies stores
Nine surveys were conducted in 2009. Five of the surveys were conducted within the Sydney urban area and four within regional New South Wales. Summary vehicle trip rates are as follows:
Weekday daily vehicle trips = 33 vehicles per 100 m2 of gross floor area (includes 2 heavy vehicles) Weekday peak hour vehicle trips = 4.2 vehicles per 100 m2 of gross floor area. (Note that higher trip rates are observed in the PM network peak with commensurately higher traffic impacts at that time.) Weekend day daily vehicle trips = 35 vehicles per 100 m2 of gross floor area (minimal heavy vehicles) Weekend day peak hour vehicle trips = 5.6 vehicles per 100 m2 of gross floor area.
Action This Technical Direction must be followed when RMS is undertaking trip generation and/or parking demand assessments.
Guide to Traf
Approved by: SIGNED Craig Moran General Manager Traffic & Safety Management
Authorised by: SIGNED Jim Peachman A/Director Journey Management
Printed copies of this Technical Direction are uncontrolled, therefore the Register should always be checked prior to using this Technical Direction or any related guidelines.
To ensure that this Technical Direction and any related guidelines remain current and relevant, minor updates may be made from time to time. Any updates may be obtained from the RMS website using the Traffic & Transport Policies & Guidelines Register which can be found at:
Updates
fic Generating Developments – updated traffic surveys | August 2013
www.rta.nsw.gov.au/doingbusinesswithus/guidelines/documentregister/index.html
UNCONTROLLED WHEN PRINTED 4 (22 pages)
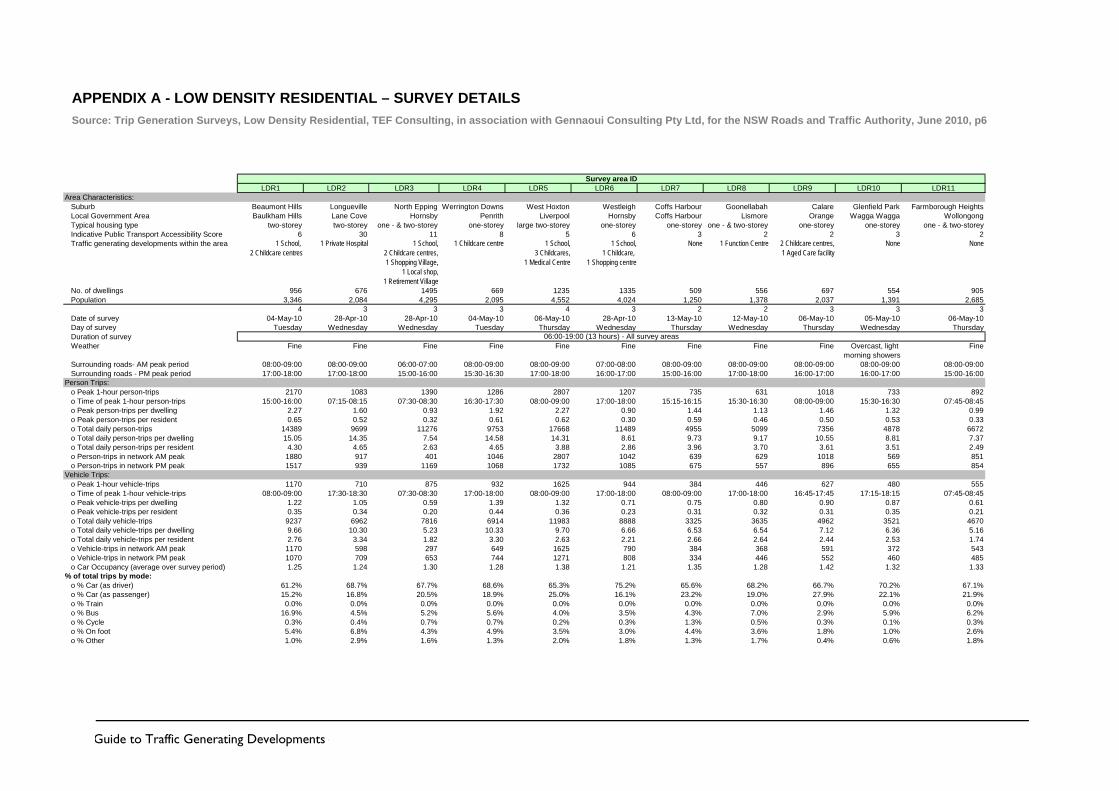
APPENDIX A - LOW DENSITY RESIDENTIAL – SURVEY DETAILS Source: Trip Generation Surveys, Low Density Residential, TEF Consulting, in association with Gennaoui Consulting Pty Ltd, for the NSW Roads and Traffic Authority, June 2010, p6
LDR1 LDR2 LDR3 LDR4 LDR5 LDR6 LDR7 LDR8 LDR9 LDR10 LDR11Area Characteristics:
Suburb Beaumont Hills Longueville North Epping Werrington Downs West Hoxton Westleigh Coffs Harbour Goonellabah Calare Glenfield Park Farmborough HeightsLocal Government Area Baulkham Hills Lane Cove Hornsby Penrith Liverpool Hornsby Coffs Harbour Lismore Orange Wagga Wagga WollongongTypical housing type two-storey two-storey one - & two-storey one-storey large two-storey one-storey one-storey one - & two-storey one-storey one-storey one - & two-storeyIndicative Public Transport Accessibility Score 6 30 11 8 5 6 3 2 2 3 2Traffic generating developments within the area 1 School,
2 Childcare centres1 Private Hospital 1 School,
2 Childcare centres,1 Shopping Village,
1 Local shop,1 Retirement Village
1 Childcare centre 1 School,3 Childcares,
1 Medical Centre
1 School,1 Childcare,
1 Shopping centre
None 1 Function Centre 2 Childcare centres,1 Aged Care facility
None None
No. of dwellings 956 676 1495 669 1235 1335 509 556 697 554 905Population 3,346 2,084 4,295 2,095 4,552 4,024 1,250 1,378 2,037 1,391 2,685
4 3 3 3 4 3 2 2 3 3 3Date of survey 04-May-10 28-Apr-10 28-Apr-10 04-May-10 06-May-10 28-Apr-10 13-May-10 12-May-10 06-May-10 05-May-10 06-May-10Day of survey Tuesday Wednesday Wednesday Tuesday Thursday Wednesday Thursday Wednesday Thursday Wednesday ThursdayDuration of surveyWeather Fine Fine Fine Fine Fine Fine Fine Fine Fine Overcast, light
morning showersFine
Surrounding roads- AM peak period 08:00-09:00 08:00-09:00 06:00-07:00 08:00-09:00 08:00-09:00 07:00-08:00 08:00-09:00 08:00-09:00 08:00-09:00 08:00-09:00 08:00-09:00Surrounding roads - PM peak period 17:00-18:00 17:00-18:00 15:00-16:00 15:30-16:30 17:00-18:00 16:00-17:00 15:00-16:00 17:00-18:00 16:00-17:00 16:00-17:00 15:00-16:00
Person Trips:o Peak 1-hour person-trips 2170 1083 1390 1286 2807 1207 735 631 1018 733 892o Time of peak 1-hour person-trips 15:00-16:00 07:15-08:15 07:30-08:30 16:30-17:30 08:00-09:00 17:00-18:00 15:15-16:15 15:30-16:30 08:00-09:00 15:30-16:30 07:45-08:45o Peak person-trips per dwelling 2.27 1.60 0.93 1.92 2.27 0.90 1.44 1.13 1.46 1.32 0.99o Peak person-trips per resident 0.65 0.52 0.32 0.61 0.62 0.30 0.59 0.46 0.50 0.53 0.33o Total daily person-trips 14389 9699 11276 9753 17668 11489 4955 5099 7356 4878 6672o Total daily person-trips per dwelling 15.05 14.35 7.54 14.58 14.31 8.61 9.73 9.17 10.55 8.81 7.37o Total daily person-trips per resident 4.30 4.65 2.63 4.65 3.88 2.86 3.96 3.70 3.61 3.51 2.49o Person-trips in network AM peak 1880 917 401 1046 2807 1042 639 629 1018 569 851o Person-trips in network PM peak 1517 939 1169 1068 1732 1085 675 557 896 655 854
Vehicle Trips:o Peak 1-hour vehicle-trips 1170 710 875 932 1625 944 384 446 627 480 555o Time of peak 1-hour vehicle-trips 08:00-09:00 17:30-18:30 07:30-08:30 17:00-18:00 08:00-09:00 17:00-18:00 08:00-09:00 17:00-18:00 16:45-17:45 17:15-18:15 07:45-08:45o Peak vehicle-trips per dwelling 1.22 1.05 0.59 1.39 1.32 0.71 0.75 0.80 0.90 0.87 0.61o Peak vehicle-trips per resident 0.35 0.34 0.20 0.44 0.36 0.23 0.31 0.32 0.31 0.35 0.21o Total daily vehicle-trips 9237 6962 7816 6914 11983 8888 3325 3635 4962 3521 4670o Total daily vehicle-trips per dwelling 9.66 10.30 5.23 10.33 9.70 6.66 6.53 6.54 7.12 6.36 5.16o Total daily vehicle-trips per resident 2.76 3.34 1.82 3.30 2.63 2.21 2.66 2.64 2.44 2.53 1.74o Vehicle-trips in network AM peak 1170 598 297 649 1625 790 384 368 591 372 543o Vehicle-trips in network PM peak 1070 709 653 744 1271 808 334 446 552 460 485o Car Occupancy (average over survey period) 1.25 1.24 1.30 1.28 1.38 1.21 1.35 1.28 1.42 1.32 1.33
% of total trips by mode:o % Car (as driver) 61.2% 68.7% 67.7% 68.6% 65.3% 75.2% 65.6% 68.2% 66.7% 70.2% 67.1%o % Car (as passenger) 15.2% 16.8% 20.5% 18.9% 25.0% 16.1% 23.2% 19.0% 27.9% 22.1% 21.9%o % Train 0.0% 0.0% 0.0% 0.0% 0.0% 0.0% 0.0% 0.0% 0.0% 0.0% 0.0%o % Bus 16.9% 4.5% 5.2% 5.6% 4.0% 3.5% 4.3% 7.0% 2.9% 5.9% 6.2%o % Cycle 0.3% 0.4% 0.7% 0.7% 0.2% 0.3% 1.3% 0.5% 0.3% 0.1% 0.3%o % On foot 5.4% 6.8% 4.3% 4.9% 3.5% 3.0% 4.4% 3.6% 1.8% 1.0% 2.6%o % Other 1.0% 2.9% 1.6% 1.3% 2.0% 1.8% 1.3% 1.7% 0.4% 0.6% 1.8%
Survey area ID
06:00-19:00 (13 hours) - All survey areas
Guide to Traffic Generating Developments – updated traffic surveys | May 2013 5 (22 pages) UNCONTROLLED WHEN PRINTED
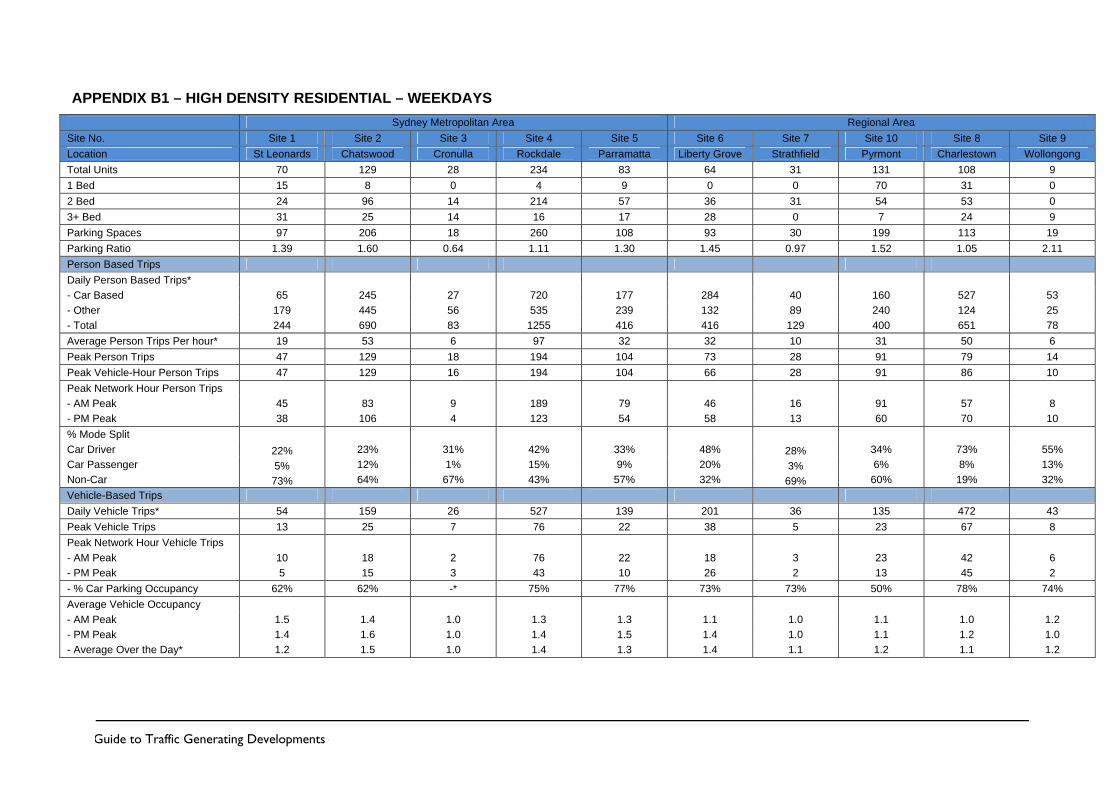
APPENDIX B1 – HIGH DENSITY RESIDENTIAL – WEEKDAYS Sydney Metropolitan Area Regional Area Site No. Site 1 Site 2 Site 3 Site 4 Site 5 Site 6 Site 7 Site 10 Site 8 Site 9 Location St Leonards Chatswood Cronulla Rockdale Parramatta Liberty Grove Strathfield Pyrmont Charlestown Wollongong Total Units 70 129 28 234 83 64 31 131 108 9 1 Bed 15 8 0 4 9 0 0 70 31 0 2 Bed 24 96 14 214 57 36 31 54 53 0 3+ Bed 31 25 14 16 17 28 0 7 24 9 Parking Spaces 97 206 18 260 108 93 30 199 113 19 Parking Ratio 1.39 1.60 0.64 1.11 1.30 1.45 0.97 1.52 1.05 2.11 Person Based Trips Daily Person Based Trips* - Car Based 65 245 27 720 177 284 40 160 527 53 - Other 179 445 56 535 239 132 89 240 124 25 - Total 244 690 83 1255 416 416 129 400 651 78 Average Person Trips Per hour* 19 53 6 97 32 32 10 31 50 6 Peak Person Trips 47 129 18 194 104 73 28 91 79 14 Peak Vehicle-Hour Person Trips 47 129 16 194 104 66 28 91 86 10 Peak Network Hour Person Trips - AM Peak 45 83 9 189 79 46 16 91 57 8 - PM Peak 38 106 4 123 54 58 13 60 70 10 % Mode Split Car Driver 22% 23% 31% 42% 33% 48% 28% 34% 73% 55% Car Passenger 5% 12% 1% 15% 9% 20% 3% 6% 8% 13% Non-Car 73% 64% 67% 43% 57% 32% 69% 60% 19% 32% Vehicle-Based Trips Daily Vehicle Trips* 54 159 26 527 139 201 36 135 472 43 Peak Vehicle Trips 13 25 7 76 22 38 5 23 67 8 Peak Network Hour Vehicle Trips - AM Peak 10 18 2 76 22 18 3 23 42 6 - PM Peak 5 15 3 43 10 26 2 13 45 2 - % Car Parking Occupancy 62% 62% -* 75% 77% 73% 73% 50% 78% 74% Average Vehicle Occupancy - AM Peak 1.5 1.4 1.0 1.3 1.3 1.1 1.0 1.1 1.0 1.2 - PM Peak 1.4 1.6 1.0 1.4 1.5 1.4 1.0 1.1 1.2 1.0 - Average Over the Day* 1.2 1.5 1.0 1.4 1.3 1.4 1.1 1.2 1.1 1.2
Guide to Traffic Generating Developments – updated traffic surveys | May 2013 6 (22 pages) UNCONTROLLED WHEN PRINTED
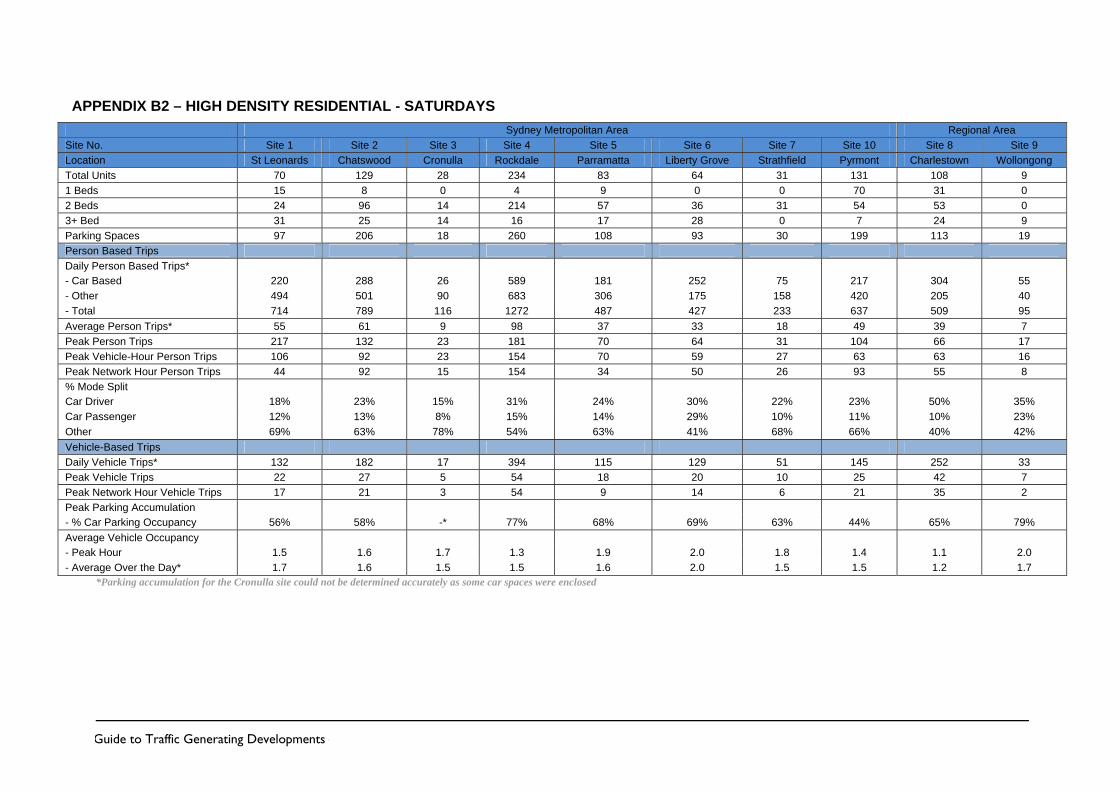
APPENDIX B2 – HIGH DENSITY RESIDENTIAL - SATURDAYS Sydney Metropolitan Area Regional Area Site No. Site 1 Site 2 Site 3 Site 4 Site 5 Site 6 Site 7 Site 10 Site 8 Site 9 Location St Leonards Chatswood Cronulla Rockdale Parramatta Liberty Grove Strathfield Pyrmont Charlestown Wollongong Total Units 70 129 28 234 83 64 31 131 108 9 1 Beds 15 8 0 4 9 0 0 70 31 0 2 Beds 24 96 14 214 57 36 31 54 53 0 3+ Bed 31 25 14 16 17 28 0 7 24 9 Parking Spaces 97 206 18 260 108 93 30 199 113 19 Person Based Trips Daily Person Based Trips* - Car Based 220 288 26 589 181 252 75 217 304 55 - Other 494 501 90 683 306 175 158 420 205 40 - Total 714 789 116 1272 487 427 233 637 509 95 Average Person Trips* 55 61 9 98 37 33 18 49 39 7 Peak Person Trips 217 132 23 181 70 64 31 104 66 17 Peak Vehicle-Hour Person Trips 106 92 23 154 70 59 27 63 63 16 Peak Network Hour Person Trips 44 92 15 154 34 50 26 93 55 8 % Mode Split Car Driver 18% 23% 15% 31% 24% 30% 22% 23% 50% 35% Car Passenger 12% 13% 8% 15% 14% 29% 10% 11% 10% 23% Other 69% 63% 78% 54% 63% 41% 68% 66% 40% 42% Vehicle-Based Trips Daily Vehicle Trips* 132 182 17 394 115 129 51 145 252 33 Peak Vehicle Trips 22 27 5 54 18 20 10 25 42 7 Peak Network Hour Vehicle Trips 17 21 3 54 9 14 6 21 35 2 Peak Parking Accumulation - % Car Parking Occupancy 56% 58% -* 77% 68% 69% 63% 44% 65% 79% Average Vehicle Occupancy - Peak Hour 1.5 1.6 1.7 1.3 1.9 2.0 1.8 1.4 1.1 2.0 - Average Over the Day* 1.7 1.6 1.5 1.5 1.6 2.0 1.5 1.5 1.2 1.7
*Parking accumulation for the Cronulla site could not be determined accurately as some car spaces were enclosed
Guide to Traffic Generating Developments – updated traffic surveys | May 2013 7 (22 pages) UNCONTROLLED WHEN PRINTED
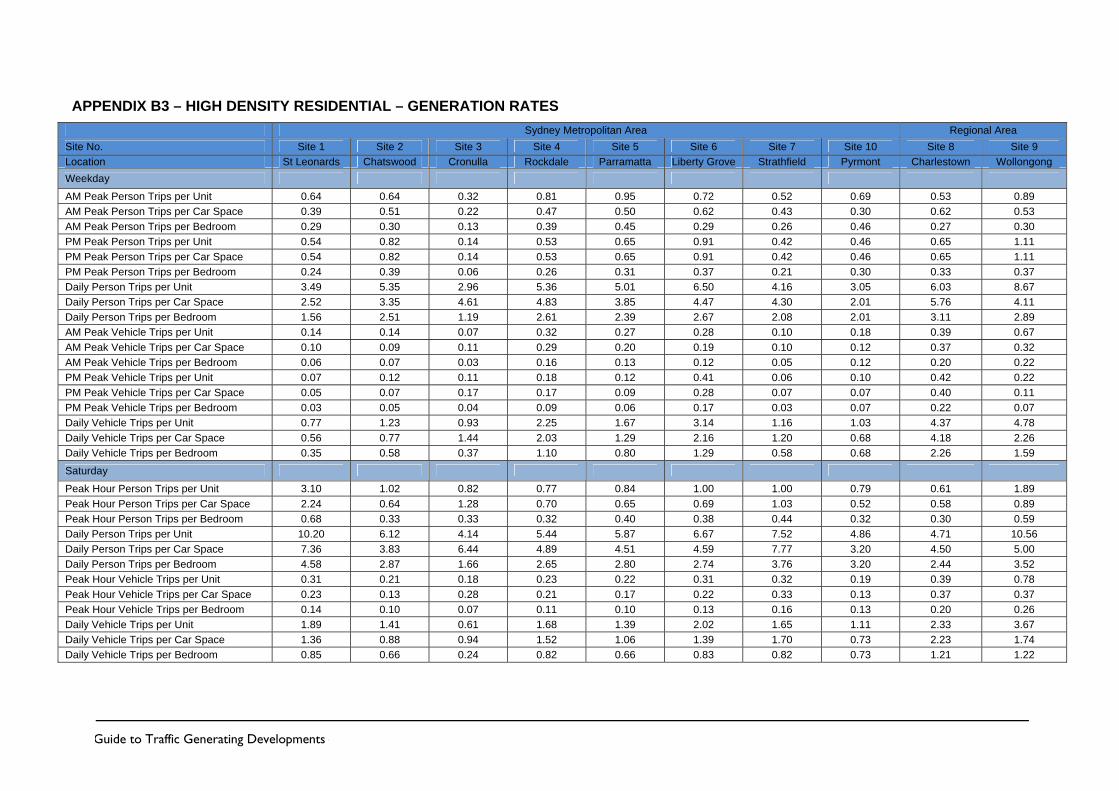
APPENDIX B3 – HIGH DENSITY RESIDENTIAL – GENERATION RATES Sydney Metropolitan Area Regional Area Site No. Site 1 Site 2 Site 3 Site 4 Site 5 Site 6 Site 7 Site 10 Site 8 Site 9 Location St Leonards Chatswood Cronulla Rockdale Parramatta Liberty Grove Strathfield Pyrmont Charlestown Wollongong Weekday AM Peak Person Trips per Unit 0.64 0.64 0.32 0.81 0.95 0.72 0.52 0.69 0.53 0.89 AM Peak Person Trips per Car Space 0.39 0.51 0.22 0.47 0.50 0.62 0.43 0.30 0.62 0.53 AM Peak Person Trips per Bedroom 0.29 0.30 0.13 0.39 0.45 0.29 0.26 0.46 0.27 0.30 PM Peak Person Trips per Unit 0.54 0.82 0.14 0.53 0.65 0.91 0.42 0.46 0.65 1.11 PM Peak Person Trips per Car Space 0.54 0.82 0.14 0.53 0.65 0.91 0.42 0.46 0.65 1.11 PM Peak Person Trips per Bedroom 0.24 0.39 0.06 0.26 0.31 0.37 0.21 0.30 0.33 0.37 Daily Person Trips per Unit 3.49 5.35 2.96 5.36 5.01 6.50 4.16 3.05 6.03 8.67 Daily Person Trips per Car Space 2.52 3.35 4.61 4.83 3.85 4.47 4.30 2.01 5.76 4.11 Daily Person Trips per Bedroom 1.56 2.51 1.19 2.61 2.39 2.67 2.08 2.01 3.11 2.89 AM Peak Vehicle Trips per Unit 0.14 0.14 0.07 0.32 0.27 0.28 0.10 0.18 0.39 0.67 AM Peak Vehicle Trips per Car Space 0.10 0.09 0.11 0.29 0.20 0.19 0.10 0.12 0.37 0.32 AM Peak Vehicle Trips per Bedroom 0.06 0.07 0.03 0.16 0.13 0.12 0.05 0.12 0.20 0.22 PM Peak Vehicle Trips per Unit 0.07 0.12 0.11 0.18 0.12 0.41 0.06 0.10 0.42 0.22 PM Peak Vehicle Trips per Car Space 0.05 0.07 0.17 0.17 0.09 0.28 0.07 0.07 0.40 0.11 PM Peak Vehicle Trips per Bedroom 0.03 0.05 0.04 0.09 0.06 0.17 0.03 0.07 0.22 0.07 Daily Vehicle Trips per Unit 0.77 1.23 0.93 2.25 1.67 3.14 1.16 1.03 4.37 4.78 Daily Vehicle Trips per Car Space 0.56 0.77 1.44 2.03 1.29 2.16 1.20 0.68 4.18 2.26 Daily Vehicle Trips per Bedroom 0.35 0.58 0.37 1.10 0.80 1.29 0.58 0.68 2.26 1.59 Saturday Peak Hour Person Trips per Unit 3.10 1.02 0.82 0.77 0.84 1.00 1.00 0.79 0.61 1.89 Peak Hour Person Trips per Car Space 2.24 0.64 1.28 0.70 0.65 0.69 1.03 0.52 0.58 0.89 Peak Hour Person Trips per Bedroom 0.68 0.33 0.33 0.32 0.40 0.38 0.44 0.32 0.30 0.59 Daily Person Trips per Unit 10.20 6.12 4.14 5.44 5.87 6.67 7.52 4.86 4.71 10.56 Daily Person Trips per Car Space 7.36 3.83 6.44 4.89 4.51 4.59 7.77 3.20 4.50 5.00 Daily Person Trips per Bedroom 4.58 2.87 1.66 2.65 2.80 2.74 3.76 3.20 2.44 3.52 Peak Hour Vehicle Trips per Unit 0.31 0.21 0.18 0.23 0.22 0.31 0.32 0.19 0.39 0.78 Peak Hour Vehicle Trips per Car Space 0.23 0.13 0.28 0.21 0.17 0.22 0.33 0.13 0.37 0.37 Peak Hour Vehicle Trips per Bedroom 0.14 0.10 0.07 0.11 0.10 0.13 0.16 0.13 0.20 0.26 Daily Vehicle Trips per Unit 1.89 1.41 0.61 1.68 1.39 2.02 1.65 1.11 2.33 3.67 Daily Vehicle Trips per Car Space 1.36 0.88 0.94 1.52 1.06 1.39 1.70 0.73 2.23 1.74 Daily Vehicle Trips per Bedroom 0.85 0.66 0.24 0.82 0.66 0.83 0.82 0.73 1.21 1.22
Guide to Traffic Generating Developments – updated traffic surveys | May 2013 8 (22 pages) UNCONTROLLED WHEN PRINTED
APPENDIX C1 – SENIORS LIVING – SITE DETAILS Site ID SH1 SH2 SH3 SH4 SH5 SH6 SH7 SH8 SH9 SH10
Suburb
Dee Why 2099
Allambie Heights
2100
North Parramatta
2151
Richmond 2753
Prestons 2170
Bonnells Bay 2264
Wamberal 2260
Kincumber 2251
Tahmoor 2573
Bowral 2576
Network Peak HoursYear of Network Survey Dates 2005 2009
21/3-27/32005 2009
23/3-29/32009
6/4-12/42009
21/3-1/42004 2009
21/03-25/32009
19/3-25/32006
AM Peak - Weekdays 0800-0900 0800-0900 0800-0900 0800-0900 0900-1000 0900-1000 0800-0900 1100-1200 0900-1000 0800-0900PM Peak - Weekdays 1700-1800 1700-1800 1700-1800 1500-1600 1600-1700 1500-1600 1500-1600 1600-1700 1700-1800 1500-1600Peak - Weekends 1200-1300 1200-1300 1200-1300 1100-1200 1200-1300 1100-1200 1200-1300 1100-1200 1100-1200 1100-1200Site Details - Senior HousingAccommodation Type S + H S + H S + H + A S + H + A S + H S S S S S + HFunded (Resident / Government) Resident Resident Resident Resident Both Resident Resident Resident Resident ResidentOriginal Unit Cost 200k-250k 200k-480k 180k-220k Unknown 135k-175k 300k-400k 90k-95k 365k-520k 95K 385k-645kYear Constructed 1988-2000 1966-2009 1994-2001 1983-2005 1999-2003 1996 1983-1986 2002-2007 1997 1986Village Bus Yes Yes Yes Yes Yes Yes No Yes No NoVillage Bus Frequency per week 9 2 10 2 4 4 No 3 No NoNo. of Units Provided (Total) 272 83 276 174 214 250 62 76 42 86No. of Occupied Units (Self) 180 40 116 43 147 240 51 70 38 68No. of Residents (Self) 226 48 157 43 217 350 51 92 50 100-110No. of Occupied Units (Low-care) 25 38 50 61 67 N/A N/A N/A N/A 13No. of Residents (Low-care) 25 39 50 61 67 N/A N/A N/A N/ANo. of Occupied beds (High-care) N/A N/A 98 70 N/A N/A N/A N/A N/A N/ANo. of Residents (High-care) N/A N/A 98 70 N/A N/A N/A N/A N/A N/ANo. of employee (Total) 15 32 160 130 30 8 3 10 1 19No. of employee (at one time) N/A 12 45 30-40 <30 8 2 1 1 19Accessbility Score <79 <79 <79 <79 <79 0.5 32 32 6.5 8Parking SpacesResidents 110 17 82 26 155 500 62 111 42 80Staff as Visitor 16 25 as Visitor 11 4 as Visitor as Visitor 1 as VistorVisitors / Loading bays 32 11 32 52 28 75 11 28 16 10Total 142 44 139 78 194 579 73 139 59 90Cars OwnershipNo Car Unknown 54 83 0 16 4 161 Car Unknown 17 59 15 83 230 37 39 22 602 Cars Unknown 5 0 10 0 10 0No. of Cars (Total) Unknown 17 69 15 83 250 37 59 22 60 Source: Trip Generation and Parking Generation Surveys, Housing for Seniors, Analysis Report, Hyder for the NSW Roads and Traffic Authority, June 2009, p7
Guide to Traffic Generating Developments – updated traffic surveys | May 2013 9 (22 pages) UNCONTROLLED WHEN PRINTED
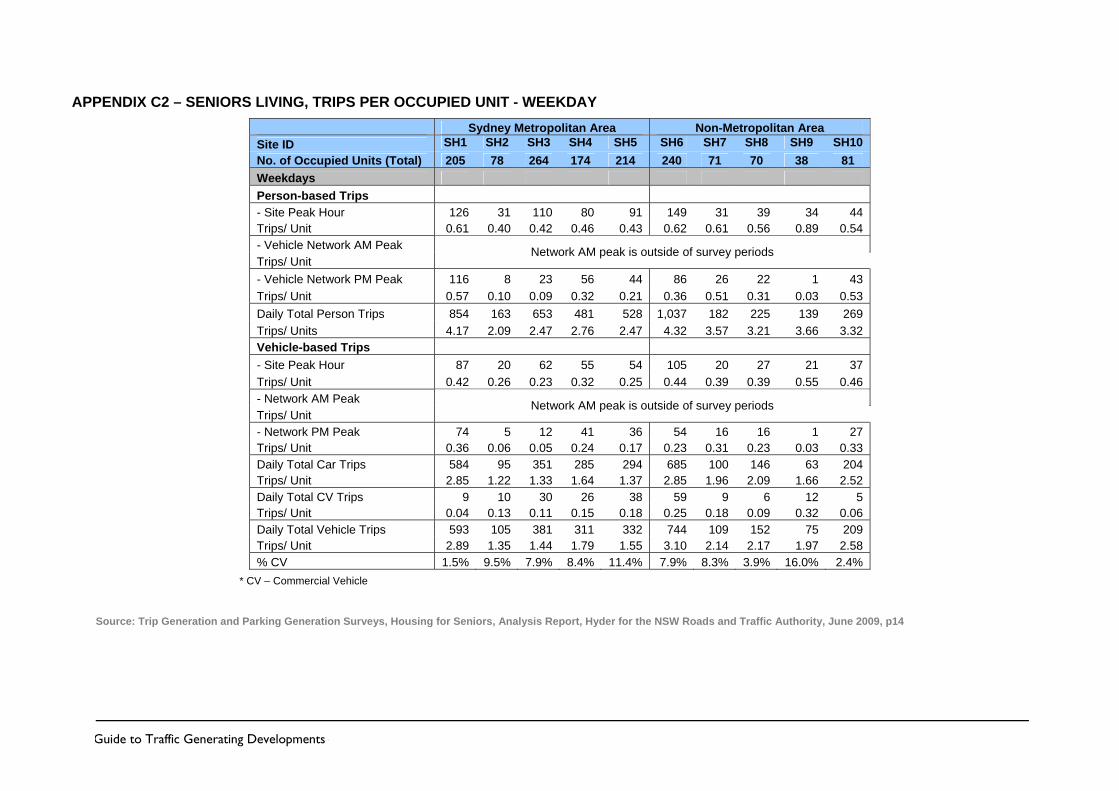
APPENDIX C2 – SENIORS LIVING, TRIPS PER OCCUPIED UNIT - WEEKDAY Sydney Metropolitan Area Non-Metropolitan Area Site ID SH1 SH2 SH3 SH4 SH5 SH6 SH7 SH8 SH9 SH10 No. of Occupied Units (Total) 205 78 264 174 214 240 71 70 38 81 Weekdays Person-based Trips - Site Peak Hour 126 31 110 80 91 149 31 39 34 44 Trips/ Unit 0.61 0.40 0.42 0.46 0.43 0.62 0.61 0.56 0.89 0.54 - Vehicle Network AM Peak Trips/ Unit
Network AM peak is outside of survey periods
- Vehicle Network PM Peak 116 8 23 56 44 86 26 22 1 43 Trips/ Unit 0.57 0.10 0.09 0.32 0.21 0.36 0.51 0.31 0.03 0.53 Daily Total Person Trips 854 163 653 481 528 1,037 182 225 139 269 Trips/ Units 4.17 2.09 2.47 2.76 2.47 4.32 3.57 3.21 3.66 3.32 Vehicle-based Trips - Site Peak Hour 87 20 62 55 54 105 20 27 21 37 Trips/ Unit 0.42 0.26 0.23 0.32 0.25 0.44 0.39 0.39 0.55 0.46 - Network AM Peak Trips/ Unit
Network AM peak is outside of survey periods
- Network PM Peak 74 5 12 41 36 54 16 16 1 27 Trips/ Unit 0.36 0.06 0.05 0.24 0.17 0.23 0.31 0.23 0.03 0.33 Daily Total Car Trips 584 95 351 285 294 685 100 146 63 204 Trips/ Unit 2.85 1.22 1.33 1.64 1.37 2.85 1.96 2.09 1.66 2.52 Daily Total CV Trips 9 10 30 26 38 59 9 6 12 5 Trips/ Unit 0.04 0.13 0.11 0.15 0.18 0.25 0.18 0.09 0.32 0.06 Daily Total Vehicle Trips 593 105 381 311 332 744 109 152 75 209 Trips/ Unit 2.89 1.35 1.44 1.79 1.55 3.10 2.14 2.17 1.97 2.58 % CV 1.5% 9.5% 7.9% 8.4% 11.4% 7.9% 8.3% 3.9% 16.0% 2.4%
* CV – Commercial Vehicle
Source: Trip Generation and Parking Generation Surveys, Housing for Seniors, Analysis Report, Hyder for the NSW Roads and Traffic Authority, June 2009, p14
Guide to Traffic Generating Developments – updated traffic surveys | May 2013 10 (22 pages) UNCONTROLLED WHEN PRINTED
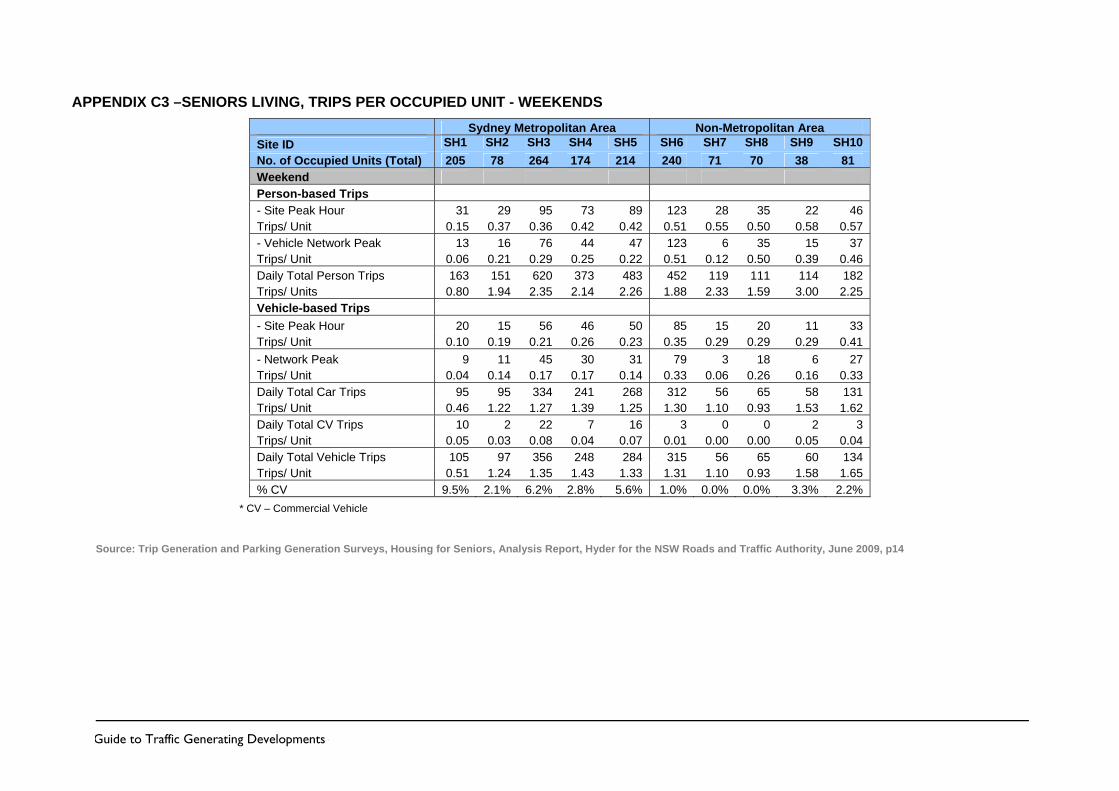
APPENDIX C3 –SENIORS LIVING, TRIPS PER OCCUPIED UNIT - WEEKENDS Sydney Metropolitan Area Non-Metropolitan Area Site ID SH1 SH2 SH3 SH4 SH5 SH6 SH7 SH8 SH9 SH10 No. of Occupied Units (Total) 205 78 264 174 214 240 71 70 38 81 Weekend Person-based Trips - Site Peak Hour 31 29 95 73 89 123 28 35 22 46 Trips/ Unit 0.15 0.37 0.36 0.42 0.42 0.51 0.55 0.50 0.58 0.57 - Vehicle Network Peak 13 16 76 44 47 123 6 35 15 37 Trips/ Unit 0.06 0.21 0.29 0.25 0.22 0.51 0.12 0.50 0.39 0.46 Daily Total Person Trips 163 151 620 373 483 452 119 111 114 182 Trips/ Units 0.80 1.94 2.35 2.14 2.26 1.88 2.33 1.59 3.00 2.25 Vehicle-based Trips - Site Peak Hour 20 15 56 46 50 85 15 20 11 33 Trips/ Unit 0.10 0.19 0.21 0.26 0.23 0.35 0.29 0.29 0.29 0.41 - Network Peak 9 11 45 30 31 79 3 18 6 27 Trips/ Unit 0.04 0.14 0.17 0.17 0.14 0.33 0.06 0.26 0.16 0.33 Daily Total Car Trips 95 95 334 241 268 312 56 65 58 131 Trips/ Unit 0.46 1.22 1.27 1.39 1.25 1.30 1.10 0.93 1.53 1.62 Daily Total CV Trips 10 2 22 7 16 3 0 0 2 3 Trips/ Unit 0.05 0.03 0.08 0.04 0.07 0.01 0.00 0.00 0.05 0.04 Daily Total Vehicle Trips 105 97 356 248 284 315 56 65 60 134 Trips/ Unit 0.51 1.24 1.35 1.43 1.33 1.31 1.10 0.93 1.58 1.65 % CV 9.5% 2.1% 6.2% 2.8% 5.6% 1.0% 0.0% 0.0% 3.3% 2.2%
* CV – Commercial Vehicle
Source: Trip Generation and Parking Generation Surveys, Housing for Seniors, Analysis Report, Hyder for the NSW Roads and Traffic Authority, June 2009, p14
Guide to Traffic Generating Developments – updated traffic surveys | May 2013 11 (22 pages) UNCONTROLLED WHEN PRINTED
APPENDIX D1 – OFFICE BLOCKS – SITE DETAILS
OB1 North Sydney
OB2 Chatswood
OB3 Sydney
Olympic Park
OB4 Hurstville
OB5 Macquarie
Park
OB6 Parramatta
OB7 Liverpool
OB8 Norwest
OB9 Newcastle
OB10 Wollongong
Total Staff 1,136 (1,129) 397 (347) 2,400 (2,053)
95 (85)
240 (240)
1,400 (1,225)
99 (88)
34 (31)
490 (490)
380 (300)
Size 31,400 10,214 34,131 3,254 5,748 27,000 2,817 1,200 12,182 12,921
Car and Bicycle Parking spaces
136 150 902 66 269 402 28 83 220 133
Loading Bays 1 6 7 0 3 3 0 1 0 1
Accessibility Score 0.9 0.9 0.4 0.9 0.9 0.9 0.9 0.6 0.9 0.9
Source: Trip Generation and Parking Generation Surveys (Office Blocks), GTA Consultants for the NSW Roads and Traffic Authority, September 2010, p113
Guide to Traffic Generating Developments – updated traffic surveys | May 2013 12 (22 pages) UNCONTROLLED WHEN PRINTED
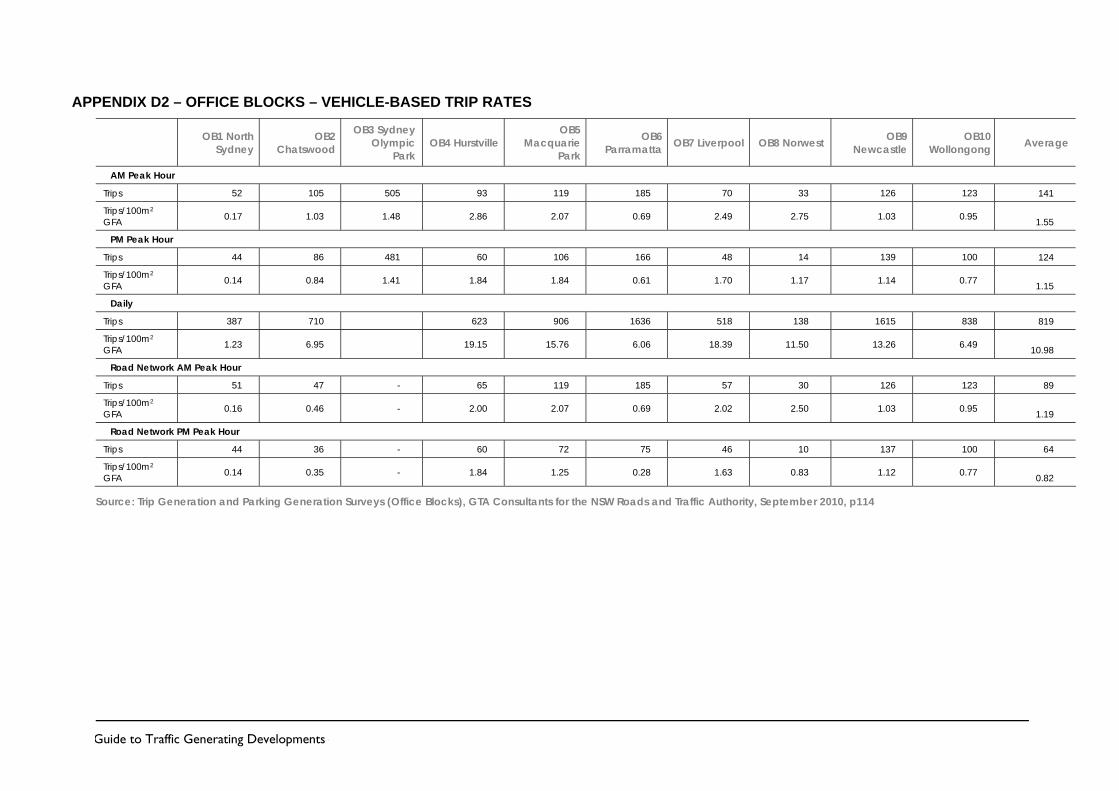
APPENDIX D2 – OFFICE BLOCKS – VEHICLE-BASED TRIP RATES
OB1 North Sydney
OB2 Chatswood
OB3 Sydney Olympic
Park OB4 Hurstville
OB5 Macquarie
Park
OB6 Parramatta OB7 Liverpool OB8 Norwest OB9
Newcastle OB10
Wollongong Average
AM Peak Hour
Trips 52 105 505 93 119 185 70 33 126 123 141
Trips/100m2 GFA 0.17 1.03 1.48 2.86 2.07 0.69 2.49 2.75 1.03 0.95 1.55
PM Peak Hour
Trips 44 86 481 60 106 166 48 14 139 100 124
Trips/100m2 GFA 0.14 0.84 1.41 1.84 1.84 0.61 1.70 1.17 1.14 0.77 1.15
Daily
Trips 387 710 623 906 1636 518 138 1615 838 819
Trips/100m2 GFA 1.23 6.95 19.15 15.76 6.06 18.39 11.50 13.26 6.49 10.98
Road Network AM Peak Hour
Trips 51 47 - 65 119 185 57 30 126 123 89
Trips/100m2 GFA 0.16 0.46 - 2.00 2.07 0.69 2.02 2.50 1.03 0.95 1.19
Road Network PM Peak Hour
Trips 44 36 - 60 72 75 46 10 137 100 64
Trips/100m2 GFA 0.14 0.35 - 1.84 1.25 0.28 1.63 0.83 1.12 0.77 0.82
Source: Trip Generation and Parking Generation Surveys (Office Blocks), GTA Consultants for the NSW Roads and Traffic Authority, September 2010, p114
Guide to Traffic Generating Developments – updated traffic surveys | May 2013 13 (22 pages) UNCONTROLLED WHEN PRINTED
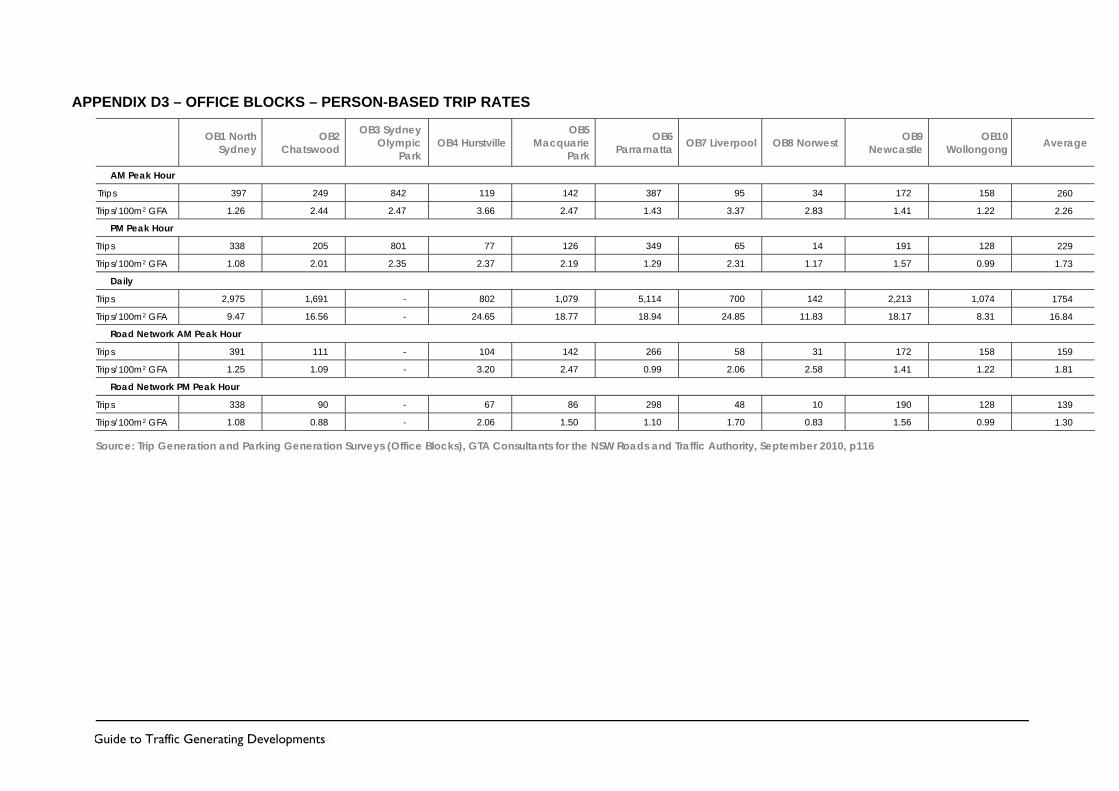
APPENDIX D3 – OFFICE BLOCKS – PERSON-BASED TRIP RATES
OB1 North Sydney
OB2 Chatswood
OB3 Sydney Olympic
Park OB4 Hurstville
OB5 Macquarie
Park
OB6 Parramatta OB7 Liverpool OB8 Norwest OB9
Newcastle OB10
Wollongong Average
AM Peak Hour
Trips 397 249 842 119 142 387 95 34 172 158 260
Trips/100m2 GFA 1.26 2.44 2.47 3.66 2.47 1.43 3.37 2.83 1.41 1.22 2.26
PM Peak Hour
Trips 338 205 801 77 126 349 65 14 191 128 229
Trips/100m2 GFA 1.08 2.01 2.35 2.37 2.19 1.29 2.31 1.17 1.57 0.99 1.73
Daily
Trips 2,975 1,691 - 802 1,079 5,114 700 142 2,213 1,074 1754
Trips/100m2 GFA 9.47 16.56 - 24.65 18.77 18.94 24.85 11.83 18.17 8.31 16.84
Road Network AM Peak Hour
Trips 391 111 - 104 142 266 58 31 172 158 159
Trips/100m2 GFA 1.25 1.09 - 3.20 2.47 0.99 2.06 2.58 1.41 1.22 1.81
Road Network PM Peak Hour
Trips 338 90 - 67 86 298 48 10 190 128 139
Trips/100m2 GFA 1.08 0.88 - 2.06 1.50 1.10 1.70 0.83 1.56 0.99 1.30
Source: Trip Generation and Parking Generation Surveys (Office Blocks), GTA Consultants for the NSW Roads and Traffic Authority, September 2010, p116
Guide to Traffic Generating Developments – updated traffic surveys | May 2013 14 (22 pages) UNCONTROLLED WHEN PRINTED
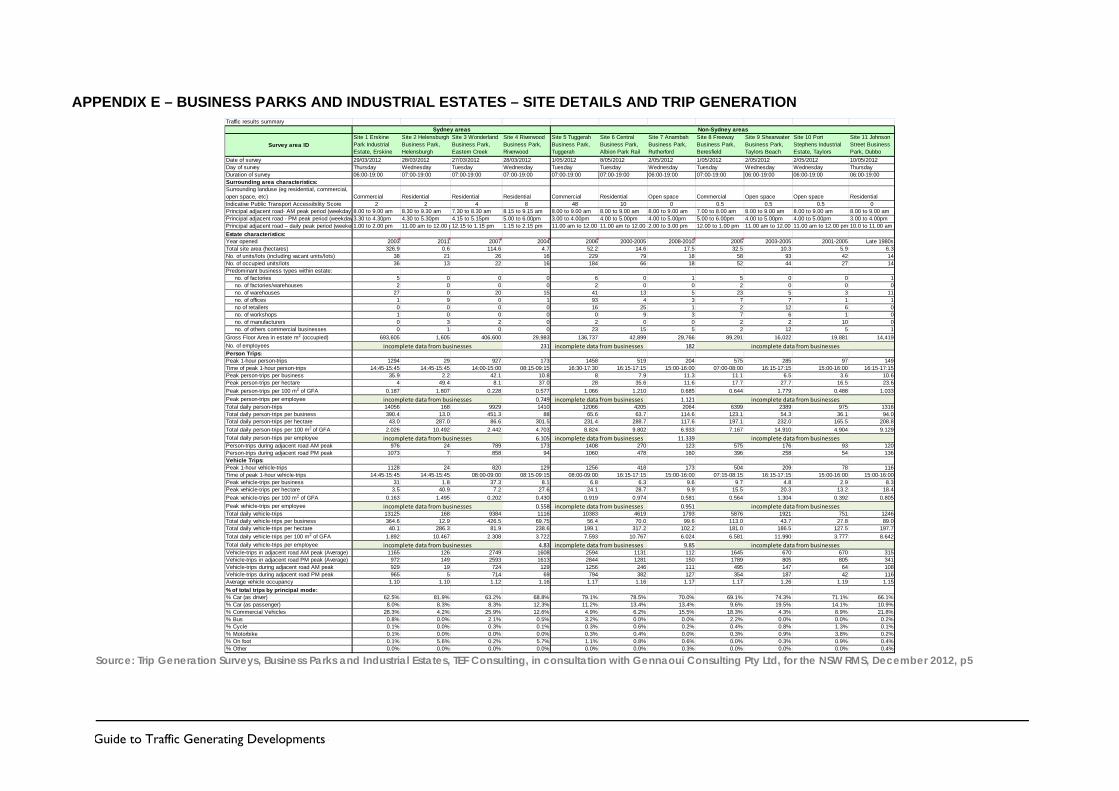
APPENDIX E – BUSINESS PARKS AND INDUSTRIAL ESTATES – SITE DETAILS AND TRIP GENERATION Traffic results summary
Survey area IDSite 1 Erskine Park Industrial Estate, Erskine
Site 2 Helensburgh Business Park, Helensburgh
Site 3 Wonderland Business Park, Eastern Creek
Site 4 Riverwood Business Park, Riverwood
Site 5 Tuggerah Business Park, Tuggerah
Site 6 Central Business Park, Albion Park Rail
Site 7 Anambah Business Park, Rutherford
Site 8 Freeway Business Park, Beresfield
Site 9 Shearwater Business Park, Taylors Beach
Site 10 Port Stephens Industrial Estate, Taylors
Site 11 Johnson Street Business Park, Dubbo
Date of survey 29/03/2012 28/03/2012 27/03/2012 28/03/2012 1/05/2012 8/05/2012 2/05/2012 1/05/2012 2/05/2012 2/05/2012 10/05/2012Day of survey Thursday Wednesday Tuesday Wednesday Tuesday Tuesday Wednesday Tuesday Wednesday Wednesday ThursdayDuration of survey 06:00-19:00 07:00-19:00 07:00-19:00 07:00-19:00 07:00-19:00 07:00-19:00 06:00-19:00 07:00-19:00 06:00-19:00 06:00-19:00 06:00-19:00Surrounding area characteristics:Surrounding landuse (eg residential, commercial, open space, etc) Commercial Residential Residential Residential Commercial Residential Open space Commercial Open space Open space ResidentialIndicative Public Transport Accessibility Score 2 2 4 8 48 10 0 0.5 0.5 0.5 0Principal adjacent road- AM peak period (weekday)8.00 to 9.00 am 8.30 to 9.30 am 7.30 to 8.30 am 8.15 to 9.15 am 8.00 to 9.00 am 8.00 to 9.00 am 8.00 to 9.00 am 7.00 to 8.00 am 8.00 to 9.00 am 8.00 to 9.00 am 8.00 to 9.00 amPrincipal adjacent road - PM peak period (weekday3.30 to 4.30pm 4.30 to 5.30pm 4.15 to 5.15pm 5.00 to 6.00pm 3.00 to 4.00pm 4.00 to 5.00pm 4.00 to 5.00pm 5.00 to 6.00pm 4.00 to 5.00pm 4.00 to 5.00pm 3.00 to 4.00pmPrincipal adjacent road – daily peak period (weeken1.00 to 2.00 pm 11.00 am to 12.00 p12.15 to 1.15 pm 1.15 to 2.15 pm 11.00 am to 12.00 11.00 am to 12.00 2.00 to 3.00 pm 12.00 to 1.00 pm 11.00 am to 12.00 11.00 am to 12.00 pm 10.0 to 11.00 amEstate characteristics:Year opened 2003 2011 2007 2004 2006 2000-2005 2008-2010 2005 2003-2005 2001-2005 Late 1980sTotal site area (hectares) 326.9 0.6 114.6 4.7 52.2 14.6 17.5 32.5 10.3 5.9 6.3No. of units/lots (including vacant units/lots) 38 21 26 16 229 79 18 58 93 42 14No. of occupied units/lots 36 13 22 16 184 66 18 52 44 27 14Predominant business types within estate:
no. of factories 5 0 0 0 6 0 1 5 0 0 1 no. of factories/warehouses 2 0 0 0 2 0 0 2 0 0 0 no. of warehouses 27 0 20 15 41 13 5 23 5 3 11 no. of offices 1 9 0 1 93 4 3 7 7 1 1 no of retailers 0 0 0 0 16 25 1 2 12 6 0 no. of workshops 1 0 0 0 0 9 3 7 6 1 0 no. of manufacturers 0 3 2 0 2 0 0 2 2 10 0 no. of others commercial businesses 0 1 0 0 23 15 5 2 12 5 1
Gross Floor Area in estate m2 (occupied) 693,605 1,605 406,600 29,983 136,737 42,899 29,766 89,291 16,022 19,881 14,419No. of employees 231 182Person Trips:Peak 1-hour person-trips 1294 29 927 173 1458 519 204 575 285 97 149Time of peak 1-hour person-trips 14:45-15:45 14:45-15:45 14:00-15:00 08:15-09:15 16:30-17:30 16:15-17:15 15:00-16:00 07:00-08:00 16:15-17:15 15:00-16:00 16:15-17:15Peak person-trips per business 35.9 2.2 42.1 10.8 8 7.9 11.3 11.1 6.5 3.6 10.6Peak person-trips per hectare 4 49.4 8.1 37.0 28 35.6 11.6 17.7 27.7 16.5 23.6Peak person-trips per 100 m2 of GFA 0.187 1.807 0.228 0.577 1.066 1.210 0.685 0.644 1.779 0.488 1.033Peak person-trips per employee 0.749 1.121Total daily person-trips 14056 168 9929 1410 12066 4205 2064 6399 2389 975 1316Total daily person-trips per business 390.4 13.0 451.3 88 65.6 63.7 114.6 123.1 54.3 36.1 94.0Total daily person-trips per hectare 43.0 287.0 86.6 301.5 231.4 288.7 117.6 197.1 232.0 165.5 208.8Total daily person-trips per 100 m2 of GFA 2.026 10.492 2.442 4.703 8.824 9.802 6.933 7.167 14.910 4.904 9.129Total daily person-trips per employee 6.105 11.339Person-trips during adjacent road AM peak 976 24 789 173 1408 270 123 575 176 93 120Person-trips during adjacent road PM peak 1073 7 858 94 1060 478 160 396 258 54 136Vehicle Trips:Peak 1-hour vehicle-trips 1128 24 820 129 1256 418 173 504 209 78 116Time of peak 1-hour vehicle-trips 14:45-15:45 14:45-15:45 08:00-09:00 08:15-09:15 08:00-09:00 16:15-17:15 15:00-16:00 07:15-08:15 16:15-17:15 15:00-16:00 15:00-16:00Peak vehicle-trips per business 31 1.8 37.3 8.1 6.8 6.3 9.6 9.7 4.8 2.9 8.3Peak vehicle-trips per hectare 3.5 40.9 7.2 27.6 24.1 28.7 9.9 15.5 20.3 13.2 18.4Peak vehicle-trips per 100 m2 of GFA 0.163 1.495 0.202 0.430 0.919 0.974 0.581 0.564 1.304 0.392 0.805Peak vehicle-trips per employee 0.558 0.951Total daily vehicle-trips 13125 168 9384 1116 10383 4619 1793 5876 1921 751 1246Total daily vehicle-trips per business 364.6 12.9 426.5 69.75 56.4 70.0 99.6 113.0 43.7 27.8 89.0Total daily vehicle-trips per hectare 40.1 286.3 81.9 238.6 199.1 317.2 102.2 181.0 186.5 127.5 197.7Total daily vehicle-trips per 100 m2 of GFA 1.892 10.467 2.308 3.722 7.593 10.767 6.024 6.581 11.990 3.777 8.642Total daily vehicle-trips per employee 4.83 9.85Vehicle-trips in adjacent road AM peak (Average) 1165 126 2749 1608 2594 1131 112 1645 670 670 315Vehicle-trips in adjacent road PM peak (Average) 972 149 2593 1613 2844 1281 150 1789 805 805 341Vehicle-trips during adjacent road AM peak 929 19 724 129 1256 246 111 495 147 64 108Vehicle-trips during adjacent road PM peak 965 5 714 69 794 382 127 354 187 42 116Average vehicle occupancy 1.10 1.10 1.12 1.16 1.17 1.16 1.17 1.17 1.26 1.19 1.15% of total trips by principal mode:% Car (as driver) 62.5% 81.9% 63.2% 68.8% 79.1% 78.5% 70.0% 69.1% 74.3% 71.1% 66.1%% Car (as passenger) 8.0% 8.3% 8.3% 12.3% 11.2% 13.4% 13.4% 9.6% 19.5% 14.1% 10.9%% Commercial Vehicles 28.3% 4.2% 25.9% 12.6% 4.9% 6.2% 15.5% 18.3% 4.3% 8.9% 21.8%% Bus 0.8% 0.0% 2.1% 0.5% 3.2% 0.0% 0.0% 2.2% 0.0% 0.0% 0.2%% Cycle 0.1% 0.0% 0.3% 0.1% 0.3% 0.6% 0.2% 0.4% 0.8% 1.3% 0.1%% Motorbike 0.1% 0.0% 0.0% 0.0% 0.3% 0.4% 0.0% 0.3% 0.9% 3.8% 0.2%% On foot 0.1% 5.6% 0.2% 5.7% 1.1% 0.8% 0.6% 0.0% 0.3% 0.9% 0.4%% Other 0.0% 0.0% 0.0% 0.0% 0.0% 0.0% 0.3% 0.0% 0.0% 0.0% 0.4%
incomplete data from businesses
incomplete data from businesses
incomplete data from businesses
incomplete data from businesses
incomplete data from businesses
incomplete data from businesses
incomplete data from businesses
incomplete data from businesses
incomplete data from businesses
incomplete data from businesses
incomplete data from businesses
incomplete data from businesses
Sydney areas Non-Sydney areas
incomplete data from businesses incomplete data from businesses incomplete data from businesses
Source: Trip Generation Surveys, Business Parks and Industrial Estates, TEF Consulting, in consultation with Gennaoui Consulting Pty Ltd, for the NSW RMS, December 2012, p5
Guide to Traffic Generating Developments – updated traffic surveys | May 2013 15 (22 pages) UNCONTROLLED WHEN PRINTED
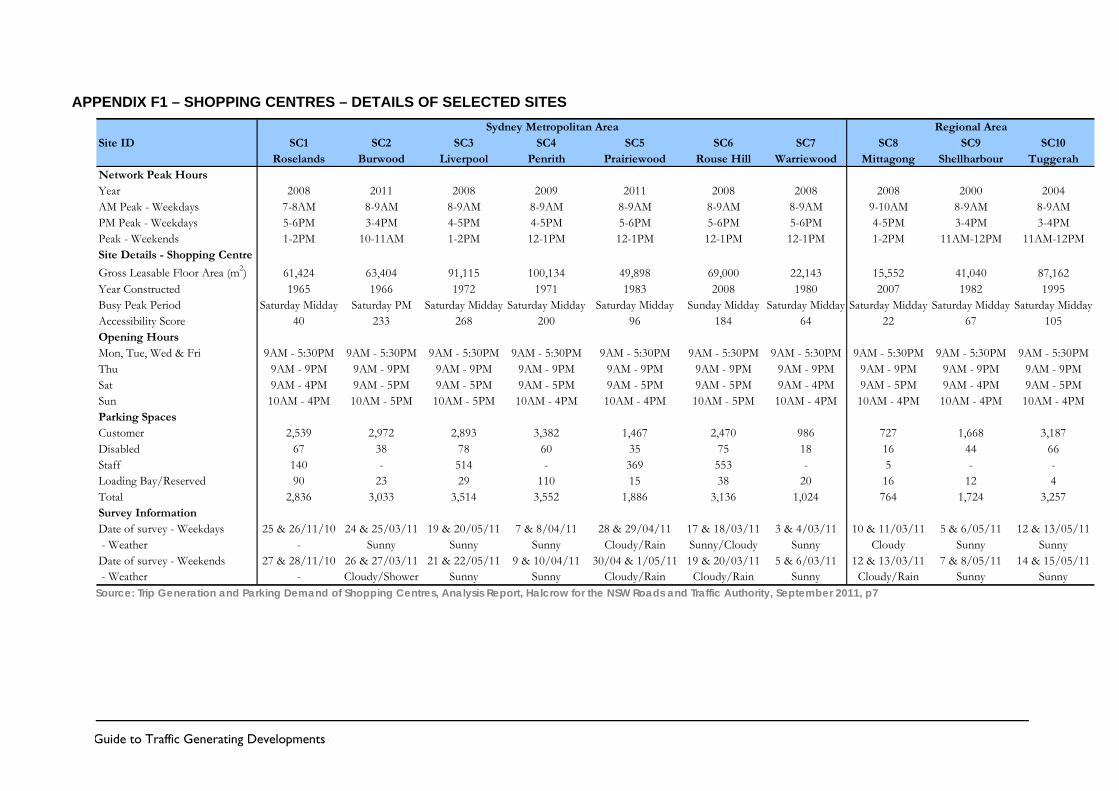
APPENDIX F1 – SHOPPING CENTRES – DETAILS OF SELECTED SITES
Site ID SC1 SC2 SC3 SC4 SC5 SC6 SC7 SC8 SC9 SC10Roselands Burwood Liverpool Penrith Prairiewood Rouse Hill Warriewood Mittagong Shellharbour Tuggerah
Network Peak HoursYear 2008 2011 2008 2009 2011 2008 2008 2008 2000 2004AM Peak - Weekdays 7-8AM 8-9AM 8-9AM 8-9AM 8-9AM 8-9AM 8-9AM 9-10AM 8-9AM 8-9AMPM Peak - Weekdays 5-6PM 3-4PM 4-5PM 4-5PM 5-6PM 5-6PM 5-6PM 4-5PM 3-4PM 3-4PMPeak - Weekends 1-2PM 10-11AM 1-2PM 12-1PM 12-1PM 12-1PM 12-1PM 1-2PM 11AM-12PM 11AM-12PMSite Details - Shopping Centre
Gross Leasable Floor Area (m2) 61,424 63,404 91,115 100,134 49,898 69,000 22,143 15,552 41,040 87,162Year Constructed 1965 1966 1972 1971 1983 2008 1980 2007 1982 1995Busy Peak Period Saturday Midday Saturday PM Saturday Midday Saturday Midday Saturday Midday Sunday Midday Saturday Midday Saturday Midday Saturday Midday Saturday MiddayAccessibility Score 40 233 268 200 96 184 64 22 67 105Opening HoursMon, Tue, Wed & Fri 9AM - 5:30PM 9AM - 5:30PM 9AM - 5:30PM 9AM - 5:30PM 9AM - 5:30PM 9AM - 5:30PM 9AM - 5:30PM 9AM - 5:30PM 9AM - 5:30PM 9AM - 5:30PMThu 9AM - 9PM 9AM - 9PM 9AM - 9PM 9AM - 9PM 9AM - 9PM 9AM - 9PM 9AM - 9PM 9AM - 9PM 9AM - 9PM 9AM - 9PMSat 9AM - 4PM 9AM - 5PM 9AM - 5PM 9AM - 5PM 9AM - 5PM 9AM - 5PM 9AM - 4PM 9AM - 5PM 9AM - 4PM 9AM - 5PMSun 10AM - 4PM 10AM - 5PM 10AM - 5PM 10AM - 4PM 10AM - 4PM 10AM - 5PM 10AM - 4PM 10AM - 4PM 10AM - 4PM 10AM - 4PMParking SpacesCustomer 2,539 2,972 2,893 3,382 1,467 2,470 986 727 1,668 3,187Disabled 67 38 78 60 35 75 18 16 44 66Staff 140 - 514 - 369 553 - 5 - -Loading Bay/Reserved 90 23 29 110 15 38 20 16 12 4Total 2,836 3,033 3,514 3,552 1,886 3,136 1,024 764 1,724 3,257Survey InformationDate of survey - Weekdays 25 & 26/11/10 24 & 25/03/11 19 & 20/05/11 7 & 8/04/11 28 & 29/04/11 17 & 18/03/11 3 & 4/03/11 10 & 11/03/11 5 & 6/05/11 12 & 13/05/11 - Weather - Sunny Sunny Sunny Cloudy/Rain Sunny/Cloudy Sunny Cloudy Sunny SunnyDate of survey - Weekends 27 & 28/11/10 26 & 27/03/11 21 & 22/05/11 9 & 10/04/11 30/04 & 1/05/11 19 & 20/03/11 5 & 6/03/11 12 & 13/03/11 7 & 8/05/11 14 & 15/05/11 - Weather - Cloudy/Shower Sunny Sunny Cloudy/Rain Cloudy/Rain Sunny Cloudy/Rain Sunny Sunny
Sydney Metropolitan Area Regional Area
Source: Trip Generation and Parking Demand of Shopping Centres, Analysis Report, Halcrow for the NSW Roads and Traffic Authority, September 2011, p7
Guide to Traffic Generating Developments – updated traffic surveys | May 2013 16 (22 pages) UNCONTROLLED WHEN PRINTED
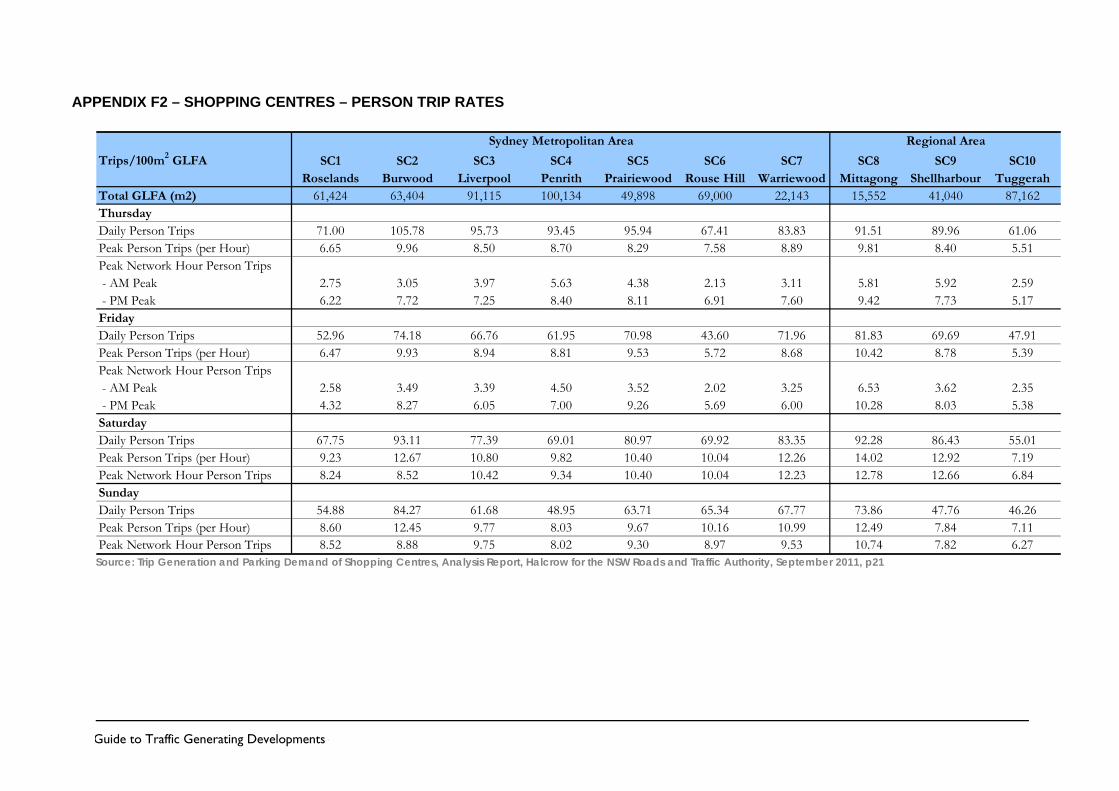
APPENDIX F2 – SHOPPING CENTRES – PERSON TRIP RATES
Trips/100m2 GLFA SC1 SC2 SC3 SC4 SC5 SC6 SC7 SC8 SC9 SC10Roselands Burwood Liverpool Penrith Prairiewood Rouse Hill Warriewood Mittagong Shellharbour Tuggerah
Total GLFA (m2) 61,424 63,404 91,115 100,134 49,898 69,000 22,143 15,552 41,040 87,162ThursdayDaily Person Trips 71.00 105.78 95.73 93.45 95.94 67.41 83.83 91.51 89.96 61.06Peak Person Trips (per Hour) 6.65 9.96 8.50 8.70 8.29 7.58 8.89 9.81 8.40 5.51Peak Network Hour Person Trips - AM Peak 2.75 3.05 3.97 5.63 4.38 2.13 3.11 5.81 5.92 2.59 - PM Peak 6.22 7.72 7.25 8.40 8.11 6.91 7.60 9.42 7.73 5.17FridayDaily Person Trips 52.96 74.18 66.76 61.95 70.98 43.60 71.96 81.83 69.69 47.91Peak Person Trips (per Hour) 6.47 9.93 8.94 8.81 9.53 5.72 8.68 10.42 8.78 5.39Peak Network Hour Person Trips - AM Peak 2.58 3.49 3.39 4.50 3.52 2.02 3.25 6.53 3.62 2.35 - PM Peak 4.32 8.27 6.05 7.00 9.26 5.69 6.00 10.28 8.03 5.38SaturdayDaily Person Trips 67.75 93.11 77.39 69.01 80.97 69.92 83.35 92.28 86.43 55.01Peak Person Trips (per Hour) 9.23 12.67 10.80 9.82 10.40 10.04 12.26 14.02 12.92 7.19Peak Network Hour Person Trips 8.24 8.52 10.42 9.34 10.40 10.04 12.23 12.78 12.66 6.84SundayDaily Person Trips 54.88 84.27 61.68 48.95 63.71 65.34 67.77 73.86 47.76 46.26Peak Person Trips (per Hour) 8.60 12.45 9.77 8.03 9.67 10.16 10.99 12.49 7.84 7.11Peak Network Hour Person Trips 8.52 8.88 9.75 8.02 9.30 8.97 9.53 10.74 7.82 6.27
Sydney Metropolitan Area Regional Area
Source: Trip Generation and Parking Demand of Shopping Centres, Analysis Report, Halcrow for the NSW Roads and Traffic Authority, September 2011, p21
Guide to Traffic Generating Developments – updated traffic surveys | May 2013 17 (22 pages) UNCONTROLLED WHEN PRINTED

APPENDIX F3 – SHOPPING CENTRES – VEHICLE TRIP RATES
Trips/100m2 GLFA SC1 SC2 SC3 SC4 SC5 SC6 SC7 SC8 SC9 SC10Roselands Burwood Liverpool Penrith Prairiewood Rouse Hill Warriewood Mittagong Shellharbour Tuggerah
Total GLFA (m2) 61,424 63,404 91,115 100,134 49,898 69,000 22,143 15,552 41,040 87,162ThursdayDaily Vehicle Trips 43.76 34.03 29.51 34.27 60.18 42.22 59.60 60.67 54.99 38.92Peak Vehicle Trips (per Hour) 3.90 3.10 2.71 3.24 5.21 4.40 6.01 6.21 5.25 3.49Peak Network Hour Vehicle Trips - AM Peak 1.84 0.96 1.01 2.12 2.88 1.43 2.24 4.08 4.06 1.87 - PM Peak 3.72 2.57 2.22 3.14 4.96 4.17 5.19 5.77 4.92 3.31FridayDaily Vehicle Trips 33.46 23.73 21.37 23.80 45.19 28.96 50.92 55.48 46.05 32.05Peak Vehicle Trips (per Hour) 4.01 3.08 2.84 3.26 5.71 3.63 5.90 6.71 5.75 3.53Peak Network Hour Vehicle Trips - AM Peak 1.65 0.98 1.04 1.54 1.87 1.37 2.42 4.69 2.61 1.70 - PM Peak 2.69 2.66 1.95 2.73 5.49 3.61 4.00 6.41 5.21 3.53SaturdayDaily Vehicle Trips 37.20 29.08 23.98 26.09 46.87 39.37 49.61 50.18 48.59 30.32Peak Vehicle Trips (per Hour) 5.06 3.77 3.16 3.56 5.83 5.60 7.00 7.48 7.04 3.85Peak Network Hour Vehicle Trips 4.43 2.97 3.04 3.43 5.83 5.60 6.93 6.89 6.99 3.77SundayDaily Vehicle Trips 30.65 27.00 18.25 19.21 34.71 32.77 39.43 39.78 25.10 24.72Peak Vehicle Trips (per Hour) 4.79 4.08 2.81 3.13 5.08 5.00 6.25 6.60 4.08 3.76Peak Network Hour Vehicle Trips 4.79 3.03 2.77 3.04 4.97 4.30 5.58 5.63 4.08 3.31
Sydney Metropolitan Area Regional Area
Source: Trip Generation and Parking Demand of Shopping Centres, Analysis Report, Halcrow for the NSW Roads and Traffic Authority, September 2011, p22
Guide to Traffic Generating Developments – updated traffic surveys | May 2013 18 (22 pages) UNCONTROLLED WHEN PRINTED
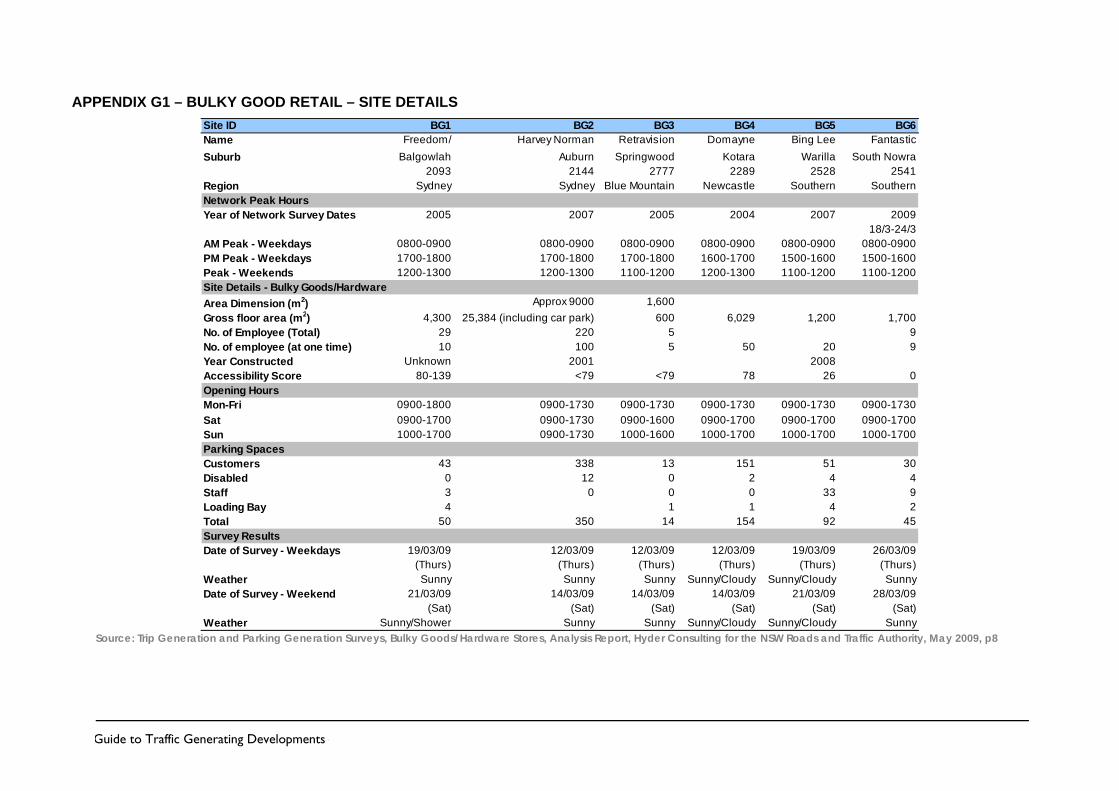
APPENDIX G1 – BULKY GOOD RETAIL – SITE DETAILS Site ID BG1 BG2 BG3 BG4 BG5 BG6Name Freedom/
SHarvey Norman Retravision Domayne Bing Lee Fantastic
Suburb Balgowlah 2093
Auburn 2144
Springwood 2777
Kotara 2289
Warilla 2528
South Nowra 2541
Region Sydney Sydney Blue Mountain Newcastle Southern SouthernNetwork Peak HoursYear of Network Survey Dates 2005 2007 2005 2004 2007 2009
18/3-24/3AM Peak - Weekdays 0800-0900 0800-0900 0800-0900 0800-0900 0800-0900 0800-0900PM Peak - Weekdays 1700-1800 1700-1800 1700-1800 1600-1700 1500-1600 1500-1600Peak - Weekends 1200-1300 1200-1300 1100-1200 1200-1300 1100-1200 1100-1200Site Details - Bulky Goods/HardwareArea Dimension (m2) Approx 9000 1,600Gross floor area (m2) 4,300 25,384 (including car park) 600 6,029 1,200 1,700No. of Employee (Total) 29 220 5 9No. of employee (at one time) 10 100 5 50 20 9Year Constructed Unknown 2001 2008Accessibility Score 80-139 <79 <79 78 26 0Opening HoursMon-Fri 0900-1800 0900-1730 0900-1730 0900-1730 0900-1730 0900-1730Sat 0900-1700 0900-1730 0900-1600 0900-1700 0900-1700 0900-1700Sun 1000-1700 0900-1730 1000-1600 1000-1700 1000-1700 1000-1700Parking SpacesCustomers 43 338 13 151 51 30Disabled 0 12 0 2 4 4Staff 3 0 0 0 33 9Loading Bay 4 1 1 4 2Total 50 350 14 154 92 45Survey ResultsDate of Survey - Weekdays 19/03/09
(Thurs)12/03/09
(Thurs)12/03/09
(Thurs)12/03/09
(Thurs)19/03/09
(Thurs)26/03/09
(Thurs)Weather Sunny Sunny Sunny Sunny/Cloudy Sunny/Cloudy SunnyDate of Survey - Weekend 21/03/09
(Sat)14/03/09
(Sat)14/03/09
(Sat)14/03/09
(Sat)21/03/09
(Sat)28/03/09
(Sat)Weather Sunny/Shower Sunny Sunny Sunny/Cloudy Sunny/Cloudy Sunny
Source: Trip Generation and Parking Generation Surveys, Bulky Goods/Hardware Stores, Analysis Report, Hyder Consulting for the NSW Roads and Traffic Authority, May 2009, p8
Guide to Traffic Generating Developments – updated traffic surveys | May 2013 19 (22 pages) UNCONTROLLED WHEN PRINTED
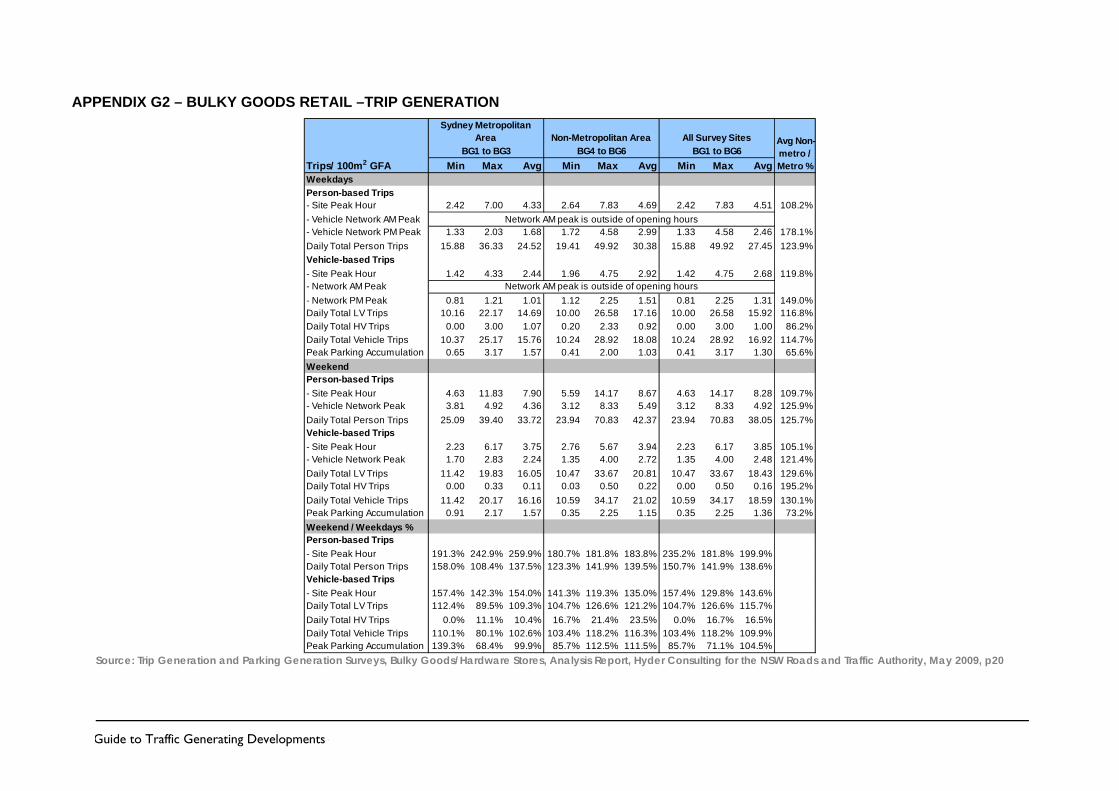
APPENDIX G2 – BULKY GOODS RETAIL –TRIP GENERATION
Trips/ 100m2 GFA Min Max Avg Min Max Avg Min Max AvgWeekdaysPerson-based Trips- Site Peak Hour 2.42 7.00 4.33 2.64 7.83 4.69 2.42 7.83 4.51 108.2%- Vehicle Network AM Peak- Vehicle Network PM Peak 1.33 2.03 1.68 1.72 4.58 2.99 1.33 4.58 2.46 178.1%Daily Total Person Trips 15.88 36.33 24.52 19.41 49.92 30.38 15.88 49.92 27.45 123.9%Vehicle-based Trips- Site Peak Hour 1.42 4.33 2.44 1.96 4.75 2.92 1.42 4.75 2.68 119.8%- Network AM Peak- Network PM Peak 0.81 1.21 1.01 1.12 2.25 1.51 0.81 2.25 1.31 149.0%Daily Total LV Trips 10.16 22.17 14.69 10.00 26.58 17.16 10.00 26.58 15.92 116.8%Daily Total HV Trips 0.00 3.00 1.07 0.20 2.33 0.92 0.00 3.00 1.00 86.2%Daily Total Vehicle Trips 10.37 25.17 15.76 10.24 28.92 18.08 10.24 28.92 16.92 114.7%Peak Parking Accumulation 0.65 3.17 1.57 0.41 2.00 1.03 0.41 3.17 1.30 65.6%WeekendPerson-based Trips- Site Peak Hour 4.63 11.83 7.90 5.59 14.17 8.67 4.63 14.17 8.28 109.7%- Vehicle Network Peak 3.81 4.92 4.36 3.12 8.33 5.49 3.12 8.33 4.92 125.9%Daily Total Person Trips 25.09 39.40 33.72 23.94 70.83 42.37 23.94 70.83 38.05 125.7%Vehicle-based Trips- Site Peak Hour 2.23 6.17 3.75 2.76 5.67 3.94 2.23 6.17 3.85 105.1%- Vehicle Network Peak 1.70 2.83 2.24 1.35 4.00 2.72 1.35 4.00 2.48 121.4%Daily Total LV Trips 11.42 19.83 16.05 10.47 33.67 20.81 10.47 33.67 18.43 129.6%Daily Total HV Trips 0.00 0.33 0.11 0.03 0.50 0.22 0.00 0.50 0.16 195.2%Daily Total Vehicle Trips 11.42 20.17 16.16 10.59 34.17 21.02 10.59 34.17 18.59 130.1%Peak Parking Accumulation 0.91 2.17 1.57 0.35 2.25 1.15 0.35 2.25 1.36 73.2%Weekend / Weekdays %Person-based Trips- Site Peak Hour 191.3% 242.9% 259.9% 180.7% 181.8% 183.8% 235.2% 181.8% 199.9%Daily Total Person Trips 158.0% 108.4% 137.5% 123.3% 141.9% 139.5% 150.7% 141.9% 138.6%Vehicle-based Trips- Site Peak Hour 157.4% 142.3% 154.0% 141.3% 119.3% 135.0% 157.4% 129.8% 143.6%Daily Total LV Trips 112.4% 89.5% 109.3% 104.7% 126.6% 121.2% 104.7% 126.6% 115.7%Daily Total HV Trips 0.0% 11.1% 10.4% 16.7% 21.4% 23.5% 0.0% 16.7% 16.5%Daily Total Vehicle Trips 110.1% 80.1% 102.6% 103.4% 118.2% 116.3% 103.4% 118.2% 109.9%Peak Parking Accumulation 139.3% 68.4% 99.9% 85.7% 112.5% 111.5% 85.7% 71.1% 104.5%
Network AM peak is outside of opening hours
Network AM peak is outside of opening hours
Avg Non-metro / Metro %
Sydney Metropolitan Area Non-Metropolitan Area All Survey Sites
BG1 to BG3 BG4 to BG6 BG1 to BG6
Source: Trip Generation and Parking Generation Surveys, Bulky Goods/Hardware Stores, Analysis Report, Hyder Consulting for the NSW Roads and Traffic Authority, May 2009, p20
Guide to Traffic Generating Developments – updated traffic surveys | May 2013 20 (22 pages) UNCONTROLLED WHEN PRINTED
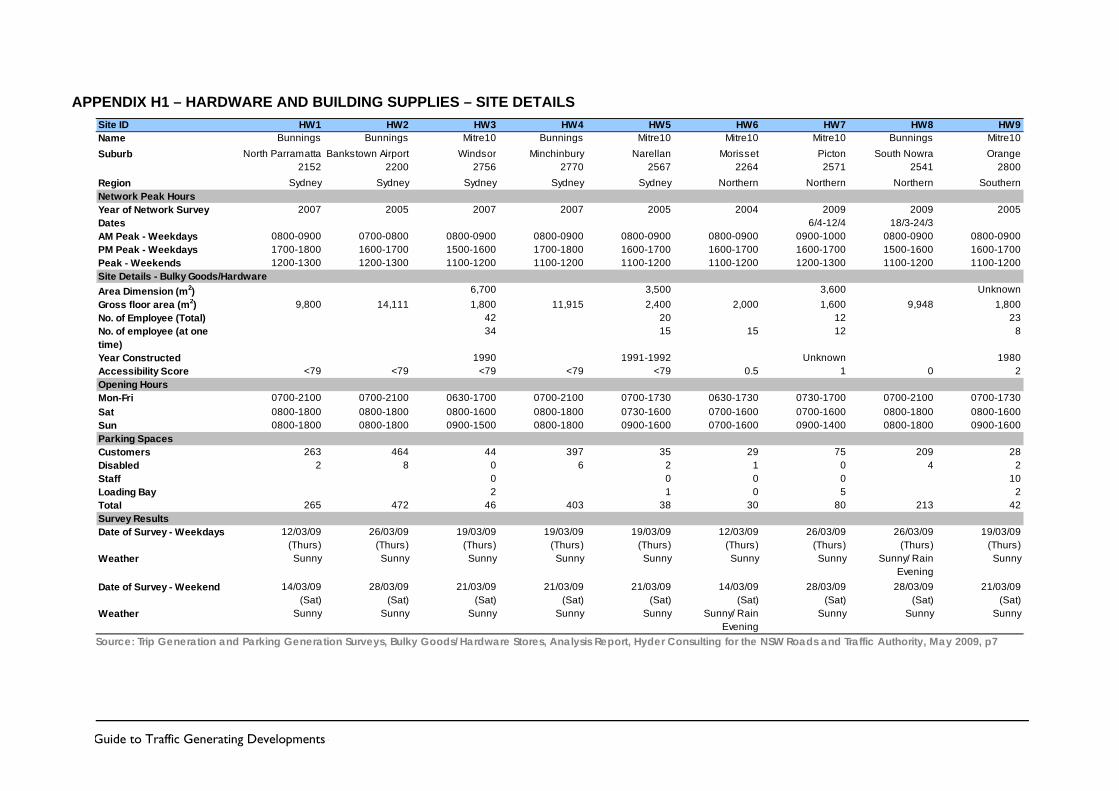
APPENDIX H1 – HARDWARE AND BUILDING SUPPLIES – SITE DETAILS Site ID HW1 HW2 HW3 HW4 HW5 HW6 HW7 HW8 HW9Name Bunnings Bunnings Mitre10 Bunnings Mitre10 Mitre10 Mitre10 Bunnings Mitre10Suburb North Parramatta
2152 Bankstown Airport
2200Windsor
2756Minchinbury
2770Narellan
2567Morisset
2264Picton 2571
South Nowra 2541
Orange 2800
Region Sydney Sydney Sydney Sydney Sydney Northern Northern Northern SouthernNetwork Peak HoursYear of Network Survey Dates
2007 2005 2007 2007 2005 2004 20096/4-12/4
200918/3-24/3
2005
AM Peak - Weekdays 0800-0900 0700-0800 0800-0900 0800-0900 0800-0900 0800-0900 0900-1000 0800-0900 0800-0900PM Peak - Weekdays 1700-1800 1600-1700 1500-1600 1700-1800 1600-1700 1600-1700 1600-1700 1500-1600 1600-1700Peak - Weekends 1200-1300 1200-1300 1100-1200 1100-1200 1100-1200 1100-1200 1200-1300 1100-1200 1100-1200Site Details - Bulky Goods/HardwareArea Dimension (m2) 6,700 3,500 3,600 UnknownGross floor area (m2) 9,800 14,111 1,800 11,915 2,400 2,000 1,600 9,948 1,800No. of Employee (Total) 42 20 12 23No. of employee (at one time)
34 15 15 12 8
Year Constructed 1990 1991-1992 Unknown 1980Accessibility Score <79 <79 <79 <79 <79 0.5 1 0 2Opening HoursMon-Fri 0700-2100 0700-2100 0630-1700 0700-2100 0700-1730 0630-1730 0730-1700 0700-2100 0700-1730Sat 0800-1800 0800-1800 0800-1600 0800-1800 0730-1600 0700-1600 0700-1600 0800-1800 0800-1600Sun 0800-1800 0800-1800 0900-1500 0800-1800 0900-1600 0700-1600 0900-1400 0800-1800 0900-1600Parking SpacesCustomers 263 464 44 397 35 29 75 209 28Disabled 2 8 0 6 2 1 0 4 2Staff 0 0 0 0 10Loading Bay 2 1 0 5 2Total 265 472 46 403 38 30 80 213 42Survey ResultsDate of Survey - Weekdays 12/03/09
(Thurs)26/03/09
(Thurs)19/03/09
(Thurs)19/03/09
(Thurs)19/03/09
(Thurs)12/03/09
(Thurs)26/03/09
(Thurs)26/03/09
(Thurs)19/03/09
(Thurs)Weather Sunny Sunny Sunny Sunny Sunny Sunny Sunny Sunny/ Rain
EveningSunny
Date of Survey - Weekend 14/03/09 (Sat)
28/03/09 (Sat)
21/03/09 (Sat)
21/03/09 (Sat)
21/03/09 (Sat)
14/03/09 (Sat)
28/03/09 (Sat)
28/03/09 (Sat)
21/03/09 (Sat)
Weather Sunny Sunny Sunny Sunny Sunny Sunny/ Rain Evening
Sunny Sunny Sunny
Source: Trip Generation and Parking Generation Surveys, Bulky Goods/Hardware Stores, Analysis Report, Hyder Consulting for the NSW Roads and Traffic Authority, May 2009, p7
Guide to Traffic Generating Developments – updated traffic surveys | May 2013 21 (22 pages) UNCONTROLLED WHEN PRINTED
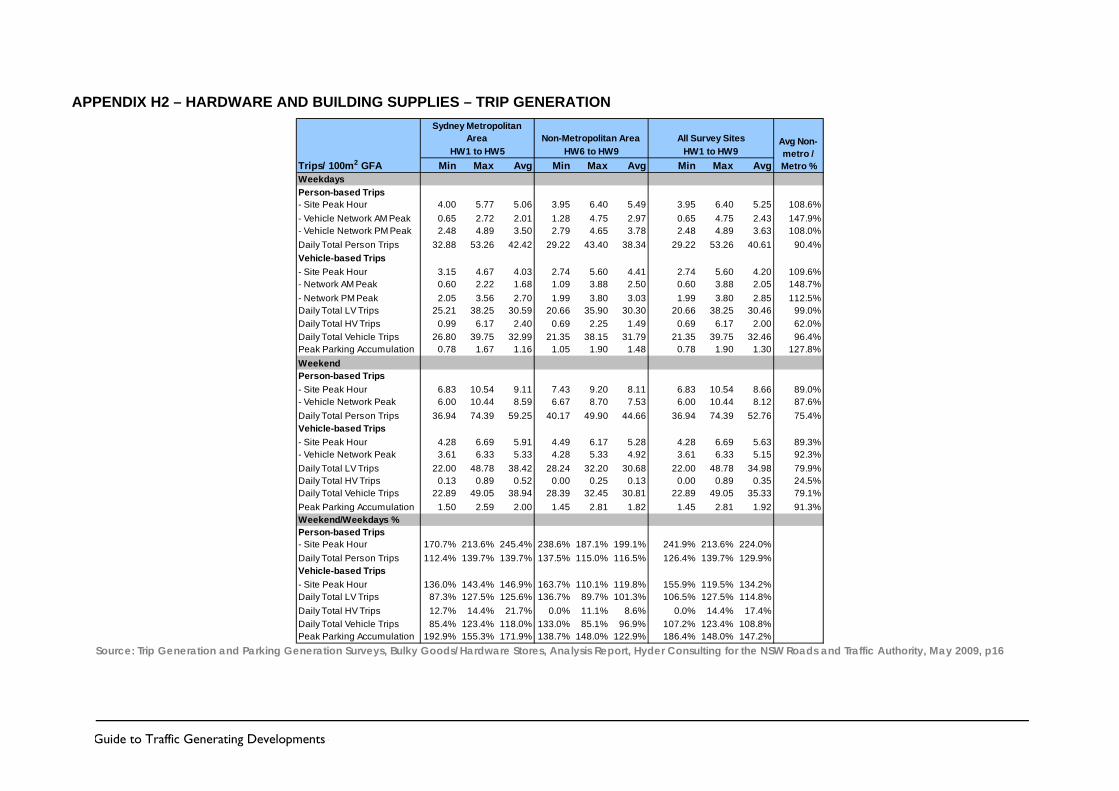
APPENDIX H2 – HARDWARE AND BUILDING SUPPLIES – TRIP GENERATION
Trips/ 100m2 GFA Min Max Avg Min Max Avg Min Max AvgWeekdaysPerson-based Trips- Site Peak Hour 4.00 5.77 5.06 3.95 6.40 5.49 3.95 6.40 5.25 108.6%- Vehicle Network AM Peak 0.65 2.72 2.01 1.28 4.75 2.97 0.65 4.75 2.43 147.9%- Vehicle Network PM Peak 2.48 4.89 3.50 2.79 4.65 3.78 2.48 4.89 3.63 108.0%Daily Total Person Trips 32.88 53.26 42.42 29.22 43.40 38.34 29.22 53.26 40.61 90.4%Vehicle-based Trips- Site Peak Hour 3.15 4.67 4.03 2.74 5.60 4.41 2.74 5.60 4.20 109.6%- Network AM Peak 0.60 2.22 1.68 1.09 3.88 2.50 0.60 3.88 2.05 148.7%- Network PM Peak 2.05 3.56 2.70 1.99 3.80 3.03 1.99 3.80 2.85 112.5%Daily Total LV Trips 25.21 38.25 30.59 20.66 35.90 30.30 20.66 38.25 30.46 99.0%Daily Total HV Trips 0.99 6.17 2.40 0.69 2.25 1.49 0.69 6.17 2.00 62.0%Daily Total Vehicle Trips 26.80 39.75 32.99 21.35 38.15 31.79 21.35 39.75 32.46 96.4%Peak Parking Accumulation 0.78 1.67 1.16 1.05 1.90 1.48 0.78 1.90 1.30 127.8%WeekendPerson-based Trips- Site Peak Hour 6.83 10.54 9.11 7.43 9.20 8.11 6.83 10.54 8.66 89.0%- Vehicle Network Peak 6.00 10.44 8.59 6.67 8.70 7.53 6.00 10.44 8.12 87.6%Daily Total Person Trips 36.94 74.39 59.25 40.17 49.90 44.66 36.94 74.39 52.76 75.4%Vehicle-based Trips- Site Peak Hour 4.28 6.69 5.91 4.49 6.17 5.28 4.28 6.69 5.63 89.3%- Vehicle Network Peak 3.61 6.33 5.33 4.28 5.33 4.92 3.61 6.33 5.15 92.3%Daily Total LV Trips 22.00 48.78 38.42 28.24 32.20 30.68 22.00 48.78 34.98 79.9%Daily Total HV Trips 0.13 0.89 0.52 0.00 0.25 0.13 0.00 0.89 0.35 24.5%Daily Total Vehicle Trips 22.89 49.05 38.94 28.39 32.45 30.81 22.89 49.05 35.33 79.1%Peak Parking Accumulation 1.50 2.59 2.00 1.45 2.81 1.82 1.45 2.81 1.92 91.3%Weekend/Weekdays %Person-based Trips- Site Peak Hour 170.7% 213.6% 245.4% 238.6% 187.1% 199.1% 241.9% 213.6% 224.0%Daily Total Person Trips 112.4% 139.7% 139.7% 137.5% 115.0% 116.5% 126.4% 139.7% 129.9%Vehicle-based Trips- Site Peak Hour 136.0% 143.4% 146.9% 163.7% 110.1% 119.8% 155.9% 119.5% 134.2%Daily Total LV Trips 87.3% 127.5% 125.6% 136.7% 89.7% 101.3% 106.5% 127.5% 114.8%Daily Total HV Trips 12.7% 14.4% 21.7% 0.0% 11.1% 8.6% 0.0% 14.4% 17.4%Daily Total Vehicle Trips 85.4% 123.4% 118.0% 133.0% 85.1% 96.9% 107.2% 123.4% 108.8%Peak Parking Accumulation 192.9% 155.3% 171.9% 138.7% 148.0% 122.9% 186.4% 148.0% 147.2%
All Survey SitesHW1 to HW9
Sydney Metropolitan Area Non-Metropolitan Area
HW1 to HW5 HW6 to HW9Avg Non-metro / Metro %
Source: Trip Generation and Parking Generation Surveys, Bulky Goods/Hardware Stores, Analysis Report, Hyder Consulting for the NSW Roads and Traffic Authority, May 2009, p16
Guide to Traffic Generating Developments – updated traffic surveys | May 2013 22 (22 pages) UNCONTROLLED WHEN PRINTED