guidelines for a roadway management system (rms) for local ... · guidelines for a roadway...
TRANSCRIPT

2901 South Loop Drive, Suite 3100 ~ Ames, Iowa 50010-8634
Iowa State University ~ University of Missouri-Columbia ~ Lincoln UniversityUniversity of Missouri-Kansas City ~ University of Missouri-St. Louis ~ University of Northern Iowa
Guidelines for aRoadway ManagementSystem (RMS) forLocal Governments
Final Report—October 2003

The contents of this report reflect the views of the authors, who are responsible for the facts andthe accuracy of the information presented herein. This document is disseminated under thesponsorship of the U.S. Department of Transportation, University Transportation Centers Pro-gram, in the interest of information exchange. The U.S. Government assumes no liability for thecontents or use thereof.
The Midwest Transportation Consortium (MTC) is housed at the Center for TransportationResearch and Education (CTRE) at Iowa State University. CTRE’s mission is to develop andimplement innovative methods, materials, and technologies for improving transportation effi-ciency, safety, and reliability while improving the learning environment of students, faculty, andstaff in transportation-related fields.

Technical Report Documentation Page 1. Report No. 2. Government Accession No. 3. Recipient’s Catalog No. MTC A-01 (Year One, 2000)
4. Title and Subtitle 5. Report Date October 2003 6. Performing Organization Code
Guidelines for a Roadway Management System (RMS) for Local Governments
7. Author(s) 8. Performing Organization Report No. Anil Misra, Ali Roohanirad, and Prapon Somboonyanon 9. Performing Organization Name and Address 10. Work Unit No. (TRAIS)
11. Contract or Grant No.
Midwest Transportation Consortium c/o Iowa State University 2901 South Loop Drive, Suite 3100 Ames, IA 50010-8634 12. Sponsoring Organization Name and Address 13. Type of Report and Period Covered
Final Report 14. Sponsoring Agency Code
U.S. Department of Transportation Research and Special Programs Administration 400 7th Street SW Washington, DC 20590-0001
15. Supplementary Notes 16. Abstract The objective of the proposed guidelines for a roadway management system (RMS) is to describe a framework for a modular and user-friendly RMS that will assist local government agencies of all sizes in coordinating and planning routine and preventive maintenance, rehabilitation, and reconstruction. These guidelines include a step-by-step procedure to establish a customized RMS for local government agencies. The resulting RMS, based upon the proposed guidelines, will be a systematic methodology that can assist local government agencies to evaluate the current pavement condition, identify problems on the pavements, select the best repair and maintenance strategies with the minimum cost, and generate a schedule and priority program for these actions at both project and network levels at both the present time and the future. The terms and definitions used in the inventory program, the referencing and the defining methods for the roadway network, and the understanding between the project and the network level are established, such that the data collection process can be initiated to gather information from concerned pavements within the roadway network. A step-by-step procedure is described for obtaining the pavement condition as represented by the pavement condition index (PCI) value for different low-volume flexible and built-up pavement types as well as different maintenance strategies. In the proposed guidelines, the PCI value forms the basis for establishing the other components as well as developing the coordination among the components of an RMS. Methods to generate the maintenance, rehabilitation, and reconstruction actions based upon the PCI are established. A pavement performance prediction model is developed to forecast the future PCI value, and a methodology for life cycle cost analysis is also provided in these guidelines. Finally, these guidelines briefly demonstrate the tasks that should be considered and included in reports to elected boards or councils that approve the funds regarding local government agencies’ needs.
17. Key Words 18. Distribution Statement pavement condition index, roadway management system
No restrictions.
19. Security Classification (of this report)
20. Security Classification (of this page)
21. No. of Pages 22. Price
Unclassified. Unclassified. 195 NA
Form DOT F 1700.7 (8-72). Reproduction of form and completed page is authorized.


Guidelines for a Roadway Management System (RMS) for Local Governments
Principal Investigator Anil Misra
Professor of Civil Engineering, University of Missouri - Kansas City
Co-Principal Investigator Ali Roohanirad
Design Chief, Jackson County, Missouri
Research Assistant Prapon Somboonyanon
Graduate Assistant, University of Missouri - Kansas City
Preparation of this report was financed in part through funds provided by the U.S. Department of Transportation
through the Midwest Transportation Consortium. MTC Project A-01 (Year One, 2000)
Midwest Transportation Consortium c/o Iowa State University
2901 South Loop Drive, Suite 3100 Ames, IA 50010-8634
Telephone: 515-294-8103 Fax: 515-294-0467
www.ctre.iastate.edu/mtc/
Final Report ● October 2003


iii
TABLE OF CONTENTS EXECUTIVE SUMMARY ........................................................................................................... ix 1. INTRODUCTION ...................................................................................................................... 1 2. SURVEY RESULTS .................................................................................................................. 3
2.1. Survey of Local Agencies.................................................................................................... 3 2.2. Literature Survey ................................................................................................................. 4
3. BACKGROUND INFORMATION ........................................................................................... 7 3.1. Definitions............................................................................................................................ 7 3.2. Pavement Types ................................................................................................................... 8 3.3. Low-Volume Flexible and Built-Up Road Pavements ...................................................... 10 3.4. Pavement Distresses........................................................................................................... 10
4. INVENTORY METHODOLOGY ........................................................................................... 17 4.1. Type of Segments .............................................................................................................. 17 4.2. Referencing Methods ......................................................................................................... 17 4.3. Defining the Facility Network into Segments ................................................................... 18 4.4. Network Level versus Project Level.................................................................................. 18
5. EVALUATION OF CURRENT CONDITION........................................................................ 21 5.1. Pavement Condition Rating by Visual Inspection ............................................................. 21 5.2. Pavement Condition Index................................................................................................. 22
6. INTEGRATION OF RMS WITH GEOGRAPHICAL INFORMATION SYSTEMS ............ 27 6.1. Systems Displaying RMS Information on Maps ............................................................... 27 6.2. Components of GIS............................................................................................................ 27 6.3. Approach to Establishing a Central Database.................................................................... 28
7. GENERATING STRATEGIES AND ALTERNATIVES FOR MAINTENANCE, ............... 29 REHABILITATION, AND RECONSTRUCTION (MR&R) ACTIONS ................................... 29 8. PAVEMENT PERFORMANCE PREDICTION MODEL ...................................................... 37 9. LIFE CYCLE COST ANALYSIS............................................................................................ 41
9.1. Total Cost of Each Strategy ............................................................................................... 42 10. PRIORITY PROGRAMMING............................................................................................... 45
10.1. Mathematical Formulation of Priority Index ................................................................... 45 11. REPORT GENERATING METHODS .................................................................................. 49 12. SUMMARY............................................................................................................................ 51 13. REFERENCES ....................................................................................................................... 53 Appendix A: Questionnaire and Detailed Summary of Local Government Survey..................... 55 Appendix B: Forms for Data Collection....................................................................................... 65 Appendix C: Distress Types for Low-Volume Flexible and Built-Up Roads .............................. 71 Appendix D: Deduct Value Curves for Low-Volume Flexible and Built-Up Roads ................. 107 Appendix E: Corrected Deduct Value Curves for Low-Volume Flexible and Built-Up Roads. 143 Appendix F: Repair Strategies Flow Charts ............................................................................... 147 Appendix G: Deterioration Curves of Actual Data and Predicted Curves ................................. 183


v
LIST OF FIGURES Figure 1. Condition Evaluation Flow Chart.................................................................................. 23 Figure 2. Qualitative Expression in Terms of Pavement Quality Associated with PCI ............... 24 Figure 3. Flowchart Presenting the Procedure to Calculate PCI .................................................. 25 Figure 4. Maintenance Activity and Time for Each Level of Service Based on PCI ................... 30 Figure 5. Typical Maintenance and Rehabilitation Feasible Actions for Flexible Pavement ...... 32 Figure 6. Typical Maintenance and Rehabilitation Feasible Actions for Chip Seal Roads.......... 33 Figure 7. Typical Maintenance and Rehabilitation Feasible Actions for Cold Mix Roads.......... 34 Figure 8. Typical Maintenance and Rehabilitation Feasible Actions for Aggregate Surface Roads
............................................................................................................................................... 35


vii
LIST OF TABLES Table 1. Examples of Flexible Pavement Distress Definitions..................................................... 11 Table 2. Examples of Rigid Pavement Distress Definitions......................................................... 13 Table 3. Examples of Aggregate Road Surface Distress Types ................................................... 15 Table 4. K1 and K2 Values Using Equation 3 to Predict PCI for Selected Pavement Age........... 38 Table 5. Examples of the Comparison between Actual PCI and Predicted PCI........................... 39 Table 6. Traffic Factor Based on ADT ......................................................................................... 46 Table 7. Roadway Functional Classification Factor ..................................................................... 46 Table 8. Roadway Location Factor............................................................................................... 47 Table 9. Maintenance History Factor............................................................................................ 47 Table 10. Pavement Riding Quality Factor................................................................................... 47


ix
EXECUTIVE SUMMARY The objective of the proposed guidelines for a roadway management system (RMS) is to describe a framework for a modular and user-friendly RMS that will assist local government agencies of all sizes in coordinating and planning routine and preventive maintenance, rehabilitation, and reconstruction. These guidelines include a step-by-step procedure to establish a customized RMS for local government agencies. The resulting RMS, based upon the proposed guidelines, will be a systematic methodology that can assist local government agencies to evaluate current pavement conditions, identify problems on pavements, select the best repair and maintenance strategies with the minimum cost, and generate a schedule and priority program for these actions at both project and network levels at both the present time and the future. As part of these guidelines, we also report the results of a nationwide survey of local government roadway management practices. A questionnaire was developed as part of this survey and sent out to local government agencies throughout the United States. This information was then used to establish the proposed RMS guidelines that are relevant for local government agencies’ needs and expectations. In addition, a literature survey was conducted to review current roadway management systems and research, and to reduce the duplication of research, information, or training materials that have been developed by other government agencies or private consultants. Furthermore, the information from both survey methods was evaluated, refined, and customized to the proposed RMS guidelines. Detailed background information on various aspects of a roadway pavement and an RMS is also given in these guidelines to ensure consistency of usage and understanding since these terms and definitions may vary from one agency to another. The information includes definitions and terms related to pavements, types of pavement, types of pavement distress, etc. Then, a section on inventory methodology is included. An inventory methodology is established for use in the data collection process. It is imperative that only necessary information be collected to reduce time and cost in the data collection process. This section also provides terms and definitions used in the inventory program, referencing and defining methods for the roadway network, and the understanding between project and network levels. This information is expected to clarify the scope and level of responsibility for local government agencies. Once the data inventory is established, the data collection process can be initiated to gather information from concerned pavements within the roadway network. The data used to evaluate the current pavement condition can be obtained by a variety of methods such as visual inspection rating, nondestructive testing, destructive testing, and others. Moreover, there are several mathematical indices that indicate the current pavement condition and that are widely used by local government agencies, such as the Present Serviceability Index (PSI), International Roughness Index (IRI), and Pavement Condition Index (PCI). These guidelines also provide the step-by-step procedure to obtain the PCI value for different low-volume flexible and built-up pavement types as well as different maintenance strategies. In the proposed guidelines, the PCI value forms the basis for establishing the other components as well as developing the coordination among the components of an RMS.

x
The integration of an RMS with a geographical information system (GIS) is another approach to achieve the long-term use of an RMS by updating the data on pavements within the roadway network. This report presents the advantages acquired from the integration of an RMS with GIS as a platform, details of systems displaying RMS information on maps, components of GIS, and the approach to establish a central database. Furthermore, these guidelines present a method to generate the maintenance, rehabilitation, and reconstruction actions in order to maintain and improve the pavement performance based upon the PCI obtained earlier. This will help local government agencies to decide what repair and maintenance actions would be best suitable for concerned pavements. Without a pavement performance prediction model, the future tasks and schedules cannot be effectively planned. A pavement performance prediction model is developed based upon the collected data on pavements to forecast the PCI value in the future. Therefore, by using this prediction model local government agencies will be able to predict future facility condition, analyze facility life cycle cost, and estimate the type and timing of maintenance and rehabilitation need regarding only the projected PCI. There are a number of factors used to consider maintenance alternatives needed for pavements such as cost, duration of action, available resource, etc. Generally, the cost of each alternative is the primary factor that most local government agencies are concerned with due to the limited funding each year. In order to compare the cost of each strategy, life cycle cost analysis can be preformed. Consequently, a methodology for life cycle cost analysis is also provided in these guidelines. Usually, local government agencies do not have enough funds to improve all segments within a roadway network although they have adequate information to identify problems on these segments. The priority program, therefore, is the solution for local government agencies to generate their budget and to numerically plan which concerned segment should be first taken care of. These guidelines identify the numerous factors affecting the priority index such as PCI, average daily traffic, roadway functional classification, roadway location, maintenance history, and pavement riding quality, and provide a methodology for obtaining the priority indices. The final component of an RMS is to generate a report such that the elected board or council can approve the funds regarding local government agencies’ needs. It is imperative that the data and analysis be clear and easy to understand for those who are not technical experts or engineering professionals. These guidelines briefly demonstrate the tasks that should be considered and included in the proposed report. This will guide local government agencies to establish the proposed report for their own customized RMS.
1
1. INTRODUCTION Managing, computing, and networking assets is one of the most problematic issues of modern networks. A roadway management system (RMS) is a systematic methodology for identifying, prioritizing, and cost-effectively addressing maintenance needs of government agencies, based on techniques and resources that are matched to local circumstances. This report contains detailed guidelines for implementing a total RMS and is intended for use by those who are responsible for managing and maintaining roadway pavement. These guidelines discuss the necessary procedures to determine the RMS needs of an agency and are also designed to assist local government agencies of all sizes, managers, engineers, and maintenance personnel, in making an informed and cost-effective decision about the pavement components for which they are responsible. The report also provides local government agencies with proven, practical tools, techniques, and procedures for developing a customized RMS, which will assist them to develop proactive maintenance plans. An effective roadway management system should provide complete life cycle coverage, starting with the planning, and continuing until replacement or reconstruction. Through the automation of the maintenance processes, a roadway management tool can save time and provide accurate information on roads and other infrastructure by eliminating subjective judgment. The RMS can also help managers use good data to make objective judgments in selecting maintenance strategies. Typically, a roadway management system includes a set of analysis tools that may be used by the asset manager for evaluating alternative strategies in a systematic and coordinated manner, with the objective of operating a network system at minimum cost and maximum efficiency. Such a system involves the following key elements:
• Strategic goals • Inventory, condition, and performance • Measures of goals and expectations • Prediction tools • Decision analysis and system integration • Consideration of life cycle costing in the decision process • Optimization • Links to the budget process and prioritization • Improvement in teamwork and communication • Continuous improvement in the RMS process
An efficient RMS should integrate easily with other infrastructure models. This feature allows a local agency to plan, schedule, and determine the needs budget and make objective decisions on when, where, how, and what to do. Also, this allows the managers to use their resources as a complete system. An RMS will help local government agencies in planning, programming, design, maintenance, rehabilitation, reconstruction, and monitoring facilities’ conditions. In other words, with an

2
RMS, information will be available on a facility’s condition and performance, which can help managers to develop a plan schedule and prepare short- and long-range requirements. The total goal of an RMS is to achieve maximum total return on the public’s capital.

3
2. SURVEY RESULTS 2.1. Survey of Local Agencies A questionnaire was developed to survey local governments regarding the current roadway management practices of the local government in the areas of pavement management, bridge management, and signal management. The main purpose of the survey was to gather information about the tools used and developed by local government agencies throughout the United States to manage their roadway networks. Specifically, the survey’s intent was to explore the basis and the methodologies of such tools as well as the expectations from the use of these tools. The questionnaire, given in Appendix A, was mailed to 300 local governments, and 34 responses were received. The survey result shows that an RMS has been used as early as in the 1970s; however, many government agencies applied an RMS to their program only in the early 1990s. The survey results were analyzed to develop an inventory of current techniques, ideas, technology, and research materials related to roadway management systems that are appropriate to most local government agencies. A detailed summary of the survey results can be found in Appendix A. The survey results show that more than 90 percent of roads in survey areas are flexible and built-up roads, including chip seal, cold mix, and gravel roads. Consequently, these pavement types should be seriously considered in the development of a new RMS, such that the developed systems can be efficiently used on these pavement types. Moreover, there is a clear need for methodologies to determine the pavement condition for such pavement types. The method used to determine the pavement condition is a particularly important procedure for an RMS. There are various techniques used by local government agencies to verify the pavement condition such as the International Roughness Index (IRI), PAVER, riding quality, Present Serviceability Index (PSI), etc. Another technique called the Pavement Condition Index (PCI) has been developed relatively recently and is currently in use by several local government agencies throughout the United States. Almost 40 percent of our survey respondents utilize the PCI technique for pavement evaluation. PCI is the numerical indicator to determine pavement condition based on a variety of factors, and the current PCI can be determined according to the observed condition data of a pavement. In addition to the techniques to evaluate current pavement condition, the pavement performance prediction model is also an important element of an RMS. However, these prediction models have not been widely established, especially for the pavement types, mentioned above, that are of most interest to local government agencies. Less than 25 percent of our survey respondents have used prediction models that are typically based upon their experience and the historical data they have collected. It is reasonable to emphasize that without an efficient prediction model an RMS cannot be well planned. The processes used to make decisions on asset management actions such as maintenance, rehabilitation, or reconstruction (MR&R) is another important procedure of an RMS. More than 60 percent of the agencies surveyed have chosen life cycle cost analysis for economic evaluation and used the results to establish their strategy, schedule, and funding needs programs. The other

4
agencies report that they use historical data and experience, along with available resources, to make decisions of asset management actions. From the survey results, the agency expectations from the use of an RMS were also collected and analyzed. Almost 50 percent of the respondents suggested five different sets of items that local government agencies expect from a proposed RMS. These include (1) a pavement data collection method, (2) pavement life cycle cost analysis, (3) a pavement condition evaluation method, (4) a pavement performance model, and (5) an integrated management system that includes various assets. In addition, respondents also suggested the integration of geographical information systems (GIS) and global positioning satellite systems with the RMS. They also expressed a need for a user-friendly, flexible, and affordable RMS. Considering the wide range of expectations from roadway management systems, we conclude that an RMS is best designed keeping an individual local government agency’s need as a primary goal. However, for portability, consistency, and to some extent uniformity between RMSs, certain underlying guidelines need to be applied during an RMS’s development. Consequently, this report focuses on developing guidelines and standards that may be used by a local government agency to develop its RMS. 2.2. Literature Survey In addition to the survey of local government agencies, a review of the current state-of-art of roadway management systems was performed by searching materials related to RMSs such as articles, technical documents developed by government agencies, and textbooks. Following is a discussion of the findings from our literature search with special attention to the current issues related to roadway management systems. The procedure developed by World Bank HDM Manager, Peru, is an attempt to approach road network management. The brief data collection process and survey results are provided. Based on the survey results, the analysis of data is conducted, and the recommended strategies for both paved and unpaved roads are presented. International Roughness Index (IRI) and Net Present Value (NPV) are important indicators used in the process to determine and prioritize maintenance activities (Liautaud 1996). Al-Swailmi (1994) introduces the framework for municipal maintenance management systems. It is focused for use in cities rather than for rural road networks due to more factors affecting deterioration rate of the road network in cities than rural areas. Al-Swailmi provides the methodology used to develop a new system for a maintenance management system (MMS). Then, it is combined with city’s subsystem to eliminate conflicts between road and utility construction and maintenance activities and to provide the general concept of MMS with a cost-effective approach. Livneh (1997) has described an approach for the development of deterioration curves of overlaid pavements. Livneh finds that the prediction model for pavement deterioration must be derived systematically because this model is very essential for the highway system. The material provides original deterioration curves and other formulations to predict the deterioration curves

5
for overlaid pavements. A computation example is also demonstrated to support the equations developed in this paper. Medina et al. (1999) have described a case study of using geographic information systems (GIS) with a pavement management system (PMS), specifically for low-volume roads. The paper presents the background of GIS and how it can be used to coordinate with PMS in order to help government agencies to efficiently generate strategies and eventually make decisions to improve pavements in the roadway network. The material also provides step-by-step guidelines for integrating these two systems, and then the method is used to estimate the cost of maintenance actions generated each year. Hall et al. (2001) have described methodologies for generating rehabilitation strategies of highway pavements as part of the National Cooperative Highway Research Program (NCHRP), Project C1-38. Their report provides a set of procedures to help agencies in evaluating and selecting rehabilitation activities for highway pavements. The guidelines for life cost analysis of pavements are also given such that agencies can make decisions based upon their budgets.


7
3. BACKGROUND INFORMATION Before any action may be initiated for establishing an RMS, it is important for a local government agency to acknowledge general information involving the pavement inventory such as definitions and terms used in pavements, type of pavement, type of pavement distress, etc. Since the terms, their definitions, and their usages may vary from region to region and from one local government agency to another, it is imperative to develop a common glossary in order to encourage consistency of usage and understanding. Therefore, in this section, we present a collection of terms and definitions that are widely used for describing pavement types and behavior. 3.1. Definitions
According to Asphalt Institute (1983), some terms defining pavement characteristics are described as follows:
• Asphalt concrete (AC): high-quality, thoroughly-controlled hot mixture of asphalt cement and well-graded, high-quality aggregate, thoroughly compacted into a uniform dense mass.
• Asphalt pavement: pavements consisting of a surface course of mineral aggregate coated and cemented together with asphalt cement on supporting courses such as asphalt bases, crushed stone, slag, or gravel; or on portland cement concrete, brick, or block pavement.
• Asphalt emulsion slurry seal: a mixture of slow-setting emulsified asphalt, fine aggregate and mineral filler, with water added to produce slurry consistency.
• Asphalt fog seal: a light application of slow-setting asphalt emulsion diluted with water. It is used to renew old asphalt surfaces and to seal small cracks and surface voids.
• Asphalt leveling course: a course (asphalt aggregate mixture) of variable thickness used to eliminate irregularities in the contour of an existing surface prior to superimposed treatment or construction.
• Asphalt overlay: one or more courses of asphalt construction on an existing pavement. The overlay generally includes a leveling course, to correct the contour of the old pavement, followed by uniform course or courses to provide needed thickness.
• Cold mix road: a mixture of aggregate with liquid or emulsified asphalt placed at atmospheric temperature and normally spread with a motor grader and then rolled.
• Chip seal road: a thin asphalt surface treatment. It is a mixture of cover aggregate with liquid or emulsified asphalt, which is used to waterproof and improve roadway surfaces.
• Gravel road: surfaces constructed with a hard mineral material such as gravel, crushed rock, or sand.
In terms of maintenance and rehabilitation actions, several strategies are defined below:
• Overlay: placing 2 to 4 inches of hot mix or cold mix asphalt on the pavement to improve the serviceability and structural load-carrying capacity of pavement or to upgrade the initial construction.

8
• Slurry seal: used to seal a surface base course against water entry and to provide a friction surface for traffic.
• Single chip seal: used to seal a base course against water entry and to provide a friction surface for traffic.
• Double chip seal: consisting of application of a second layer of chip seal with smaller sized aggregate in the top layer. Surface treatment is usually less than 1-inch thick. In some case, the chips are precoated to prevent chip loosening or loss.
• Base stabilization: strengthening the base when unstable base is presented for greater load-carrying capacity through the addition of cement, oil, aggregate, or fly ash.
• Partial-depth patching: construction of a 2-to-4-inch asphalt-cement hot mix or cold mix pavement in the potholes that require patching.
• Full-depth patching: repairing a deep base failure or a severe load associated with cracking.
• Recycling: a method of heating, adding asphalt or aggregate if required, and mixing the combined material. Recycling machines are available that will reduce the material to the proper size and redeposit it on the milled area.
3.2. Pavement Types The types of pavements can be generally divided into three major groups: flexible or asphalt pavements, rigid or concrete pavements, and composite pavements (Huang 1993). 3.2.1. Flexible Pavements There are three types of flexible pavements: (1) conventional flexible pavements, (2) full-depth asphalt pavements, and (3) contained rock asphalt mats (CRAM). Survey results described in Section 2 show that the flexible pavements make up approximately 55 percent of the total miles constructed within the surveyed areas. Conventional flexible pavements. Conventional flexible pavements are composed of three main layers: bituminous surfacing, base, and subbase. The surfacing layer is divided into the wearing course and the binder course. The base course and subbase course can be constructed in the composite form by using different materials. The quality of materials used to construct layers and the intensity of stress vary from high for the top layer to low for the bottom layer. In addition to the main layers, a seal coat is applied on the top of pavement to provide skid resistance or to waterproof the surface. Also, a tack coat is placed between the surface and binder course, and a prime coat is applied between the binder and base course. The purpose of the tack coat and the prime coat is to provide bond between layers. Full-depth asphalt pavements. The main concept for this type of pavement is to use as few different types of materials as possible. Usually only one material is used and is directly placed as one or more layers on the subbase course. These pavement types are easy to construct and cost-effective where other materials are not available in the local areas. If such a pavement is built in several layers then the tack coat must be applied between layers to provide an interlayer bond.
9
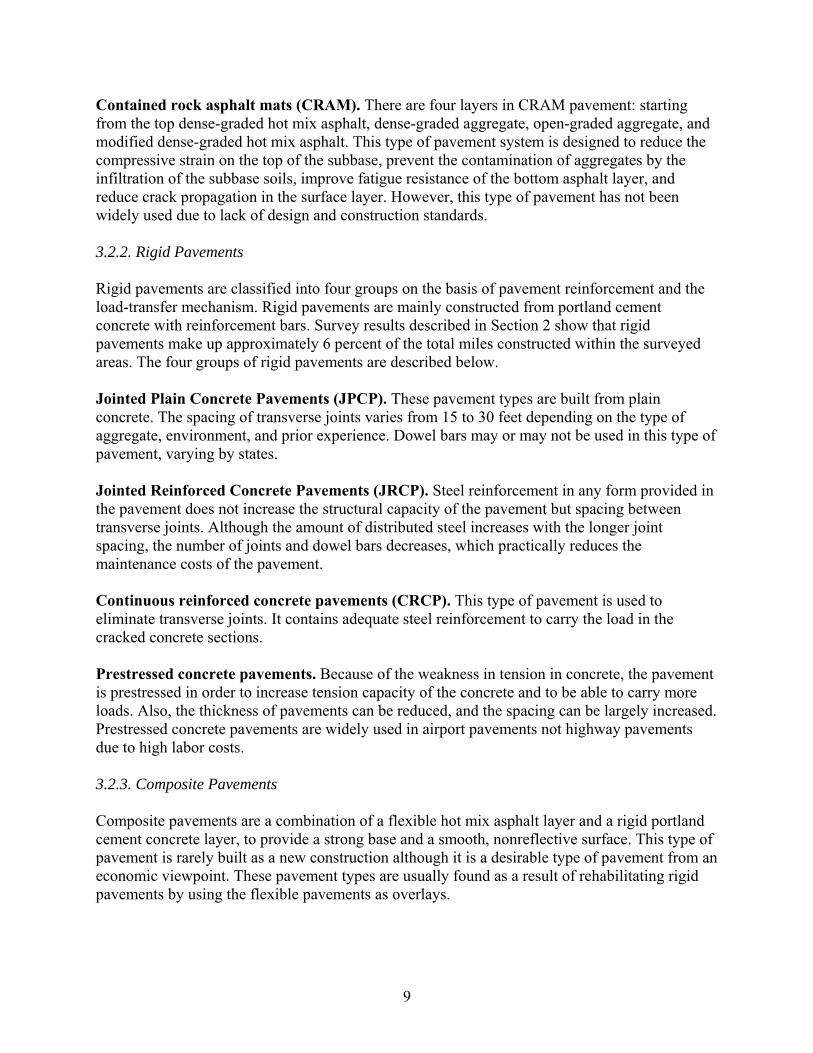
Contained rock asphalt mats (CRAM). There are four layers in CRAM pavement: starting from the top dense-graded hot mix asphalt, dense-graded aggregate, open-graded aggregate, and modified dense-graded hot mix asphalt. This type of pavement system is designed to reduce the compressive strain on the top of the subbase, prevent the contamination of aggregates by the infiltration of the subbase soils, improve fatigue resistance of the bottom asphalt layer, and reduce crack propagation in the surface layer. However, this type of pavement has not been widely used due to lack of design and construction standards. 3.2.2. Rigid Pavements Rigid pavements are classified into four groups on the basis of pavement reinforcement and the load-transfer mechanism. Rigid pavements are mainly constructed from portland cement concrete with reinforcement bars. Survey results described in Section 2 show that rigid pavements make up approximately 6 percent of the total miles constructed within the surveyed areas. The four groups of rigid pavements are described below. Jointed Plain Concrete Pavements (JPCP). These pavement types are built from plain concrete. The spacing of transverse joints varies from 15 to 30 feet depending on the type of aggregate, environment, and prior experience. Dowel bars may or may not be used in this type of pavement, varying by states. Jointed Reinforced Concrete Pavements (JRCP). Steel reinforcement in any form provided in the pavement does not increase the structural capacity of the pavement but spacing between transverse joints. Although the amount of distributed steel increases with the longer joint spacing, the number of joints and dowel bars decreases, which practically reduces the maintenance costs of the pavement. Continuous reinforced concrete pavements (CRCP). This type of pavement is used to eliminate transverse joints. It contains adequate steel reinforcement to carry the load in the cracked concrete sections. Prestressed concrete pavements. Because of the weakness in tension in concrete, the pavement is prestressed in order to increase tension capacity of the concrete and to be able to carry more loads. Also, the thickness of pavements can be reduced, and the spacing can be largely increased. Prestressed concrete pavements are widely used in airport pavements not highway pavements due to high labor costs. 3.2.3. Composite Pavements Composite pavements are a combination of a flexible hot mix asphalt layer and a rigid portland cement concrete layer, to provide a strong base and a smooth, nonreflective surface. This type of pavement is rarely built as a new construction although it is a desirable type of pavement from an economic viewpoint. These pavement types are usually found as a result of rehabilitating rigid pavements by using the flexible pavements as overlays.

10
3.3. Low-Volume Flexible and Built-Up Road Pavements
In general, all of the types of pavements described above are typically constructed in areas ranging from moderate to large communities. In small cities and counties, most pavements are built in the forms of (1) low-volume flexible roads and (2) built-up roads. Survey results described in Section 2 show that the low-volume flexible and built-up roads make up approximately 39 percent of the total miles constructed within the surveyed areas. Because of the wide use throughout the country of flexible and built-up roads in local government jurisdictions, this report will emphasize these pavement types. The structure of low-volume road and built-up road pavements are usually the same as flexible pavements mentioned earlier. They are composed of a surfacing layer, a base course, and a subbase. The only difference in these two systems is the material used for the wearing surfaces. For the low-volume flexible pavements, the surfaces are often built from hot mix asphalt. The surfaces of built-up road pavements can be constructed of cold-mix asphalt, chip seal, or aggregate such as gravel. The properties of the low-volume flexible pavement structures are similar to the built-up pavement structures. Some significant properties of these two types are presented below:
• Base courses: The layer of material beneath the wearing surface of pavement contains little or no fines in order to provide the drainage, and it is, generally, well graded to resist the deformation of the base courses.
• Subbase courses: The layer of material below the base courses is compacted to relatively high densities due to the high distribution of loads from the surface.
• Subgrade: The material beneath the subbase has a number of factors affecting its performance, such as compaction, strength and density, and drainage.
3.4. Pavement Distresses Distress is one of the most important factors that influence the performance of pavements. A variety of pavement distress can occur due to different causes such as load application, materials, environmental problems, etc. Huang (1993) recommends that each type of distress be treated separately by developing a different application depending on the cause of distress. Examples of pavement distresses are shown in Table 1 for flexible pavements, Table 2 for rigid pavements, and Table 3 for aggregate-earth surfaced roads (tables according to Modern Pavement Management, Hass 1994). The severity level of pavement distress is another important key in evaluating pavement condition. The severity levels in various types of distress in different types of pavement will be discussed in Section 5.2, “Pavement Condition Index.”

Tab
le 1
. Exa
mpl
es o
f Fle
xibl
e Pa
vem
ent D
istr
ess D
efin
ition
s (A
ccor
ding
to H
ass 9
4)
T
ypes
of D
istr
esse
s D
escr
iptio
n
Se
veri
ty L
evel
s
Ext
ent M
easu
res
Alli
gato
r cra
ckin
g In
terc
onne
cted
cra
cks c
ause
d by
fatig
ue d
ue
L: F
ine
para
llel l
ongi
tudi
nal c
rack
s
Squ
are
feet
of s
urfa
ce a
rea
to
repe
ated
load
s.
M
: Net
wor
k of
cra
cks w
ith so
me
spal
ls
H
: Wel
l-def
ined
pie
ces t
hat m
ay ro
ck
und
er tr
affic
and
spal
led
at th
e ed
ges
Blo
ck c
rack
ing
In
terc
onne
cted
cra
cks c
ause
d by
shrin
kage
L:
Any
fille
d cr
ack
or n
onfil
led
crac
ks
S
quar
e fe
et o
f sur
face
are
a
of th
e as
phal
t and
dai
ly te
mpe
ratu
re c
yclin
g.
l
ess t
han
3/8
inch
es.
Size
of b
lock
rang
es fr
om 1
×1 to
10×
10 fe
et.
M: N
onfil
led
crac
ks 3
/8 to
3 in
ches
wid
e
Gen
eral
ly o
ccur
s ove
r a w
ide
area
of t
he
or n
onfil
led
crac
ks u
p to
3 in
ches
wid
e
pave
men
t sur
face
.
s
urro
unde
d by
ligh
t ran
dom
cra
ckin
g
H: A
ny c
rack
surr
ound
ed b
y ra
ndom
c
rack
ing
or n
onfil
led
crac
k m
ore
than
3
inch
es.
Dis
torti
ons
C
orru
gatio
ns, b
umps
, sag
s, an
d sh
ovin
g.
L:
Cau
se v
ibra
tion
in th
e ve
hicl
e bu
t do
S
quar
e fe
et o
f sur
face
are
a
Abr
upt u
pwar
d or
dow
nwar
d di
spla
cem
ents
not
requ
ire th
e ve
hicl
e to
be
slow
ed
of
the
pave
men
t sur
face
. Dis
torti
ons a
re
M
: Sig
nific
ant v
ibra
tion
in th
e ve
hicl
e,
ev
alua
ted
rela
tive
to th
e ef
fect
on
ride
qual
ity.
som
e re
duct
ion
in sp
eed
is n
eces
sary
f
or sa
fety
and
com
fort
H
: Exc
essi
ve v
ehic
le v
ibra
tion
requ
ires
con
side
rabl
e sp
eed
redu
ctio
n fo
r saf
ety
and
com
fort
11

Tab
le 1
. Exa
mpl
es o
f Fle
xibl
e Pa
vem
ent D
istr
ess D
efin
ition
s [C
ontin
ued]
(A
ccor
ding
to H
ass 9
4)
T
ypes
of D
istr
esse
s
D
escr
iptio
n
S
ever
ity L
evel
s
E
xten
t Mea
sure
s Lo
ngitu
dina
l and
C
rack
s tha
t are
eith
er p
aral
lel o
r tra
nsve
rse
L:
Any
fille
d cr
ack
or n
onfil
led
crac
ks
S
quar
e fe
et o
f sur
face
are
a tra
nsve
rse
crac
king
to
the
pave
men
t cen
terli
ne. L
ongi
tudi
nal
l
ess t
han
3/8
inch
es.
cr
acks
are
gen
eral
ly re
late
d to
con
stru
ctio
n M
: Non
fille
d cr
acks
3/8
to 3
inch
es w
ide
defe
cts a
nd tr
ansv
erse
cra
cks a
re re
late
d to
or n
onfil
led
crac
ks u
p to
3 in
ches
wid
e
tem
pera
ture
var
iatio
ns a
nd h
arde
ning
of t
he
s
urro
unde
d by
ligh
t ran
dom
cra
ckin
g
asph
alt.
H
: Any
cra
ck su
rrou
nded
by
rand
om
cra
ckin
g or
non
fille
d cr
ack
mor
e th
an
3 in
ches
Pa
tchi
ng a
nd
R
epai
r of t
he p
avem
ent w
ith n
ew m
ater
ial.
L: P
atch
in g
ood
cond
ition
and
doe
s not
Are
a of
pat
chin
g ut
ility
cut
s
a
ffec
t rid
e qu
ality
M: M
oder
ate
dete
riora
tion,
som
e ef
fect
on
r
ide
qual
ity
H
: Sev
ere
dete
riora
tion,
with
hig
h se
verit
y
e
ffec
t on
ride
qual
ity
Rut
ting
Dep
ress
ion
in th
e tra
nsve
rse
prof
ile o
f the
L:
Les
s tha
n 1-
inch
dep
th
Squ
are
feet
of s
urfa
ce a
rea
pa
vem
ent s
urfa
ce.
M
: 1- t
o 2-
inch
dep
th
H
: Mor
e th
an 2
-inch
dep
th
12

Tab
le 2
. Exa
mpl
es o
f Rig
id P
avem
ent D
istr
ess D
efin
ition
s (A
ccor
ding
to H
ass 9
4)
T
ypes
of D
istr
esse
s D
escr
iptio
n
Se
veri
ty L
evel
s
Ext
ent M
easu
res
Blo
w-u
p an
d
Slab
exp
ansi
on w
ith in
suff
icie
nt jo
int w
idth
L:
Litt
le e
ffec
t on
ride
qual
ity
Rat
e tw
o sl
abs a
s dis
tress
ed
buck
ling
ca
uses
upw
ard
mov
emen
t of t
he p
avem
ent a
t M
: Med
ium
seve
rity
ride
qual
ity
for a
join
t blo
w-u
p an
d as
the
join
t. R
ated
rela
tive
to th
e ef
fect
on
ride
H: H
igh
seve
rity
ride
qual
ity
one
slab
for a
cra
ck b
low
-up
qu
ality
. C
orne
r bre
ak
C
rack
inte
rsec
ts th
e jo
ints
at t
he d
ista
nce
less
L:
Low
seve
rity
crac
k w
ith a
rea
defin
ed
E
xten
t mea
sure
d by
the
than
or e
qual
to o
ne-h
alf t
he sl
ab le
ngth
on
by
the
brea
k ha
ving
littl
e or
no
othe
r
num
ber o
f sla
bs th
at a
re
bo
th si
des.
Cra
ck e
xten
ds v
ertic
ally
thro
ugh
c
rack
ing
aff
ecte
d
the
dept
h of
the
slab
.
M: M
ediu
m se
verit
y cr
acki
ng w
ith so
me
med
ium
seve
rity
crac
ks in
the
area
d
efin
ed b
y th
e br
eak
and
the
join
t
H: H
igh
seve
rity
crac
king
and
the
area
b
etw
een
the
brea
k an
d th
e jo
int i
s
s
ever
ely
crac
ked
Dur
abili
ty o
r
Cau
sed
by fr
eeze
thaw
exp
ansi
on o
f lar
ge
L: C
rack
s are
tigh
t and
cov
er le
ss th
an
C
ount
the
num
ber o
f sla
bs
D c
rack
ing
ag
greg
ate
resu
lting
in a
bre
akdo
wn
of th
e
1
5% o
f the
pav
emen
t are
a
a
t the
diff
eren
t sev
erity
conc
rete
.
M
: D C
rack
s cov
er m
ore
than
15%
of t
he
le
vel
are
a an
d ar
e tig
ht o
r cov
er le
ss th
an
15%
of t
he a
rea
but d
ispl
ay p
ops o
ut o
r
c
an b
e ea
sily
rem
oved
H: M
ore
than
15%
of t
he a
rea
and
piec
es
are
eas
y to
rem
ove
13
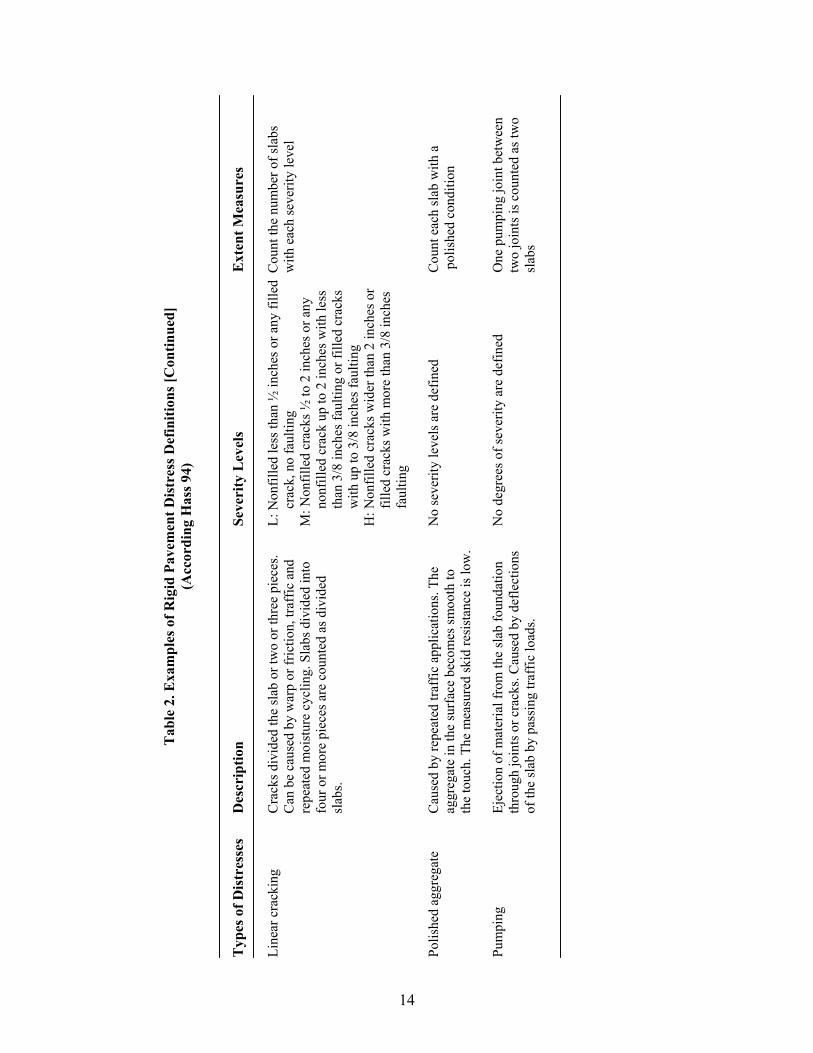
Tab
le 2
. Exa
mpl
es o
f Rig
id P
avem
ent D
istr
ess D
efin
ition
s [C
ontin
ued]
(A
ccor
ding
Has
s 94)
Typ
es o
f Dis
tres
ses
Des
crip
tion
Seve
rity
Lev
els
Ext
ent M
easu
res
Line
ar c
rack
ing
C
rack
s div
ided
the
slab
or t
wo
or th
ree
piec
es.
L: N
onfil
led
less
than
½ in
ches
or a
ny fi
lled
Cou
nt th
e nu
mbe
r of s
labs
Can
be
caus
ed b
y w
arp
or fr
ictio
n, tr
affic
and
cra
ck, n
o fa
ultin
g
with
eac
h se
verit
y le
vel
re
peat
ed m
oist
ure
cycl
ing.
Sla
bs d
ivid
ed in
to
M: N
onfil
led
crac
ks ½
to 2
inch
es o
r any
four
or m
ore
piec
es a
re c
ount
ed a
s div
ided
non
fille
d cr
ack
up to
2 in
ches
with
less
slab
s.
t
han
3/8
inch
es fa
ultin
g or
fille
d cr
acks
w
ith u
p to
3/8
inch
es fa
ultin
g
H: N
onfil
led
crac
ks w
ider
than
2 in
ches
or
fill
ed c
rack
s with
mor
e th
an 3
/8 in
ches
f
aulti
ng
Polis
hed
aggr
egat
e C
ause
d by
repe
ated
traf
fic a
pplic
atio
ns. T
he
No
seve
rity
leve
ls a
re d
efin
ed
Cou
nt e
ach
slab
with
a
ag
greg
ate
in th
e su
rfac
e be
com
es sm
ooth
to
pol
ishe
d co
nditi
on
th
e to
uch.
The
mea
sure
d sk
id re
sist
ance
is lo
w.
Pum
ping
Ejec
tion
of m
ater
ial f
rom
the
slab
foun
datio
n N
o de
gree
s of s
ever
ity a
re d
efin
ed
O
ne p
umpi
ng jo
int b
etw
een
th
roug
h jo
ints
or c
rack
s. C
ause
d by
def
lect
ions
tw
o jo
ints
is c
ount
ed a
s tw
o
of th
e sl
ab b
y pa
ssin
g tra
ffic
load
s.
slab
s
14

Tab
le 3
. Exa
mpl
es o
f Agg
rega
te R
oad
Surf
ace
Dis
tres
s Typ
es
(Acc
ordi
ng to
Has
s 94)
Typ
es o
f Dis
tres
ses
Des
crip
tion
Seve
rity
Lev
els
Ext
ent M
easu
res
Impr
oper
cro
ss
N
ot e
noug
h cr
own
for p
rope
r dra
inag
e.
L:
Sm
all a
mou
nts o
f pon
ding
wat
er
M
easu
re li
near
feet
alo
ng th
e
sect
ion
M: M
oder
ate
amou
nts o
f pon
ding
wat
er
c
ente
r lin
e of
the
affe
cted
H: L
arge
am
ount
s of p
ondi
ng w
ater
, roa
d
are
a
s
urfa
ce c
onta
ins s
ever
e de
pres
sion
s In
adeq
uate
dra
inag
e Ev
alua
te a
bilit
y of
ditc
hes a
nd c
ulve
rts
L:
Sm
all a
mou
nts o
f wat
er p
ondi
ng a
nd/o
r L
inea
r fee
t of a
ffec
ted
area
to
car
ry a
way
wat
er.
ove
rgro
wth
and
deb
ris in
the
ditc
hes
mea
sure
d al
ong
the
cent
er
M
: Mod
erat
e am
ount
s of p
ondi
ng in
the
line
ditc
hes o
r ove
rgro
wth
and
deb
ris a
nd
e
rosi
on o
f the
ditc
hes i
nto
the
shou
lder
s
and
the
road
way
C
orru
gatio
ns
C
lose
ly sp
aced
ridg
es a
nd v
alle
ys a
t
L: C
orru
gatio
ns a
re le
ss th
an 1
inch
dee
p
Squ
are
feet
of a
ffec
ted
area
fairl
y re
gula
r int
erva
ls.
M
: Cor
ruga
tions
1 to
3 in
ches
dee
p
H: C
orru
gatio
ns m
ore
than
3 in
ches
dee
p
15

Tab
le 3
. Exa
mpl
es o
f Agg
rega
te R
oad
Surf
ace
Dis
tres
s Typ
es [C
ontin
ued]
(A
ccor
ding
to H
ass 9
4)
T
ypes
of D
istr
esse
s D
escr
iptio
n
Se
veri
ty L
evel
s
E
xten
t Mea
sure
s Po
thol
es
B
owl-s
hape
d de
pres
sion
s in
the
road
surf
ace
L: L
ess t
han
2 fe
et in
dia
met
er a
nd le
ss
C
ount
the
num
ber o
f eac
h
usua
lly le
ss th
an 3
feet
in d
iam
eter
.
t
han
2 in
ches
dee
p or
less
than
1 fe
et in
se
verit
y le
vel i
n th
e sa
mpl
e
d
iam
eter
and
2 to
4 in
ches
dee
p
are
a
M: M
ore
than
4 in
ches
dee
p an
d le
ss th
an
1 fe
et in
dia
met
er, o
r 2 to
4 in
ches
dee
p
a
nd 1
to 2
feet
in d
iam
eter
, or m
ore
t
han
2 fe
et in
dia
met
er a
nd le
ss th
an
2 in
ches
dee
p
H: M
ore
than
2 in
ches
dee
p an
d m
ore
than
4
feet
in d
iam
eter
R
uts
Dep
ress
ions
in h
e w
heel
pat
h.
L: L
ess t
han
1 in
ch d
eep
S
quar
e fe
et o
f aff
ecte
d ar
ea
M
: 1 to
3 in
ches
dee
p
H: M
ore
than
3 in
ches
dee
p Lo
ose
aggr
egat
e
Agg
rega
te p
artic
les a
re se
para
ted.
L: L
oose
agg
rega
te o
n th
e ro
ad su
rfac
e
Lin
ear f
eet p
aral
lel t
o th
e
M
: Mod
erat
e ag
greg
ate
berm
on
the
road
surf
ace
sho
ulde
r or l
ess t
rave
led
area
; a
lar
ge a
mou
nt o
f fin
e ar
ea o
n th
e ro
ad
sur
face
H: L
arge
agg
rega
te b
erm
on
the
shou
lder
a
nd le
ss tr
avel
ed a
rea
16

17
4. INVENTORY METHODOLOGY The pavement inventory is the foundation of any roadway management system since it supports the other system components and provides the information to all components. Developing the inventory of the pavement network is one of the most important procedures in the implementation of an RMS. It must be well planned so that all data can be collected, used, and analyzed effectively in other components of the RMS. The level of detail of existing facilities in this process varies by the requirements of local government agencies. The proposed inventory should, at least, be able to answer these kinds of questions:
• What data needs to be collected • How the data will be used • How and when the data collection will be done
It is also imperative that in the proposed inventory program only necessary information be established to shorten the time and increase the cost-effectiveness of the data collection process. Data storage can be as simple as a card file, or data forms and system files can be designed and then gathered into computer applications depending on the size of the project and network. Another key element in building an RMS inventory is to determine how the network should be divided into segments, and the size and boundary of each segment. Followings are the definitions in the inventory program:
• Network: all paved and unpaved roads providing ground access. • Project: a section of roadway having similar age, geometry, and construction type. • Segment: a subdivision of a project. There may be one or more segments within a
project, such as city blocks. • Sample unit: a subdivision of a segment allowing detailed analysis and recording of
facility defects. It is commonly, though not always, a 100-foot portion of a segment. 4.1. Type of Segments The type of segments can be generally categorized into two groups:
• Static segment: the data such structure, environment exposure, traffic, etc., are uniform throughout its length.
• Dynamic segment: it requires different treatments for different portions due to inconstant characteristics of the data.
4.2. Referencing Methods Before the network can be divided into segments, a referencing method has to be selected. There are four basic referencing methods used to define pavement sections (Hass 1994). However, it would be the best to review the current method performed by local agencies so that the existing method versus the need of a new method can be determined. Those methods include the following:

18
• Route-milepost: The starting point of the route is defined and the consecutive number are attached on the mileposts along the length of the route to outline segments.
• Node-link: Intersections, boundaries, and points of change are usually used as nodes to delineate segments within the network.
• Branch-section: General features of the pavement network are defined as branches, and homogeneous units of the branches are defined as sections. It is developed by the Corps of Engineers.
• Geographic information system (GIS): Each characteristic of data is obtained from the network and then collected into computer applications. When any feature of the data is needed, the GIS will present sections based on that kind of data.
4.3. Defining the Facility Network into Segments The primary purpose of this task is to divide the whole network to segments so that uniform characteristic segments or similar maintenance actions used to treat those segments within the network may be grouped together. The boundary is primarily used to separate segments, not to define segments. Following are factors indicating the boundaries between segments. Factors indicating boundary: Manmade boundary:
• Change in number of traffic lanes • Roadway intersections • Change in pavement type • River or streams • Change in pavement structure • Bridges • Abrupt change in traffic volume or patterns • City or township limits • Change in drainage characteristics • County lines • Change in natural subgrade characteristics • Railroad crossings • Difference in previous construction projects • Pavement maintenance history
Once the boundary and referencing method are chosen, the entire network can be divided into segments. 4.4. Network Level versus Project Level The data collection process is time-consuming and expensive. Excessive data collection has created problems in implementation and in the continued use of an RMS. Before any data are collected, it is important to understand the differences between network and project level pavement management to define which level of detail is actually needed.
• Network level RMS: This level is related to program and policy issues for the entire network. The principal results of network level analysis include such maintenance and rehabilitation needs, funding needs, prioritized listings of sections needing repair, and forecasted future conditions for various funding options. In other words, the basic purpose of this level is normally related to the budget process. Therefore, a network level analysis will be of the most use and interest to the mayor, manager, budget director, etc.

19
• Project level RMS: More complete data must be collected on individual facilities, and identified by the network level analysis as primary candidates for maintenance or rehabilitation. The primary results of project level analysis include an assessment of the cause of deterioration, identification of possible design, and strategies planned for maintenance and rehabilitation actions. In other words, the basic purpose is to provide the best original design, maintenance or rehabilitation strategy possible for a selected facility for the funds available.


21
5. EVALUATION OF CURRENT CONDITION Once the pavement management level has been established, it is imperative that an appropriate method be used to obtain information from selected pavements so that the data can be analyzed and used effectively regarding objectives of a project. Several methods are currently used by local government agencies to evaluate the current pavement condition. Those methods can be normally categorized into four primary groups: (1) visual inspection rating, (2) nondestructive testing (NDT), (3) destructive testing, and (4) others. The uses and applications for each method are described below:
• Visual inspection rating: This evaluation method is most commonly used by local agencies. The data, such as distress types, severity level, and extent, are measured and collected to analyze the existing condition of pavements. Section 5.1, “Pavement Condition Rating by Visual Inspection,” gives the detailed procedure for this method.
• Nondestructive testing: This evaluation method is mainly used in the roadway design and for project level information to enhance the data collected through visual rating method. Some agencies may use NDT data for network as well as project level evaluation. An agency may use NDT to identify problems, examine their extent, and solve them effectively. The NDT methods have certain advantages, such as on-site information about physical properties of the pavement, no damage to the pavement, minimal laboratory tests, and timely and efficient data collection. Examples of NDT are plate bearing tests, curvature meter, Benkelman beam, and falling weight deflectometer.
• Destructive testing: This evaluation method is primarily used to support design analysis in identifying roadway makeup, analyze reasons the facility failure, and evaluate solutions for facility improvement. This test includes boring, coring, and laboratory testing.
• Others: In addition to the above classes of evaluation methods, other methods have been developed and used in the field such as ride quality, roughness, and skid resistance.
Some local government agencies may use more than one of these techniques to obtain data from selected pavements more accurately and to better fit their needs. 5.1. Pavement Condition Rating by Visual Inspection Visual inspection can be accomplished in two fundamental manners: (1) manual visual inspection and (2) automated visual inspection.
• Manual visual inspection is usually performed by one or two people either driving at a slow speed and stopping occasionally or walking through selected segments. These inspections can be performed depending on budget and level of detail in a proposed RMS. Apparently, walking provides more accurate and more detailed data than driving, but it is more expensive and time-consuming. In addition, the accuracy and consistency of the data also depend on the experience of the inspectors who perform the survey.
• Automated visual inspection is mainly performed by using vehicles and cameras, ultrasonic sensors, or laser technology with recording equipment to record pavement condition for further processing. The inspection of the pavement can be replayed and then

22
analyzed by a software program or inspectors. Current automated systems include the PASCO ROADRECON system developed by the PASCO Corporation, GERPHO System, Automatic Road Analyzer (ARAN), and Laser Road Surface Tester (RST) developed by the Swedish Road and Traffic Research Institute (Hass 1994).
Establishing a data form to store data is very helpful as that ensures that all information is obtained systematically and can be easily input to generate data for computer applications, if available. The form can be either a paper or computer form depending on the data collection location, size of project and network, and budget (Hass 1994). The examples of paper forms used in the data collection in the field are provided in Appendix B. The frequency of the inspection of pavement condition normally varies by local government agency. A two-year inspection interval is considered normal. However, our survey results described in Section 2 show that a one-year inspection interval of the current pavement condition is preferred by local government agencies. Figure 1 presents the flowchart showing broad tasks to achieve pavement condition evaluation. 5.2. Pavement Condition Index There are many indices currently used by local government agencies to determine the pavement condition and status at the time of data collection such as Present Serviceability Index (PSI), International Roughness Index (IRI), and Riding Quality. Pavement Condition Index (PCI) is another way to define the current condition of a pavement. PCI is defined as an index reflecting the composite effects of varying distress types, severity level, and extent upon the overall condition of pavement. PCI values range from 0 to 100, which are defined as failed and excellent condition, respectively. The PCI value is decreased by a cumulative deduct value score based upon the type, quantity, and severity level of distress and type of pavement. The mathematical expression for PCI is shown as follows:
PCI = 100 - Σ corrected deduct value (CDV) (1) The qualitative expressions in term of pavement quality associated with PCI are described in Figure 2. The types of distress are a strong indicator of pavement condition. There are several factors that combine to produce a particular type of distresses in both low-volume and built-up road pavements. These factors include pavement type, quality of material used to build the road, traffic volume, traffic load characteristics, and environmental exposure. In addition, these factors also influence the severity level, the extent, and the occurrence and frequency of the distress. Consequently, from the viewpoint of assessing pavement performance, it is essential that different values of rating be assigned to different types of distress as well as to distress severity levels and extent.

23
Figure 1. Condition Evaluation Flow Chart
Proje c t Leve l- Treatment Option
Ne twork Le ve l- Planning- Programming- Policy Decisions
- What data to collect- What decisions are going to be made - What data is necessary to make these decisions- Site or number of facilities- Type and characteristics of agency- Required accuracy of data- Required fequency of data collection- Database capabiities
Esta blish Prioritie s- Functional Classfication- Risk Level
Se lec t Surve y Te a m- In- house- Training- Consultant- Select Form
Se le c t Sa mple S ite
Da ta Collec tion Freque nc y- Traffic- Agency Resources
Cost/ Be ne fit of Da ta Colle c tion
S ta rt Condition Surve y
Ente r Da ta in Da ta ba se
END
Condition Surve y- Distress Type- Extent- Severity Level
Condition Surve y Me thod/ Te c hnique
Resourc e Re quire me nts- Staff- Cost- Equipment
Le ve l of Da ta Colle c tion
Condition Eva lua tion
Condition Polic ies/ Guide line s/ Objec tive s
Environme nta l Fa c tor:- Drainage- Traffic- Functional Classification
Ma intena nc e History
Ma te ria l- Age- Plan- Design Details
Se gme nt Ide ntific a tion
Ide ntify impa c t on:- Safety- Risk Level- Cost- Political
Struc tura l P roble mYe sNo

24
PCI100
85
70
55
40
25
10
0
Excellent: Normal maintenance needed with perfect phisycal condition, and well above current standards
Very Good: Preventive maintenance needed and meets current standards
Good: Routine and preventive maintenance needed, meets standards with minor defects and acceptable physical condition
Fair: Minor rehabilitation needed to return to acceptable Level of Service (LOS)
Poor: Major rehabilitation needed
Very Poor: Reconstruction, significant renewal, and upgrade needed, asset barely serviceable
Fail: Replacement
Figure 2. Qualitative Expression in Terms of Pavement Quality Associated with PCI The key to a successful evaluation is to identify the different types and severity levels of pavement distresses for each type of pavement such that the actual condition of the pavement is defined and applied to calculate PCI. Appendix C presents several distress types and severity levels for low-volume flexible and built-up road pavements. After the distress types, severity, and extent on the pavement are determined, the information may be then used to compute the deduct value of the concerned pavement. The deduct value for each type of pavement and distress is obtained separately at low, medium, and high severity levels, from the deduct value curves provided in Appendix D for the observed pavement density of distress. These deduct value curves have been derived from practical experience and engineering judgment and may change with more experience. The summation of deduct value from different severity levels for each type of distress is computed, and if there is more than one type of distress on selected pavements, the summation of all deduct values must be computed. In addition, if the summation of all deduct values is greater than 100, which is the highest score that PCI can have, the summation of all deduct values must be adjusted by using the corrected deduct value curve, given in Appendix E. After the deduct value is corrected from the curves, it is then applied in Equation 1 to determine the PCI of the evaluated segment. The flowchart presenting the procedure to calculate PCI is shown in Figure 3. Once the PCI is determined indicating the current pavement condition, then agencies should be able to decide what strategy would be best suited to maintain or improve the pavement condition such as content and type of maintenance, rehabilitation, or reconstruction actions.
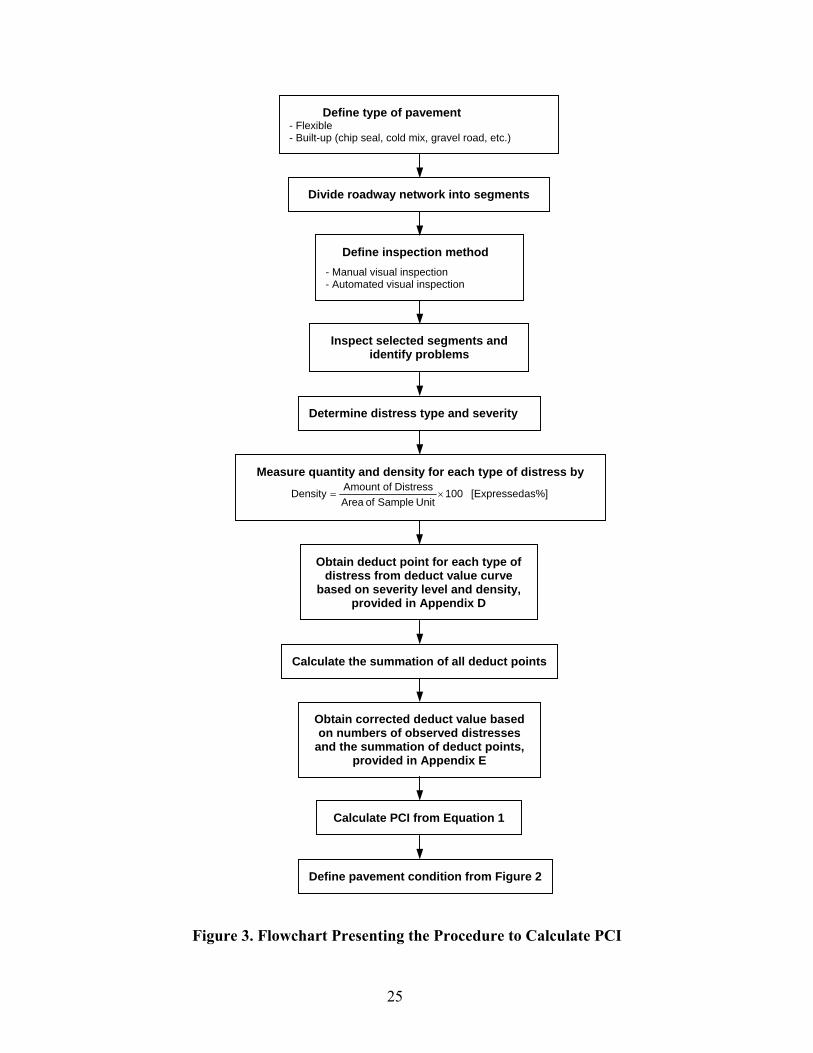
25
Figure 3. Flowchart Presenting the Procedure to Calculate PCI
Measure quantity and density for each type of distress by
as%][Expressed 100Unit Sample of Area
Distress of AmountDensity ×=
Inspect selected segments and identify problems
Define type of pavement- Flexible - Built-up (chip seal, cold mix, gravel road, etc.)
Determine distress type and severity
Define inspection method- Manual visual inspection - Automated visual inspection
Divide roadway network into segments
Obtain deduct point for each type of distress from deduct value curve
based on severity level and density, provided in Appendix D
Calculate the summation of all deduct points
Obtain corrected deduct value based on numbers of observed distresses
and the summation of deduct points, provided in Appendix E
Calculate PCI from Equation 1
Define pavement condition from Figure 2


27
6. INTEGRATION OF RMS WITH GEOGRAPHICAL INFORMATION SYSTEMS For long-term successful use of an RMS, it is significant that the data as well as the new pavement management technology be kept up-to-date. This section briefly reviews a sampling of new technologies that are beginning to impact the way agencies go about asset management such as geographic information system (GIS), the integration of a RMS with other management systems, and the approach to establishing central database. The linking of roadway management systems to maps of the roadway network is due in part to the fact that it is often much easier to communicate some types of information about the road system using maps. In particular, these maps provide a way to display information that is easily understood by management, elected officials, and the public. Some advantages from the integration of RMS with GIS are listed below:
• Ability to analyze pavement management data based upon geographical location • Ability to display results of database queries and asset management analyses on a map of
the roadway network • Ability to view asset conditions and projected work programs on a map of the roadway
network • Ability to view asset conditions across other geo-referenced information such as traffic,
neighborhood soil conditions, and zoning 6.1. Systems Displaying RMS Information on Maps There are two basic options available for agencies to display RMS information on maps:
• Automated mapping software, such as the computer application AutoCAD, may be used by developing an interface to the RMS database. This method is relatively inexpensive and simple. It provides the user with the ability to display RMS data on a road network map but little support for the analysis of data. It can also become cumbersome and time-consuming to maintain this type of system.
• Geographic information systems such as computerized data management systems that provide the ability to rapidly acquire, store, and access spatially referenced information. Combining RMS and GIS software takes advantage of the strengths of each, linking time-dependent pavement data with geographic or location-based data.
6.2. Components of GIS There are a number of commercially available GIS software packages; however, the basic structure of a GIS remains the same from program to program:
• Geographical database contains data that define the physical location of features, such as a segment of road.
• Attribute database contains the non-geographical data, such as segment names and facility age describing a geographical feature.

28
• Geo-relational data structure links the location and attributes data. The link will establish the relationship between the location of features in the geographical database and their corresponding descriptions in the attribute database. While the attributes may change frequently, such as every time a pavement is overlaid, the location information should not.
6.3. Approach to Establishing a Central Database One approach to establishing the central database is using GIS as the platform. Since many utilities, such as water, sewer, telephone, and cable, often occupy the same physical right-of-way as streets, a GIS would provide an excellent basis for integrating the systems. It is important for government agencies to make sure that their existing separate infrastructure management systems can transfer information to one another when needed either by linking systems in some way or by using conversion tables between systems. New technology with possible applications to asset management becomes available everyday. It is the maintenance manager’s responsibility to keep abreast of new testing methods, equipment, or software that could improve the asset management process. Excellent ways to monitor new technology include reading technical publications, attending conferences and workshops, and self-study.

29
7. GENERATING STRATEGIES AND ALTERNATIVES FOR MAINTENANCE, REHABILITATION, AND RECONSTRUCTION (MR&R) ACTIONS Strategic RMS is the process of establishing long-range and short-range maintenance improvement goals and defining the approach to meet those goals. Maintenance can be defined as both preventive and corrective. Basically, maintenance consists of a set of activities directed toward keeping pavement in a serviceable state. The recommended alternative strategies for the pavement are based upon the pavement defect rating, pavement riding quality, pavement thickness design criteria, roadway traffic volume and truck percentage, and roadway functional classification. The basis for selecting the strategy also depends on the magnitude of the problem and the availability of resources. More factors affecting maintenance action selection include level of concern, traffic level and characteristics, soil classification, cost of action, and available budget. In addition, the overall rating, actual distresses and their causes, and performance of pavements over time should be analyzed to determine the most appropriate strategy to improve the roadway network. A comprehensive approach to road management requires the development and use of maintenance, rehabilitation, and reconstruction strategies, in order to effectively maintain the roadway network. These MR&R strategies, when combined with specific road condition information such as pavement condition survey, pavement riding quality, and functional classification, lead to specific MR&R actions. There are five basic strategies used by most government agencies for MR&R actions:
• Routine maintenance requires roadway maintenance in proper operational condition and a relatively high pavement performance level. To prevent the growth of severity level of deficiency from small defects, routine maintenance must be performed on a schedule. The funds should be generated for routine maintenance each year.
• Preventive maintenance is designed to correct deterioration before developing into a serious problem. It is intended for pavements that are already in reasonably good condition. Preventive maintenance should be programmed systematically into the budget.
• Deferred action is applicable when the pavement condition has deteriorated to the point that routine and preventive maintenance is no longer cost-effective but there is no need of major rehabilitation.
• Rehabilitation refers to extensive corrective actions to repair a facility that has deteriorated passed a condition that cannot be corrected through routine or preventive maintenance. Treatments are applied to return the facility to a condition similar to its original condition. This may increase its structural capacity.
• Reconstruction may be done in those cases where the roadbed foundation or bridge condition has failed, or when improvements in alignment, drainage, or widening have become necessary, or maintenance is not cost-effective, a full reconstruction or replacement is undertaken.
In practice, we can decide which strategy should be applied based on evaluated PCI of the pavement within a roadway network. Without any maintenance action, the pavement performance, indicated by PCI, decreases every year. The range indicating each level of service associated with PCI is established so that the need for maintenances, type of need, and time can

30
Level of Service A
Level of Service B
Level of Service C
Level of Service D
Level of Service E
Level of Service F
Routine Maintenance
Preventive Maintenance
Rehabilitation
Major Rehabilitation or Deferred Action
Reconstruction
10 0
9 0
8 0
7 0
6 0
5 0
4 0
3 0
2 0
10
0
PCI
Year
be then determined based upon PCI value only. The range for each level of service and types of needed maintenance actions are provided in Figure 4. Following are the definitions describing each level of service:
• Level of Service A: A pavement is in relatively excellent condition. It needs routine
maintenance to arrest early signs of deterioration and to extend the pavement life. Pavement may have localized deterioration and low-severity hair cracking.
• Level of Service B: A pavement is in very good condition. It needs preventive maintenance to arrest early signs of deterioration and to prevent the development of more serious pavement problems.
• Level of Service C: A pavement is in somewhat good condition. It needs routine and preventive maintenance to maintain a relatively good performance level. The pavement is starting to deteriorate and is approaching a critical PCI.
• Level of Service D: A pavement is in fair condition, continuing to deteriorate and starts suffering a reduction in performance levels. Beyond this level, the rate of pavement deterioration and the cost of repair increase significantly. This level represents a critical pavement condition.
• Level of Service E: A pavement is in poor condition. It has deteriorated so much such that preventive and rehabilitation maintenances are no longer cost-effective. The pavement suffers a major reduction in performance level. It may be kept in this level until budgets permit specific action.
• Level of Service F: A pavement is in failed condition. Major reconstruction or replacement is needed.
Figure 4. Maintenance Activity and Time for Each Level of Service Based on PCI

31
Once the type of maintenance is selected by local government agencies, the feasible actions for maintenance or rehabilitation can be applied subsequently based upon pavement types and types of maintenance actions. Figures 5, 6, 7, and 8 represent typical maintenance and rehabilitation feasible actions for flexible, chip seal, cold mix, and aggregate surface roads, respectively. The selection of repair strategies can be achieved in many ways such as performing economic analysis to providing cost information and the basis for making a management decision, or decisions based on past experiences. Another method to generate repair strategies to the roadway network is the use of information collected previously. Similar to the deduct curves, this method has been based on practical experience and engineering judgment and may change with more experience. The strategy keys, level of concerns, and other values needed in the flow charts are provided in Appendix F for different pavement types. The distress types, severity level, and extent determined earlier from concerned segments are used in these flow charts to provide appropriate maintenance and repair alternatives to local government agencies. The combination of basic strategies and repairing alternatives will guide local government agencies to efficiently improve the pavement performance of the roadway network. In other words, the broad MR&R strategy needed for the roadway network is first determined based upon only the current PCI of pavements, and then the details to repair pavement segments are generated depending on distress type, severity level, extent, and type of pavement. Therefore, local agencies are able to roughly prepare or plan their budget at both the project and network level.

TYPI
CA
L M
AIN
TEN
AN
CE
AN
D R
EHA
BIL
ITA
TIO
N F
EASI
BLE
AC
TIO
NS
FOR
FLE
XIB
LE P
AVE
MEN
T
Figu
re 5
. Typ
ical
Mai
nten
ance
and
Reh
abili
tatio
n Fe
asib
le A
ctio
ns fo
r Fl
exib
le P
avem
ent
- D
o no
thin
g-
Fog
seal
- S
and
seal
- C
rack
sea
ling
- S
kin
patc
hing
with
col
d m
ix-
Ski
n pa
tchi
ng w
ith h
ot m
ix-
Loca
l rep
airs
- A
pply
roll s
and
- R
emov
e ex
cess
chi
p
- S
lurry
sea
l-
Thin
ove
rlay
- C
hip
seal
- P
artia
l pat
chin
g-
Full-
dept
h pa
tchi
ng-
Par
tial-
dept
h jo
int r
epai
r-
Cra
ckin
g fil
ling
- M
illing
plu
s do
uble
chi
p se
al-
Sur
face
sea
ling
- A
pply
sin
gle
chip
sea
l-
App
ly h
eat a
nd ro
ll san
d-
Hot
sla
g sc
reen
ing
- A
pply
hea
t and
roll s
and
plus
dou
ble
c
hip
seal
ove
rlay
- A
pply
hea
t and
roll s
and
- M
ajor
cra
ck s
ealin
g-
Ditc
h C
lean
ing
- C
old
milli
ng-
Full-
dept
h jo
int r
epai
r
- P
artia
l-de
pth
join
t rep
air
- M
illing
-
Act
ions
from
pre
viou
s st
rate
gies
a
s n
eces
sary
- 2"
A.C
. ove
rlay
with
pat
chin
g-
2" A
.C. o
verla
y w
ith p
atch
ing
and
fabr
ic in
terla
y-
Rem
ove
and
repl
ace
A.C
. in
dis
tress
ed a
reas
- C
old
milli
ng-
Col
d m
illing
with
1 1/
2" -
2" o
verla
y-
Col
d m
illing
2" a
nd re
plac
e w
ith 3
" A
.C. o
verla
y-
Col
d m
illing
2" a
nd re
plac
e w
ith 2
" A
.C. o
verla
y-
Full-
dept
h jo
int r
epai
r-
Milli
ng p
lus
2" c
old
mix
ove
rlay
- M
illing
plu
s 2"
hot
mix
ove
rlay
- 2"
Rec
ycle
plu
s 2"
col
d m
ix o
verla
y-
4" R
ecyc
le p
lus
3" c
old
mix
ove
rlay
- R
ecyc
le p
lus
add
roll s
and
plus
d
oubl
e ch
ip s
eal o
verla
y -
App
ly ro
ll san
d pl
us 2
" col
d m
ix
ove
rlay
- R
emov
e an
d re
plac
e en
tire
blee
ding
a
rea
with
2" c
old
or h
ot m
ix a
spha
lt-
App
ly ro
ll san
d pl
us 2
" asp
halti
c c
oncr
ete
over
lay
- A
pply
dou
ble
chip
sea
l-
Full-
dept
h pa
tchi
ng-
2 1/
2" a
spha
ltic
conc
rete
ove
rlay
- M
illing
plu
s 4"
asp
halti
c co
ncre
te
ove
rlay
- A
pply
roll s
and
+ 1 1
/2" o
verla
y-
Rec
ycle
and
reco
mpa
ctio
n +
4" h
ot
mix
ove
rlay
- 4"
asp
halti
c co
ncre
te o
verla
y-
Sta
biliz
atio
n
- 8"
Rec
ycle
plu
s ad
d 1 1
/2" n
ew
agr
egat
e pl
us 1
gal.
oil p
lus
4" A
.C.
ove
rlay
- 8"
Rec
ycle
with
fly
ash
plus
4" A
.C.
ove
rlay
- 8"
Rec
ycle
with
cem
ent a
sh p
lus
4"
A.C
. ove
rlay
- 8"
Rec
ycle
plu
s ad
ditio
n of
2" o
r m
ore
aggr
egat
e-
Rem
oval
and
repl
acem
ent o
f ent
ire
pav
emen
t stru
ctur
e-
Geo
met
ric a
nd s
afet
y im
prov
emen
ts
if n
eces
sary
-
Bas
ic a
nd s
ubgr
ade
stab
ilizat
ion
Eval
uate
Pav
emen
t Con
ditio
n In
dex
and
Det
erm
ine
The
Stra
tegy
Pro
gram
Bas
ed o
n PC
I
Rou
ntin
e M
aint
enan
ceR
econ
stru
ctio
nR
ehab
ilita
tion
Def
erre
d Ac
tion
Prev
entiv
e M
aint
enan
ce
32
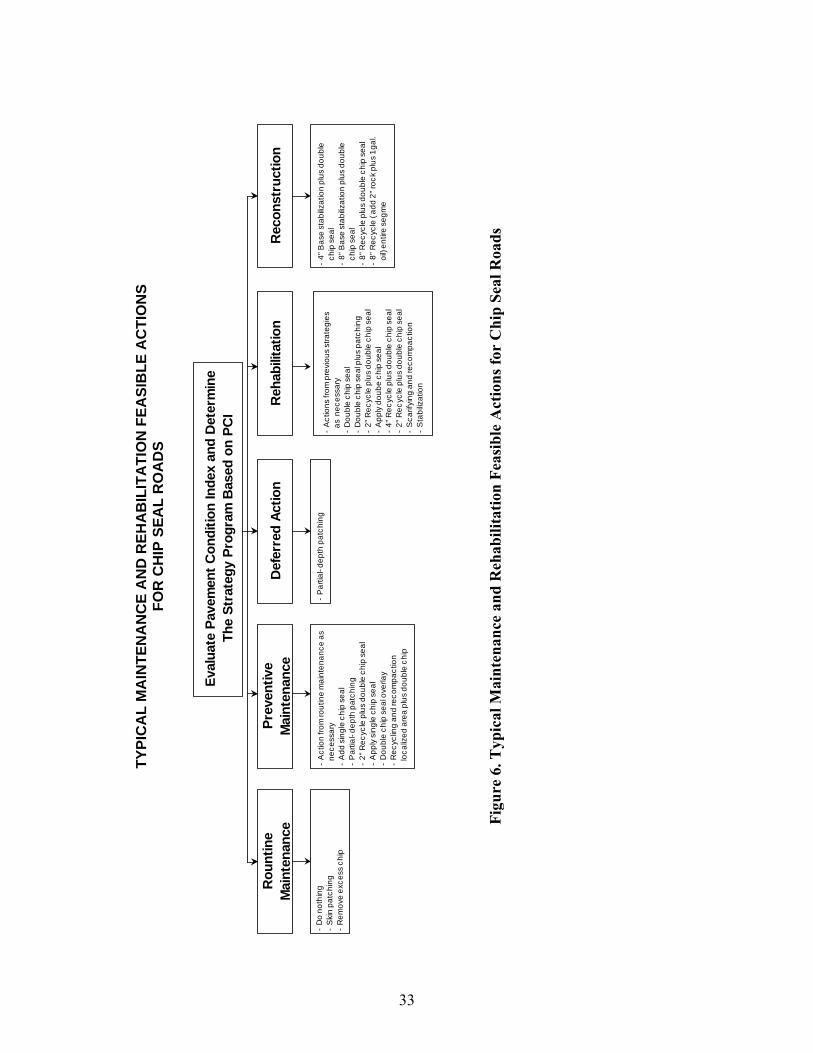
TY
PIC
AL
MA
INTE
NA
NC
E A
ND
REH
AB
ILIT
ATI
ON
FEA
SIB
LE A
CTI
ON
S FO
R C
HIP
SEA
L R
OA
DS
Fi
gure
6. T
ypic
al M
aint
enan
ce a
nd R
ehab
ilita
tion
Feas
ible
Act
ions
for
Chi
p Se
al R
oads
- D
o no
thin
g-
Ski
n pa
tchi
ng-
Rem
ove
exce
ss c
hip
- A
ctio
n fro
m ro
utin
e m
aint
enan
ce a
s n
eces
sary
- A
dd s
ingl
e ch
ip s
eal
- P
artia
l-de
pth
patc
hing
- 2"
Rec
ycle
plu
s do
uble
chi
p se
al-
App
ly s
ingl
e ch
ip s
eal
- D
oubl
e ch
ip s
eal o
verla
y-
Rec
yclin
g an
d re
com
pact
ion
loc
aliz
ed a
rea
plus
dou
ble
chip
- P
artia
l-de
pth
patc
hing
- A
ctio
ns fr
om p
revi
ous
stra
tegi
es
as
nec
essa
ry-
Dou
ble
chip
sea
l-
Dou
ble
chip
sea
l plu
s pa
tchi
ng-
2" R
ecyc
le p
lus
doub
le c
hip
seal
- A
pply
dou
be c
hip
seal
- 4"
Rec
ycle
plu
s do
uble
chi
p se
al-
2" R
ecyc
le p
lus
doub
le c
hip
seal
- S
carif
ying
and
reco
mpa
ctio
n-
Sta
biliz
atio
n
- 4"
Bas
e st
abiliz
atio
n pl
us d
oubl
e c
hip
seal
- 8"
Bas
e st
abiliz
atio
n pl
us d
oubl
e c
hip
seal
- 8"
Rec
ycle
plu
s do
uble
chi
p se
al-
8" R
ecyc
le (
add
2" ro
ck p
lus
1 gal
. o
il) e
ntire
seg
me
Eval
uate
Pav
emen
t Con
ditio
n In
dex
and
Det
erm
ine
The
Stra
tegy
Pro
gram
Bas
ed o
n PC
I
Rou
ntin
e M
aint
enan
ceR
econ
stru
ctio
nR
ehab
ilita
tion
Def
erre
d Ac
tion
Prev
entiv
e M
aint
enan
ce
33

TY
PIC
AL
MA
INTE
NA
NC
E A
ND
REH
AB
ILIT
ATI
ON
FEA
SIB
LE A
CTI
ON
S FO
R C
OLD
MIX
RO
AD
S
Figu
re 7
. Typ
ical
Mai
nten
ance
and
Reh
abili
tatio
n Fe
asib
le A
ctio
ns fo
r C
old
Mix
Roa
ds
- D
o no
thin
g-
Ski
n pa
tchi
ng-
San
d se
al-
Loca
l rep
airs
- A
pply
roll s
and
- A
ctio
n fro
m ro
utin
e m
aint
enan
ce a
s n
ecce
ssar
y-
Par
tial-
dept
h pa
tchi
ng-
Chi
p se
al (T
hin
over
lay)
- Fo
g se
al-
San
d se
al-
Ski
n pa
tchi
ng w
ith c
old
mix
- S
kin
patc
hing
with
hot
mix
- A
pply
hea
t and
roll s
and
- H
ot s
lag
scre
enin
g-
App
ly h
eat a
nd ro
ll san
d pl
us d
oubl
e
chi
p se
al o
verla
y-
Sur
face
sea
ling
- D
oubl
e sl
urry
sea
l-
Thin
ove
rlay
(AC
)-
Col
d m
illing
- P
artia
l-de
pth
join
t rep
air
- Fu
ll-de
pth
join
t rep
air
- D
itch
Cle
anin
g
- P
artia
l-de
pth
patc
hing
- Fu
ll-de
pth
patc
hing
- D
oubl
e ch
ip s
eal
- M
illing
plu
s 2"
col
d m
ix o
verla
y-
Milli
ng p
lus
2" h
ot m
ix o
verla
y-
2" R
ecyc
le p
lus
2" c
old
mix
ove
rlay
- 4"
Rec
ycle
plu
s 2"
col
d m
ix o
verla
y-
4" R
ecyc
le p
lus
3" c
old
mix
ove
rlay
- R
ecyc
le p
lus
add
roll s
and
plus
d
oubl
e ch
ip s
eal o
verla
y -
App
ly ro
ll san
d pl
us 2
" col
d m
ix
ove
rlay
- R
emov
e an
d re
plac
e en
tire
blee
ding
a
rea
with
2" c
old
or h
ot m
ix a
spha
lt-
App
ly ro
ll san
d pl
us 2
" asp
halti
c c
oncr
ete
over
lay
- 2"
Col
d m
ix o
verla
y-
3" C
old
mix
ove
rlay
- 1"
Col
d m
illing
plu
s 3"
col
d m
ix o
verla
y-
Rem
ove
and
repl
ace
A.C
. in
dis
tress
ed a
reas
- C
old
milli
ng w
ith 1
1/2"
- 2
" ove
rlay
- C
old
milli
ng 2
" and
repl
ace
with
3"
A.C
. ove
rlay
- M
ix c
old
milli
ng 2
" and
repl
ace
with
2"
A.C
. ove
rlay
- A
pply
roll s
and
plus
1 1/
2" o
verla
y
- 8"
Rec
ycle
plu
s 4"
A.C
. ove
rlay
- 8"
Rec
ycle
plu
s 2"
A.C
. ove
rlay
- 8"
Rec
ycle
plu
s ad
d 1 1
/2" n
ew
agr
egat
e pl
us 1
gal.
oil p
lus
4" A
.C.
ove
rlay
- 8"
Rec
ycle
with
fly
ash
plus
4" A
.C.
ove
rlay
- 8"
Rec
ycle
with
cem
ent a
sh p
lus
4"
A.C
. ove
rlay
- 8"
Rec
ycle
plu
s 3"
col
d m
ix o
verla
y-
8" R
ecyc
le p
lus
4" c
old
mix
ove
rlay
- R
ecyc
le s
urfa
ce a
nd b
ase
plus
2"
col
d m
ix o
verla
y-
Rem
oval
and
repl
acem
ent o
f ent
ire
pav
emen
t stru
ctur
e-
Geo
met
ric a
nd s
afet
y im
prov
emen
ts
if n
eces
sary
-
Bas
ic a
nd s
ubgr
ade
stab
ilizat
ion
Eval
uate
Pav
emen
t Con
ditio
n In
dex
and
Det
erm
ine
The
Stra
tegy
Pro
gram
Bas
ed o
n PC
I
Rou
ntin
e M
aint
enan
ceR
econ
stru
ctio
nR
ehab
ilita
tion
Def
erre
d Ac
tion
Prev
entiv
e M
aint
enan
ce
34

TY
PIC
AL
MA
INTE
NA
NC
E A
ND
REH
AB
ILIT
ATI
ON
FEA
SIB
LE A
CTI
ON
S FO
R A
GG
REG
ATE
SU
RFA
CE
RO
AD
S
Figu
re 8
. Typ
ical
Mai
nten
ance
and
Reh
abili
tatio
n Fe
asib
le A
ctio
ns fo
r A
ggre
gate
Sur
face
Roa
ds
- D
o no
thin
g-
Bla
ding
- S
kin
patc
hing
- D
ust c
ontro
l act
iviti
es-
Spo
t reg
rave
ling
- R
eshe
etin
g
- D
itch
Cle
anin
g-
Loca
l rep
airs
- D
ust c
ontro
l act
iviti
es-
Spo
t agg
rega
te a
dditi
on a
nd b
ladi
ng-
Par
tial-
dept
h pa
tchi
ng-
Full-
dept
h pa
tchi
ng p
lus
subg
rade
s
tabi
lizat
ion
- S
pot r
egra
velin
g-
Res
heet
ing
- A
dd A
B3
- B
ladi
ng-
Par
tial-
dept
h pa
tchi
ng-
Act
ions
from
pre
viou
s st
rate
gies
as
nec
essa
ry-
Sca
rifyi
ng a
nd re
com
pact
ion
- S
tabi
lizat
ion
- S
truct
ural
add
ition
of a
ggre
gate
(2"
or m
ore)
and
bla
ding
- Fu
ll-de
pth
patc
hing
- 4"
Rec
ycle
plu
s ch
ip s
eal s
urfa
ce-
New
gra
nula
r pav
emen
t with
sur
face
t
reat
men
t-
New
gra
nula
r pav
emen
t with
chi
p s
eal s
urfa
ce-
New
gra
nula
r pav
emen
t with
col
d m
ix
sur
face
- S
pot a
ggre
gate
add
ing
- 8"
Rec
ycle
plu
s do
uble
chi
p se
al-
8" B
ase
stab
ilizat
ion
plus
4" h
ot m
ix
ove
rlay
- 4"
Rec
ycle
plu
s ad
ditio
n of
2" o
r m
ore
aggr
egat
e -
8" R
ecyc
le p
lus
addi
tion
of 2
" or
mor
e ag
greg
ate
- 8"
Rec
ycle
plu
s ad
d 3
gal.
oil p
lus
2"
cle
an ro
ck p
lus
doub
le c
hip
seal
s
urfa
ce
- B
asic
and
sub
grad
e st
abiliz
atio
n
Eval
uate
Pav
emen
t Con
ditio
n In
dex
and
Det
erm
ine
The
Stra
tegy
Pro
gram
Bas
ed o
n PC
I
Rou
ntin
e M
aint
enan
ceR
econ
stru
ctio
nR
ehab
ilita
tion
Def
erre
d Ac
tion
Prev
entiv
e M
aint
enan
ce
35


37
8. PAVEMENT PERFORMANCE PREDICTION MODEL All guidelines stated earlier provide local government agencies the information, such as the current pavement condition and the method to generate MR&R actions. Based on that information, the agencies can decide the maintenance or improvement needs for the pavements according to their budgets at the present time. However, the future tasks and MR&R actions needed for the roadway network cannot be established without a pavement performance prediction model. Pavement performance prediction is one of essential components of an RMS because it forecasts the pavement condition such that maintenance and rehabilitation strategies, schedules, and budgets can be well planned ahead of time. The prediction model is principally developed based on PCI values previously collected from the roadway network with the view of coordinating with other components of an RMS such as the inventory methods, data collection and analysis process, and MR&R strategies established earlier. Actual PCI values may be observed from the roadway network for (1) different pavement types and (2) maintenance strategies applied on those segments. A deterioration curve may then be plotted based on the collected data between PCI value and pavement age in years starting from the most recent rehabilitation date or original construction date for a new pavement. Appendix G gives deterioration curves based upon the data collected from the field for pavements subjected to a variety of maintenance actions. We see from these deterioration curves that although different maintenance actions have similar overall deterioration behavior, the rate of deterioration varies significantly. These field measured deterioration curves may be utilized to obtain a pavement performance prediction model by developing a mathematical relation for the pavement deterioration behavior. This pavement performance prediction model may then be used to forecast the PCI value of pavement in the future based upon the previous information. Based upon the shape of measured deterioration curves shown in Appendix G, a general expression for the curve for pavement performance prediction may be expressed as follows:
),,( 21 AgeKKfAPCI −= (2)
where A = constant number PCI = pavement condition index of the concerned segments K1 and K2 = constants dependent upon the maintenance strategies applied on
the roadway network Age = pavement age in years
The parameters K1 and K2 of the prediction model may be experimentally established by plotting the constant number, A, deducted by the PCI values, (A – PCI), on the logarithmic scale, y-axis, and pavement age in years on the normal scale, x-axis. Constant number, A, is arbitrarily assumed and compared for best results. The results from the tests show that the higher A-value gives the lesser value of the squared correlation coefficient (R2). In other words, the higher number of A provides more errors to the pavement performance prediction model. The best value for constant number, A, based on the results from the test, is 105.
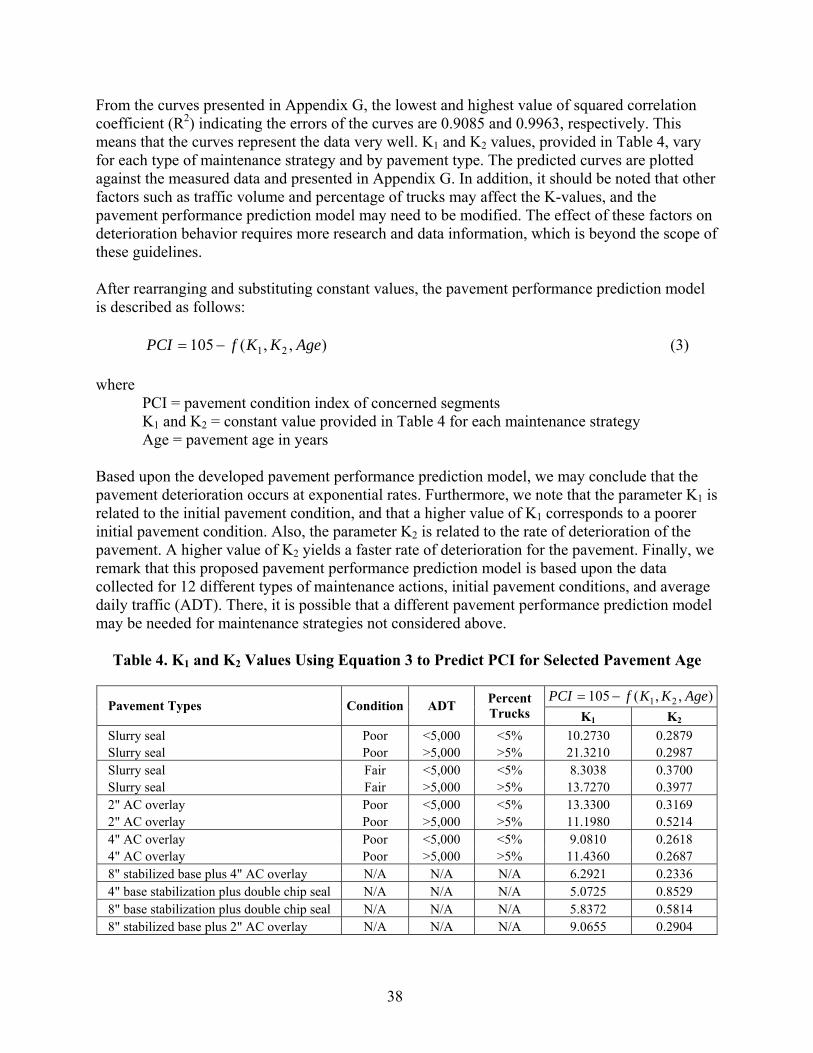
38
From the curves presented in Appendix G, the lowest and highest value of squared correlation coefficient (R2) indicating the errors of the curves are 0.9085 and 0.9963, respectively. This means that the curves represent the data very well. K1 and K2 values, provided in Table 4, vary for each type of maintenance strategy and by pavement type. The predicted curves are plotted against the measured data and presented in Appendix G. In addition, it should be noted that other factors such as traffic volume and percentage of trucks may affect the K-values, and the pavement performance prediction model may need to be modified. The effect of these factors on deterioration behavior requires more research and data information, which is beyond the scope of these guidelines. After rearranging and substituting constant values, the pavement performance prediction model is described as follows:
),,(105 21 AgeKKfPCI −= (3) where
PCI = pavement condition index of concerned segments K1 and K2 = constant value provided in Table 4 for each maintenance strategy Age = pavement age in years
Based upon the developed pavement performance prediction model, we may conclude that the pavement deterioration occurs at exponential rates. Furthermore, we note that the parameter K1 is related to the initial pavement condition, and that a higher value of K1 corresponds to a poorer initial pavement condition. Also, the parameter K2 is related to the rate of deterioration of the pavement. A higher value of K2 yields a faster rate of deterioration for the pavement. Finally, we remark that this proposed pavement performance prediction model is based upon the data collected for 12 different types of maintenance actions, initial pavement conditions, and average daily traffic (ADT). There, it is possible that a different pavement performance prediction model may be needed for maintenance strategies not considered above.
Table 4. K1 and K2 Values Using Equation 3 to Predict PCI for Selected Pavement Age
),,(105 21 AgeKKfPCI −=Pavement Types Condition ADT Percent
Trucks K1 K2 Slurry seal Poor <5,000 <5% 10.2730 0.2879 Slurry seal Poor >5,000 >5% 21.3210 0.2987 Slurry seal Fair <5,000 <5% 8.3038 0.3700 Slurry seal Fair >5,000 >5% 13.7270 0.3977 2" AC overlay Poor <5,000 <5% 13.3300 0.3169 2" AC overlay Poor >5,000 >5% 11.1980 0.5214 4" AC overlay Poor <5,000 <5% 9.0810 0.2618 4" AC overlay Poor >5,000 >5% 11.4360 0.2687 8" stabilized base plus 4" AC overlay N/A N/A N/A 6.2921 0.2336 4" base stabilization plus double chip seal N/A N/A N/A 5.0725 0.8529 8" base stabilization plus double chip seal N/A N/A N/A 5.8372 0.5814 8" stabilized base plus 2" AC overlay N/A N/A N/A 9.0655 0.2904

39
From the viewpoint of predicting pavement performance, Equation 3 may be utilized to estimate the PCI of a pavement at a selected time. Table 5 gives examples of the comparison between the actual field measured PCI and the PCI predicted using Equation 3 for two cases. An encouraging comparison is obtained between the predicted values and the measured values; however, in some cases the predicted values indicate a different qualitative pavement condition, described in Figure 2, as opposed to that indicated by the measured value.
Table 5. Examples of the Comparison between Actual PCI and Predicted PCI
Type of Pavement Pavement Age Actual PCI Predicted PCI from Equation 2
0 95 94.73 1 92 91.30 2 86 86.73 3 80 80.63 4 71 72.50 5 59 61.66 6 50 47.20
Slurry seal Poor condition <5000 ADT <5% trucks
7 31 27.92 0 85 83.68 1 75 76.25 2 64 66.25 3 52 52.76
Slurry seal Poor condition >5000 ADT >5% trucks
4 38 34.58 Once the forecasted PCI is computed based upon the pavement performance prediction model, the agencies could efficiently plan what maintenance strategy and repair action they should apply to the roadway network in the future. Also, the schedule to perform those actions as well as the funding needs may possibly be generated for the roadway network every year at all project levels.


41
9. LIFE CYCLE COST ANALYSIS A major goal of any road agency is to use public funds to provide safe, comfortable roads with the greatest possible economy. This process requires balancing priorities and making difficult decisions to manage pavements efficiently. The selection analysis of the best strategy, which provides longer service life with lower cost, involves the following considerations:
• Information such as detailed unit costs, condition ratings, service level, and maintenance cost for each feasible alternative strategy for the project under consideration that may be used to determine an overall cost of the strategy.
• Detailed calculations of costs and benefits associated with each alternative strategy over the analysis period, discounted to present worth. These calculations require predictions of the expected performance of the pavement under each strategy and estimates of increased maintenance and user costs associated with the deterioration of the pavement.
• Means of comparing several feasible construction or rehabilitation alternatives to select the best strategy for maximizing total benefits or minimizing total costs over an analysis period.
As a result of this selection analysis, a recommended action strategy may be developed for the project. This action strategy may include annual reconstruction needs, rehabilitation needs, routine and preventive maintenance needs, and anticipated strategy performance. The economic evaluation of a maintenance strategy will include costs of providing that alternative to agencies in terms of materials, construction, maintenance, and the cost savings (salvage value) of the existing base material when it can be recycled. These are then incorporated into an economic model to determine total costs and benefits. Economic analysis can be performed in many forms such as decision criteria and constraints, decision criteria and selection, pavement maintenance and rehabilitation cost, and life cycle cost analysis. The life cycle cost analysis is designed for low-volume to medium-volume roads including flexible, built-up, and gravel roads, and it will be discussed in this section. Some of the terms involved in the analysis are described below:
• Analysis period depends upon the pavement type, the roadway functional classification, and the traffic volume. The analysis period should extend over the expected service life of the improvement for each type of pavement. In general, for low-volume roads, analysis periods in the range of 7 to 15 years are reasonable.
• Discount rate is used to combine future costs with initial costs, or to reduce future expected costs to present terms. It provides the means to compare alternative uses of funds. A single discount rate between 3 and 7 percent has been used for economic evaluation of low-volume roads.
• Salvage value is a significant factor involving the value of reusable materials at the end of the design period. Most of the low-volume road’s pavement surface and base can be recycled by reworking or reprocessing and be used as a base material for new pavement. Salvage value can be represented as a percentage of the original cost or as an estimate of the benefit remaining due to previous improvements.
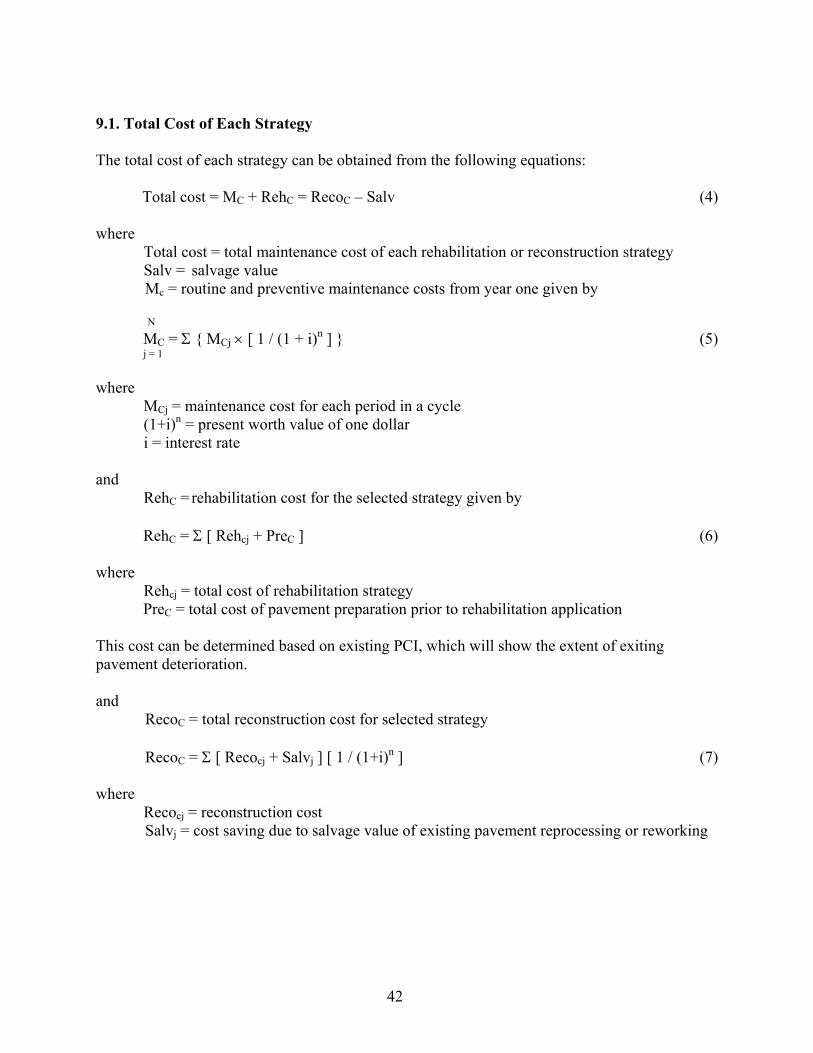
42
9.1. Total Cost of Each Strategy The total cost of each strategy can be obtained from the following equations:
Total cost = MC + RehC = RecoC – Salv (4) where
Total cost = total maintenance cost of each rehabilitation or reconstruction strategy Salv = salvage value
Mc = routine and preventive maintenance costs from year one given by
N
MC = Σ { MCj × [ 1 / (1 + i)n ] } (5) j = 1
where MCj = maintenance cost for each period in a cycle (1+i)n = present worth value of one dollar i = interest rate and RehC = rehabilitation cost for the selected strategy given by
RehC = Σ [ Rehcj + PreC ] (6) where Rehcj = total cost of rehabilitation strategy
PreC = total cost of pavement preparation prior to rehabilitation application This cost can be determined based on existing PCI, which will show the extent of exiting pavement deterioration. and
RecoC = total reconstruction cost for selected strategy
RecoC = Σ [ Recocj + Salvj ] [ 1 / (1+i)n ] (7) where
Recocj = reconstruction cost Salvj = cost saving due to salvage value of existing pavement reprocessing or reworking

43
In addition, construction staging cost must also be considered in the life cycle cost analysis. Most of the existing pavement management systems available today ignore this cost in determining the economic evaluation of MR&R actions. The total costs used by these systems are based on user costs such as travel time and vehicle operation costs, and agency costs such as initial construction, maintenance, and rehabilitation costs. These systems claim that the delay and increasing vehicle operation costs during the construction appropriately account for the construction staging cost. However, it is not appropriate to include low-volume road user costs in the economic evaluation because delay and vehicle operation are not significant enough to be considered in the economic evaluation, nor do the user costs represent agency expenditures. In fact, the user costs are subject to a high degree of uncertainty and are, therefore, not precise enough to yield definitive solutions to problems. Therefore, it is suggested that for the selection of the best type of strategy for low-volume road pavements, local government agencies should limit calculations to agency costs alone and should consider construction-staging cost. When all the alternative design strategies have been analyzed and evaluated, an optimization is conducted to select the best strategy with the least total costs. The manager should make the final subjective selection of a maintenance strategy for implementation.


45
10. PRIORITY PROGRAMMING A primary objective of the maintenance priority program is to determine the optimal group of construction project improvements. The priority program will determine which group of projects provides the maximum benefit subject to the constraints of available funding and compatibility requirements among projects. The best possible use of available dollars can be arrived at through a priority analysis. Prioritizing is the overall process for producing a rank order of priority projects and project selection on the basis of factors that are important to each individual local government agency. There are several factors that should be taken into consideration in a priority program, as described below:
• Pavement condition index (PCI): A calculated number to indicate pavement condition. • Average daily traffic (ADT): A higher amount of traffic should have a higher relative
priority although two pavements may have the same PCI. • Roadway functional classification: The priority rating may be adjusted for a road that
belongs to a more important function class. • Roadway location: Priority ratings may be adjusted for roads that are close to urban
areas. • Maintenance history (cost per mile): Priority rating may be adjusted for a road that has
a high maintenance cost to agency. • Pavement riding quality (PQR): A measure of the present serviceability of the road
surface to the road user, primarily in terms of riding comfort, on a scale 0 to 5. The priority rating indicates the priority of each strategy. Once the pavement condition indexes of the pavement surfaces are calculated and total needs are determined, priority-ranking lists for specific maintenance and rehabilitation activities must be established if the needs cannot be addressed immediately. Priorities should be created for each network segment within each strategy category. Once this type of decision is made, priorities are restricted to segments within each strategy category. 10.1. Mathematical Formulation of Priority Index One way to classify the priority for each strategy is to assign the priority index for each activity such that all actions can be ranked numerically. From this ranking, all MR&R actions can be efficiently planned in the appropriate year of the local government agency’s short-term and long-term preparation based on the needs. Following is the formula used to calculate priority index:
Priority index = {[0.65 × PCI] + [0.10 × TF] + [0.05 × FC] + [0.10 × LF] + [0.05 × MH] + [0.05 × PRQ]} (8) where
PCI = pavement condition index TF = traffic factor provided in Table 6 FC = roadway functional classification factor provided in Table 7

46
LF = roadway location factor provided in Table 8 MH = maintenance history factor provided in Table 9 PRQ = pavement riding quality provided in Table 10
By considering all of the above factors, the priority index can be computed from Equation 8. It is essential to understand that a lower index number indicates higher priority. After the priority index for each strategy is established, this will lead agencies to successfully generate all activities needed for the improvements to fit their budgets.
Table 6. Traffic Factor Based on ADT
ADT Range Traffic Factor (TF)
0–49 100 50–99 55
100–199 50 200–299 45 300–399 40 400–499 35 500–599 30 600–699 25 700–799 20 800–899 15 900–999 10 1,000+ 0
Table 7. Roadway Functional Classification Factor
Functional Classification Roadway Functional Classification Factor (FC)
Major arterial 10 Minor arterial 40 Major collector 50 Minor collector 75 Local 100

47
Table 8. Roadway Location Factor
Roadway Location Roadway Location Factor (LF)
Urban 0 Suburban 50 Rural 100
Table 9. Maintenance History Factor
Maintenance Cost Maintenance History Factor (MH)
Very high 0 High 25 Average 50 Low 75 Very Low 100
Table 10. Pavement Riding Quality Factor
Pavement Condition Pavement Riding Quality Pavement Riding Quality Factor (PRQ)
Very good 5 100 Good 4 75 Fair 3 50 Poor 2 25 Failed 1 0

49
11. REPORT GENERATING METHODS After obtaining the budget results from the RMS, the job of the pavement managers changes. The focus becomes how to “sell” the program to the elected board or council. Due to the technical nature of the data and the analysis, it is desirable to translate the findings from the RMS into clear terms that are understandable to decision makers and the public who are not technical experts or engineering professionals. In presenting the RMS findings to the decision makers, it is important to be brief and to point out key facts that will enable them to make better decisions. Key areas of the budget presentation might address the following:
• The current condition of the infrastructure network • The future condition of the infrastructure network, at different funding levels • How much deferred maintenance will occur and what its cost will be if the current
funding level does not allow for all of the roads to be fixed With a computerized RMS, the key factors outlined above can be accessed easily. Pavement asset management presentations to city councils and county commissions should be clear and accurate, and provide various funding alternatives. The RMS products, usually in the form of reports or computer outputs, can be divided into different categories such as for management, engineers, boards and commissions, legislators, media, and other interest groups. Following are example of details that should be included in the report:
• The current condition of facilities by project or segment • Budget requirements to meet performance objectives, current and future • Summary of deterioration (distress) levels over time • Condition of facilities as a function of various budget, current and future • Site specific plans and performance and/or rehabilitation • Priorities for allocating maintenance and rehabilitation funds by project or segment • A history of maintenance and rehabilitation by project, segment, or year • A summary traffic by route and location • Estimated maintenance and rehabilitation costs by project or segment, etc.
The number and types of reports should be carefully controlled and distributed; otherwise, potential users could be overwhelmed with information. Reports for management and legislators should be in the form of a summary with a minimum of technical detail. The reports listed previously indicate the types of information available from the RMS. Not so obvious at first is the number of RMS benefits for the agency and for the public in general. An agency will benefit by being able to maximize the effectiveness of each dollar available for maintenance and rehabilitation. And the public benefits through an asset management program that provides a maximum level of service for their tax dollars.


51
12. SUMMARY The guidelines for a roadway management system (RMS) include a step-by-step procedure to assist local government agencies in coordinating, generating, and planning the maintenance, rehabilitation, and reconstruction strategies to pavements within the roadway network with the minimum cost or to fit their funds and available resources. By developing a customized RMS, local government agencies will be able to establish the data inventory, evaluate the current pavement condition, address problems on pavements, select the appropriate maintenance strategy, forecast the pavement condition in the future, perform the life cycle cost analysis, and achieve the priority program. As a part of these guidelines, Section 2 describes the survey results conducted to gather information regarding the current roadway management practices of the local government agencies throughout the United States. It was also intended to explore information related to the roadway management tools and practices used and developed by agencies to manage their roadway networks. Moreover, a review of current issues concerning the development of an RMS is performed by searching the materials related to the RMS such as articles, technical documents developed by government agencies, and textbooks. The results from these surveys were refined, customized, and then applied to the proposed RMS guidelines. Section 3 provides detailed background information, such as definitions and terms used in pavements, types of pavement, types of pavement distress, to encourage consistency of usage and understanding since these terms may vary from region to region and from one local government agency to another. Section 4 provides an understanding of the data inventory methodology that is established for the data collection process. Also, this section defines the facility network in terms of segment methods that local government agencies can appropriately select regarding their available resources and their needs. In addition, the level of data for project and network levels can vary, so it is essential for local government agencies to be able to identify the difference of the level of data for both levels, which is also included in this section. Section 5 presents the pavement condition evaluation method and procedure to perform the evaluation according to the data inventory established earlier. Although there are several indices used by local government agencies throughout the United States, the Pavement Condition Index (PCI) is considered a significant index for these guidelines to develop other components of a proposed RMS. The PCI value on the concerned pavements can be obtained by using the observed data collected from the data collection process, the deduct value curves provided in Appendix D, the corrected deduct value curves provided in Appendix E, and Equation 1. After the PCI of the concerned pavements is determined, it is then used to generate the repair and maintenance actions or compare the best alternatives for pavements in other components of the proposed RMS. Section 6 shows the guidelines in order to integrate an RMS with geographical information systems (GIS). The integration of these systems will help local government agencies to keep

52
pavement data up-to-date. This section also provides other advantages acquired from the integration, components of GIS, and the approach to use GIS as a platform. Section 7 provides the method to generate strategies and alternatives for maintenance, rehabilitation, and reconstruction actions according to the PCI value obtained previously. By establishing this component of the RMS, local government agencies will be able to select the best maintenance action applied on pavements for both low-volume flexible and built-up road pavements. The flowcharts for generating maintenance strategies for these pavements are provided in Appendix F. The pavement performance prediction model is another essential component of an RMS, presented in Section 8. This will assist local government agencies to forecast the pavement condition at a selected time. Therefore, the future tasks, needs of maintenance actions, analyzing facility life cycle cost analysis, and timing for these actions can be established to fit available funds. The pavement performance prediction model, shown in Equation 3, is obtained from the analysis of the observed data by developing a mathematical relation for the pavement deterioration behavior. Section 9 explains the procedure to perform life cycle cost analysis, which is mostly used by local government agencies to compare alternative maintenance strategies. The total cost for each alternative can be computed by using Equations 4, 5, 6, and 7. Then, each alternative is compared to select the best strategy that will be most worth the available funds. Section 10 provides the method to generate a priority program to determine the optimal group of construction project improvements. Prioritizing is the overall process for producing a numerical rank order of priority projects and project selection on the basis of factors that are important to each individual local government agency. This will help local government agencies generate the maintenance actions to fit their limited budget. After a customized RMS is created for a local government agency, it is important that the RMS is understandable to those who are not technical experts or engineering professionals, such as the elected board or council. Section 11 shows some key elements and guidelines that should be included in the report to present the RMS findings to decision makers.

53
13. REFERENCES Al-Swailmi, S. Framework for Municipal Maintenance Management Systems. Transportation Research
Record, October 1994, 1442, pp. 3–10. Asphalt Institute. Asphalt in Pavement Maintenance, Lexington, KY, 1983. Haas, R., W.R. Hudson, and J. Zaniewski. Modern Pavement Management, 1994. Hall, K.T., C.E. Correa, S.H. Carpenter, and R.P. Elliot. Rehabilitation Strategies for Highway
Pavements. NCHRP Web Document 35 (Project C1-38). Transportation Research Board, Washington, DC, May 2001.
Huang, Y.H. Pavement Analysis and Design, 1993. Liautaud, G., and A. Faiz. Simplified Rapid Assessment Approach to Road Network Management.
Transportation Research Record, No. 1434, July 1996, pp. 73–76. Medina, A., G.W. Flintsch, and J.P. Zaniewski. Geographic Information Systems-Based Pavement
Management System. Transportation Research Record, No. 1652, 1999, pp. 151–157. Moshe, L. Further Development in the Formulation of the Deterioration Curves of Overlaid.
Infrastructure Condition Assessment: Art, Science, and Practice, August 1997, pp. 141–150. Roohanirad, A. Infrastructure Asset Management Need Study Guide, Vol. 1 and 2. TransEducation
Program, 2000.
