guidelines for determining capture efficiency · guidelines for determining capture efficiency...
TRANSCRIPT
GUIDELINES FOR DETERMININGCAPTURE EFFICIENCY
January 9, 1995
GUIDELINES FOR DETERMINING CAPTURE EFFICIENCY
Candace SorrellSource Characterization Group A (MD-19)
Emission Monitoring and Analysis DivisionOffice of Air Quality Planning and Standards
U. S. Environmental Protection AgencyResearch Triangle Park, NC 27711
January 9, 1995
ii
TABLE OF CONTENTS
Page
1.0 INTRODUCTION . . . . . . . . . . . . . . . . . . . 11.1 Purpose . . . . . . . . . . . . . . . . . . . 11.2 Background . . . . . . . . . . . . . . . . . 11.3 Document Organization . . . . . . . . . . . . 2
2.0 RECOMMENDED CAPTURE EFFICIENCY (CE) PROTOCOLS AND TEST METHODS . . . . . . . . . . . . . . . . . . . 32.1 Permanent Total Enclosure . . . . . . . . . . 62.2 Temporary Total Enclosure . . . . . . . . . . 72.3 Building Enclosure . . . . . . . . . . . . . 9
3.0 REQUIREMENTS FOR ALTERNATIVE CE PROTOCOLS . . . . 93.1 Data Quality Objective . . . . . . . . . . . 103.2 Lower Confidence Limit Approach. . . . . . . . . 153.3 Additional Criteria . . . . . . . . . . . . . 203.4 Reporting Requirements for Alternative
CE Protocols . . . . . . . . . . . . . . . . 21 3.5 Recordkeeping Requirements for Alternative CE Protocols . . . . . . . . . . . . . . . . . . 22
4.0 MULTIPLE LINE TESTING . . . . . . . . . . . . . . . . 224.1 Aggregate Sampling. . . . . . . . . . . . . . . . 224.2 Multiple Lines/Common Control Device. . . . . . . 23
5.0 REFERENCES . . . . . . . . . . . . . . . . . . . . 24
APPENDIX
1
1.0 INTRODUCTION
1.1 Purpose
The primary purpose of this document is to provide technical
guidance to U. S. Environmental Protection Agency (EPA) Regional
Offices regarding capture efficiency (CE) testing. The document may
also prove useful to State and local agency personnel and owners and
operators of stationary sources required to determine CE.
1.2 Background
In April 1990, EPA issued new guidance on CE testing.1 This
guidance replaced the traditional liquid/gas mass balance
determinations, which had often resulted in very poor precision and
CE values well in excess of 100 percent. The new protocols involved
permanent total enclosures (PTE's), temporary total enclosures
(TTE's), and building enclosures (BE's). This guidance was later
codified as part of the Chicago Federal implementation plan (FIP) and
included in the document "Model Volatile Organic Compound Rules for
Reasonably Available Control Technology."2,3
In the beginning, the new protocols were met with resistance
from the regulated community, primarily on grounds of safety and
expense. Over time, the safety issue has largely been dispelled as
it has become clear that, with proper design and operation, PTE's and
TTE's pose minimal risk. However, it has also become clear that in
some cases, the new CE protocols are more costly than the traditional
2
liquid/gas procedures.
To address the cost issue, EPA temporarily suspended
certain federal applicability aspects of its guidance while it
embarked on a 12-month study of alternatives with potential for
reducing CE testing costs. This document is a result of that study
and of simultaneous studies voluntarily undertaken by industry
groups. In this document, EPA presents technical guidance on
recommended procedures and on alternative procedures that may reduce
costs. Revisions to current State implementation plans (SIP's) are
required to use the alternative CE test methods described herein. By
calling these procedures "alternatives", the agency does not intend
to imply that they are more difficult to approve than the
"recommended" procedures where the stated criteria for approval are
satisfied. Guidance for implementing these SIP revisions is provided
in the cover memorandum.
1.3 Document Organization
In Section 2.0, EPA's recommended protocols and test methods
are summarized. Section 3.0 presents two sets of criteria by which
alternative procedures can be approved, as well as the recommended
reporting requirements for using alternative procedures. Section 4.0
presents a technical description for aggregate sampling using the
building as a TTE and for testing multiple lines which share a common
control device.
3
2.0 RECOMMENDED CAPTURE EFFICIENCY (CE) PROTOCOLS AND TEST METHODS
The CE determination protocols and test methods recommended by
EPA are largely unchanged from those issued in the April 1990
guidance memo and codified in the Chicago FIP.1,2 The EPA continues
to recommend the use of a PTE, TTE, or BE for determining CE. When a
TTE or BE is used, either a gas/gas protocol or a liquid/gas protocol
may be selected. The EPA test methods for carrying out the
recommended protocols have been revised and will be proposed in the
Federal Register for addition to 40 CFR 51, Appendix M, as Method 204
through Method 204F. Methods 204 through 204E were originally
referred to as Procedures T, L, G.1, G.2, F.1 and F.2 respectively.
Some changes have been made to the test methods, so the latest
version of the methods, which is included as an appendix, should be
consulted when planning CE testing. The draft revisions to date are
summarized below.
First, Appendix B, section 1.4, Sampling requirements,
originally contained a requirement that the sampling time for each
TTE and BE test run should be at least 8 hours, unless otherwise
approved. This provision has been revised to specify that each TTE
or BE run shall cover at least one complete production cycle and must
be at least 3 hours long. The sampling time for each run need not
exceed 8 hours, even if the production cycle has not been completed.
4
The maximum allowable time for a test run is 24 hours. Alternative
sampling times would be subject to EPA approval.
Second, a new section on audit sample procedures has been added
to Procedure L, VOC Input.
Third, the directions for analysis audits have been
expanded (newly added for Procedure L) to include information on
audit sample availability and reporting directions for audit results.
Next, a new method, Method 204F (called the distillation
approach), has been added for measuring liquid VOC input, as an
alternative to Procedure L.
Finally, Procedures T, Criteria for and Verification of a
Permanent or Temporary Total Enclosure, and F.2, Fugitive VOC
Emissions from Building Enclosures, have been revised to clarify the
acceptability criteria of a BE and to clarify which openings
in a building constitute an exhaust point or a natural draft opening
(NDO).
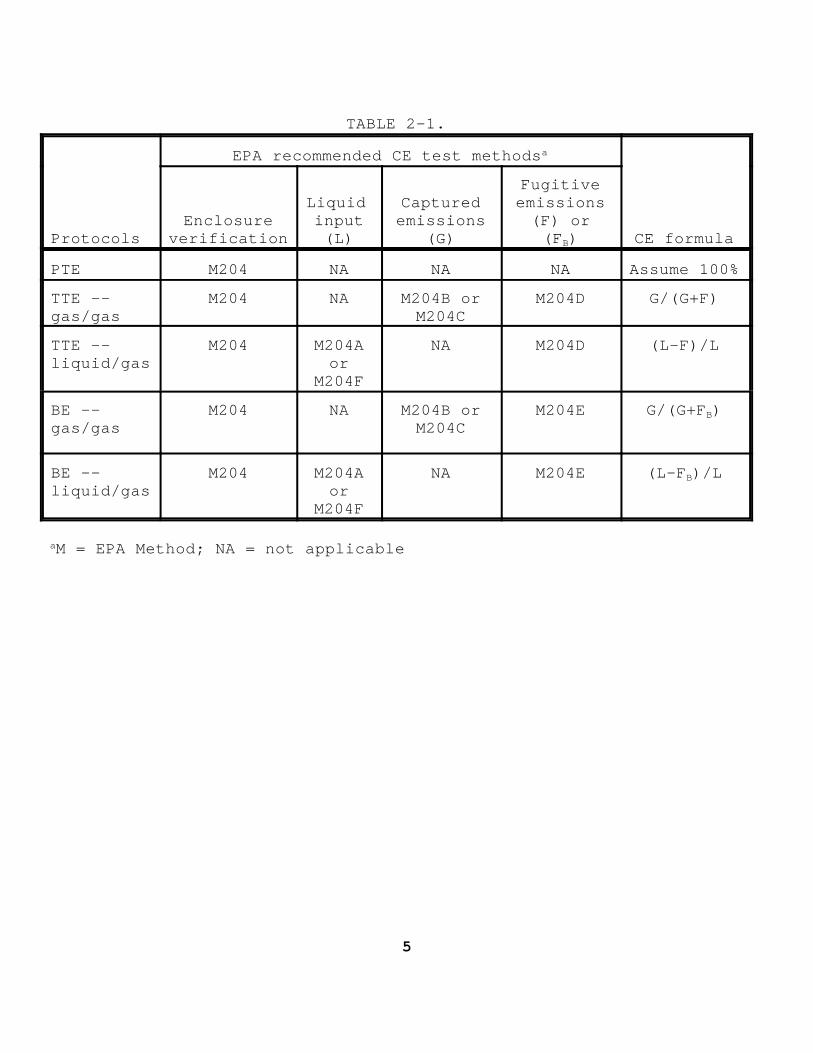
Table 2-1 lists the protocols, their associated EPA recommended
CE test methods, and the formulas for calculating CE. Table 2-2
lists the EPA recommended CE test methods with the full title of
each. The PTE, TTE, and BE are discussed further in Sections 2.1
through 2.3, respectively.
5
TABLE 2-1.
EPA recommended CE test methodsa
ProtocolsEnclosure
verification
Liquid input(L)
Capturedemissions
(G)
Fugitiveemissions(F) or(FB) CE formula
PTE M204 NA NA NA Assume 100%
TTE --gas/gas
M204 NA M204B orM204C
M204D G/(G+F)
TTE --liquid/gas
M204 M204Aor
M204F
NA M204D (L-F)/L
BE --gas/gas
M204 NA M204B orM204C
M204E G/(G+FB)
BE --liquid/gas
M204 M204Aor
M204F
NA M204E (L-FB)/L
aM = EPA Method; NA = not applicable
6
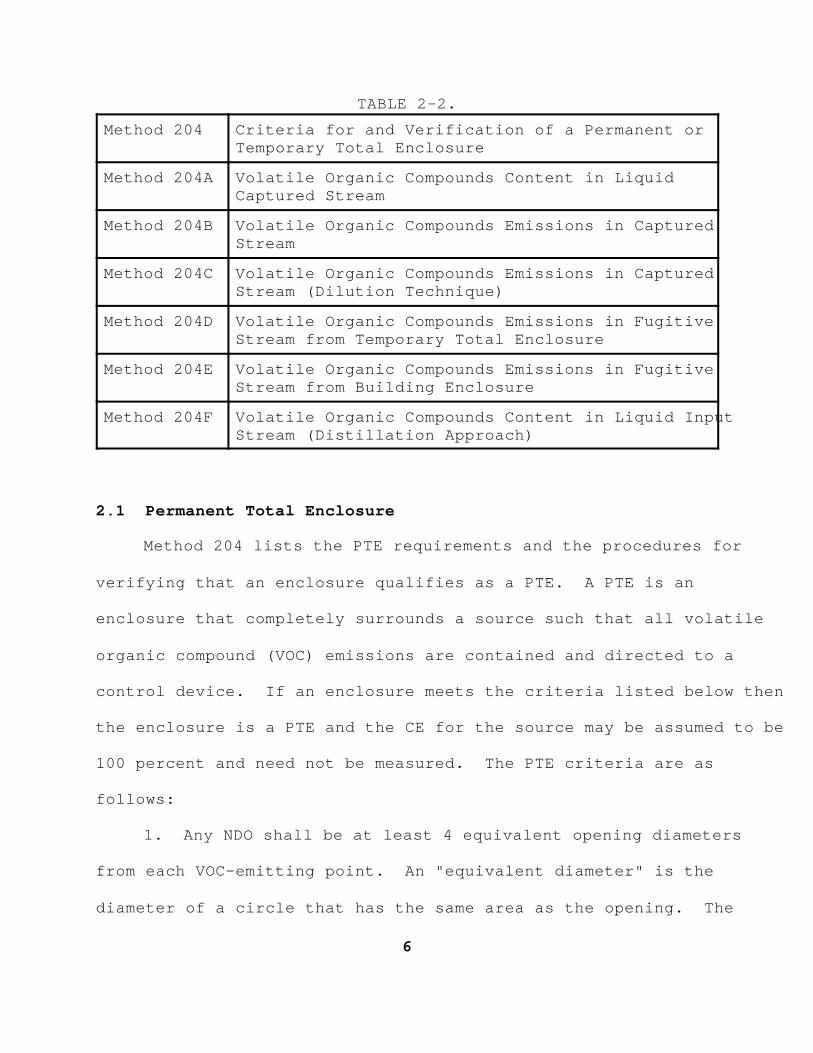
TABLE 2-2.
Method 204 Criteria for and Verification of a Permanent orTemporary Total Enclosure
Method 204A Volatile Organic Compounds Content in LiquidCaptured Stream
Method 204B Volatile Organic Compounds Emissions in CapturedStream
Method 204C Volatile Organic Compounds Emissions in CapturedStream (Dilution Technique)
Method 204D Volatile Organic Compounds Emissions in FugitiveStream from Temporary Total Enclosure
Method 204E Volatile Organic Compounds Emissions in FugitiveStream from Building Enclosure
Method 204F Volatile Organic Compounds Content in Liquid InputStream (Distillation Approach)
2.1 Permanent Total Enclosure
Method 204 lists the PTE requirements and the procedures for
verifying that an enclosure qualifies as a PTE. A PTE is an
enclosure that completely surrounds a source such that all volatile
organic compound (VOC) emissions are contained and directed to a
control device. If an enclosure meets the criteria listed below then
the enclosure is a PTE and the CE for the source may be assumed to be
100 percent and need not be measured. The PTE criteria are as
follows:
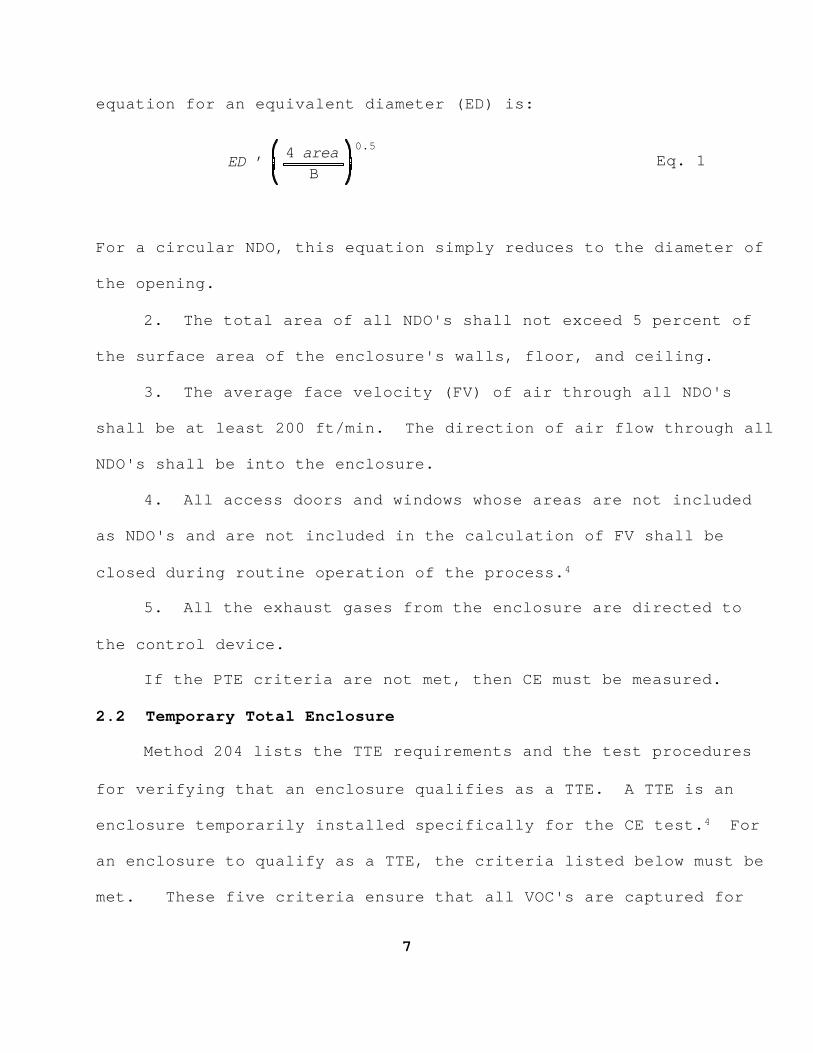
1. Any NDO shall be at least 4 equivalent opening diameters
from each VOC-emitting point. An "equivalent diameter" is the
diameter of a circle that has the same area as the opening. The
7
ED '4 area
B
0.5
Eq. 1
equation for an equivalent diameter (ED) is:
For a circular NDO, this equation simply reduces to the diameter of
the opening.
2. The total area of all NDO's shall not exceed 5 percent of
the surface area of the enclosure's walls, floor, and ceiling.
3. The average face velocity (FV) of air through all NDO's
shall be at least 200 ft/min. The direction of air flow through all
NDO's shall be into the enclosure.
4. All access doors and windows whose areas are not included
as NDO's and are not included in the calculation of FV shall be
closed during routine operation of the process.4
5. All the exhaust gases from the enclosure are directed to
the control device.
If the PTE criteria are not met, then CE must be measured.
2.2 Temporary Total Enclosure
Method 204 lists the TTE requirements and the test procedures
for verifying that an enclosure qualifies as a TTE. A TTE is an
enclosure temporarily installed specifically for the CE test.4 For
an enclosure to qualify as a TTE, the criteria listed below must be
met. These five criteria ensure that all VOC's are captured for
8
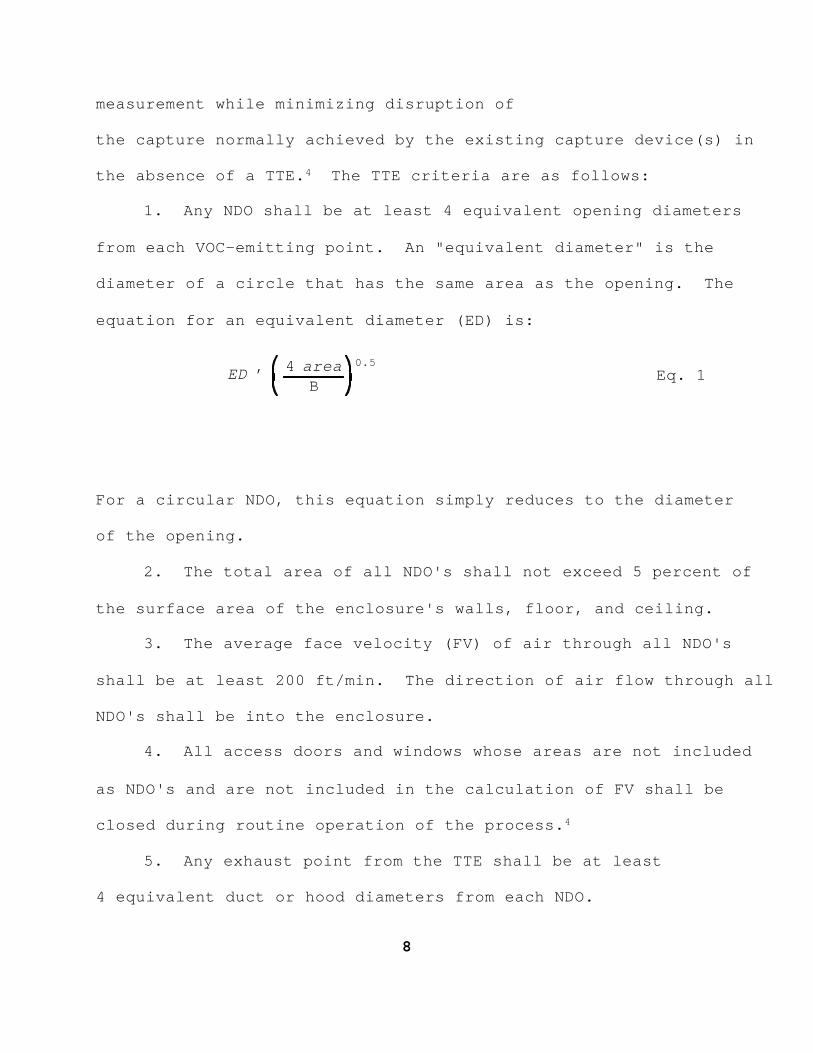
ED '4 area
B
0.5Eq. 1
measurement while minimizing disruption of
the capture normally achieved by the existing capture device(s) in
the absence of a TTE.4 The TTE criteria are as follows:
1. Any NDO shall be at least 4 equivalent opening diameters
from each VOC-emitting point. An "equivalent diameter" is the
diameter of a circle that has the same area as the opening. The
equation for an equivalent diameter (ED) is:
For a circular NDO, this equation simply reduces to the diameter
of the opening.
2. The total area of all NDO's shall not exceed 5 percent of
the surface area of the enclosure's walls, floor, and ceiling.
3. The average face velocity (FV) of air through all NDO's
shall be at least 200 ft/min. The direction of air flow through all
NDO's shall be into the enclosure.
4. All access doors and windows whose areas are not included
as NDO's and are not included in the calculation of FV shall be
closed during routine operation of the process.4
5. Any exhaust point from the TTE shall be at least
4 equivalent duct or hood diameters from each NDO.
9
Two protocols may be used to measure the CE using a TTE, a
gas/gas protocol or a liquid/gas protocol. The associated test
methods and CE formula for each protocol are listed in Table 2-1.
2.3 Building Enclosure
Building enclosure protocols involve using the building that
houses the process as the enclosure. First, one must verify that the
BE meets the requirements for a TTE that are presented in Method 204.
Then, using the procedures specified in Method 204E, one must
identify all the emission points from the building enclosure (e.g.,
roof exhausts, windows, etc.) and determine which emission points
must be tested. Test procedures are given
for determining the flow rate and VOC concentration in the exhaust
from each of the various emission test points.
As with a TTE, two BE protocols may be used to measure the CE,
a gas/gas protocol or a liquid/gas protocol. The associated test
methods and CE formula for each protocol are listed in Table 2-1.
3.0 REQUIREMENTS FOR ALTERNATIVE CE PROTOCOLS
To provide flexibility, EPA has developed two sets of approval
criteria which, when either of them is met, allow the use of the data
obtained with the alternative protocols and test methods for
determining CE. Alternative CE protocols and test methods must meet
either the requirements of the data quality objective (DQO) approach
or the lower confidence limit (LCL) approach and the additional

10
criteria presented below. The DQO, LCL, and additional criteria are
described in Sections 3.1, 3.2, and 3.3, respectively. The
recommended reporting requirements for using alternative CE protocols
and test methods are discussed in Section 3.4.
NOTE: Although the Method 204 test series was developed for
TTE and BE testing, the same procedures can also be used in an
alternative CE test method. For example, a traditional liquid/gas
mass balance test could employ Method 204F to measure liquid VOC
input and Method 204 B to measure captured VOC emissions.
3.1 Data Quality Objective Approach
The purpose of the DQO is to allow sources to use alternative CE
test procedures while ensuring reasonable precision consistent with
pertinent requirements of the Clean Air Act. The DQO requires that
the width of the 2-sided 95 percent confidence interval of the mean
measured value be less than or equal to 10 percent of the mean
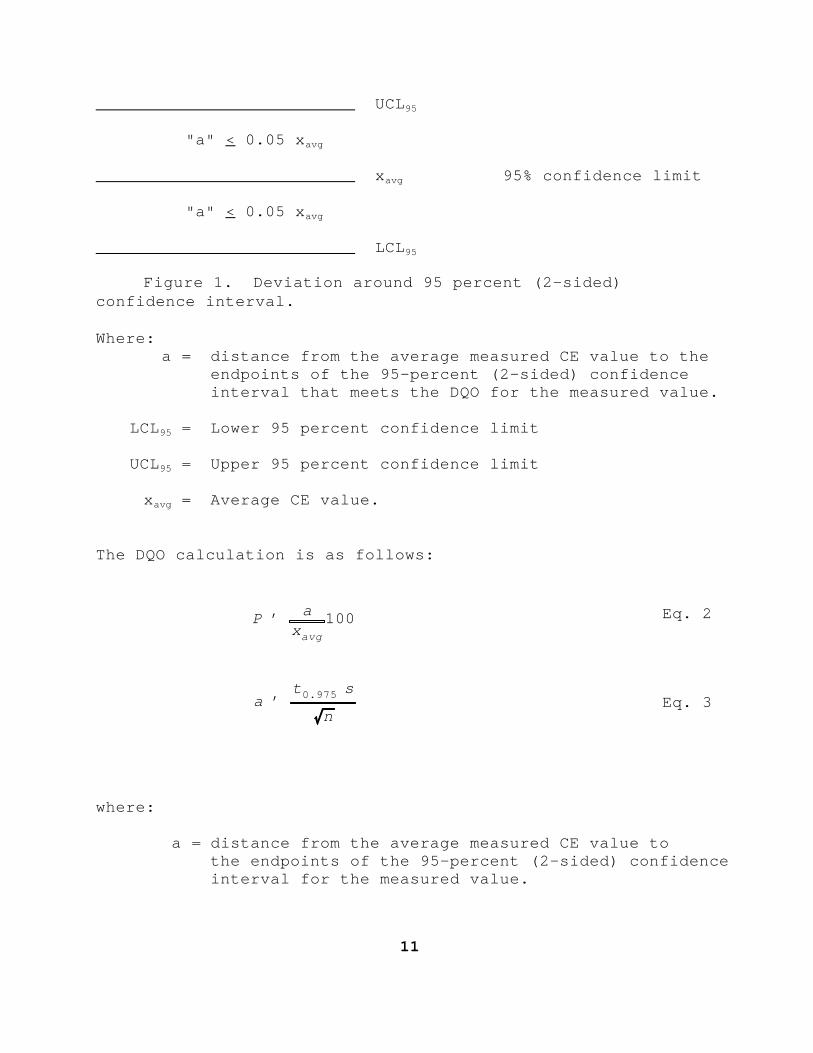
measured value (see Figure 1). This ensures that 95 percent of the
time, when the DQO is met, the actual CE value will be +5 percent of
the mean measured value (assuming that the test protocol is
unbiased).
11
P 'a
xavg100 Eq. 2
a 't0.975 s
nEq. 3
UCL95
"a" < 0.05 xavg
xavg 95% confidence limit
"a" < 0.05 xavg
LCL95
Figure 1. Deviation around 95 percent (2-sided) confidence interval.
Where: a = distance from the average measured CE value to the
endpoints of the 95-percent (2-sided) confidenceinterval that meets the DQO for the measured value.
LCL95 = Lower 95 percent confidence limit
UCL95 = Upper 95 percent confidence limit
xavg = Average CE value.
The DQO calculation is as follows:
where:
a = distance from the average measured CE value to the endpoints of the 95-percent (2-sided) confidenceinterval for the measured value.
12
s 'jn
i '1(xi & xavg )
2
n&1
0.5
Eq. 4
xavg '
jn
i '1xi
nEq. 5
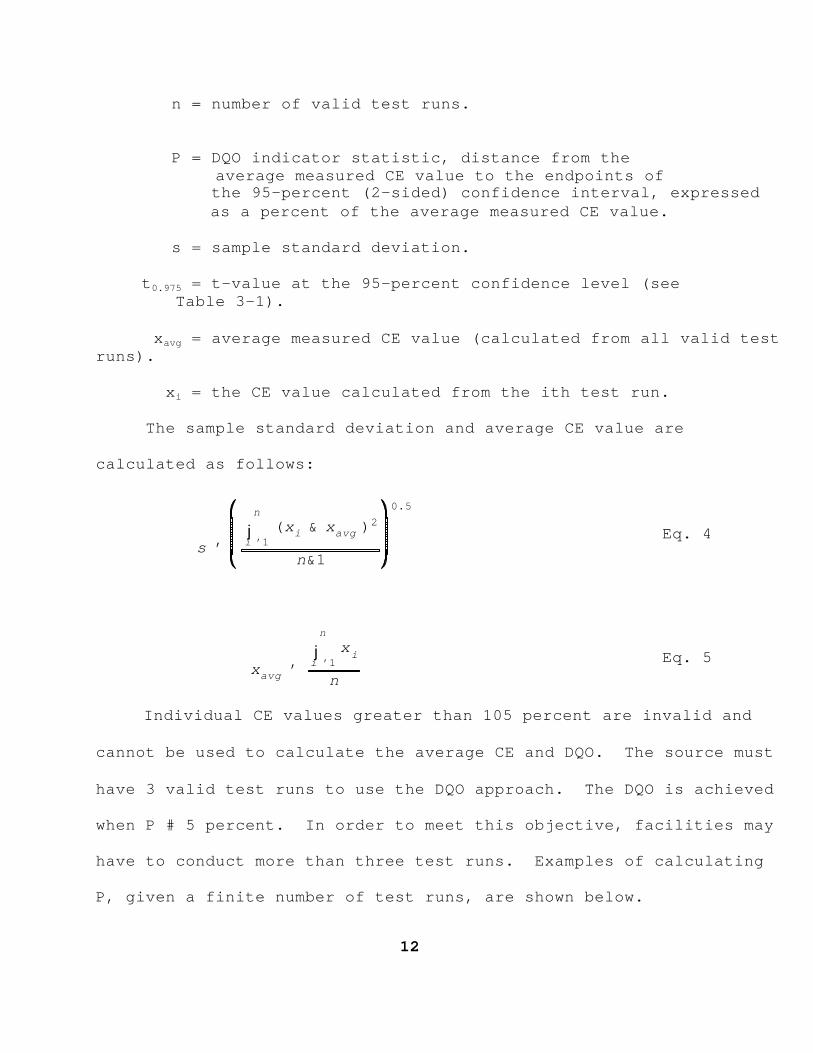
n = number of valid test runs.
P = DQO indicator statistic, distance from the average measured CE value to the endpoints of
the 95-percent (2-sided) confidence interval, expressedas a percent of the average measured CE value.
s = sample standard deviation.
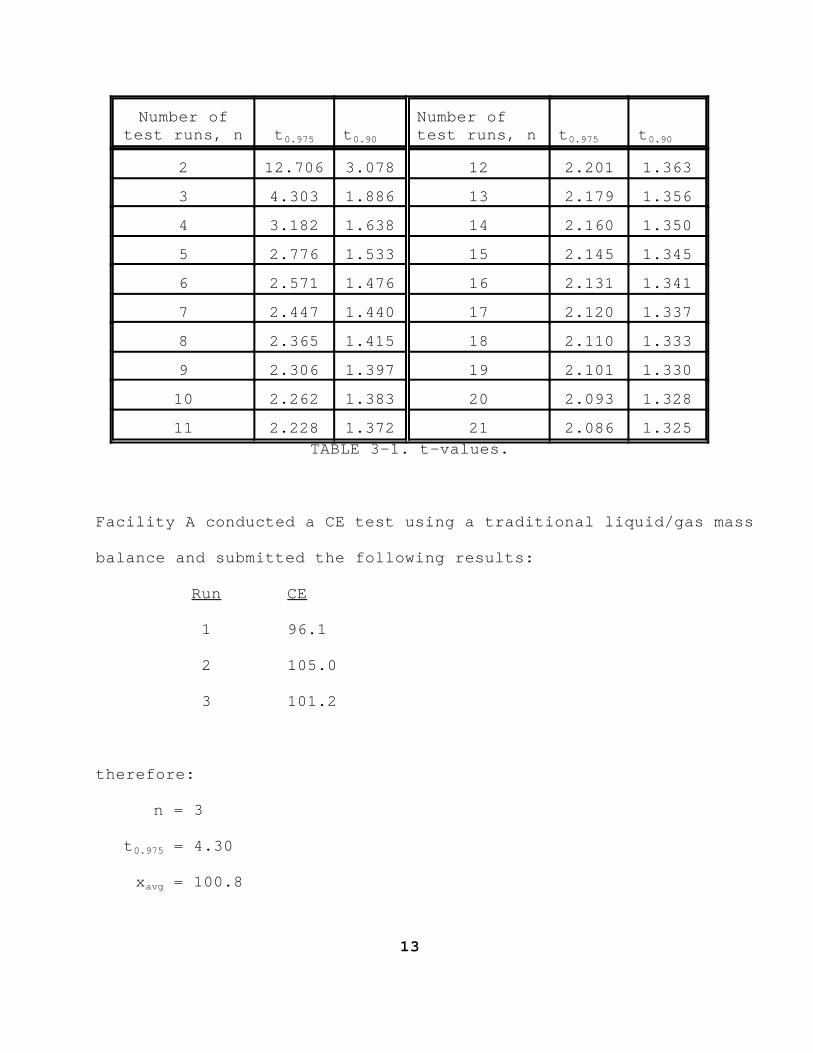
t0.975 = t-value at the 95-percent confidence level (see Table 3-1).
xavg = average measured CE value (calculated from all valid testruns).
xi = the CE value calculated from the ith test run.
The sample standard deviation and average CE value are
calculated as follows:
Individual CE values greater than 105 percent are invalid and
cannot be used to calculate the average CE and DQO. The source must
have 3 valid test runs to use the DQO approach. The DQO is achieved
when P # 5 percent. In order to meet this objective, facilities may
have to conduct more than three test runs. Examples of calculating
P, given a finite number of test runs, are shown below.
13
Number oftest runs, n t0.975 t0.90
Number oftest runs, n t0.975 t0.90
2 12.706 3.078 12 2.201 1.363
3 4.303 1.886 13 2.179 1.356
4 3.182 1.638 14 2.160 1.350
5 2.776 1.533 15 2.145 1.345
6 2.571 1.476 16 2.131 1.341
7 2.447 1.440 17 2.120 1.337
8 2.365 1.415 18 2.110 1.333
9 2.306 1.397 19 2.101 1.330
10 2.262 1.383 20 2.093 1.328
11 2.228 1.372 21 2.086 1.325TABLE 3-1. t-values.
Facility A conducted a CE test using a traditional liquid/gas mass
balance and submitted the following results:
Run CE
1 96.1
2 105.0
3 101.2
therefore:
n = 3
t0.975 = 4.30
xavg = 100.8
14
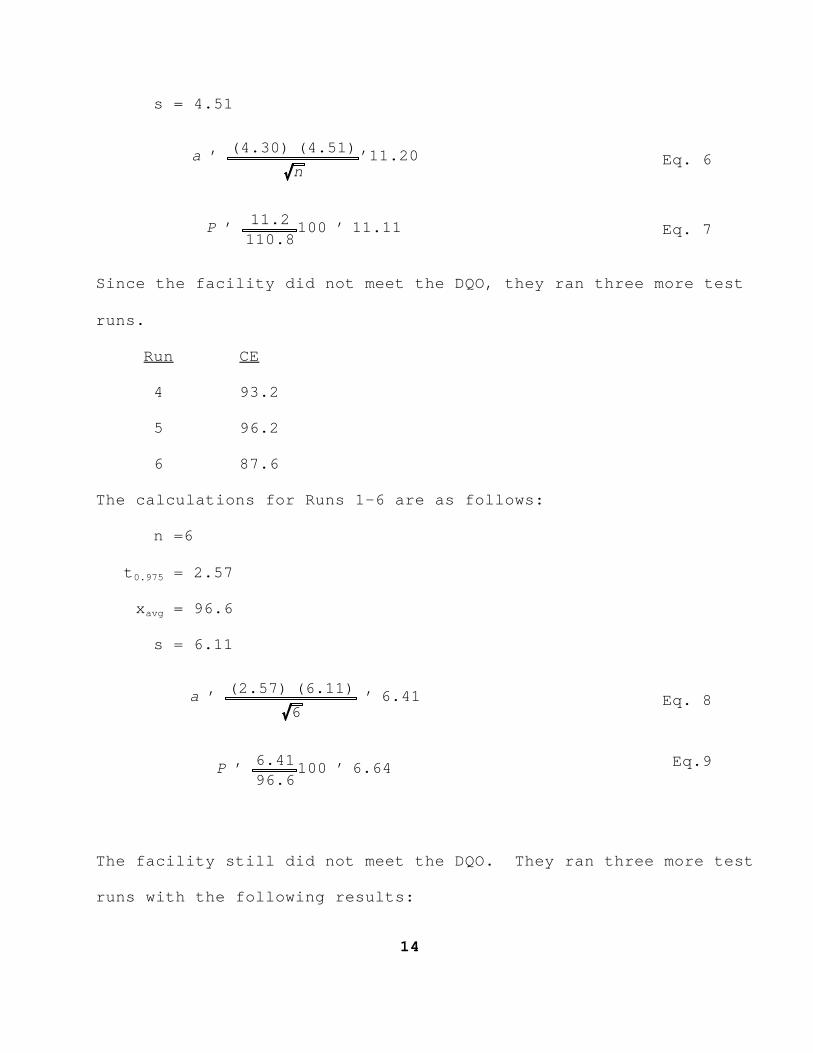
a '(4.30) (4.51)
n'11.20 Eq. 6
P '11.2110.8
100 ' 11.11 Eq. 7
a '(2.57) (6.11)
6' 6.41 Eq. 8
P '6.4196.6
100 ' 6.64 Eq.9
s = 4.51
Since the facility did not meet the DQO, they ran three more test
runs.
Run CE
4 93.2
5 96.2
6 87.6
The calculations for Runs 1-6 are as follows:
n =6
t0.975 = 2.57
xavg = 96.6
s = 6.11
The facility still did not meet the DQO. They ran three more test
runs with the following results:
15
a '(2.31) (5.33)
9' 4.10 Eq. 10
P '4.1095.7
100 ' 4.28 Eq. 11
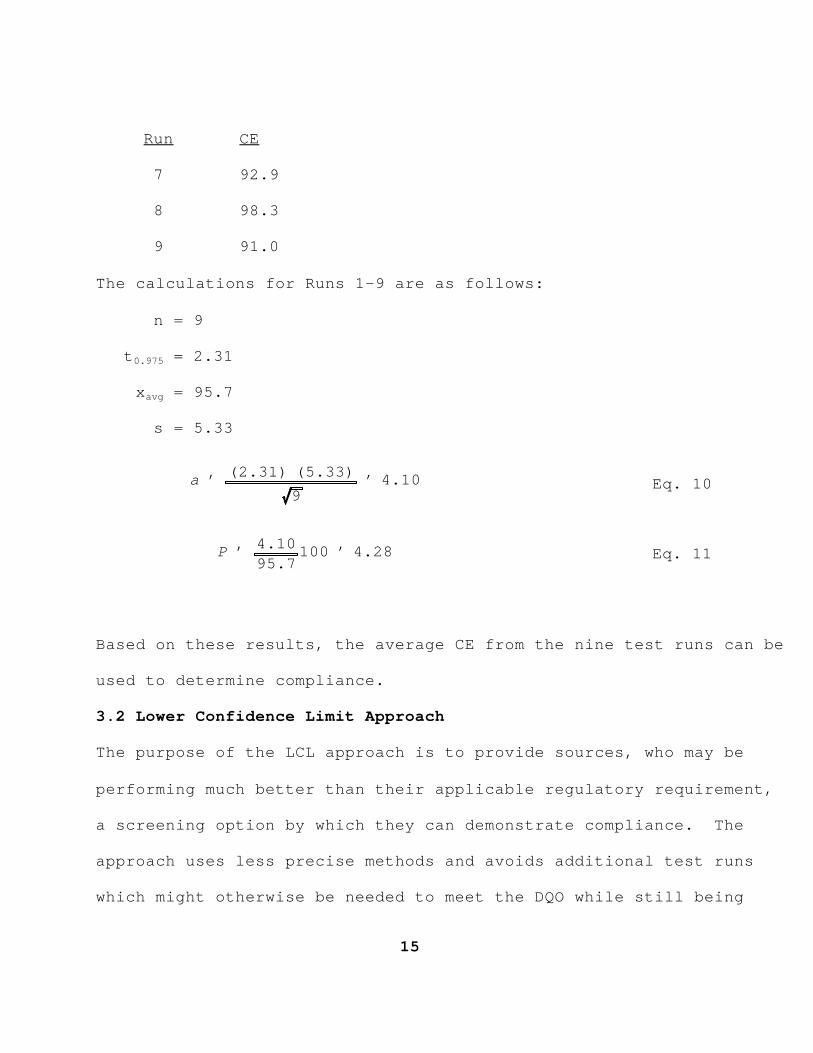
Run CE
7 92.9
8 98.3
9 91.0
The calculations for Runs 1-9 are as follows:
n = 9
t0.975 = 2.31
xavg = 95.7
s = 5.33
Based on these results, the average CE from the nine test runs can be
used to determine compliance.
3.2 Lower Confidence Limit Approach
The purpose of the LCL approach is to provide sources, who may be
performing much better than their applicable regulatory requirement,
a screening option by which they can demonstrate compliance. The
approach uses less precise methods and avoids additional test runs
which might otherwise be needed to meet the DQO while still being
16
assured of correctly demonstrating compliance. It is designed to
reduce "false positive" or so called "Type II errors" which may
erroneously indicate compliance where more variable test methods are
employed. Because it encourages CE performance greater than that
required in exchange for reduced compliance demonstration burden, the
sources that successfully use the LCL approach could produce emission
reductions beyond allowable emissions. Thus, it could provide
additional benefits to the environment as well.
The LCL approach compares the 80 percent (2-sided) LCL for the
mean measured CE value to the applicable CE regulatory requirement.
The LCL approach requires that either the LCL be greater than or
equal to the applicable CE regulatory requirement
or that the DQO is met. A more detailed description of the LCL
approach follows:
A source conducts an initial series of at least three runs. The
source may choose to conduct additional test runs during the initial
test if it desires. All individual runs resulting in CE values above
105 percent are invalid and cannot be used in calculating the average
CE and the LCL. If the data using only the valid test runs meets the
DQO, then the average CE value is used to determine compliance. If
the data does not meet the DQO and the average CE, using all valid
test runs, is above 100 percent then the test sequence is considered
invalid. At this point the facility has the option of (a) conducting

17
LC1'xavg&t0.90s
nEq. 12
more test runs in hopes of meeting the DQO or of bringing the average
CE for all test runs below 100 percent or (b) discarding all previous
test data and retesting. [The purpose of this requirement is to
protect against test methods which may be inherently biased high.
This is important because it is theoretically impossible to have a CE
greater than 100 percent and the LCL approach only looks at the lower
end variability of the test results. This is different from the DQO
which allows average CE values up to 105 percent because the DQO sets
both upper and lower limits on test variability.] At any point
during testing when the results meet the DQO and the average CE is
less than 105 percent, the average CE can be used for demonstrating
compliance with the applicable regulatory requirement. Similarly, if
the average CE is below 100 percent then the LCL can be used for
demonstrating compliance with the applicable regulatory requirement
without regard to the DQO.
The LCL is calculated at a 80 percent (two-sided) confidence
level as follows:
where:
LC1 = LCL at a 80 percent (two-sided) confidence level.
n = number of valid test runs.
18
s = sample standard deviation.
t0.90 = t-value at the 80-percent (two-sided) confidence level (see Table 3-1).
xavg = average measured CE value (calculated from all valid test runs).
The resulting LC1 is compared to the applicable CE regulatory
requirement. If LC1 exceeds (i.e. is higher than) the applicable
regulatory requirement, then a facility is in initial compliance.
However, if the LC1 is below the CE requirement, then the facility
must conduct additional test runs. After this point the test results
will be evaluated not only looking at the LCL but also the DQO of +5
percent of the mean at a 95 percent confidence level. If the test
results with the additional test runs meet the DQO before the LCL
exceeds the applicable CE regulatory requirement, then the average CE
value will be
compared to the applicable CE regulatory requirement for
determination of compliance.
If there is no specific CE requirement in the applicable
regulation, then the applicable CE regulatory requirement is
determined based on the applicable regulation and an acceptable
destruction efficiency test. If the applicable regulation requires
daily compliance and the latest CE compliance demonstration was made
using the LCL approach, then the calculated LC1 will be the highest CE
19
LC1'94.1&(1.886)(3.55)
3'90.23 Eq. 13
value which a facility is
allowed to claim until another CE demonstration test is conducted.
This last requirement is necessary to assure both
sufficiently reliable test results in all circumstances and the
potential environmental benefits referenced above.
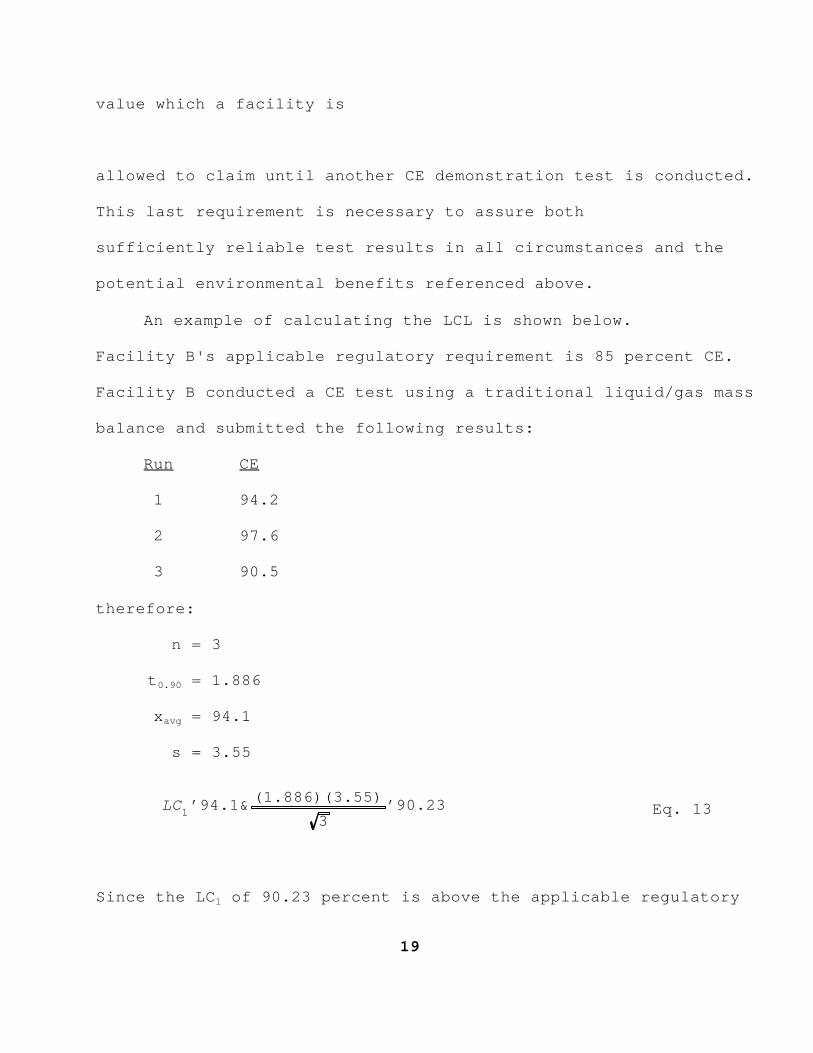
An example of calculating the LCL is shown below.
Facility B's applicable regulatory requirement is 85 percent CE.
Facility B conducted a CE test using a traditional liquid/gas mass
balance and submitted the following results:
Run CE
1 94.2
2 97.6
3 90.5
therefore:
n = 3
t0.90 = 1.886
xavg = 94.1
s = 3.55
Since the LC1 of 90.23 percent is above the applicable regulatory

20
requirement of 85 percent then the facility is in compliance. The
facility must continue to accept the LC1 of 90.23 percent as its CE
value until a new series of valid tests is conducted.
3.3 Additional Criteria
The Office of Air Quality Planning and Standards (OAQPS) has
developed an additional set of criteria that must be incorporated
into alternative CE protocols and associated test methods in order
for them to be approved. The following criteria apply:
1. A CE test shall consist of at least three sampling runs.
Each test run shall be at least 20 minutes long. The sampling time
for each run shall not exceed 24 hours.
2. All test runs must be separate and independent. For
example, liquid VOC input and output must be determined independently
for each run. The final liquid VOC sample from one run cannot be the
initial sample for another run. In addition,
liquid input for an entire day cannot be apportioned among test runs
based on production.
3. Composite liquid samples will not be permitted to obtain an
"average composition" for a test run. For example, separate initial
and final coating samples must be taken and analyzed for each run;
initial and final samples cannot be combined prior to analysis to
derive an "average composition" for the test run.
4. All individual test runs that result in a CE of greater than
21
105 percent are invalid and must be discarded. A test must consist
of at least 3 valid test runs.
5. If the source can demonstrate to the regulatory agency that
a run should not be considered due to an identified testing or
analysis error such as spillage of part of the sample during shipping
or an upset or improper operating conditions that is not considered
part of normal operation then the test result for that individual run
may be discarded. This limited exception allows sources to discard
as "outliers" certain individual runs without replacing them with a
valid run so long as the facility has at least 3 valid test runs to
use when calculating its DQO or LCL. This exception is limited
solely to test runs involving the types of errors identified above.
6. All valid test runs that are conducted must be included in
the average CE determination. The individual CE results and
average CE results cannot be truncated (i.e. 105 percent cannot be
reported as 100+ percent).
7. For the DQO approach the average CE for the test program
cannot be greater than 105 percent.
8. Alternative test methods for measuring VOC concentration
must include a three-point calibration of the gas analysis instrument
in the expected concentration range.
3.4 Reporting Requirements for Alternative CE Protocols
If a facility chooses to use alternative CE protocols and test
22
methods, the following information should be submitted with each
test report to the appropriate regulatory agency:
1. A copy of all alternative test methods, including any
changes to EPA reference methods, QA/QC procedures and calibration
procedures.
2. A table with information on each liquid sample, including
the sample identification, where and when the sample was taken, and
the VOC content of the sample;
3. The coating usage for each test run (for protocols in which
the liquid VOC input is to be determined);
4. The quantity of captured VOC measured for each test run;
5. The CE calculations and results for each test run;
6. The DQO or LCL calculations and results; and
7. The QA/QC results, including information on calibrations
(e.g., how often the instruments were calibrated, the calibration
results, and information on calibration gases, if applicable).
3.5 Recordkeeping Requirements for Alternative CE Protocols.
A record should be kept at the facility of all raw data recorded
during the test in a suitable form for submittal to the appropriate
regulatory authority upon request.
4.0 MULTIPLE LINE TESTING
23
4.1 Aggregate Sampling
A potential way to add further flexibility to determining CE is
to utilize aggregate sampling using a building enclosure. This
involves testing all regulated lines in the building enclosure
simultaneously. It must be noted that this technique may not be
feasible for all facilities. The applicable regulations must be
written to allow aggregate sampling and a standard must be set for
the building as a regulated entity. The building must be able to
meet the criteria in Method 204 for a building enclosure and the
building enclosure protocol described in Section 2.3 must be
followed.
4.2 Multiple Lines With Common Control Device
A second potential way to add further flexibility for
determining CE is to test multiple lines sharing a common control
device simultaneously. It must be noted that this technique may not
be feasible for all facilities. The applicable regulations must be
written to allow multiple line testing. The facility must also meet
additional guidelines as follows:
1. The multiple lines must share a common control device.
2. Multiple line testing may be performed using recommended EPA
protocols and test methods or alternative CE protocols and test
methods. The alternative protocols must meet the requirements of
Section 3.0.
24
3. The lines that are tested in combination are considered to
be in compliance only if the CE determined for the combination of
lines meets the most stringent CE required for any individual line.
5.0 REFERENCES
1. Memorandum and attachments from Seitz, J.S., EPA/SSCD, toRegional Office air division directors. April 16, 1990. Guidelines for developing a State protocol for the measurement ofcapture efficiency.
2. Office of the Federal Register. Control strategy: Ozone controlmeasures for Cook, DuPage, Kane, Lake, McHenry and Will Counties. 40 CFR 52.741. Washington, DC. U. S. Government PrintingOffice. 1992.
3. OAQPS. Model Volatile Organic Compound Rules for ReasonablyAvailable Control Technology. U. S. Environmental ProtectionAgency. Research Triangle Park, NC. June 1992. pp. 340-349.
4. The Measurement Solution: Using a Temporary Total Enclosure forCapture Efficiency Testing. EPA-450/4-91-020. August 1991. Research Triangle Park, NC.
5. Mendenhall, W. Introduction to Probability and Statistics, ThirdEdition. Belmont, California. Duxbury Press. 1971. p. 419.

25
APPENDIX
Contains Methods 204 thought 204F which can be foundon the EMTIC BBS