guidelines for preparation of state water-use estimates ... · guidelines for preparation of state...
TRANSCRIPT

Guidelines for Preparation of State Water-Use Estimates for 2000
Techniques and Methods 4–A4
U.S. Department of the Interior U.S. Geological Survey
1950–2000
years of
informationwater use


Guidelines for Preparation of State Water-Use Estimates for 2000
Edited by Joan F. Kenny
U.S. Department of the Interior U.S. Geological Survey
Techniques and Methods 4–4A

U.S. Department of the InteriorGale A. Norton, Secretary
U.S. Geological SurveyCharles G. Groat, Director
U.S. Geological Survey, Reston, Virginia: 2004
For sale by U.S. Geological Survey, Information Services Box 25286, Denver Federal Center Denver, CO 80225
For more information about the USGS and its products: Telephone: 1-888-ASK-USGS World Wide Web: http://www.usgs.gov/
Any use of trade, product, or firm names in this publication is for descriptive purposes only and does not imply endorsement by the U.S. Government.
Although this report is in the public domain, permission must be secured from the individual copyright owners to reproduce any copyrighted materials contained within this report.
Suggested citation: Kenny, J.F., ed., 2004, Guidelines for preparation of State water-use estimates for 2000: U.S. Geological Survey Tech-niques and Methods 4–A4, 49 p., available on the World Wide Web at URL http://water.usgs.gov/watuse/
Prepared by the U.S. Geological Survey in Lawrence, Kansas (http://ks.water.usgs.gov)
iii
Contents
Glossary. . . . . . . . . . . . . . . . . . . . . . . . . . . . . . . . . . . . . . . . . . . . . . . . . . . . . . . . . . . . . . . . . . . . . . . . . . . . . . . . . . . . . . . . . . . . . . . . . . . . viiAbstract . . . . . . . . . . . . . . . . . . . . . . . . . . . . . . . . . . . . . . . . . . . . . . . . . . . . . . . . . . . . . . . . . . . . . . . . . . . . . . . . . . . . . . . . . . . . . . . . . . . . 1Introduction . . . . . . . . . . . . . . . . . . . . . . . . . . . . . . . . . . . . . . . . . . . . . . . . . . . . . . . . . . . . . . . . . . . . . . . . . . . . . . . . . . . . . . . . . . . . . . . . . 1
Purpose and Scope . . . . . . . . . . . . . . . . . . . . . . . . . . . . . . . . . . . . . . . . . . . . . . . . . . . . . . . . . . . . . . . . . . . . . . . . . . . . . . . . . . . 2Acknowledgments . . . . . . . . . . . . . . . . . . . . . . . . . . . . . . . . . . . . . . . . . . . . . . . . . . . . . . . . . . . . . . . . . . . . . . . . . . . . . . . . . . . 2
Water-Use Compilation Requirements for 2000 . . . . . . . . . . . . . . . . . . . . . . . . . . . . . . . . . . . . . . . . . . . . . . . . . . . . . . . . . . . . . . 2Water-Use Categories and Data Elements . . . . . . . . . . . . . . . . . . . . . . . . . . . . . . . . . . . . . . . . . . . . . . . . . . . . . . . . . . . . 2Units of Measurement . . . . . . . . . . . . . . . . . . . . . . . . . . . . . . . . . . . . . . . . . . . . . . . . . . . . . . . . . . . . . . . . . . . . . . . . . . . . . . . . 3Aggregation Levels . . . . . . . . . . . . . . . . . . . . . . . . . . . . . . . . . . . . . . . . . . . . . . . . . . . . . . . . . . . . . . . . . . . . . . . . . . . . . . . . . . . 3AWUDS Database . . . . . . . . . . . . . . . . . . . . . . . . . . . . . . . . . . . . . . . . . . . . . . . . . . . . . . . . . . . . . . . . . . . . . . . . . . . . . . . . . . . . 3Documentation . . . . . . . . . . . . . . . . . . . . . . . . . . . . . . . . . . . . . . . . . . . . . . . . . . . . . . . . . . . . . . . . . . . . . . . . . . . . . . . . . . . . . . . 3
Compilation Methods . . . . . . . . . . . . . . . . . . . . . . . . . . . . . . . . . . . . . . . . . . . . . . . . . . . . . . . . . . . . . . . . . . . . . . . . . . . . . . . . . . . . . . . 4General Techniques. . . . . . . . . . . . . . . . . . . . . . . . . . . . . . . . . . . . . . . . . . . . . . . . . . . . . . . . . . . . . . . . . . . . . . . . . . . . . . . . . . . 4Internet Resources . . . . . . . . . . . . . . . . . . . . . . . . . . . . . . . . . . . . . . . . . . . . . . . . . . . . . . . . . . . . . . . . . . . . . . . . . . . . . . . . . . . 4Withdrawals by Aquifer . . . . . . . . . . . . . . . . . . . . . . . . . . . . . . . . . . . . . . . . . . . . . . . . . . . . . . . . . . . . . . . . . . . . . . . . . . . . . . . 4Quality Assurance/Quality Control . . . . . . . . . . . . . . . . . . . . . . . . . . . . . . . . . . . . . . . . . . . . . . . . . . . . . . . . . . . . . . . . . . . . 4Industrial Classification Coding Systems. . . . . . . . . . . . . . . . . . . . . . . . . . . . . . . . . . . . . . . . . . . . . . . . . . . . . . . . . . . . . . . 4
Public Supply . . . . . . . . . . . . . . . . . . . . . . . . . . . . . . . . . . . . . . . . . . . . . . . . . . . . . . . . . . . . . . . . . . . . . . . . . . . . . . . . . . . . . . . . . . . . . . . 5Category Description . . . . . . . . . . . . . . . . . . . . . . . . . . . . . . . . . . . . . . . . . . . . . . . . . . . . . . . . . . . . . . . . . . . . . . . . . . . . . . . . . 5Data Elements . . . . . . . . . . . . . . . . . . . . . . . . . . . . . . . . . . . . . . . . . . . . . . . . . . . . . . . . . . . . . . . . . . . . . . . . . . . . . . . . . . . . . . . . 5Sources of Information . . . . . . . . . . . . . . . . . . . . . . . . . . . . . . . . . . . . . . . . . . . . . . . . . . . . . . . . . . . . . . . . . . . . . . . . . . . . . . . 5Compilation Techniques . . . . . . . . . . . . . . . . . . . . . . . . . . . . . . . . . . . . . . . . . . . . . . . . . . . . . . . . . . . . . . . . . . . . . . . . . . . . . . 6
Withdrawals . . . . . . . . . . . . . . . . . . . . . . . . . . . . . . . . . . . . . . . . . . . . . . . . . . . . . . . . . . . . . . . . . . . . . . . . . . . . . . . . . . . . 6Per-Capita Use Coefficients . . . . . . . . . . . . . . . . . . . . . . . . . . . . . . . . . . . . . . . . . . . . . . . . . . . . . . . . . . . . . . . . . . . . . 7Population Served . . . . . . . . . . . . . . . . . . . . . . . . . . . . . . . . . . . . . . . . . . . . . . . . . . . . . . . . . . . . . . . . . . . . . . . . . . . . . . 8
Domestic . . . . . . . . . . . . . . . . . . . . . . . . . . . . . . . . . . . . . . . . . . . . . . . . . . . . . . . . . . . . . . . . . . . . . . . . . . . . . . . . . . . . . . . . . . . . . . . . . . . 8Category Description . . . . . . . . . . . . . . . . . . . . . . . . . . . . . . . . . . . . . . . . . . . . . . . . . . . . . . . . . . . . . . . . . . . . . . . . . . . . . . . . . 8Data Elements . . . . . . . . . . . . . . . . . . . . . . . . . . . . . . . . . . . . . . . . . . . . . . . . . . . . . . . . . . . . . . . . . . . . . . . . . . . . . . . . . . . . . . . . 8Sources of Information . . . . . . . . . . . . . . . . . . . . . . . . . . . . . . . . . . . . . . . . . . . . . . . . . . . . . . . . . . . . . . . . . . . . . . . . . . . . . . . 8Compilation Techniques . . . . . . . . . . . . . . . . . . . . . . . . . . . . . . . . . . . . . . . . . . . . . . . . . . . . . . . . . . . . . . . . . . . . . . . . . . . . . . 9
Industrial . . . . . . . . . . . . . . . . . . . . . . . . . . . . . . . . . . . . . . . . . . . . . . . . . . . . . . . . . . . . . . . . . . . . . . . . . . . . . . . . . . . . . . . . . . . . . . . . . . . 10Category Description . . . . . . . . . . . . . . . . . . . . . . . . . . . . . . . . . . . . . . . . . . . . . . . . . . . . . . . . . . . . . . . . . . . . . . . . . . . . . . . . 10Data Elements . . . . . . . . . . . . . . . . . . . . . . . . . . . . . . . . . . . . . . . . . . . . . . . . . . . . . . . . . . . . . . . . . . . . . . . . . . . . . . . . . . . . . . . 10Sources of Information . . . . . . . . . . . . . . . . . . . . . . . . . . . . . . . . . . . . . . . . . . . . . . . . . . . . . . . . . . . . . . . . . . . . . . . . . . . . . . 10Compilation Techniques . . . . . . . . . . . . . . . . . . . . . . . . . . . . . . . . . . . . . . . . . . . . . . . . . . . . . . . . . . . . . . . . . . . . . . . . . . . . . 11
Withdrawals . . . . . . . . . . . . . . . . . . . . . . . . . . . . . . . . . . . . . . . . . . . . . . . . . . . . . . . . . . . . . . . . . . . . . . . . . . . . . . . . . . . 11Water-Use Coefficients . . . . . . . . . . . . . . . . . . . . . . . . . . . . . . . . . . . . . . . . . . . . . . . . . . . . . . . . . . . . . . . . . . . . . . . . 11Allocation of Withdrawals by Source . . . . . . . . . . . . . . . . . . . . . . . . . . . . . . . . . . . . . . . . . . . . . . . . . . . . . . . . . . . 12
Irrigation . . . . . . . . . . . . . . . . . . . . . . . . . . . . . . . . . . . . . . . . . . . . . . . . . . . . . . . . . . . . . . . . . . . . . . . . . . . . . . . . . . . . . . . . . . . . . . . . . . . 12Category Description . . . . . . . . . . . . . . . . . . . . . . . . . . . . . . . . . . . . . . . . . . . . . . . . . . . . . . . . . . . . . . . . . . . . . . . . . . . . . . . . 12Data Elements . . . . . . . . . . . . . . . . . . . . . . . . . . . . . . . . . . . . . . . . . . . . . . . . . . . . . . . . . . . . . . . . . . . . . . . . . . . . . . . . . . . . . . . 12Sources of Information . . . . . . . . . . . . . . . . . . . . . . . . . . . . . . . . . . . . . . . . . . . . . . . . . . . . . . . . . . . . . . . . . . . . . . . . . . . . . . 12

iv
Compilation Techniques . . . . . . . . . . . . . . . . . . . . . . . . . . . . . . . . . . . . . . . . . . . . . . . . . . . . . . . . . . . . . . . . . . . . . . . . . . . . . 14
Reported Data . . . . . . . . . . . . . . . . . . . . . . . . . . . . . . . . . . . . . . . . . . . . . . . . . . . . . . . . . . . . . . . . . . . . . . . . . . . . . . . . . 14
Surveys and Personal Contact . . . . . . . . . . . . . . . . . . . . . . . . . . . . . . . . . . . . . . . . . . . . . . . . . . . . . . . . . . . . . . . . . . 14
Estimates of Crop Water Needs . . . . . . . . . . . . . . . . . . . . . . . . . . . . . . . . . . . . . . . . . . . . . . . . . . . . . . . . . . . . . . . . 15
Statistical Sampling . . . . . . . . . . . . . . . . . . . . . . . . . . . . . . . . . . . . . . . . . . . . . . . . . . . . . . . . . . . . . . . . . . . . . . . . . . . . 15
Allocation of Withdrawals by Source . . . . . . . . . . . . . . . . . . . . . . . . . . . . . . . . . . . . . . . . . . . . . . . . . . . . . . . . . . . 15
Acres Irrigated by System Type . . . . . . . . . . . . . . . . . . . . . . . . . . . . . . . . . . . . . . . . . . . . . . . . . . . . . . . . . . . . . . . . . 15
Golf-Course Irrigation . . . . . . . . . . . . . . . . . . . . . . . . . . . . . . . . . . . . . . . . . . . . . . . . . . . . . . . . . . . . . . . . . . . . . . . . . . 16
Thermoelectric Power . . . . . . . . . . . . . . . . . . . . . . . . . . . . . . . . . . . . . . . . . . . . . . . . . . . . . . . . . . . . . . . . . . . . . . . . . . . . . . . . . . . . . 16
Category Description . . . . . . . . . . . . . . . . . . . . . . . . . . . . . . . . . . . . . . . . . . . . . . . . . . . . . . . . . . . . . . . . . . . . . . . . . . . . . . . . 16
Data Elements . . . . . . . . . . . . . . . . . . . . . . . . . . . . . . . . . . . . . . . . . . . . . . . . . . . . . . . . . . . . . . . . . . . . . . . . . . . . . . . . . . . . . . . 17
Sources of Information . . . . . . . . . . . . . . . . . . . . . . . . . . . . . . . . . . . . . . . . . . . . . . . . . . . . . . . . . . . . . . . . . . . . . . . . . . . . . . 17
Compilation Techniques . . . . . . . . . . . . . . . . . . . . . . . . . . . . . . . . . . . . . . . . . . . . . . . . . . . . . . . . . . . . . . . . . . . . . . . . . . . . . 18
Mining . . . . . . . . . . . . . . . . . . . . . . . . . . . . . . . . . . . . . . . . . . . . . . . . . . . . . . . . . . . . . . . . . . . . . . . . . . . . . . . . . . . . . . . . . . . . . . . . . . . . . 18
Category Description . . . . . . . . . . . . . . . . . . . . . . . . . . . . . . . . . . . . . . . . . . . . . . . . . . . . . . . . . . . . . . . . . . . . . . . . . . . . . . . . 18
Data Elements . . . . . . . . . . . . . . . . . . . . . . . . . . . . . . . . . . . . . . . . . . . . . . . . . . . . . . . . . . . . . . . . . . . . . . . . . . . . . . . . . . . . . . . 18
Sources of Information . . . . . . . . . . . . . . . . . . . . . . . . . . . . . . . . . . . . . . . . . . . . . . . . . . . . . . . . . . . . . . . . . . . . . . . . . . . . . . 19
Compilation Techniques . . . . . . . . . . . . . . . . . . . . . . . . . . . . . . . . . . . . . . . . . . . . . . . . . . . . . . . . . . . . . . . . . . . . . . . . . . . . . 19
Livestock . . . . . . . . . . . . . . . . . . . . . . . . . . . . . . . . . . . . . . . . . . . . . . . . . . . . . . . . . . . . . . . . . . . . . . . . . . . . . . . . . . . . . . . . . . . . . . . . . . . 20
Category Description . . . . . . . . . . . . . . . . . . . . . . . . . . . . . . . . . . . . . . . . . . . . . . . . . . . . . . . . . . . . . . . . . . . . . . . . . . . . . . . . 20
Data Elements . . . . . . . . . . . . . . . . . . . . . . . . . . . . . . . . . . . . . . . . . . . . . . . . . . . . . . . . . . . . . . . . . . . . . . . . . . . . . . . . . . . . . . . 20
Sources of Information . . . . . . . . . . . . . . . . . . . . . . . . . . . . . . . . . . . . . . . . . . . . . . . . . . . . . . . . . . . . . . . . . . . . . . . . . . . . . . 20
Compilation Techniques . . . . . . . . . . . . . . . . . . . . . . . . . . . . . . . . . . . . . . . . . . . . . . . . . . . . . . . . . . . . . . . . . . . . . . . . . . . . . 21
Aquaculture . . . . . . . . . . . . . . . . . . . . . . . . . . . . . . . . . . . . . . . . . . . . . . . . . . . . . . . . . . . . . . . . . . . . . . . . . . . . . . . . . . . . . . . . . . . . . . . 21
Category Description . . . . . . . . . . . . . . . . . . . . . . . . . . . . . . . . . . . . . . . . . . . . . . . . . . . . . . . . . . . . . . . . . . . . . . . . . . . . . . . . 21
Data Elements . . . . . . . . . . . . . . . . . . . . . . . . . . . . . . . . . . . . . . . . . . . . . . . . . . . . . . . . . . . . . . . . . . . . . . . . . . . . . . . . . . . . . . . 22
Sources of Information . . . . . . . . . . . . . . . . . . . . . . . . . . . . . . . . . . . . . . . . . . . . . . . . . . . . . . . . . . . . . . . . . . . . . . . . . . . . . . 22
Compilation Techniques . . . . . . . . . . . . . . . . . . . . . . . . . . . . . . . . . . . . . . . . . . . . . . . . . . . . . . . . . . . . . . . . . . . . . . . . . . . . . 22
Aquifer Withdrawals . . . . . . . . . . . . . . . . . . . . . . . . . . . . . . . . . . . . . . . . . . . . . . . . . . . . . . . . . . . . . . . . . . . . . . . . . . . . . . . . . . . . . . . 23
Sources of Information . . . . . . . . . . . . . . . . . . . . . . . . . . . . . . . . . . . . . . . . . . . . . . . . . . . . . . . . . . . . . . . . . . . . . . . . . . . . . . 23
Compilation Techniques . . . . . . . . . . . . . . . . . . . . . . . . . . . . . . . . . . . . . . . . . . . . . . . . . . . . . . . . . . . . . . . . . . . . . . . . . . . . . 23
Selected References . . . . . . . . . . . . . . . . . . . . . . . . . . . . . . . . . . . . . . . . . . . . . . . . . . . . . . . . . . . . . . . . . . . . . . . . . . . . . . . . . . . . . . . 24
Supplemental Information . . . . . . . . . . . . . . . . . . . . . . . . . . . . . . . . . . . . . . . . . . . . . . . . . . . . . . . . . . . . . . . . . . . . . . . . . . . . . . . . . . 27
Tables
1. Mandatory and optional data elements for the 2000 national water-use compilation . . . . . . . . . . . . . . 282. List of principal aquifers and aquifer systems by State that are used by the U.S. Geological
Survey for aggregation of 2000 water-use data . . . . . . . . . . . . . . . . . . . . . . . . . . . . . . . . . . . . . . . . . . . . . . . . . . . 313. List of Standard Industrial Classification (SIC) codes by water-use category . . . . . . . . . . . . . . . . . . . . . . 39
v
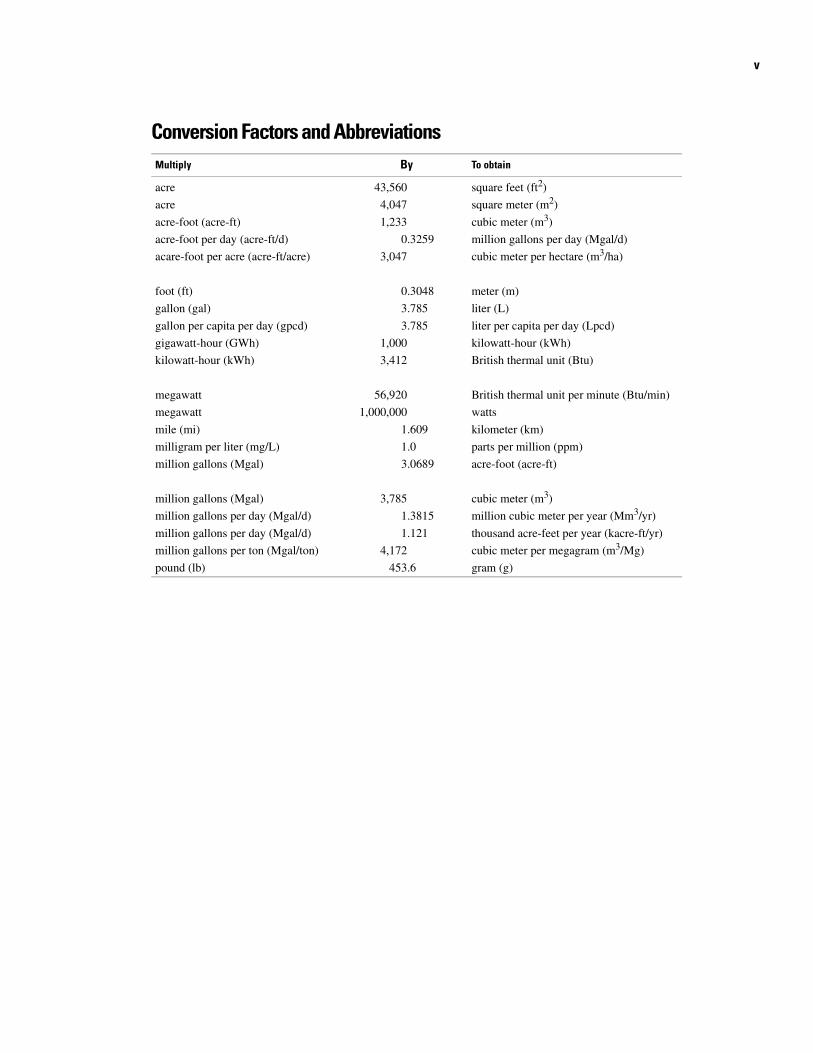
Conversion Factors and AbbreviationsMultiply By To obtain
acre 43,560 square feet (ft2)
acre 4,047 square meter (m2)
acre-foot (acre-ft) 1,233 cubic meter (m3)
acre-foot per day (acre-ft/d) 0.3259 million gallons per day (Mgal/d)
acare-foot per acre (acre-ft/acre) 3,047 cubic meter per hectare (m3/ha)
foot (ft) 0.3048 meter (m)
gallon (gal) 3.785 liter (L)
gallon per capita per day (gpcd) 3.785 liter per capita per day (Lpcd)
gigawatt-hour (GWh) 1,000 kilowatt-hour (kWh)
kilowatt-hour (kWh) 3,412 British thermal unit (Btu)
megawatt 56,920 British thermal unit per minute (Btu/min)
megawatt 1,000,000 watts
mile (mi) 1.609 kilometer (km)
milligram per liter (mg/L) 1.0 parts per million (ppm)
million gallons (Mgal) 3.0689 acre-foot (acre-ft)
million gallons (Mgal) 3,785 cubic meter (m3)
million gallons per day (Mgal/d) 1.3815 million cubic meter per year (Mm3/yr)
million gallons per day (Mgal/d) 1.121 thousand acre-feet per year (kacre-ft/yr)
million gallons per ton (Mgal/ton) 4,172 cubic meter per megagram (m3/Mg)
pound (lb) 453.6 gram (g)

vi

vii
Glossary
A
animal specialties water use Category in previous water-use compilations that included water use associated with fish farming and the raising of horses and fur-bearing animals such as rabbits and pets. For 2000, fish-farming water use is included with the aquaculture cat-egory, and water used for horses and other ani-mals is included in the livestock category. See also aquaculture water use and livestock water use.
aquaculture water use Water used in the pro-duction of organisms that live in water within a confined space and under controlled feeding, sanitation, and harvesting procedures, and establishments primarily engaged in hatching fish and in operating fishing preserves. See also animal specialties water use, commercial water use, fish farms, and fish hatcheries.
aquifer A geologic formation, group of for-mations, or part of a formation that contains sufficient saturated permeable material to yield significant quantities of water to wells and springs.
B
blowdown The continuous or intermittent discharge, or purging, of a small amount of cir-culating water, such as in a boiler. Blowdown normally is expressed as a percentage of the water being circulated. Its purpose is to prevent an increase in the concentration of solids in the water due to evaporation.
C
capacity The average amount of water circu-lating in the cooling system of a thermoelectric
powerplant, usually expressed in gallons per minute.
closed-loop cooling system A cooling system in which water is withdrawn, circulated through heat exchangers, then cooled and recy-cled. Subsequent withdrawals are used to replace water lost to evaporation, blowdown, drift, and leakage.
commercial water use Water used for motels, hotels, restaurants, office buildings, other com-mercial facilities, and institutions. The water may be obtained from a public supply or may be self supplied. In previous compilations, commercial water use included water use by fish hatcheries. See also aquaculture water use, public-supply water use, and self-supplied water.
consumptive use The part of water with-drawn that is evaporated, transpired, incorpo-rated into products or crops, consumed by humans or livestock, or otherwise removed from the immediate water environment. Also referred to as water consumed.
conveyance loss Water that is lost due to leakage or evaporation while in transit through a pipe, canal, conduit, or ditch. Leakage from an irrigation ditch may percolate to a ground-water source and be available for further use.
cooling system Equipment that is used for cooling purposes, such as condensers at power-plants or factories. Includes water intakes and outlets, cooling towers, and cooling ponds.
cooling-system type See closed-loop cooling system and once-through cooling system.
D
deliveries Water distributed by public water suppliers for domestic, commercial, industrial, or thermoelectric uses.
dewatering The removal of water through draining or pumping to lower the water table for mining or agriculture.

viii
dissolved solids A measure of the dissolved minerals and organic matter in water, usually expressed in milligrams per liter (mg/L). Water containing 1,000 mg/L or more dis-solved solids is considered saline in this report.
domestic water use Water used for house-hold purposes, such as drinking, food prepara-tion, bathing, washing clothes and dishes, flushing toilets, and watering lawns and gar-dens. Also called residential water use. The water may be obtained from a public supply or may be self supplied. See also public-supply water use and self-supplied water.
drift Fine water droplets blown out of a cool-ing tower along with exhaust air, usually expressed as a percentage of water circulated.
E
evaporation Process by which water is changed from a liquid into a vapor. See also evapotranspiration and transpiration.
evapotranspiration Water that is vaporized as a result of evaporation from the soil or plant transpiration. See also evaporation and transpiration.
F
fish farms Facilities that produce finfish or shellfish under controlled feeding, sanitation, and harvesting procedures for commercial pur-poses. Water use by fish farms is included in the aquaculture category. See also animal spe-cialties water use, aquaculture water use, and fish hatcheries.
fish hatcheries Facilities that raise fish for later release. Water use by fish hatcheries is included in the aquaculture category. See also aquaculture water use, commercial water use, and fish farms.
freshwater Water that contains less than 1,000 mg/L dissolved solids. Generally, water
with more than 500 mg/L dissolved solids is undesirable for drinking and many industrial uses. See also saline water.
G
gigawatt-hour (GWh) A unit of energy equiv-alent to 1 billion watt-hours.
ground water All subsurface water, distinct from surface water. Specifically, that part of the subsurface water in the saturated zone, which is a zone where all voids are filled with water.
H
hydroelectric power water use The use of water in the generation of electricity at plants where the turbine generators are driven by falling water.
hydrologic cataloging unit An eight-digit cat-aloging unit that identifies a geographic area representing part or all of a surface drainage basin, a combination of basins, or a distinct hydrologic feature. Sometimes known as a watershed.
I
industrial water use Water used for industrial purposes such as fabrication, processing, washing, and cooling, and includes such indus-tries as steel, chemical and allied products, paper and allied products, smelting, and petro-leum refining. The water may be obtained from a public supply or may be self supplied. See also public-supply water use and self-supplied water.
instream use Water that is used within a stream channel for such purposes as hydroelec-tric power generation, navigation, water-
ix
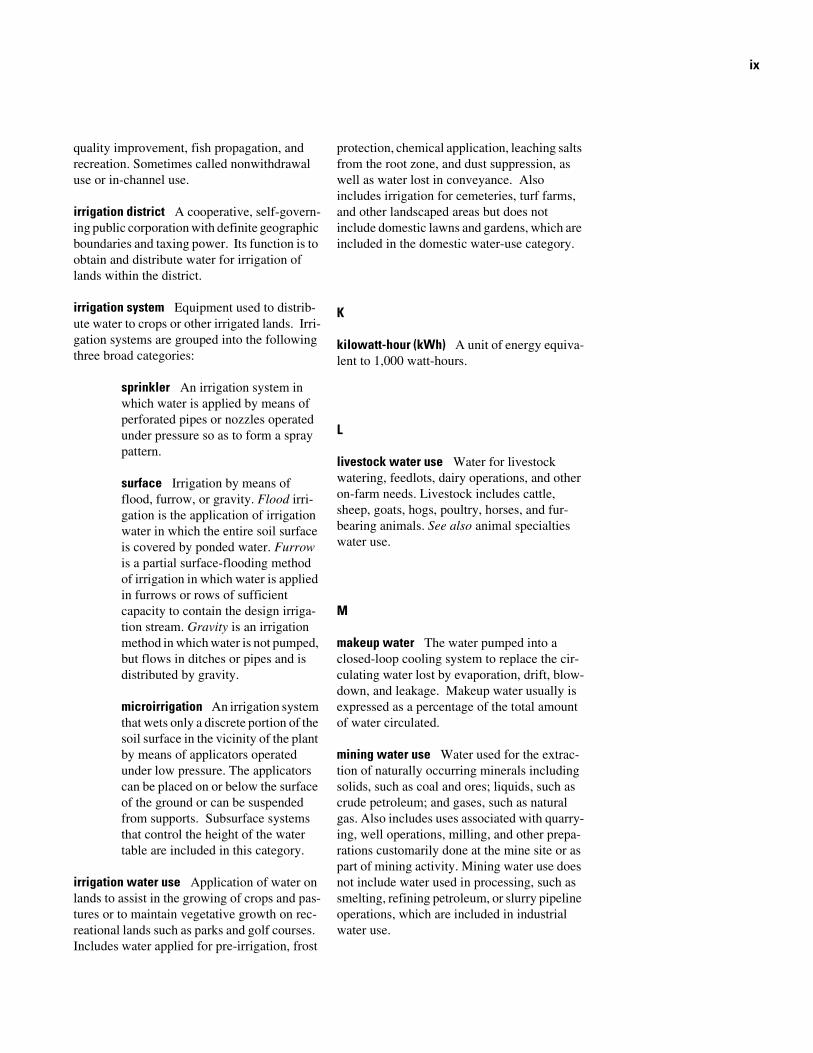
quality improvement, fish propagation, and recreation. Sometimes called nonwithdrawal use or in-channel use.
irrigation district A cooperative, self-govern-ing public corporation with definite geographic boundaries and taxing power. Its function is to obtain and distribute water for irrigation of lands within the district.
irrigation system Equipment used to distrib-ute water to crops or other irrigated lands. Irri-gation systems are grouped into the following three broad categories:
sprinkler An irrigation system in which water is applied by means of perforated pipes or nozzles operated under pressure so as to form a spray pattern.
surface Irrigation by means of flood, furrow, or gravity. Flood irri-gation is the application of irrigation water in which the entire soil surface is covered by ponded water. Furrow is a partial surface-flooding method of irrigation in which water is applied in furrows or rows of sufficient capacity to contain the design irriga-tion stream. Gravity is an irrigation method in which water is not pumped, but flows in ditches or pipes and is distributed by gravity.
microirrigation An irrigation system that wets only a discrete portion of the soil surface in the vicinity of the plant by means of applicators operated under low pressure. The applicators can be placed on or below the surface of the ground or can be suspended from supports. Subsurface systems that control the height of the water table are included in this category.
irrigation water use Application of water on lands to assist in the growing of crops and pas-tures or to maintain vegetative growth on rec-reational lands such as parks and golf courses. Includes water applied for pre-irrigation, frost
protection, chemical application, leaching salts from the root zone, and dust suppression, as well as water lost in conveyance. Also includes irrigation for cemeteries, turf farms, and other landscaped areas but does not include domestic lawns and gardens, which are included in the domestic water-use category.
K
kilowatt-hour (kWh) A unit of energy equiva-lent to 1,000 watt-hours.
L
livestock water use Water for livestock watering, feedlots, dairy operations, and other on-farm needs. Livestock includes cattle, sheep, goats, hogs, poultry, horses, and fur-bearing animals. See also animal specialties water use.
M
makeup water The water pumped into a closed-loop cooling system to replace the cir-culating water lost by evaporation, drift, blow-down, and leakage. Makeup water usually is expressed as a percentage of the total amount of water circulated.
mining water use Water used for the extrac-tion of naturally occurring minerals including solids, such as coal and ores; liquids, such as crude petroleum; and gases, such as natural gas. Also includes uses associated with quarry-ing, well operations, milling, and other prepa-rations customarily done at the mine site or as part of mining activity. Mining water use does not include water used in processing, such as smelting, refining petroleum, or slurry pipeline operations, which are included in industrial water use.

x
N
North American Industry Classification System (NAICS) codes Hierarchical codes established in 1997 by the Office of Manage-ment and Budget in cooperation with its coun-terparts in Canada and Mexico. NAICS are used in the classification of establishments by type of activity in which they are engaged, thus enabling comparison of industries from the three countries. NAICS replaces the Standard Industrial Classification (SIC) system. See also Standard Industrial Classification (SIC) codes.
O
offstream use Water withdrawn or diverted from a surface-water source for public water supply, domestic, industry, irrigation, live-stock, thermoelectric power generation, and other uses. Sometimes called off-channel use or withdrawal.
once-through cooling system A cooling system in which water is withdrawn, circulated through heat exchangers, then returned to a body of water at a higher temperature. Also referred to as an open-loop cooling system.
P
per-capita water use The average amount of water used per person during a standard time period, generally per day. Per-capita use may be calculated on the basis of total water use, public-supply water use, self-supplied domes-tic water use, or domestic deliveries from public supply.
pre-irrigation The application of water to cropland before planting to assure adequate soil moisture for crop germination and early plant growth.
public-supply water use Water withdrawn by public and private water suppliers that furnish water to at least 25 people or have a minimum
of 15 connections. Public suppliers provide water for a variety of uses, such as domestic, commercial, industrial, and thermoelectric power, public use, and losses. See also com-mercial water use, domestic water use, indus-trial water use, thermoelectric power water use, and public water use.
public water use Water provided by a public supply for such uses as firefighting, street washing, water treatment, municipal buildings, parks, and swimming pools. Generally, public water use is not billed by the public water sup-plier. See also public-supply water use.
R
reclaimed wastewater Wastewater-treat-ment plant effluent that has been diverted for beneficial use before it reaches a natural water-way or aquifer.
recycled water Water that is used more than once after withdrawal and before it returns to the natural hydrologic system.
residential water use See domestic water use.
return flow Water that reaches a ground-water or surface-water source after it is released from the point of use, and thus becomes available for further use.
reuse Use of water that has undergone waste-water treatment and is delivered to a user as reclaimed wastewater. See also reclaimed wastewater and recycled water.
S
saline water Water that contains 1,000 mg/L or more dissolved solids. See also freshwater.
self-supplied water Water that is withdrawn directly from a ground-water or a surface-water source by a user, as opposed to water that is delivered by a public supplier.
Index xi
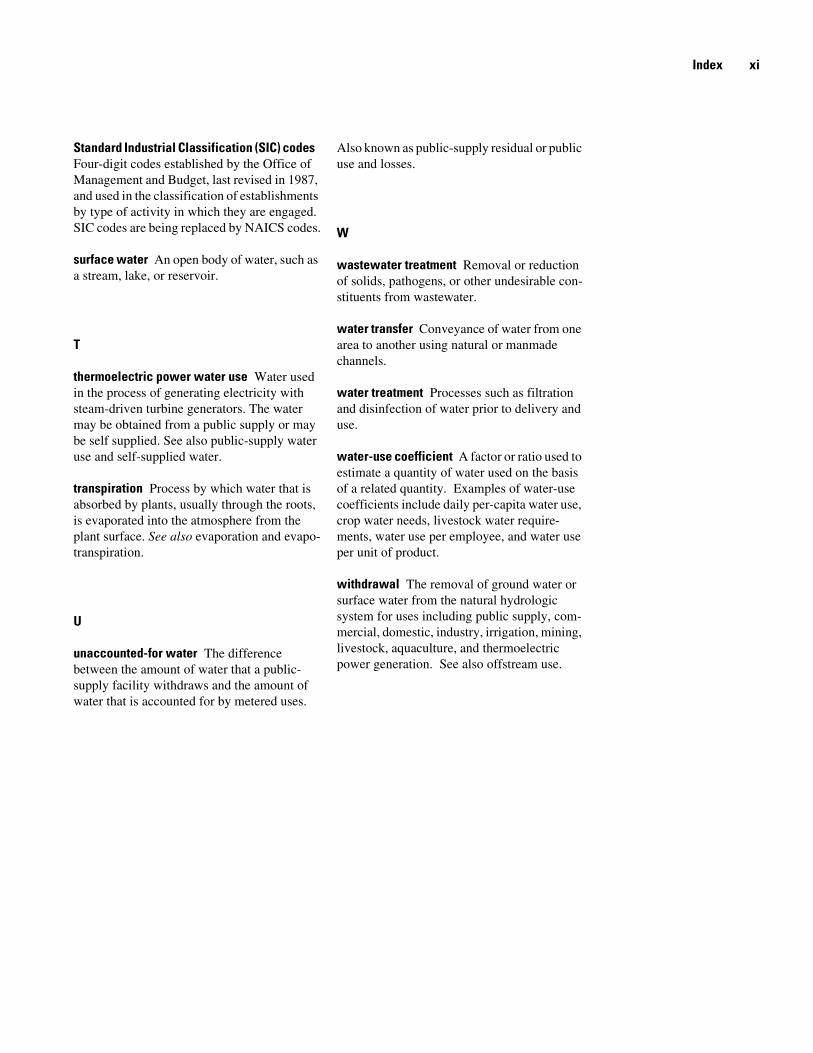
Standard Industrial Classification (SIC) codes Four-digit codes established by the Office of Management and Budget, last revised in 1987, and used in the classification of establishments by type of activity in which they are engaged. SIC codes are being replaced by NAICS codes.
surface water An open body of water, such as a stream, lake, or reservoir.
T
thermoelectric power water use Water used in the process of generating electricity with steam-driven turbine generators. The water may be obtained from a public supply or may be self supplied. See also public-supply water use and self-supplied water.
transpiration Process by which water that is absorbed by plants, usually through the roots, is evaporated into the atmosphere from the plant surface. See also evaporation and evapo-transpiration.
U
unaccounted-for water The difference between the amount of water that a public-supply facility withdraws and the amount of water that is accounted for by metered uses.
Also known as public-supply residual or public use and losses.
W
wastewater treatment Removal or reduction of solids, pathogens, or other undesirable con-stituents from wastewater.
water transfer Conveyance of water from one area to another using natural or manmade channels.
water treatment Processes such as filtration and disinfection of water prior to delivery and use.
water-use coefficient A factor or ratio used to estimate a quantity of water used on the basis of a related quantity. Examples of water-use coefficients include daily per-capita water use, crop water needs, livestock water require-ments, water use per employee, and water use per unit of product.
withdrawal The removal of ground water or surface water from the natural hydrologic system for uses including public supply, com-mercial, domestic, industry, irrigation, mining, livestock, aquaculture, and thermoelectric power generation. See also offstream use.

xii

Guidelines for Preparation of State Water-Use Estimates for 2000
Edited by Joan F. Kenny
Abstract
This report describes the water-use categories and data ele-ments required for the 2000 national water-use compilation conducted by the U.S. Geological Survey (USGS) as part of its National Water Use Information Program. It identifies sources of water-use information, guidelines for estimating water use, and required documentation for preparation of the national compilation by State for the United States, the District of Columbia, Puerto Rico, and the U.S. Virgin Islands. The data are published in USGS Circular 1268, Estimated Use of Water in the United States in 2000. USGS has published circulars on estimated use of water in the United States at 5-year intervals since 1950.
As part of this USGS program to document water use on a national scale for the year 2000, all States prepare estimates of water withdrawals for public supply, industrial, irrigation, and thermoelectric power generation water uses at the county level. All States prepare estimates of domestifc use and population served by public supply at least at the State level. All States provide estimates of irrigated acres by irrigation system type (sprinkler, surface, or microirrigation) at the county level. County-level estimates of withdrawals for mining, livestock, and aquaculture uses are compiled by selected States that com-prised the largest percentage of national use in 1995 for these categories, and are optional for other States. Ground-water withdrawals for public-supply, industrial, and irrigation use are aggregated by principal aquifer or aquifer system, as identified by the USGS Office of Ground Water.
Some categories and data elements that were mandatory in previous compilations are optional for the 2000 compilation, in response to budget considerations at the State level. Optional categories are commercial, hydroelectric, and wastewater treat-ment. Estimation of deliveries from public supply to domestic, commercial, industrial, and thermoelectric uses, consumptive use for any category, and irrigation conveyance loss are optional data elements. Aggregation of data by the eight-digit hydrologic cataloging unit is optional.
Water-use data compiled by the States are stored in the USGS Aggregated Water-Use Data System (AWUDS). This database is designed to store both mandatory and optional data elements. AWUDS contains several routines that can be used for quality assurance and quality control of the data, and also
produces tables of water-use data compiled for 1985, 1990, 1995, and 2000. These water-use data are used by USGS, other agencies, organizations, academic institutions, and the public for research, water-management decisions, trend analysis, and forecasting.
Introduction
The U.S. Geological Survey (USGS) has compiled and published estimates of water use for the Nation at 5-year inter-vals since 1950. In 1977, the Congress provided funding for USGS to establish the National Water Use Information Pro-gram, which is a cooperative effort with States to collect reli-able and uniform water-use information. Data collected for each State in the United States, the District of Columbia, Puerto Rico, and the U.S. Virgin Islands are presented in USGS Circu-lars entitled, Estimated Use of Water in the United States (MacKichan, 1951, 1957; MacKichan and Kammerer, 1961; Murray, 1968; Murray and Reeves, 1972, 1977; Solley and oth-ers 1983, 1988, 1993, 1998; and Hutson and others, 2004). The circular for 2000 marks the completion of a 50-year span of national water-use reports in this series.
Estimates of ground-water and surface-water withdrawals are mandatory for all States for the public-supply, domestic, industrial, irrigation, and thermoelectric power categories. Ground-water withdrawal estimates from principal aquifers or aquifer systems (U.S. Geological Survey, 2003) are mandatory for the public-supply, industrial, and irrigation categories. Esti-mates of ground-water and surface-water withdrawals for the mining, livestock, and aquaculture categories are mandatory for selected States and optional for all other States. The commer-cial, hydroelectric power, and wastewater treatment categories are optional for all States and are not included in the circular for 2000. This report describes guidelines for estimating data for the categories that are mandatory for all or selected States.
In some States, water-use information for many categories is collected by government agencies, universities, or private organizations. For other categories, water-use information may be obtained from multiple sources or estimated using coeffi-cients and ancillary data. Water-use project chiefs in each USGS State office are familiar with the availability and reliabil-ity of information in their own States and work with their coop-

2 Guidelines for Preparation of State Water-Use Estimates for 2000
erators to produce reliable estimates of water use. This infor-mation may be electronically stored in databases developed by individual States or by the USGS.
The Aggregate Water-Use Data System (AWUDS) is a USGS database that is specifically designed to store and manip-ulate the aggregate water-use information compiled for the 5-year reports. AWUDS also is capable of storing annual aggre-gate water-use data. During previous compilations, estimates of water use were aggregated by county and hydrologic cataloging unit within each State, and published by State and water-resources region. For the 2000 compilation, water-use estimates that are aggregated by county or State are published by State. Estimates of ground-water use that are aggregated by principal aquifer or aquifer system are published in a separate report.
Purpose and Scope
The purpose of this report is to provide guidelines for prep-aration of State water-use estimates. Water-use categories, data elements, aggregation levels, and documentation requirements for the 2000 national water-use compilation are defined. This information is useful both to those who prepare the estimates and to those who use the data. The scope of the 2000 compila-tion was modified from previous years in response to budget considerations and concentrates on withdrawals for the public-supply, domestic, industrial, irrigation, and thermoelectric power water-use categories in each State. Withdrawals for the livestock, aquaculture, and mining water-use categories are mandatory for selected States comprising at least 75 percent of those category totals for 1995, and fewer data elements and aggregation levels are compiled for some categories. With-drawal estimates are aggregated at the county, State, or aquifer level. Aggregation by hydrologic cataloging unit (described in Seaber and others, 1987) is optional. Estimates of consumptive use, irrigation conveyance loss, reclaimed wastewater, and deliveries from public water suppliers also are optional for the 2000 compilation. Efforts have been made to improve quality assurance/quality control of the estimates and to ensure ade-quate documentation of data sources and compilation methods.
This report also summarizes guidance provided to USGS State water-use project chiefs in the effort to compile nationally consistent water-use estimates for the report Estimated Use of Water in the United States in 2000 (Hutson and others, 2004), hereinafter referred to as USGS Circular 1268. This guidance was prepared by regional water-use specialists, with support from the USGS Office of Ground Water, and was presented to personnel in each USGS State office at the start of the compila-tion effort to describe consistent procedures for completing the 2000 estimates. The methods presented were general in nature and were not intended to replace more specific or detailed meth-odologies that may be used by some project chiefs. Because data availability and reliability vary from State to State, each project chief documented the specific sources of data and com-pilation methods. These unpublished documents are main-
tained by each State as a reference for current data and as a start-ing point for continued data collection.
Acknowledgments
This report was edited by Joan F. Kenny from material developed over time by personnel from the USGS National Water Use Information Program. Contributors to this text include Nancy L. Barber, E. James Crompton, Terrance W. Holland, Susan S. Hutson, Joan F. Kenny, Kristin S. Linsey, Deborah S. Lumia, Molly A. Maupin, Wayne B. Solley, and William E. Templin.
Water-Use Compilation Requirements for 2000
Water-Use Categories and Data Elements
Water-use categories for which data may be collected for the 2000 compilation and the data elements included in each category are summarized in table 1 in the "Supplemental Infor-mation" section at the back of this report. The national dataset presented in USGS Circular 1268 consists of the mandatory data elements for the public-supply, domestic, industrial, irriga-tion, thermoelectric power, mining, livestock, and aquaculture water-use categories. State data sets may include any optional data elements and categories for which the State project chiefs compiled information.
Ground- and surface-water withdrawal estimates for the public-supply, industrial, irrigation, and thermoelectric power categories are mandatory at the county level for all States. Esti-mates of fresh ground-water withdrawals for the public-supply, irrigation, and industrial categories also are compiled by princi-pal aquifer or aquifer system in all States.
Total population served by public water suppliers is man-datory at the State level only. States optionally may compile individual county estimates for population served by public supply, as well as separate populations served by ground and surface water.
Withdrawal estimates for domestic use are mandatory at the State level only. Self-supplied domestic population is calcu-lated as the difference between total State population and pop-ulation served by public suppliers. States optionally may com-pile county estimates for domestic withdrawals. If the population served is estimated by county, then self-supplied population is calculated by county. Aggregation of domestic ground-water withdrawals by principal aquifer also is optional.
Mandatory water-use categories for selected States are mining, livestock, and aquaculture. Withdrawal estimates for the mining, livestock, and aquaculture categories are mandatory at the county level for those States comprising more than 75 percent of the 1995 national total for those uses. Data for these three categories optionally may be compiled for other

Water-Use Compilation Requirements for 2000 3
States but are included in the national data set only if collected for the entire State. Estimates of ground-water withdrawals by principal aquifer also are optional for these categories.
Compilation of saline withdrawals, defined as water with dissolved solids of 1,000 mg/L or more, is mandatory for the industrial, thermoelectric power, and mining categories in States where saline water is used. Saline withdrawals for public supply are included with estimates of freshwater withdrawals or optionally may be stored separately in AWUDS.
The commercial, hydroelectric power, and wastewater treatment categories are optional for the 2000 compilation, although estimates for these categories may be compiled and stored in the AWUDS database. Estimates of reservoir evapo-ration, a category included in previous compilations, are not made for 2000, and this category cannot be stored in AWUDS.
Estimates of consumptive use, irrigation conveyance loss, reclaimed wastewater, and deliveries from public suppliers are optional for the 2000 compilation. Although these data ele-ments are important, insufficient information is available in many cases to make these estimates consistently in all States. Estimates aggregated by eight-digit hydrologic cataloging unit are optional. These minimum requirements for the 2000 national compilation are designed to allow for a more cost-effective and nationally consistent product from individual States. The modified approach is not intended to limit any efforts to meet the needs of local programs and cooperators.
Units of Measurement
Water withdrawals are reported in million gallons per day (Mgal/d). Population is reported in thousands of people. Acres irrigated are reported in thousand acres. All values are reported to two places after the decimal point. A value of zero usage for a data element indicates either no usage, usage of less than 0.01 Mgal/d, or that no data are collected.
Aggregation Levels
Withdrawals for the public-supply, irrigation, industrial, thermoelectric power, mining, livestock, and aquaculture cate-gories are compiled at the county level for each State. For this compilation, the District of Columbia, Puerto Rico, and the Vir-gin Islands are treated as States, and Louisiana parishes and Alaska boroughs are treated as counties. Domestic withdrawals and population served by public supply are mandatory at least at the State level but may be compiled at the county level. All data are summarized and published in USGS Circular 1268 at the State level.
Estimates of ground-water withdrawals of freshwater for public supply, industrial, and irrigation uses are aggregated for approximately 68 principal aquifers and aquifer systems, listed in table 2 (in the "Supplemental Information" section), that are identified in the National Atlas (U.S. Geological Survey, 2003). A designation of "other" is used to aggregate any withdrawals
that cannot be assigned to one of these principal aquifers or aquifer systems.
AWUDS Database
Aggregate water-use data have been stored electronically by the USGS since 1980. The AWUDS database was created in 1985 to store data aggregated by county or hydrologic catalog-ing unit. AWUDS was redesigned for 2000 and released as a personal computer-based system installed in each USGS State office. State water-use project chiefs are required to enter aggregate data by county or State for all mandatory water-use categories into the AWUDS database. Additionally, AWUDS is able to store any optional data aggregated by county, aquifer, or eight-digit hydrologic cataloging unit that the State water-use project chiefs may collect.
Water-use data for years other than the compilation years may be stored in the redesigned AWUDS database, which allows greater utility of the software for individual State water-use programs. Data may be entered and edited interactively or imported from external files. AWUDS can generate various reports to table the data by category or area, show entered data elements, and provide calculated values for certain categories. Quality-assurance programs within AWUDS include checks for erroneous values, comparison of totals by area, and comparison of data between 2 years.
Documentation
Documentation of data sources and compilation methods for each State is required as part of the 2000 compilation. Doc-umentation of how the data are compiled serves to substantiate the data published in USGS Circular 1268 and provides a valu-able record for subsequent compilations.
The format for each State's documentation is determined by the water-use project chief. All documentation must include the following elements:
• Sources of data and coefficients used;
• Agency and contact information;
• Methods of compiling and estimating data; and
• Location and types of data files.
State water-use project chiefs are required to transmit completed documentation in electronic form to the respective USGS regional water-use specialist. If the 2000 water-use esti-mates differ substantially from those reported in 1995, possible explanations are to be identified in this documentation.

4 Guidelines for Preparation of State Water-Use Estimates for 2000
Compilation Methods
General Techniques
For many categories, water-use data can be collected by either a site-specific inventory or a representative survey. The most accurate and desirable compilation technique is a com-plete site-specific inventory, which can be aggregated to the desired level. In many States, site-specific data are unavailable, incomplete, or only available aggregated by political units. For some categories, site-specific data are available only for the largest users; this partial site-specific inventory may account for much of the water used in a particular category. A representa-tive survey is a selective sampling of typical water users in a water-use category. Representative site-specific data are col-lected and used to develop water-use coefficients (for example, water used per person during a specified period of time) related to known ancillary information such as population, number of employees, crop acreages, or livestock counts. For example, a coefficient of water use per person in a specified period of time can be used to estimate domestic water use by a known popula-tion. Water use can be estimated in areas that lack site-specific data by using coefficients developed in areas with good data. This method provides acceptable results if the water-use and ancillary data characteristics are similar for the different areas.
In some cases, no site-specific data are available for a cat-egory. Water withdrawals may be estimated entirely on the basis of ancillary data and water-use coefficients. This tech-nique is acceptable if the ancillary data are uniformly available for a State and the coefficients are documented.
The 2000 national compilation requires assimilation of a large amount of information. To produce the most complete and defensible data for each State, the greatest effort and time are spent collecting information about the largest users and the largest categories of use in individual States. Compilation of accurate data for the largest public suppliers, industries, agricul-tural regions, and powerplants produces State totals that are fairly reliable. As time and resources permit, data on smaller users within each category are collected.
A glossary of terms used in this report and in preparing estimates of water use is shown at the front of this report. The glossary is not all-inclusive but focuses on terms commonly used to explain or describe water-use characteristics. Some terms that are defined but not used in this report represent usage from previous compilations.
Internet Resources
Numerous agencies and organizations are listed in this report as possible sources of information for compiling water-related data for the various categories of use. Many of these agencies and organizations maintain information and databases on the Internet. Specific Internet addresses are listed in this report as they appeared on the date last accessed.
Withdrawals by Aquifer
Fresh ground-water withdrawals by principal aquifer or aquifer system for the categories of public supply, industry, and irrigation are mandatory for the 2000 national water-use compi-lation. Estimates of saline ground-water withdrawals are not aggregated by principal aquifer or aquifer system. Generally, total ground-water withdrawals by category are estimated first and then allocated among the principal aquifers or aquifer sys-tems identified for each State. In the absence of site-specific data, the preferred approach is to: (1) determine fresh ground-water withdrawals for these three categories, usually at the county level, using the best available data, (2) integrate infor-mation about aquifer properties (areal extent, water quality, and depth to water) with information about the water-use categories, and (3) allocate withdrawals to the appropriate aquifers. Some methods developed for assigning withdrawals to principal aqui-fers, as well as evaluating their accuracy and reliability, are described in the "Aquifer Withdrawals" section of this report. Estimates of aquifer withdrawals are reviewed for reasonability by USGS staff in each State office.
Quality Assurance/Quality Control
Quality assurance/quality control (QA/QC) is an important step in the compilation of water-use estimates. Errors can occur in both the compilation of the data and also in data entry. The following basic checks can be made during data compilation and after AWUDS data entry.
• Use AWUDS quality-assurance programs to check for erroneous data and to compare State totals with aquifer totals by category.
• Review spatial distribution of data using choropleth or other types of geographic information system (GIS) maps.
• Compare 2000 data with those from the previous com-pilations. Examine changes on the basis of percentage change, statistical analysis, or general patterns within a State.
• Use sorting routines to check for possible errors in larg-est and smallest withdrawals.
• Examine calculated values such as per-capita use and irrigation application rates.
• Check county and State data for population served to ensure that they do not exceed total census populations.
Industrial Classification Coding Systems
The Standard Industrial Classification (SIC) coding sys-tem was developed to promote the comparability of establish-ment data describing various facets of the United States econ-omy (Office of Management and Budget, 1987). The SIC system was intended to cover the entire field of economic activ-

Public Supply 5
ities—agriculture, forestry, fishing, hunting, and trapping; min-ing; construction; manufacturing; transportation, communica-tions, electric, gas, and sanitary services; wholesale trade; retail trade; finance, insurance, and real estate; personal, business, professional, repair, recreation, and other services; and public administration. The SIC system is based on the primary activity in which the industry is engaged. The structure of the classifi-cation makes it possible to tabulate, analyze, and publish indus-try data on the basis of a two-digit major group, a three-digit industry group, or a four-digit industry code.
The USGS has assigned each four-digit industry code in the 1987 SIC manual (Office of Management and Budget, 1987) to a water-use category. In some cases, a code may be listed under more than one water-use category. The SIC codes can be useful for assigning withdrawals to the public supply, industrial, mining, and thermoelectric power categories. A list of SIC codes by water-use category is shown in table 3 in the "Supplemental Information" section at the back of this report.
A newer system of classification, the North American Industry Classification System (NAICS), went into effect in 1997 in the United States. Descriptions of the NAICS codes and correlation with SIC codes are published by the U.S. Cen-sus Bureau (2000, 2002). However, USGS water-use project chiefs may continue to identify industries using SIC codes for the 2000 compilation.
Public Supply
Category Description
Public supply refers to water withdrawn from ground and surface sources by public and private water systems for use by cities, towns, rural water districts, mobile-home parks, Indian reservations, and military bases. Public-supply facilities pro-vide water to at least 25 people or have a minimum of 15 service connections, and are classified as SIC 4941 (table 3). Water withdrawn by public suppliers may be delivered to users for domestic, commercial, industrial, and thermoelectric purposes, as well as to other public water suppliers. Some public supply water is used for water treatment, wastewater treatment, public services such as pools, parks, and city buildings, or is lost through system leaks, unmetered services, and maintenance.
Data Elements
Mandatory
• Ground-water withdrawals, freshwater, by county
• Surface-water withdrawals, freshwater, by county
• Ground-water withdrawals, freshwater, by aquifer
• Total population served, by State
Optional
• Population served, by county
• Population served by ground water, by county
• Population served by surface water, by county
• Ground-water withdrawals, saline water, by county
• Surface-water withdrawals, saline water, by county
• Number of facilities, by county
• Reclaimed wastewater, by county
• Any data aggregated by hydrologic cataloging unit
Sources of Information
Information on public-supply withdrawals, sources of water, and population served may be obtained from a variety of sources. The following lists some of the most commonly used sources of data for the compilation. This list is not all inclusive, and USGS water-use project chiefs are encouraged to investi-gate any other potential sources of information available for their States.
• Individual public water suppliers
• State agencies that administer water rights, allocate water to users, or collect water-use data
• State agencies that enforce the Safe Drinking Water Act and issue permits for water discharge
• State agencies that regulate utility rates
• County planning and zoning agencies
• Community planning and development agencies
• U.S. Census Bureau: <http://www.census.gov/>
American FactFinder database, the U.S. Census Bureau's online data source, containing information on population and housing: <http://factfinder.census.gov/home/saff/main.html?_lang=en>
• U.S. Environmental Protection Agency (USEPA): <http://www.epa.gov/> Safe Drinking Water Information System (SDWIS):
Access to data that States must report to USEPA as required by the Safe Drinking Water Act.
Safe Drinking Water Query Form: <http://www.epa.gov/enviro/html/sdwis/sdwis_query.html> Search the SDWIS database for selected informa-tion. Includes data on water system name, county, population served, and primary water source type. Includes community/noncommunity and transient/nontransient water systems.
Office of Ground Water and Drinking Water: <http://www.epa.gov/OGWDW/>
6 Guidelines for Preparation of State Water-Use Estimates for 2000
Water Discharge Permits, Permit Compliance System (PCS) database: <http://www.epa.gov/enviro/html/pcs/pcs_query_java.html>
Access to data regarding facilities holding National Pollutant Discharge Elimination System (NPDES) permits. Specify the facilities by using any combi-nation of facility name, geographic location, SIC code, and chemicals.
When a list of water systems is retrieved for a spe-cific State, the State agency responsible for regulat-ing drinking water will be stated at the top of the list.
• American Water Works Association: <http://www.awwa.org/>
Links to local Web sites and contacts: <http://www.awwa.org/sections/sechome.htm>
Links to information on individual public suppliers: <http://www.awwa.org/community/links.cfm>
• Association of State Drinking Water Administrators (ASDWA):
<http://www.asdwa.org/>
Links to a variety of Web resources including a page with links for each State's drinking water program pages and the primary State agency responsible for drinking water.
• National Rural Water Association: <http://www.nrwa.org/>
• Organizations whose membership rosters include public or private utilities, such as League of Municipal-ities or State Rural Water Associations.
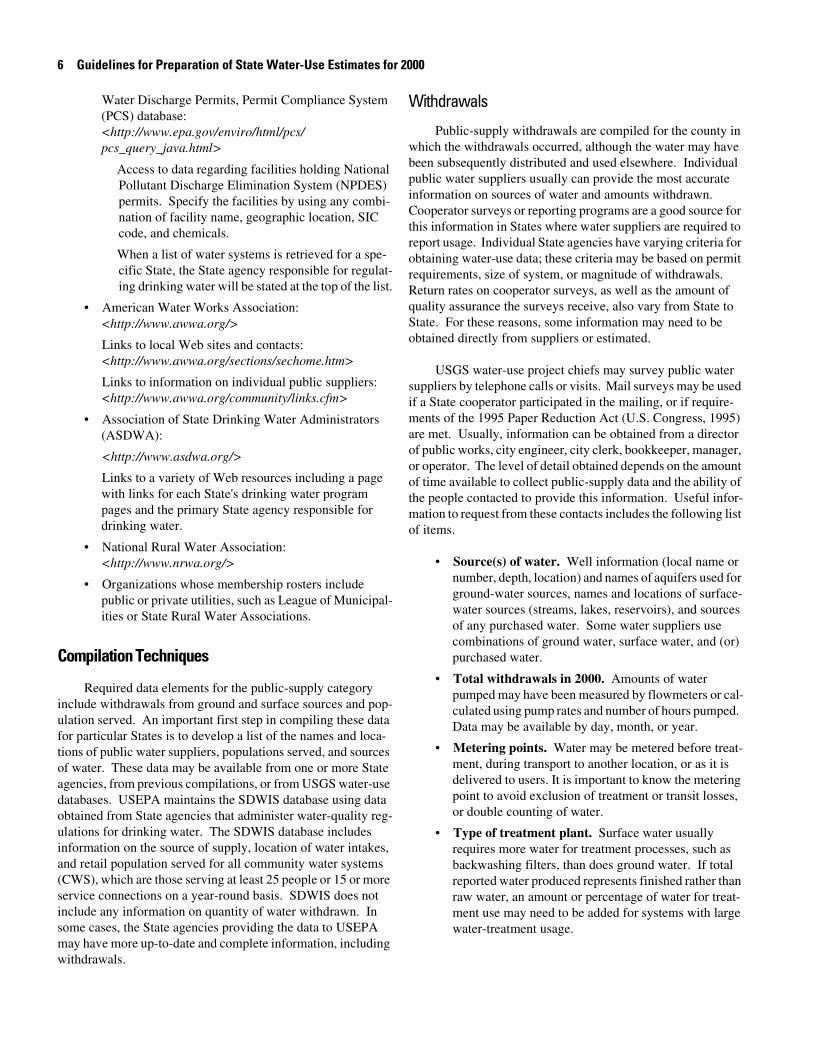
Compilation Techniques
Required data elements for the public-supply category include withdrawals from ground and surface sources and pop-ulation served. An important first step in compiling these data for particular States is to develop a list of the names and loca-tions of public water suppliers, populations served, and sources of water. These data may be available from one or more State agencies, from previous compilations, or from USGS water-use databases. USEPA maintains the SDWIS database using data obtained from State agencies that administer water-quality reg-ulations for drinking water. The SDWIS database includes information on the source of supply, location of water intakes, and retail population served for all community water systems (CWS), which are those serving at least 25 people or 15 or more service connections on a year-round basis. SDWIS does not include any information on quantity of water withdrawn. In some cases, the State agencies providing the data to USEPA may have more up-to-date and complete information, including withdrawals.
Withdrawals
Public-supply withdrawals are compiled for the county in which the withdrawals occurred, although the water may have been subsequently distributed and used elsewhere. Individual public water suppliers usually can provide the most accurate information on sources of water and amounts withdrawn. Cooperator surveys or reporting programs are a good source for this information in States where water suppliers are required to report usage. Individual State agencies have varying criteria for obtaining water-use data; these criteria may be based on permit requirements, size of system, or magnitude of withdrawals. Return rates on cooperator surveys, as well as the amount of quality assurance the surveys receive, also vary from State to State. For these reasons, some information may need to be obtained directly from suppliers or estimated.
USGS water-use project chiefs may survey public water suppliers by telephone calls or visits. Mail surveys may be used if a State cooperator participated in the mailing, or if require-ments of the 1995 Paper Reduction Act (U.S. Congress, 1995) are met. Usually, information can be obtained from a director of public works, city engineer, city clerk, bookkeeper, manager, or operator. The level of detail obtained depends on the amount of time available to collect public-supply data and the ability of the people contacted to provide this information. Useful infor-mation to request from these contacts includes the following list of items.
• Source(s) of water. Well information (local name or number, depth, location) and names of aquifers used for ground-water sources, names and locations of surface-water sources (streams, lakes, reservoirs), and sources of any purchased water. Some water suppliers use combinations of ground water, surface water, and (or) purchased water.
• Total withdrawals in 2000. Amounts of water pumped may have been measured by flowmeters or cal-culated using pump rates and number of hours pumped. Data may be available by day, month, or year.
• Metering points. Water may be metered before treat-ment, during transport to another location, or as it is delivered to users. It is important to know the metering point to avoid exclusion of treatment or transit losses, or double counting of water.
• Type of treatment plant. Surface water usually requires more water for treatment processes, such as backwashing filters, than does ground water. If total reported water produced represents finished rather than raw water, an amount or percentage of water for treat-ment use may need to be added for systems with large water-treatment usage.
Public Supply 7
• Names of other water suppliers and amounts of water transferred. Many water suppliers purchase and sell water.
• Numbers of service connections of various types. Numbers of active residential meters, including single-family and multi-family housing, are useful for deter-mining population served. Numbers of commercial and industrial connections are useful for determining component uses that affect the magnitude of withdraw-als.
• Amounts of water sold in 2000 to various end uses. Deliveries include residential, commercial, industrial, and free or public uses. If delivery information is avail-able, it can be used to develop water-use coefficients for estimating withdrawals from similar, nonsurveyed suppliers. Data on total metered uses also can be sub-tracted from total withdrawals to determine amounts of unaccounted for water.
• Locations of retail service areas. Many public water suppliers serve customers outside city limits or in mul-tiple counties or States.
The largest water suppliers should be contacted to obtain data or to verify data obtained from State agencies or other data-bases. Any estimation of withdrawals for large suppliers should consider the variable amounts of water that may be sold to other suppliers, delivered to residential, commercial, industrial, or thermoelectric power users, used for public uses, and lost. For smaller public water suppliers that are not surveyed, water use may be estimated on the basis of water allocations, average pro-duction values, previously reported usage, or population changes. If estimates are based on residential use in nonsur-veyed systems, estimates of other types of deliveries, public use, and system losses should be added to these estimates to approximate total water use. Information on commercial and industrial activity may be derived from local knowledge, State directories of business and manufacturers, or purchased data-bases.
The difference between total raw water and metered uses often is referred to as "unaccounted for" water, a term that is equivalent to "public use and losses" in USGS Circular 1200 for 1995 water use (Solley and others, 1998). This publication indi-cates that public use and losses averaged 15 percent of public-supply withdrawals in the United States in 1995 (Solley and others, 1998). Public use and losses vary substantially among water suppliers, depending on treatment needs, system effi-ciency, and the amount of public water use. In general, systems that withdraw surface water have greater losses due to treatment than do systems that withdraw ground water. Older systems and those that are undergoing repairs to lines or towers have greater losses due to leaks, flushing, and tower draining than systems with few problems. Public uses include water, often used free of charge, for public buildings, fire fighting, irrigation of city parks, golf courses and ball fields, municipal pools, and water treatment and wastewater treatment. Unless a water sup-
plier meters its free uses, public use and system losses cannot be identified separately.
Information on water transfers is very important for esti-mating public-supply withdrawals. Estimates of total water use for suppliers using a combination of their own withdrawals and purchased water, or for those selling water wholesale, need to be adjusted to identify withdrawals by county in which they occur.
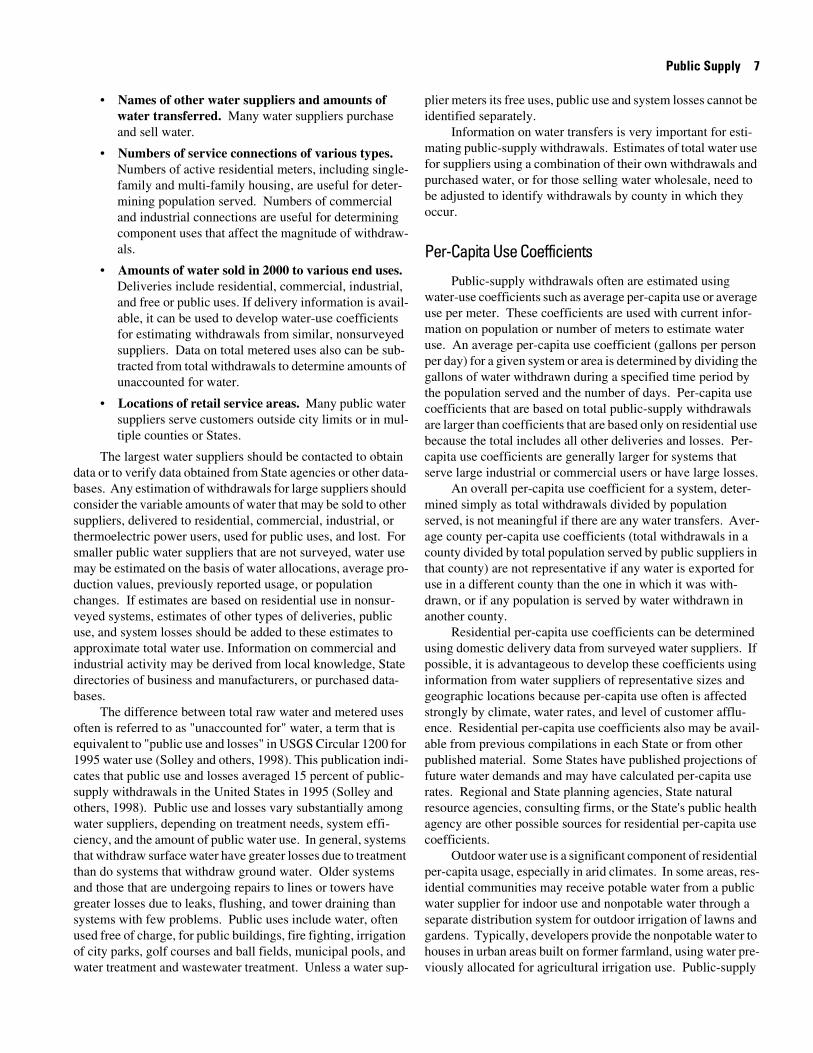
Per-Capita Use Coefficients
Public-supply withdrawals often are estimated using water-use coefficients such as average per-capita use or average use per meter. These coefficients are used with current infor-mation on population or number of meters to estimate water use. An average per-capita use coefficient (gallons per person per day) for a given system or area is determined by dividing the gallons of water withdrawn during a specified time period by the population served and the number of days. Per-capita use coefficients that are based on total public-supply withdrawals are larger than coefficients that are based only on residential use because the total includes all other deliveries and losses. Per-capita use coefficients are generally larger for systems that serve large industrial or commercial users or have large losses.
An overall per-capita use coefficient for a system, deter-mined simply as total withdrawals divided by population served, is not meaningful if there are any water transfers. Aver-age county per-capita use coefficients (total withdrawals in a county divided by total population served by public suppliers in that county) are not representative if any water is exported for use in a different county than the one in which it was with-drawn, or if any population is served by water withdrawn in another county.
Residential per-capita use coefficients can be determined using domestic delivery data from surveyed water suppliers. If possible, it is advantageous to develop these coefficients using information from water suppliers of representative sizes and geographic locations because per-capita use often is affected strongly by climate, water rates, and level of customer afflu-ence. Residential per-capita use coefficients also may be avail-able from previous compilations in each State or from other published material. Some States have published projections of future water demands and may have calculated per-capita use rates. Regional and State planning agencies, State natural resource agencies, consulting firms, or the State's public health agency are other possible sources for residential per-capita use coefficients.
Outdoor water use is a significant component of residential per-capita usage, especially in arid climates. In some areas, res-idential communities may receive potable water from a public water supplier for indoor use and nonpotable water through a separate distribution system for outdoor irrigation of lawns and gardens. Typically, developers provide the nonpotable water to houses in urban areas built on former farmland, using water pre-viously allocated for agricultural irrigation use. Public-supply

8 Guidelines for Preparation of State Water-Use Estimates for 2000
per-capita use coefficients in these "dual-use" areas generally are lower than in areas where customers use publicly supplied water for both indoor and outdoor irrigation uses.
Population Served
Populations served by public suppliers are estimated for all public water suppliers regardless of the source of their water (ground water, surface water, purchased water, or a combina-tion). Population served refers to the resident population receiving water at retail from a public supplier on a year-round basis and excludes vacationers and second-home owners. Peo-ple living on military bases, on Indian reservations, and in pris-ons constitute a population served by the supplier serving these communities. Population served is compiled in the county of residence, which is not necessarily where the withdrawals occur.
For the 2000 compilation, population served is required to be reported at the State level. However, a valid State total depends on collection of information for individual water sup-pliers. Information on populations served may be obtained from the U.S Census Bureau, individual public water suppliers, State cooperators, or SDWIS. Reported populations from each of these sources need to be checked for reliability. Service areas for many public suppliers do not correspond to political bound-aries such as city limits or county lines; therefore, census popu-lations need to be adjusted to accommodate customers living outside city or county lines to account for total population served. For water suppliers with service areas that span more than one county, an estimate is made of the population residing in each county.
Populations served also can be estimated on the basis of numbers of occupied residential connections. This technique is useful for determining population in service areas for which no precise population is available, such as large water suppliers that serve parts of multiple metropolitan areas, rural water dis-tricts, and self-supplied housing developments. Individual water suppliers can provide numbers of residential service con-nections, which may include multi-family dwellings. Census data on housing characteristics for incorporated places include ratios of average persons per occupied residential connection. Populations reported by public water suppliers may be over reported if they are estimated using ratios of people per house-hold that are too large. Other errors may be caused by double counting people served by more than one system or by whole-sale supplies. A population figure may have been reported by each of several suppliers whose service areas overlap. Popula-tions reported by a supplier providing wholesale supplies to other systems may erroneously include both retail and whole-sale populations and need to be adjusted.
Errors in reported populations served can be detected when comparing aggregated county population served to total county census populations. This comparison is needed for qual-ity assurance of the State total. County population served can-
not exceed the total county population. State population served cannot exceed the total State population.
Domestic
Category Description
Domestic water use is water used for both indoor and out-door household purposes. Common indoor uses include drink-ing, food preparation, bathing, washing clothes and dishes, and flushing toilets. Major outdoor uses include watering lawns and gardens and washing cars. Water for domestic water use may be delivered from a public supplier or self supplied if obtained from a private source such as a well.
Data Elements
Mandatory
• Ground-water withdrawals, freshwater, by State
• Surface-water withdrawals, freshwater, by State
Optional
• Ground-water withdrawals, freshwater, by county
• Surface-water withdrawals, freshwater, by county
• Deliveries from public supply, by county
• Consumptive use, by county
• Any data aggregated by hydrologic cataloging unit
Sources of Information
Information concerning domestic water use may be obtained from the sources in the following list. This list is not all inclusive, and water-use project chiefs are encouraged to investigate any other potential sources of information available for their States.
• Well records of individual households from cooperator permits
• Water supplier records of residential use
• Water supplier records of population served
• State pollution control agencies
• State agency responsible for water permitting
• Ground-water resources studies
• Local chamber of commerce
• State public health agencies
• Sewage treatment facilities
• Tax appraiser data

Domestic 9
• Planning agencies
• U.S. Census Bureau: <http://www.census.gov/>
American FactFinder, the U.S. Census Bureau's online data source: <http://factfinder.census.gov/home/saff/main.html?_lang=en>
Summary File 1, in "Data Sets," includes selected pop-ulation and housing characteristics to the block/census tract level.
• American Water Works Association: <http://www.awwa.org/>
Water-use coefficients: <http://www.awwa.org/Advocacy/pressroom/index.cfm>
WaterWiser, the Water Efficiency Clearinghouse: <http://www.waterwiser.org/>
• U.S. Environmental Protection Agency (USEPA): <http://www.epa.gov/>
Water Discharge Permits, Permit Compliance System (PCS) database: <http://www.epa.gov/enviro/html/pcs/pcs_query_java.html> Access to data regarding facilities holding National Pollutant Discharge Elimination System (NPDES) per-mits. Specify the facilities by using any combination of facility name, geographic location, SIC code, and chemicals.
Compilation Techniques
Self-supplied domestic water withdrawals typically are estimated by multiplying the self-supplied population by a per-capita use coefficient. For the 2000 compilation, the State self-supplied population is calculated by subtracting the total popu-lation served by public supply from the total census population for the State. This residual population then can be multiplied by a statewide per-capita use coefficient. Use of county figures for population served and total population allows an estimate of county self-supplied population that can be used with different per-capita use coefficients for various geographic regions within a State.
Reliable figures for population served by public supply yield reliable figures for self-supplied population. Vacationers and users of second homes in publicly supplied areas generally are not included in the population served because they already have been counted in the location of their primary residence. The estimated self-supplied population may be too small if the population served by public suppliers includes nonresidents. Local planners or consulting firms may be able to provide an estimate of the percentage of second homes in areas with sub-stantial numbers of nonresidents.
Self-supplied domestic withdrawal estimates may be more accurate if per-capita use is determined for different geographic areas of the State that have different climates or water-use char-acteristics. Per-capita use is greater in more arid regions where outdoor watering is a large component of household water use. A preferred method for developing domestic per-capita use coefficients is to obtain data on domestic deliveries and popula-tion served from different water suppliers throughout a State. Domestic deliveries divided by the population served will give an estimate of per-capita use. Per-capita use coefficients that are based on reported delivery data may differ from self-sup-plied per-capita use depending on the degree of outdoor water-ing or may be affected by ordinances controlling outdoor use. This method is more time consuming than using a uniform State coefficient but yields per-capita use coefficients that reflect cli-matic conditions and local patterns of domestic use. If per-cap-ita use rates are similar throughout the State, an average per-capita use for the entire State may be appropriate. If per-capita use rates indicate regional differences within the State, an aver-age per-capita use can be estimated for each county or region.
Domestic per-capita use coefficients also may be obtained from estimates provided by other agencies or available in the lit-erature. Some States have published projections of future water demands and may have calculated per-capita use rates. Regional and State planning agencies, State natural resource agencies, or the State's public health agency are possible sources for this information. Per-capita use coefficients also have been determined as part of research conducted by profes-sional organizations such as the American Water Works Asso-ciation and by consulting firms.
Self-supplied domestic withdrawals sometimes can be estimated using information from wastewater-treatment facili-ties that set fees according to metered water use. In areas where sewer districts serve houses that are not on public water sup-plies, the wastewater-treatment facilities often maintain with-drawal information about self-supplied residences for billing purposes. This information can be used to estimate withdrawals for certain areas and to develop per-capita use coefficients along with population and housing data. Per-capita uses also are estimated by State pollution-control agencies when design-ing wastewater lagoons. These design values, usually about 80 to 100 gallons per capita per day (gpcd), may provide a good estimate of domestic per-capita use. Other coefficients, such as gallons per day per household or gallons per day per household market value, are available from the literature and can be used to determine domestic self-supplied withdrawals in areas for which ancillary data on housing are available.
Domestic self-supplied withdrawals typically are from wells. The source for 99 percent of the domestic withdrawals in 1995 was ground water (Solley and others, 1998). Information on the use of surface water for domestic supply may be obtained from the State public health agency, the State agency responsi-ble for permitting or water-use data collection, census housing data, or local knowledge of areas where surface water is used. Cisterns used to collect rainwater for domestic use may be con-

10 Guidelines for Preparation of State Water-Use Estimates for 2000
sidered a surface-water source. Springs are considered surface water in some States and ground water in others.
Industrial
Category Description
Industrial water use includes water used for such purposes as fabricating, processing, washing, diluting, cooling, or trans-porting a product. Water used for industrial purposes also may be incorporated into products or used for facility sanitation and maintenance. Industrial water users are businesses classified in the SIC codes under construction and manufacturing (see table 3) for the water-use compilation. Industrial water supplies may be derived from ground and surface sources (self-supplied industrial withdrawals) or provided by a public water supplier (industrial deliveries). Depending on water-quality require-ments, supplies may be fresh or saline.
Data Elements
Mandatory
• Ground-water withdrawals, freshwater, by county
• Ground-water withdrawals, saline water, by county
• Surface-water withdrawals, freshwater, by county
• Surface-water withdrawals, saline water, by county
• Ground-water withdrawals, freshwater, by aquifer
Optional
• Deliveries from public supply, by county
• Consumptive use, freshwater, by county
• Consumptive use, saline water, by county
• Number of facilities, by county
• Reclaimed wastewater, by county
• Any data aggregated by hydrologic cataloging unit
Sources of Information
Information on industrial facilities and their water use may be obtained from the following list of sources. This list may not exhaust all possibilities for every State.
• State agencies that administer water rights, allocate water to users, or collect water-use data
• State agencies that issue permits for the discharge of water
• Health departments or public water suppliers—many industries receive treated water for sanitary uses
• Wastewater treatment facilities
• State department of labor
• State and county planning departments
• State directories of manufacturers
• Local chamber of commerce
• County assessors and zoning boards
• U.S. Census Bureau: <http://www.census.gov/>
1997 Economic Census-Manufacturing-Industry Series (Geographic Area Series):
county-level data; number of establishments/employees by manufacturing industry; accessed through the American FactFinder, U.S. Census Bureau's online data source: <http://factfinder.census.gov/home/saff/main.html?_lang=en>
sector-specific reports by State: http://www.census.gov/epcd/www/econ97.html
list of publications available for the manufacturing sector: <http://www.census.gov/prod/www/abs/97ecmani.html>
list of U.S. Census Bureau contacts for manufacturing: <http://www.census.gov/contacts/www/ c-manufa.html>
• U.S. Environmental Protection Agency (USEPA): <http://www.epa.gov/>
Water Discharge Permits, Permit Compliance System (PCS) database: <http://www.epa.gov/enviro/html/pcs/pcs_query_java.html>
Access to data regarding facilities holding National Pollutant Discharge Elimination System (NPDES) permits. Specify the facilities by using any combi-nation of facility name, geographic location, SIC code, and chemicals.
• Dun and Bradstreet: <http://www.dnb.com/us/index.asp>
Source for lists of manufacturing establishments that includes SIC codes and number of employees, among other information. This information is updated quarterly.
• Harris InfoSource: <http://www.harrisinfo.com/servlet/ HIServlet?moduleName=session&methodName=getHomePage>
Source for purchasing lists of manufacturing establish-ments. This site includes limited free searching of their database and trial reports. Profile reports include

Industrial 11
primary and secondary SIC codes, number of employ-ees, Web address of company, if available. The infor-mation is updated at least once a year.
Compilation Techniques
The types of industries and magnitude of withdrawals vary throughout the United States. Major industrial groups identi-fied by SIC code include food and kindred products (SIC 2011–2099); paper and allied products (SIC 2611–2679); chemicals and allied products (SIC 2812–2899); petroleum refining and related industries (SIC 2911–2999); and primary metals indus-tries (SIC 3312–3399). Although these types of industries his-torically have used the most water per facility, the most impor-tant industry in any given county may not fall into one of these five groups. It is important, therefore, to consider any industries outside these groups.
Withdrawals
There are three general approaches used to compile with-drawal data by industries:
1. Acquire site information and withdrawal data for individ-ual industries, focusing on larger ones while striving for an adequate representation of the withdrawals in each county.
2. Acquire site information with ancillary data on employment or production, and estimate water withdrawals using water-use coefficients. These coefficients are usually in the form of usage in gallons per day per employee or per unit of product.
3. Combine the two approaches by acquiring site information and withdrawals for the larger industries and using these data to develop water-use coefficients for estimating withdrawals for the smaller industries. The accuracy of withdrawals derived by using water-use coefficients is always questionable, especially in the industrial category; however, coefficients developed using local sites may be more reflective of physical and economic conditions in an area than are nationally derived coefficients.
Withdrawal data may be acquired through telephone con-tacts or surveys sent out by cooperating agencies. The level of detail that is obtained depends on the amount of time available to collect industrial facility data and the ability of the people that are contacted to provide this information. Any relevant pri-vacy issues that may affect both the acquisition and use of industrial data should be considered. Useful data to acquire include:
• Facility name, mailing address, physical plant facility address
• County
• Contact person's name, title, and telephone number
• Industry description or principal products
• SIC codes—primary and secondary
• Estimated annual quantity of product produced
• Total number of employees
• Number of ground-water sources, aquifer names, number and depth of well(s)
• Number of surface-water sources, names of streams or water bodies
• Latitude and longitude of wells and (or) intakes
• Maps of facility and water intakes
• Name of any public water-supply sources
• Amounts of water withdrawn (quantity per unit time) from each source
• Amount or percentage of total withdrawal that is saline ground or surface water
• Method of determining withdrawals (meters, other)
• Water-use breakdown for various purposes—cooling, processing, sanitary use, boiler feed, power generation, other
• Amount of water recycled or re-used
• Wastewater discharge—average amount or percentage
• Number of days operating each year
• Average number of hours operating each day
• Approximate age of the facility
• Need for maintaining confidentiality
When using lists provided by permitting agencies, it is wise to determine the minimum withdrawal rate for issuing per-mits or collecting surveys. If this minimum withdrawal rate is large, a significant number of small industries may not be sur-veyed.
Any data obtained from industrial facilities through sur-veys, questionnaires, or cooperator reports need to be checked for accuracy and correct units of measurement. Some of an industry's water may be purchased from a public water supply for sanitary use within the facility or if the quality of the water needs to be high, such as in the food and beverage industry. Estimates of the total water needs for facilities with a combina-tion of sources need to be adjusted so that only the self-supplied withdrawals from surface- and ground-water sources are counted.
Water-Use Coefficients
In the absence of reported data, industrial withdrawals may be estimated using water-use coefficients and ancillary data such as numbers of employees, production volumes, or annual sales. The largest industries should be contacted to acquire actual water-use withdrawal data. These withdrawals then can

12 Guidelines for Preparation of State Water-Use Estimates for 2000
be used to develop locally adjusted water-use coefficients to estimate withdrawals for smaller industries.
The use of coefficients to estimate industrial water use is imprecise because of the variability in factors affecting water use by industries. The specific processes, age of the facility, cost of the water and wastewater treatment, and amount of recy-cling all contribute to the amounts of water needed by an indus-try. These factors should be considered when using national coefficients or when developing and adjusting local coefficients for nonsurveyed industries.
Allocation of Withdrawals by Source
If water use is estimated on the basis of ancillary data, the results must be allocated by source—ground water and surface water, freshwater and saline water. The best approach is to acquire as much site-specific data as possible for the larger industries. Some facilities have both ground-water and surface-water sources and possibly a public water-supply source as well. Public water-supply deliveries should not be included in the industrial withdrawals. If site-specific data are not avail-able, plotting the industries' locations on a map can help deter-mine the probable sources. Many industries are located in spe-cific areas because of ample supplies of water from rivers or productive aquifers. Maps showing the extent of surficial and bedrock aquifers can indicate whether industries are located over a major aquifer. Water-use permits (if required) also should indicate if the industry withdraws from a protected aqui-fer. Finally, comparison with other nearby users such as public water suppliers may help determine an industry's source of water.
For some States, the source of saline surface water is the ocean. Saline ground water is characteristic of some aquifers that may be described in ground-water reports. The USGS ground-water specialist in each State may be able to help iden-tify areas noted for having saline ground water.
Irrigation
Category Description
Irrigation water use includes fresh or reclaimed water that is applied by an irrigation system to sustain growth in agricul-tural and horticultural vegetation (SIC 0111–0191 and 4971 in table 3). It also includes water that is applied for pre-irrigation, frost protection, chemical application, weed control, field prep-aration, crop cooling, harvesting, dust suppression, leaching of salts from the root zone, and conveyance losses. Activities such as irrigation of public and private golf courses (SIC 7992 and 7997), parks, nurseries, turf farms, cemeteries, and other land-scape-watering uses also are included in the irrigation category. The irrigation category includes additional data on irrigated
acres by type of irrigation system—sprinkler, surface (flood), and microirrigation.
Water that is purchased from or provided by a public-sup-ply system for irrigation users, golf courses, parks, cemeteries, and landscaping irrigation is not included in the irrigation cate-gory. This water is included in public-supply withdrawals and may have been accounted for as a commercial delivery or public use.
For the 2000 compilation, States optionally may divide irrigation water use into crop irrigation and golf-course irriga-tion. In this case, only golf-course irrigation withdrawals are included in golf-course irrigation; all other landscape irrigation is included with crop withdrawals. If irrigation is divided in this manner, county-level totals for both crop and golf-course irriga-tion are mandatory where applicable, and total irrigation water withdrawals are calculated as the sum of the two subcategories. If irrigation withdrawals are not divided into crop and golf-course withdrawals, then all irrigation is reported as total with-drawals and may include both types.
Data Elements
Mandatory
• Ground-water withdrawals, freshwater, by county
• Surface-water withdrawals, freshwater, by county
• Total acres irrigated by sprinkler systems, by county
• Total acres irrigated by surface systems, by county
• Total acres irrigated by microirrigation systems, by county
• Total ground-water withdrawals, by aquifer
Optional
• Divided crop and golf-course withdrawals, by county
• Consumptive use, by county
• Conveyance loss, by county
• Reclaimed wastewater, by county
• Any data aggregated by hydrologic cataloging unit
Sources of Information
Information about irrigation withdrawals and acres irri-gated for crops or golf courses may be obtained from the fol-lowing list of sources. This list is not all inclusive, and USGS water-use project chiefs are encouraged to investigate any other potential sources of information available for their States.
• State agencies that administer water rights, allocate water to users, or collect water-use data
• U.S. Department of Agriculture (USDA): <http://www.usda.gov/>

Irrigation 13
1997 Natural Resource Inventory: <http://www.nrcs.usda.gov/technical/NRI/1997/national_results.html>
Farm Service Agency: <http://www.fsa.usda.gov/pas/default.asp>
Cooperative State Research, Education, and Extension Service (CSREES): <http://www.csrees.usda.gov/>
State partners of the CSREES (includes agricultural experiment stations and county cooperative extension offices): <http://www.csrees.usda.gov/qlinks/partners/state_partners.html>
Local partners: <http://www.csrees.usda.gov/Extension/index.html>
Natural Resource Conservation Service, National Engineering Handbook, Part 652, Irrigation Guide: <http://www.wcc.nrcs.usda.gov/nrcsirrig/ irrig-handbooks-part652.html>
• National Agricultural Statistics Service (NASS): <http://www.usda.gov/nass/>
Links to NASS Web sites for each State: <http://www.usda.gov/nass/sso-rpts.htm>
State Web sites may include links to information such as agricultural statistics, publications (includ-ing annual bulletins), and general information on agriculture in that State; other State agricultural agencies; and agricultural census data.
Published Estimates Data Base (PEDB)—custom que-ries for agricultural statistics, down to the county level: <http://www.nass.usda.gov:81/ipedb/>
Data files for 1999 crop acreage, by county: <http://www.usda.gov/nass/graphics/county99/ indexdata.htm>
• Census of Agriculture: <http://www.nass.usda.gov/census/>
Links to portable document file (PDF) versions of 1997 Census of Agriculture Volume 1 tables (national, State, and county data): <http://www.nass.usda.gov/census/census97/volume1/vol1pubs.htm>
Highlights from the 1997 census of agriculture, State or county level: <http://www.nass.usda.gov/census/census97/ highlights/ag-state.htm>
text and graphics on primary agricultural products, including acres of crops harvested
Profiles of the 1997 census of agriculture, State or county level: <http://www.nass.usda.gov/census/census97/profiles/ag-state.htm>
text and graphics on differences from previous years
1998 Farm & Ranch Irrigation Survey: <http://www.nass.usda.gov/census/census97/fris/fris.htm>
State-level data on acres irrigated by irrigation method; application rates by irrigation method, source of water, and crop type
1998 Census of Horticultural Specialties: <http://www.nass.usda.gov/census/census97/ horticulture/horticulture.htm>
State-level data on acres for horticultural crops, including acres irrigated by source of water and acres irrigated by type of irrigation system
• Bureau of Reclamation, U.S. Department of the Interior: <http://www.usbr.gov/>
Annual operating plans for Federally owned dams and reservoirs operated by irrigation or reclamation districts: <http://www.usbr.gov/gp/water/index.cfm>
AgriMet is a network of automated agricultural weather stations located in irrigated agricultural areas throughout the Pacific Northwest and Montana:
Pacific Northwest Region: <http://mac1.pn.usbr.gov/agrimet/>
Great Plains Region (Montana): <http://www.usbr.gov/gp/agrimet/index.cfm>
• U.S. Environmental Protection Agency (USEPA): <http://www.epa.gov/>
Water Discharge Permits, Permit Compliance System (PCS) database: <http://www.epa.gov/enviro/html/pcs/pcs_query_java.html>
Access to data regarding facilities holding National Pollutant Discharge Elimination System (NPDES) per-mits. Specify the facilities by using any combination of facility name, geographic location, SIC code, and chemicals.
• Irrigation Journal—2000 annual irrigation survey: v. 51, no. 1, January/February 2001, p. 12–41 (Irriga-tion Journal, 2001; no longer published)
• GolfServ.com: <http://www.golfserv.com/apps/courses/search.asp>
Users can search the database for a listing of golf courses in each State. Includes data on public and pri-vate courses, number of holes, location, and links to each course's profile and Web site (if they have one). Registration on the Web site (free) is required to access specific course data.

14 Guidelines for Preparation of State Water-Use Estimates for 2000
• Golfcourse.com: <http://www.golfcourse.com/search/custom.cfm>
Users can search the database for a listing of golf courses in each State. Includes information on number of holes. No registration is required.
• Federal or State crop and livestock reporting services
• State and local turf-grower associations
• County assessor
• Land-grant universities—college of agriculture, departments of watershed science, soil science, plant science, crop science, or irrigation engineering
• Water management districts, irrigation districts, irrigation companies
• Irrigation equipment dealers
• Farm and crop improvement associations
• Individual golf courses, parks, and other recreational areas
• Professional, technical, and trade journals
• State departments of commerce and tourism
Compilation Techniques
For the irrigation category, information on withdrawals from ground and surface sources is compiled for the counties where the withdrawals occurred. Information on acres irrigated is compiled for the counties where the irrigation water was applied. In most cases, irrigation water is applied close to where it is withdrawn; in some cases the irrigation water is transported long distances through canals before being applied to crops.
Direct methods for compiling information on irrigation withdrawals and irrigated acres include use of reported data, surveys, and personal contact. Indirect approaches for estimat-ing withdrawals include calculation of crop water needs and sta-tistical sampling. Data on irrigated acres by crop type and irri-gation system type are used in most estimation methods for determining withdrawals. Total withdrawals need to be disag-gregated to ground- and surface-water sources if information on site-specific withdrawals is not available. Compilation of with-drawals for golf-course irrigation is optional.
Reported Data
Some States require individual water users or water-right holders to measure and report their withdrawals and irrigated acreages for each well or surface-water diversion. These data are considered the best because the location of the withdrawals can be accurately assigned and aggregated to a county, aquifer, or other area. Other sources of reported data may yield partial coverage of irrigation use. USGS cooperative studies may include measurement of site-specific data in local areas within
a State. Irrigation districts or other agencies may own water rights and distribute water to users; these entities usually mea-sure both withdrawals and deliveries. Water masters may have been assigned to measure or compile measured withdrawals and deliveries in some areas, in which case they are excellent sources of data.
Reported measurements are the most defensible data; how-ever, the completeness of reported data varies among States. Before using data that are reported to or by other agencies, it is important to understand the level of completeness, the degree of accuracy, and the amount of QA/QC given to data obtained from other Federal, State, and local agencies. USGS water-use project chiefs need to verify whether the data are based on full and complete enumerations, like a census, or are statistically based, like the NASS data. Reported crop acreages may include all crop acreages or just irrigated acreages. Irrigated acreages and water deliveries may be reported for an area of management of a particular agency, or for an entire county. Some data may be censored for privacy reasons in areas with few irrigators. Reported withdrawals and acreage data need to be reviewed for errors, either by the reporting agency or by the USGS water-use project chief. Knowing the level of QA/QC for data that are reported by other agencies may prevent calculations that are based on incorrect assumptions.
Surveys and Personal Contact
Another method of estimating irrigation water use is by a local survey. Surveys that are conducted by USGS rather than a cooperator need to comply with the requirements of the 1995 Paperwork Reduction Act. Ideally, survey forms include a com-plete background about why the information is being requested, how it will be used, and by whom. Other important components of the survey are (1) a concise description of the requested data, (2) a contact name and phone number to direct questions to, and (3) a desired completion date. In any case, efficient collection and processing of survey data can best be achieved if the survey forms are short and easy for the user to complete. Typically, other State and local agencies distribute surveys, and the data are shared with USGS.
It is important to get accurate data on the largest users, who typically have more data available than small water users. Data sources such as the USDA's Farm and Ranch Irrigation Survey can be used to target counties with the largest water users when developing survey lists. Some of the most beneficial survey information includes:
• Total irrigated acreage
• Crop and pasture acreage
• Type and efficiency of irrigation system(s)
• Quantity or flow rate of water by source
• Irrigation scheduling and frequency
• Number of irrigation wells
• Total depth of well(s)
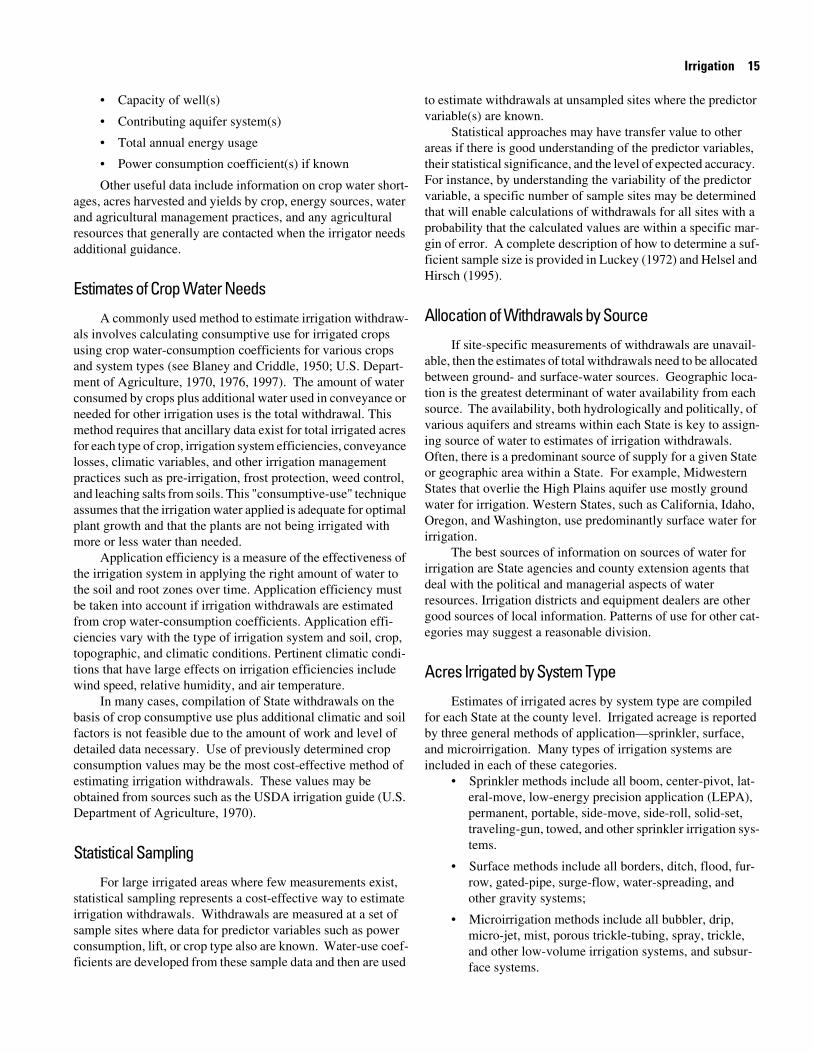
Irrigation 15
• Capacity of well(s)
• Contributing aquifer system(s)
• Total annual energy usage
• Power consumption coefficient(s) if known
Other useful data include information on crop water short-ages, acres harvested and yields by crop, energy sources, water and agricultural management practices, and any agricultural resources that generally are contacted when the irrigator needs additional guidance.
Estimates of Crop Water Needs
A commonly used method to estimate irrigation withdraw-als involves calculating consumptive use for irrigated crops using crop water-consumption coefficients for various crops and system types (see Blaney and Criddle, 1950; U.S. Depart-ment of Agriculture, 1970, 1976, 1997). The amount of water consumed by crops plus additional water used in conveyance or needed for other irrigation uses is the total withdrawal. This method requires that ancillary data exist for total irrigated acres for each type of crop, irrigation system efficiencies, conveyance losses, climatic variables, and other irrigation management practices such as pre-irrigation, frost protection, weed control, and leaching salts from soils. This "consumptive-use" technique assumes that the irrigation water applied is adequate for optimal plant growth and that the plants are not being irrigated with more or less water than needed.
Application efficiency is a measure of the effectiveness of the irrigation system in applying the right amount of water to the soil and root zones over time. Application efficiency must be taken into account if irrigation withdrawals are estimated from crop water-consumption coefficients. Application effi-ciencies vary with the type of irrigation system and soil, crop, topographic, and climatic conditions. Pertinent climatic condi-tions that have large effects on irrigation efficiencies include wind speed, relative humidity, and air temperature.
In many cases, compilation of State withdrawals on the basis of crop consumptive use plus additional climatic and soil factors is not feasible due to the amount of work and level of detailed data necessary. Use of previously determined crop consumption values may be the most cost-effective method of estimating irrigation withdrawals. These values may be obtained from sources such as the USDA irrigation guide (U.S. Department of Agriculture, 1970).
Statistical Sampling
For large irrigated areas where few measurements exist, statistical sampling represents a cost-effective way to estimate irrigation withdrawals. Withdrawals are measured at a set of sample sites where data for predictor variables such as power consumption, lift, or crop type also are known. Water-use coef-ficients are developed from these sample data and then are used
to estimate withdrawals at unsampled sites where the predictor variable(s) are known.
Statistical approaches may have transfer value to other areas if there is good understanding of the predictor variables, their statistical significance, and the level of expected accuracy. For instance, by understanding the variability of the predictor variable, a specific number of sample sites may be determined that will enable calculations of withdrawals for all sites with a probability that the calculated values are within a specific mar-gin of error. A complete description of how to determine a suf-ficient sample size is provided in Luckey (1972) and Helsel and Hirsch (1995).
Allocation of Withdrawals by Source
If site-specific measurements of withdrawals are unavail-able, then the estimates of total withdrawals need to be allocated between ground- and surface-water sources. Geographic loca-tion is the greatest determinant of water availability from each source. The availability, both hydrologically and politically, of various aquifers and streams within each State is key to assign-ing source of water to estimates of irrigation withdrawals. Often, there is a predominant source of supply for a given State or geographic area within a State. For example, Midwestern States that overlie the High Plains aquifer use mostly ground water for irrigation. Western States, such as California, Idaho, Oregon, and Washington, use predominantly surface water for irrigation.
The best sources of information on sources of water for irrigation are State agencies and county extension agents that deal with the political and managerial aspects of water resources. Irrigation districts and equipment dealers are other good sources of local information. Patterns of use for other cat-egories may suggest a reasonable division.
Acres Irrigated by System Type
Estimates of irrigated acres by system type are compiled for each State at the county level. Irrigated acreage is reported by three general methods of application—sprinkler, surface, and microirrigation. Many types of irrigation systems are included in each of these categories.
• Sprinkler methods include all boom, center-pivot, lat-eral-move, low-energy precision application (LEPA), permanent, portable, side-move, side-roll, solid-set, traveling-gun, towed, and other sprinkler irrigation sys-tems.
• Surface methods include all borders, ditch, flood, fur-row, gated-pipe, surge-flow, water-spreading, and other gravity systems;
• Microirrigation methods include all bubbler, drip, micro-jet, mist, porous trickle-tubing, spray, trickle, and other low-volume irrigation systems, and subsur-face systems.

16 Guidelines for Preparation of State Water-Use Estimates for 2000
Reliable data on irrigated acreage also are essential for most methods of estimating irrigation withdrawals. Site-spe-cific irrigated acres by irrigation system type are difficult to obtain except where State agencies require irrigators to report detailed information on crop types, acreages, and irrigation methods. The USDA census of agriculture, conducted in years ending in "2" and "7", provides the most recent national data set of irrigated crop acreages by county (U.S. Department of Agri-culture, 1999a). The USDA farm and ranch irrigation survey, last released in 1998, provides a national data set of irrigated acreage by irrigation method by State (U.S. Department of Agriculture, 2000c). The Irrigation Journal for 2000 (now dis-continued) also provides State-level irrigated acreages by method (Irrigation Journal, 2001). County assessors also are potential sources for county-level information on irrigated acre-age and irrigation system type. Remote sensing has been uti-lized as an indirect method of determining acres irrigated and crop types (Raymond and others, 1992).
In some parts of the United States, the growing season is long enough that double and triple cropping on the same irri-gated acreage can occur. In these cases, irrigated acres are accumulated to reflect the total acreage irrigated during the year; therefore, when any acre of land is cropped twice, it is counted as 2 irrigated acres. Counting acreage in this manner produces a valid application rate, expressed in terms such as acre-foot per acre. The irrigation method used on the subse-quent crops also may vary and should be investigated and doc-umented for each State. If multiple irrigation methods are used on a crop in a single growing season, acreages are reported under the method that provides the majority of water to the crop.
Golf-Course Irrigation
Golf courses may utilize water from ground or surface sources, purchased water (from a public supplier or irrigation district), reclaimed water from a public wastewater treatment facility, or a combination of these sources. For golf courses, the best information on source of water is obtained directly from the golf-course maintenance personnel. These people usually know how much water is diverted, withdrawn, or delivered from each of the possible sources.
Factors affecting the amount of irrigation water used at golf courses include course design, climatic conditions, acre-age, irrigation systems, soils, availability of water for irrigation, and local irrigation practices. Normally, more water per unit of area is applied to the greens and tees than to the fairways. It is best to obtain metered withdrawals for specific golf courses. If site-specific data are not available, irrigation withdrawals may be estimated using coefficients developed from surveys of golf courses in a State. A survey should include all of the informa-tion necessary to compute an application rate on the basis of the consumptive needs of the grasses and the irrigated acres.
Thermoelectric Power
Category Description
Thermoelectric power water use is defined as the amount of water used in the process of generating thermoelectric power. All thermoelectric-power generation facilities are classified as SIC 4911 (table 3). The source of the power may be fossil fuels, nuclear fission, or geothermal energy. Thermoelectric power-plants typically generate electricity with a boiler, where water is heated to turn it into steam. The steam then is used to turn tur-bines, which generate electricity. After the steam is used to turn the turbines, the steam is condensed to water by cooling it in a heat exchanger. The condensed water then is routed back to the boiler, where the cycle begins again. The predominant use of water is to cool the steam.
Water withdrawal requirements at power-generation facil-ities depend primarily on whether or not the cooling water is recirculated. The two general types of cooling are once-through (open-loop) cooling and closed-loop cooling. For the 2000 compilation, water withdrawal estimates are compiled for each type of cooling system. Once-through or open-looped cooling requires the largest amounts of water withdrawal because it is not recirculated within the facility. The water is withdrawn from a source, circulated through the heat exchangers, and then returned to a water body at a higher temperature. This technol-ogy is common in older facilities but generally is not used for new facilities because of increasingly restrictive thermal requirements for return water.
Close-looped cooling systems utilize cooling ponds and cooling towers to recirculate water within the system, thus reducing the overall water withdrawal requirement. Withdraw-als to replace cooling water lost to evaporation, blowdown, drift, and leakage are considered "makeup" water. A cooling pond is a shallow reservoir with a large surface area to remove heat from circulation water. The rate of heat loss may be enhanced through the use of spray nozzles. A cooling tower is a structure designed to remove heat from water. The heated cir-culation water is sprayed into the tower and is cooled by radia-tion from the sides of the tower or contact with the cooler air. Cooling towers commonly are used where land and water are expensive, or where local regulations prohibit the release of thermal water.
Some industrial facilities also generate thermoelectric power. These facilities are called "cogeneration" facilities. If the data provided from the industrial facility are sufficient to identify water used in power generation, then that amount of water is reported separately as a power generation water use.

Thermoelectric Power 17
Data Elements
Mandatory
• Ground-water withdrawals, once through, freshwater, by county
• Surface-water withdrawals, once through, freshwater, by county
• Surface-water withdrawals, once through, saline water, by county
• Ground-water withdrawals, closed loop, freshwater, by county
• Surface-water withdrawals, closed loop, freshwater, by county
• Surface-water withdrawals, closed loop, saline water, by county
Optional
• Deliveries from public supply, once through, by county
• Deliveries from public supply, closed loop, by county
• Consumptive use, once through, freshwater, by county
• Consumptive use, once through, saline water, by county
• Consumptive use, closed loop, freshwater, by county
• Consumptive use, closed loop, saline water, by county
• Power generation, once through, by county
• Power generation, closed loop, by county
• Number of facilities, once through, by county
• Number of facilities, closed loop, by county
• Reclaimed wastewater, once through, by county
• Reclaimed wastewater, closed loop, by county
• Any data aggregated by hydrologic cataloging unit
Sources of Information
Information concerning thermoelectric power withdrawals may be obtained from the following list of sources. This list is not all inclusive, and USGS water-use project chiefs are encour-aged to investigate any other potential sources of information available for their States.
• State agencies that administer water rights, allocate water to users, or collect water-use data
• Individual facilities
• Public suppliers (for deliveries)
• U.S. Department of Energy (DOE): <http://www.doe.gov> Energy Information Administration (EIA, part of DOE):
<http://www.eia.doe.gov/>
List of EIA electric power forms: <http://www.eia.doe.gov/oss/forms.html> This list includes contact information for each type of report.
EIA–412 (Annual Report of Public Electric Utili-ties)—generating plant data by type of plants; for municipal and Federally owned electric utilities: <http://www.eia.doe.gov/cneaf/electricity/page/eia412.html>
EIA–906 (Monthly Power Plant Report, formerly EIA–759)—net generation, fuel type; monthly data for plants with nameplate capacity of 50 megawatts or more, annual data for plants with nameplate capacity of less than 50 megawatts: <http://www.eia.doe.gov/cneaf/electricity/page/eia906u.html>
EIA–767 (Annual Steam-Electric Plant Operation and Design Data)—net generation, fuel type, cooling water process/source/rate; only plants with generating capac-ity of 10 or more megawatts: <http://www.eia.doe.gov/cneaf/electricity/page/eia767.html>
Data matrix of EIA electric power forms online: <http://www.eia.doe.gov/cneaf/electricity/forms/ datamatrix.html>
Energy data for each State (summaries, profiles, graphics): <http://www.eia.doe.gov/emeu/states/_states.html>
Electricity profile contains a graphic with largest investor-owned utilities in the State and largest plants in the State; 1998 data.
Electricity restructuring plans contain links to State regulatory commissions and major utilities.
• U.S. Environmental Protection Agency (USEPA): <http://www.epa.gov/>
Water Discharge Permits, Permit Compliance System (PCS) database: <http://www.epa.gov/enviro/html/pcs/pcs_query_java.html>
Access to data regarding facilities holding National Pollutant Discharge Elimination System (NPDES) permits. Specify the facilities by using any combi-nation of facility name, geographic location, SIC code, and chemicals.
• State agency responsible for compliance with USEPA's Clean Water Act Program
• State agency for power administration
• Regional "power pools" (groups of electric utility companies)

18 Guidelines for Preparation of State Water-Use Estimates for 2000
Compilation Techniques
Most water for thermoelectric use is self supplied from fresh or saline surface-water sources. Smaller quantities are derived from ground-water sources or provided by public suppliers.
Information collected and maintained by the U.S. Depart-ment of Energy, Energy Information Administration (EIA), includes powerplant ownership, location, cooling method, sources of water, average withdrawal rates, average discharge rates, operating status, and power generated. This information is collected from monthly and annual surveys of powerplants. Information on power generation and energy source may be found in the database EIA–906 Monthly Power Plant Report, formerly EIA–759. EIA–767, Annual Steam-Electric Plant Operation and Design Data, contains cooling information for all organic- and nuclear-powered plants with a generator name-plate rating of 10 or more megawatts.
Information on the withdrawal of water for the process of generating electric power also can be obtained from each utility. If the contact person for a utility is not known, a good place to start is the person at the utility who prepares the Discharge Monitoring Reports (DMR's) for USEPA. DMRs contain infor-mation on volume discharged from all pipes in the facility and can be compared to the permit or permit application as to the source of the water and how it was used. The following selected terminology may help in conversations with utility personnel— blowdown, capacity, drift, and makeup water. These terms are defined in the "Glossary."
State agencies that administer water rights or monitor water use may provide more detailed information on actual withdrawals for thermoelectric power generation. The State agency that is responsible for compliance with USEPA's Clean Water Act is an important source for this information. USEPA administers the Permit Compliance System (PCS) database, which was designed to track permit, compliance, and enforce-ment status data for the National Pollutant Discharge Elimina-tion System (NPDES) Program under the Clean Water Act. An NPDES permit is required for all point discharges into United States waterways. The PCS database contains descriptive infor-mation on major power-generating facilities, their location, and monthly return flows. The NPDES permit application and the permit itself usually include detailed descriptions of the plant that provide basic information on all the sources of supply for the plant, the different ways in which water is used in the plant, and water included in the reported discharge values.
Power generation data can be used to estimate thermoelec-tric water use if it is not possible to obtain withdrawal amounts from other sources. A coefficient to estimate the gallons of water used per kilowatt-hour of electricity generated is calcu-lated using information on withdrawals and power generation from plants of similar age, heating processes, and cooling meth-ods. This coefficient then can be multiplied by the amount of electricity generated over a specified time period by the plant for which withdrawals are being estimated. Power generation data are available on EIA–906 on form 759; however, some of
the electricity generated at a thermoelectric powerplant is used to run the powerplant itself. The net amount of power produced generally is reported. Water withdrawals ideally are calculated using the gross power produced, if available.
Mining
Category Description
Mining water use includes water that is used for the extrac-tion of minerals, ores, and gases, which may be in the form of a solid, liquid, or gas. Solid minerals include coal, ores, sand, and gravel. Liquids pertain to crude petroleum, and gases mostly pertain to natural gas. The mining water-use category includes quarrying, milling (crushing, screening, washing, and flota-tion), and other operations as part of a mining activity. Water that is pumped and then re-injected for secondary oil recovery is considered a water use and should be included. Water pumped from mines to dewater them, or water that is produced as a by-product of primary oil production is not included in this category. That is, the water is ignored if it is drained and dis-charged without being put to use, even though the water is trans-ferred from ground water to surface water. If water is put to a beneficial use such as washing or dampening roads for dust con-trol, then the water is included in mining water-use estimates.
Four major SIC groups account for most of the water used in the mining category (see table 3). These major groups are metal mining (SIC 1011–1099), coal mining (SIC 1221–1241), oil and gas extraction (SIC 1311–1389), and mining and quar-rying of nonmetallic minerals, except fuels (SIC 1411–1499). The mining water-use category does not include the processing of raw materials, such as smelting ores, refining petroleum, and slurry pipeline operations. These are considered industrial uses of water.
Data Elements
Compilation of estimates for the mining category is man-datory for Alaska, Arizona, California, Florida, Indiana, Minne-sota, Nebraska, Oklahoma, Pennsylvania, Texas, Utah, and Wyoming. Other States are encouraged to compile data on min-ing water use if mining activity is important to their State.
Mandatory
• Ground-water withdrawals, freshwater, by county
• Ground-water withdrawals, saline water, by county
• Surface-water withdrawals, freshwater, by county
• Surface-water withdrawals, saline water, by county
Optional
• Consumptive use, freshwater, by county

Mining 19
• Consumptive use, saline water, by county
• Reclaimed wastewater, by county
• Any data aggregated by hydrologic cataloging unit
Sources of Information
Information concerning mining water use may be obtained from the following list of sources. This list is not all inclusive, and USGS water-use project chiefs are encouraged to investi-gate any other potential sources of information available for their States.
• Individual facilities (by personal visits and/or coopera-tor surveys)
• State agencies that issue permits for the use of water
• State agencies that issue permits for land reclamation or erosion control
• State agencies that issue permits for mining activities
• State agencies for economic development
• Universities, departments of geology and mines
• U.S. Census Bureau: <http://www.census.gov/> 1997 Economic Census–Mining–Industry Series (Geographic Area Series)
contains State-level data only (mining industry data not published by county); number of establish-ments/employees by mining industry: <http://www.census.gov/epcd/www/97EC21.HTM>
contains a list of publications available for the mining sector: <http://www.census.gov/prod/www/abs/97ecmini.html>
contains a list of U.S. Census Bureau contacts for mining: <http://www.census.gov/contacts/www/ c-manufa.html>
• Office of Surface Mining, U.S. Department of the Interior: <http://www.osmre.gov/links.htm> Links to a variety of Web resources including selected State departments responsible for regulation and aban-doned mine land programs, Federal agencies, interest groups, and selected State mining and reclamation associations.
• U.S. Geological Survey, Department of the Interior: <http://www.usgs.gov> State minerals statistics and information: <http://minerals.usgs.gov/minerals/pubs/state/> Links to minerals information for each State, including the Minerals Yearbook. Also available for each State are maps showing major mineral-producing areas by
county, contacts, and links to State-specific minerals agencies. Mine and mineral processing plant locations: <http://minerals.usgs.gov/minerals/pubs/mapdata/> Accessible from this page are maps with plant/mine locations, GIS-ready data layers, and tables of plant/mine county locations by State and commodity.
• Bureau of Land Management, U.S. Department of Inte-rior: <http://www.blm.gov/nhp/index.htm> Manages public lands, primarily in the western United States. Each State office has a mineral section.
The Land and Mineral Records—LR2000 system: <http://www.blm.gov/lr2000/>
• National Mining Association: <http://www.nma.org/default.asp> Coal Producer Survey: <http://www.nma.org/statistics/pub_coal_survey.asp> Tables of major underground and surface coal mines in the United States; includes name of mine, State, and operating company.
• Association of American State Geologists: <http://www.kgs.ukans.edu/AASG/AASG.html> Links to each State's Geological Survey.
• Mining technology, Web site for the mining industry: <http://www.mining-technology.com/industry/united_states.html> Links for commodity and State agencies.
• U.S. Environmental Protection Agency (USEPA): <http://www.epa.gov/>
Water Discharge Permits, Permit Compliance System (PCS) database: <http://www.epa.gov/enviro/html/pcs/pcs_query_java.html>
Access to data regarding facilities holding National Pollutant Discharge Elimination System (NPDES) permits. Specify the facilities by using any combi-nation of facility name, geographic location, SIC code, and chemicals.
Compilation Techniques
Withdrawals by mining facilities vary depending on the size and type of mining operation. Collection of site-specific data is the best approach. If these data are not reported to a State agency or collected by survey, then the largest mines in each State should be contacted individually to determine the quantity and source of water used for mining purposes. State or local agencies also may have useful information in water permit files, although often permitted amounts are different from actual water use.

20 Guidelines for Preparation of State Water-Use Estimates for 2000
In some States, surveys are used to compile information for State Geological Survey annual mineral reports. These data may provide information on total production for State mining operations, by mineral or commodity; however, they are not always reported at the county level. Nonetheless, if good water-use coefficients are available, statewide total water-use esti-mates may be derived using State production data and county totals disaggregated using local information.
It may be possible to develop water-use coefficients for certain types of mining using site-specific data from facilities with similar operations. Coefficients usually are based on total water use and production values. For example, they may be expressed in terms of the amount of water used to produce a specific amount of ore (millions of gallons per ton), or water used to generate a volume of sales (millions of gallons per unit of annual revenue). The U.S. Census Bureau economic census (conducted every 5 years, in years ending with 2 and 7) provides State-level information for various types of mining establish-ments, including number of establishments, number of employ-ees, value of shipments, production, and payroll (U.S. Census Bureau, 1999). Coefficients should not be applied without investigating the local water-use and mining practices in each State.
Livestock
Category Description
Livestock water use is water associated with livestock watering, feedlots, dairy operations, and other on-farm needs. Livestock includes dairy cows and heifers, beef cattle and calves, sheep and lambs, goats, hogs and pigs, horses, and poul-try. Poultry includes chickens, turkeys, ducks, geese, pheasants, and pigeons. Livestock water use also includes dairy and poul-try sanitation or wash down, waste-disposal systems, cooling of animals and products, and incidental water losses. Livestock and livestock products are classified as SIC 0211–0272, 0279, and 0291 (table 3). Animal specialties such as horses and other equines and fur-bearing animals are included in the livestock category for the 2000 compilation. In the 1990 and 1995 com-pilations, animal specialties water use was a separate subset of the livestock category, and also included fish-farm water use (Solley and others, 1993, 1998). Fish-farm and fish-hatchery water use are included in the aquaculture category for 2000. The livestock water-use category does not include on-farm domestic use, lawn and garden watering, or irrigation water use.
Data Elements
Compilation of estimates for the livestock category is mandatory for California, Iowa, Kansas, Minnesota, Missouri, Nebraska, North Carolina, Oklahoma, Texas, and Wisconsin.
Other States are encouraged to compile data on livestock water use if possible.
Mandatory
• Ground-water withdrawals, freshwater, by county
• Surface-water withdrawals, freshwater, by county
Optional
• Consumptive use, freshwater, by county
• Any data aggregated by hydrologic cataloging unit
Sources of Information
Information concerning livestock water use and the num-ber of animals and farms may be obtained from the following list of sources. This list is not all inclusive, and USGS water-use project chiefs are encouraged to investigate any other poten-tial sources of information available for their States.
• State agencies that administer water rights, allocate water to users, or collect water-use data
• U.S. Department of Agriculture (USDA): <http://www.usda.gov/>
Cooperative State Research, Education, and Extension Service (CSREES): <http://www.csrees.usda.gov/>
State partners of the CSREES (includes agricultural experiment stations and county cooperative extension offices): <http://www.csrees.usda.gov/qlinks/partners/state_partners.html>
Local partners: <http://www.csrees.usda.gov/Extension/index.html>
Economics, Statistics, and Market Information System: <http://jan.mannlib.cornell.edu/>
Includes reports and data sets on livestock, dairy, and poultry
• U.S. Environmental Protection Agency (USEPA): <http://www.epa.gov/>
Water Discharge Permits, Permit Compliance System (PCS) database: <http://www.epa.gov/enviro/html/pcs/pcs_query_java.html>
Access to data regarding facilities holding National Pollutant Discharge Elimination System (NPDES) permits. Specify the facilities by using any combi-nation of facility name, geographic location, SIC code, and chemicals.
• National Agricultural Statistics Service (NASS): <http://www.usda.gov/nass/>

Aquaculture 21
Links to NASS Web sites for each State: <http://www.usda.gov/nass/sso-rpts.htm>
A State's Web site may include links to information such as agricultural statistics, publications (includ-ing annual bulletins), and general information on agriculture in that State, other State agricultural agencies, and census data for that State.
Published Estimates Data Base (PEDB)—allows custom queries for agricultural statistics, down to the county level: <http://www.nass.usda.gov:81/ipedb/>
1997 census of agriculture: <http://www.nass.usda.gov/census/>
Links to PDF versions of 1997 census of agriculture, volume 1 tables (national, State, and county data): <http://www.nass.usda.gov/census/census97/volume1/vol1pubs.htm>
Highlights from the 1997 census of agriculture, State or county level: <http://www.nass.usda.gov/census/census97/ highlights/ag-state.htm>
text and graphics on primary agricultural products
Profiles of the 1997 census of agriculture, State or county level: <http://www.nass.usda.gov/census/census97/profiles/ag-state.htm>
text and graphics on differences from previous years
• Agricultural Network Information Center: <http://laurel.nal.usda.gov:8080/agnic/>
• AgriSurf —The Farmer's Surf Engine: <http://www.agrisurf.com/>
Search for livestock-related links, by topic (such as feedlots or specific types of livestock), especially for information on a specific business: <http://www.agrisurf.com/agrisurfscripts/ agrisurf.asp?R=wnghudp&index=_25_26&c=World&d=World&DT=0&FG=0&DL=0&ur=0>
• Federal or State crop and livestock reporting services
• Agricultural universities or colleges—departments of animal science
• Professional, technical, and trade journals
• State and county cooperative extension service agents
Compilation Techniques
Livestock water withdrawals generally are estimated by multiplying the animal count for each kind of livestock in a State by the respective per-capita use coefficient for each type of animal. Annual statistics on numbers of animals are available from the USDA National Agricultural Statistics Service as well
as various State and county offices. Authorized or reported water use by individual facility may be available in some States that issue permits for large users such as feedlots or confined animal operations.
Livestock water use includes water used for drinking, san-itation, and washing. Water-use coefficients for animals vary with climate and local animal-husbandry practices and are based on the conditions in each State. Per-head use coefficients for various types of livestock are obtained from State water-per-mitting agencies, county extension service agents, or university agriculture departments. For some types of livestock, different coefficients are used depending on the age of the animal. For example, coefficients for cattle are larger than for calves, and coefficients for hogs may be larger than for pigs. Coefficients also depend on the purpose of the livestock. For example, dairy cows require more water per head than beef cattle because of increased stall-washing requirements for dairy operations. Another determining factor in per-head water-use coefficients is the nature of the facility. Indoor confined animal-feeding operations require more water for washing and waste disposal than outdoor operations. It may be necessary to collect addi-tional information on volumes of water used at large facilities for comparison with commonly used coefficients for a State.
Information on source of water for livestock may be obtained from State agencies responsible for issuing permits for water use, county extension service agents, or personnel at uni-versity agriculture departments. Local knowledge of water availability from farm ponds or wells also can be used to develop percentages of ground and surface water used for live-stock in each county. Allocation of estimated livestock with-drawals to ground- and surface-water sources can be difficult, particularly if each source is used at a different time of year or if climatic conditions affect the availability of either source throughout the year.
Aquaculture
Category Description
Aquaculture water use includes farming of animals that live in water, such as finfish and shellfish, for food, restoration, conservation, or sport. Aquaculture production occurs under controlled feeding, sanitation, and harvesting procedures pri-marily in ponds, flow-through raceways, and, to a lesser extent, in cages, net pens, and closed-recirculation tanks. This category includes both fish farms (SIC 0273) and fish hatcheries (SIC 0921), as shown in table 3. For the 1990 and 1995 compilations, fish-farm water use was included in the animal specialties sub-set of the livestock category, and fish-hatchery water use was included in the commercial category (Solley and others, 1993, 1998). For the 2000 compilation, water use by both fish farms and fish hatcheries is included in the aquaculture category.
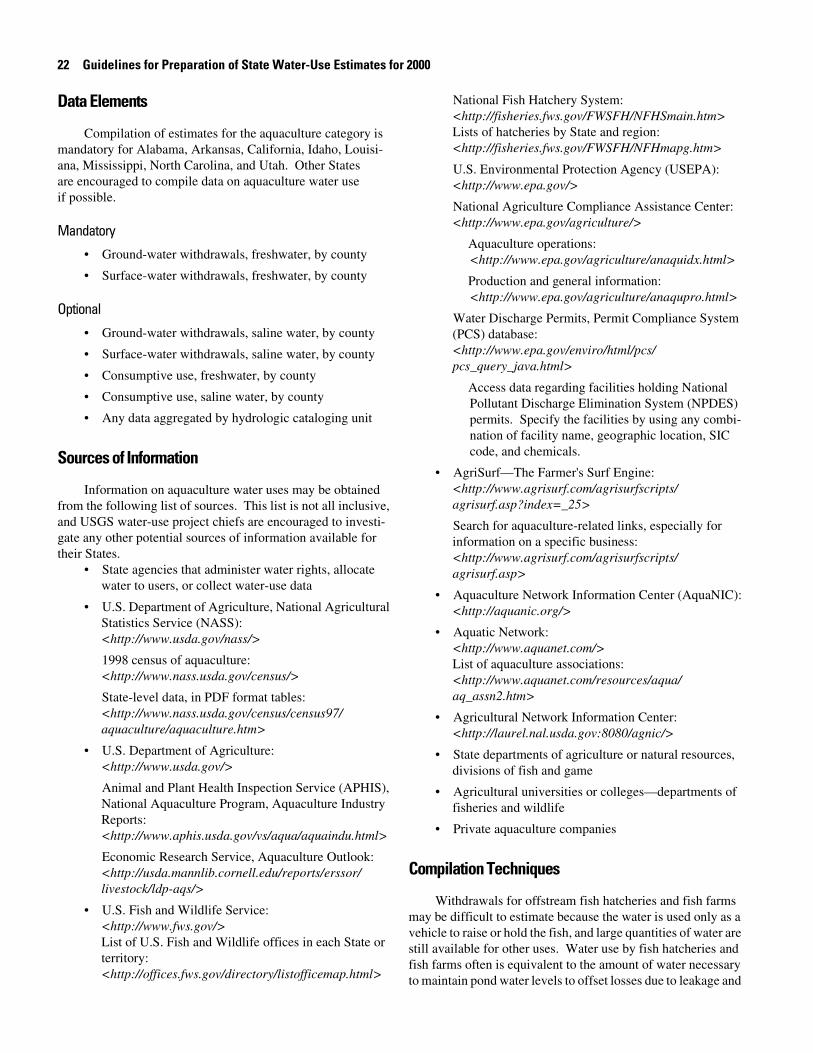
22 Guidelines for Preparation of State Water-Use Estimates for 2000
Data Elements
Compilation of estimates for the aquaculture category is mandatory for Alabama, Arkansas, California, Idaho, Louisi-ana, Mississippi, North Carolina, and Utah. Other States are encouraged to compile data on aquaculture water use if possible.
Mandatory
• Ground-water withdrawals, freshwater, by county
• Surface-water withdrawals, freshwater, by county
Optional
• Ground-water withdrawals, saline water, by county
• Surface-water withdrawals, saline water, by county
• Consumptive use, freshwater, by county
• Consumptive use, saline water, by county
• Any data aggregated by hydrologic cataloging unit
Sources of Information
Information on aquaculture water uses may be obtained from the following list of sources. This list is not all inclusive, and USGS water-use project chiefs are encouraged to investi-gate any other potential sources of information available for their States.
• State agencies that administer water rights, allocate water to users, or collect water-use data
• U.S. Department of Agriculture, National Agricultural Statistics Service (NASS): <http://www.usda.gov/nass/>
1998 census of aquaculture: <http://www.nass.usda.gov/census/>
State-level data, in PDF format tables: <http://www.nass.usda.gov/census/census97/ aquaculture/aquaculture.htm>
• U.S. Department of Agriculture: <http://www.usda.gov/>
Animal and Plant Health Inspection Service (APHIS), National Aquaculture Program, Aquaculture Industry Reports: <http://www.aphis.usda.gov/vs/aqua/aquaindu.html>
Economic Research Service, Aquaculture Outlook: <http://usda.mannlib.cornell.edu/reports/erssor/ livestock/ldp-aqs/>
• U.S. Fish and Wildlife Service: <http://www.fws.gov/> List of U.S. Fish and Wildlife offices in each State or territory: <http://offices.fws.gov/directory/listofficemap.html>
National Fish Hatchery System: <http://fisheries.fws.gov/FWSFH/NFHSmain.htm> Lists of hatcheries by State and region: <http://fisheries.fws.gov/FWSFH/NFHmapg.htm>
U.S. Environmental Protection Agency (USEPA): <http://www.epa.gov/>
National Agriculture Compliance Assistance Center: <http://www.epa.gov/agriculture/>
Aquaculture operations: <http://www.epa.gov/agriculture/anaquidx.html>
Production and general information: <http://www.epa.gov/agriculture/anaqupro.html>
Water Discharge Permits, Permit Compliance System (PCS) database: <http://www.epa.gov/enviro/html/pcs/pcs_query_java.html>
Access data regarding facilities holding National Pollutant Discharge Elimination System (NPDES) permits. Specify the facilities by using any combi-nation of facility name, geographic location, SIC code, and chemicals.
• AgriSurf—The Farmer's Surf Engine: <http://www.agrisurf.com/agrisurfscripts/ agrisurf.asp?index=_25>
Search for aquaculture-related links, especially for information on a specific business: <http://www.agrisurf.com/agrisurfscripts/ agrisurf.asp>
• Aquaculture Network Information Center (AquaNIC): <http://aquanic.org/>
• Aquatic Network: <http://www.aquanet.com/> List of aquaculture associations: <http://www.aquanet.com/resources/aqua/aq_assn2.htm>
• Agricultural Network Information Center: <http://laurel.nal.usda.gov:8080/agnic/>
• State departments of agriculture or natural resources, divisions of fish and game
• Agricultural universities or colleges—departments of fisheries and wildlife
• Private aquaculture companies
Compilation Techniques
Withdrawals for offstream fish hatcheries and fish farms may be difficult to estimate because the water is used only as a vehicle to raise or hold the fish, and large quantities of water are still available for other uses. Water use by fish hatcheries and fish farms often is equivalent to the amount of water necessary to maintain pond water levels to offset losses due to leakage and

Aquifer Withdrawals 23
evaporation. In other cases, the water is withdrawn from a stream channel and flows through the facility before returning to the stream channel. Evaporative losses are minimal in these flow-through systems. It is best to obtain local information on sources of water and volumes used by fish-hatchery and fish-farm operations. Coefficients to estimate water use by fish may be expressed in terms of water volume per facility, water vol-ume per pond surface area, or water volume or pond surface area per pound of organism produced.
Aquifer Withdrawals
Aggregation of data on ground-water withdrawals of freshwater by aquifer for the public-supply, industry, and irriga-tion categories is mandatory for the 2000 national water-use compilation. Ground-water withdrawals of saline water are not reported by aquifer.
An aquifer is a geologic formation, group of formations, or part of a formation that contains sufficient saturated permeable material to yield significant quantities of water to wells and springs. Data are aggregated for each State by the principal aquifers and aquifer systems identified in table 2. Aquifers and aquifer systems listed in table 2 are identified in the National Atlas of the United States and illustrated on the USGS principal aquifers map (U.S. Geological Survey, 2003). The aquifer list is not all inclusive; aquifers are chosen to represent those with great areal extent, substantial productivity or use, and (or) national significance. Many smaller aquifers have been included within a common classification, such as "alluvial aqui-fers." Withdrawals from aquifers known by local or regional names that are not included in table 2 are allocated to the appro-priate principal aquifer or aquifer system using judgment and expertise in each State, or are assigned to the "other" aquifer category.
Sources of Information
Information needed to assign ground-water withdrawals to principal aquifers and aquifer systems may be obtained from the following list of sources.
• USGS Ground-Water Atlas: <http://capp.water.usgs.gov/gwa/gwa.html>
• USGS ground-water specialists or ground-water scientists
• USGS Regional Aquifer Systems Analysis (RASA) reports and maps (bibliography in Sun and others, 1997): <http://water.usgs.gov/ogw/rasa/html/ introduction.html>
• USGS National Water-Quality Assessment (NAWQA) studies (links to summary reports, Web sites, and bibli-ography: <http://water.usgs.gov/nawqa/pubsmain.html>)
• Well information from the USGS National Water Information System Ground-Water Site Inventory (GWSI) database: <http://waterdata.usgs.gov/nwis/gw>
• University geology departments or hydrology programs
• State agencies, such as those that permit the use of water resources
• Professional, technical, and trade journals
Compilation Techniques
Ground-water withdrawals of freshwater by principal aquifer and aquifer system for each water-use category are best compiled with as much site-specific information as possible. The public-supply and industrial categories generally have the most site-specific data and provide the best opportunity to allo-cate withdrawals to specific aquifers or aquifer systems. If irri-gation withdrawals are not derived from site-specific data, information may be obtained from the USGS Ground-Water Atlas, RASA maps and reports, or other local ground-water publications that show the areal extent of aquifers and aquifer systems, their depths and saturated thicknesses, productivity, and water quality. The USGS Ground-Water Atlas shows vol-umes of ground-water withdrawals of freshwater that were reported for 1995 and other years.
The preferred method of allocating public-supply with-drawals to principal aquifers is to use information from each utility or State agency that maintains well data. Site-specific data should be collected from utilities that supply the largest volume of water or that serve the largest number of people. Some public suppliers withdraw from multiple aquifers. Aqui-fers for utilities that serve smaller populations or geographic areas may be identified using maps showing the full areal extent of the most productive aquifers with adequate water quality. Consultation with State ground-water experts may be needed when assigning withdrawals by small public-supply facilities to aquifers using the map of full areal extent.
If site-specific data are used to compile industrial with-drawals, aquifer information should be collected at the same time as withdrawal information. If industrial withdrawals are estimated using other methods that are not based on site-spe-cific data, then aquifers may be identified using maps showing the full areal extent of productive aquifers with adequate water quality. If the industry locations are known only at the county level or if there are multiple aquifers or aquifer systems that might provide water, then the best available information on principal aquifers used may be obtained from local ground-water reports and USGS ground-water specialists.
If site-specific data for irrigation withdrawals are avail-able, then aquifers may be identified using well drillers' logs or with data provided by the State agency that issues water per-mits. If irrigation estimates are derived using other techniques, such as estimates of crop water needs, then ground-water with-

24 Guidelines for Preparation of State Water-Use Estimates for 2000
drawals may be allocated using comparisons between irrigated areas and the full areal extent, depth to water, and productivity of principal aquifers and aquifer systems. RASA and other USGS ground-water reports, along with expertise and knowl-edge from USGS ground-water specialists and local irrigators, can be used to help allocate withdrawals to the appropriate aquifers.
If ground-water withdrawals are identified from an aquifer with a local or regional name that is not in table 2, the aquifer usually can be correlated to one of the principal aquifers or aquifer systems. Some of the aquifer names represent compos-ite aquifer systems and include many individual smaller aqui-fers. Withdrawals from an aquifer that cannot be correlated properly to one of the principal aquifers or aquifer systems are reported using the "other" aquifer category.
Ground-water withdrawals of freshwater by aquifer for each State are reported by point of withdrawal rather than by point of use, although some water subsequently may be trans-ferred for use in a different State from which it was withdrawn. Withdrawals should be reported for the State where the with-drawals occur even if the same aquifer underlies several States.
Aquifer withdrawals are to be reported at the State level. Total State aquifer withdrawals of freshwater for each category should not exceed the total ground-water withdrawals for that category. USGS water-use project chiefs are required to docu-ment the sources of information and methods used to allocate withdrawals to each aquifer or aquifer system.
Selected References
Arvin, D.V., 1992, Feasibility of using portable, noninvasive pipe flowmeters and time totalizers for determining water use: U.S. Geological Survey Water-Resources Investigations Report 91–4110, 65 p.
Blaney, H.F., Sr., and Criddle, W.D., 1950, Determining water requirements in irrigated areas from climatological and irri-gation data: U.S. Department of Agriculture, Soil Conserva-tion Service, SCS–TP–96, 48 p.
Bureau of Land Management, 2004, Land and mineral records: Information available on World Wide Web, accessed April 14, 2004, at http://www.blm.gov/lr2000/
Dash, R.G., 1999, Comparison of two approaches for determin-ing ground-water discharge and pumpage in the lower Arkansas River Basin, Colorado, 1997–98: U.S. Geological Survey Water-Resources Investigations Report 99–4221, 39 p.
Helsel, D.R., and Hirsch, R.M., 1995, Statistical methods in water resources: New York, Elsevier, Studies in Environ-mental Science 49, 529 p.
Hurr, T.R., and Litke, D.W., 1989, Estimating pumping time and ground-water withdrawals using energy-consumption data: U.S. Geological Survey Water-Resources Investiga-tions Report 89–4107, 27 p.
Hutson, S.S., Barber, N.L., Kenny, J.F., Linsey, K.S., Lumia, D.S., and Maupin, M.A., 2004, Estimated use of water in the United States, 2000: U.S. Geological Survey Circular 1268, 46 p.
Irrigation Journal, 2001, 2000 Annual irrigation survey: Irriga-tion Journal, v. 51, no. 1, January–February 2001, p. 12–41.
Kjelstrom, L.C., 1991, Methods of measuring pumpage through closed-conduit irrigation systems: Journal of Irrigation and Drainage Engineering, v. 117, no. 5, p. 748–757.
Luckey, R.R., 1972, Analyses of selected statistical methods for estimating ground-water withdrawal: Water Resources Research, v. 8, no. 1, p. 205–210.
MacKichan, K.A., 1951, Estimated use of water in the United States, 1950: U.S. Geological Survey Circular 115, 13 p.
MacKichan, K.A., 1957, Estimated use of water in the United States, 1955: U.S. Geological Survey Circular 398, 18 p.
MacKichan, K.A., and Kammerer, J.C., 1961, Estimated use of water in the United States, 1960: U.S. Geological Survey Cir-cular 456, 26 p.
Maupin, M.A., 1999, Methods to determine pumped irrigation-water withdrawals from the Snake River between Upper Salmon Falls and Swan Falls Dams, Idaho, using electrical power data, 1990–95: U.S. Geological Survey Water-Resources Investigations Report 99–4175, 14 p. with appendices.
Murray, C.R., 1968, Estimated use of water in the United States, 1965: U.S. Geological Survey Circular 556, 53 p.
Murray, C.R., and Reeves, E.B., 1972, Estimated use of water in the United States, 1970: U.S. Geological Survey Circular 676, 37 p.
Murray, C.R., and Reeves, E.B., 1977, Estimated use of water in the United States, 1975: U.S. Geological Survey Circular 765, 37 p.
National Mining Association, 2004, Annual coal producer sur-vey: Information available on World Wide Web, accessed April 14, 2004, at http://www.nma.org/statistics/pub_coal_survey.asp
Office of Management and Budget, 1987, Standard industrial classification manual, 1987: Washington, D.C., U.S. Govern-ment Printing Office, 705 p.
Raymond, L.H., Nalley, G.M., and Rettman, P.L., 1992, Evalu-ation of the use of remote-sensing data to identify crop types and estimate irrigated acreage, Uvalde and Medina Counties, 1989: U.S. Geological Survey Water-Resources Investiga-tions Report 92–4117, 21 p.
Seaber, P.R., Kapinos, F.P., and Knapp, G.L., 1987, Hydrologic unit maps: U.S. Geological Survey Water-Supply Paper 2294, 63 p.
Solley, W.B., Chase, E.B., and Mann, W.B., IV, 1983, Esti-mated use of water in the United States in 1980: U.S. Geo-logical Survey Circular 1001, 56 p.
Solley, W.B., Merk, C.F., and Pierce, R.R., 1988, Estimated use of water in the United States in 1985: U.S. Geological Survey Circular 1004, 82 p.

Selected References 25
Solley, W.B., Pierce, R.R., and Perlman, H.A., 1993, Estimated use of water in the United States in 1990: U.S. Geological Survey Circular 1081, 76 p.
Solley, W.B., Pierce, R.R., and Perlman, H.A., 1998, Estimated use of water in the United States in 1995: U.S. Geological Survey Circular 1200, 71 p.
Stickney, R.R., 1994, Principles of aquaculture: New York, Wiley, 502 p.
Sun, R.J., Weeks, J.B., and Grubb, H.F., 1997, Bibliography of Regional Aquifer-Systems Analysis Program of the U.S. Geological Survey, 1978–96: U.S. Geological Survey Water-Resources Investigations Report 97–4074, report available on World Wide Web, accessed June 17, 2004, at http://water.usgs.gov/ogw/rasa/html/introduction.html
Templin, W.E., and Cherry, D.E., 1997, Drainage-return, sur-face water withdrawal, and land-use data for the Sacramento-San Joaquin Delta, with emphasis on Twitchell Island, Cali-fornia: U.S. Geological Survey Open-File Report 97–350, 31 p.
U.S. Census Bureau, 1999, 1997 Economic census—industry series (mining, construction, and manufacturing): Informa-tion available on World Wide Web, accessed April 19, 2004, at http://www.census.gov/epcd/www/econ97.html
U.S. Census Bureau, 2000, Bridge between NAICS and SIC—1997 Economic census, core business statistics series: Washington, D.C., 331 p.
U.S. Census Bureau, 2002, North American Industry Classifi-cation System—United States, 2002: Springfield, Virginia, 1419 p.
U.S. Congress, 1995, Paper Reduction Act of 1995: Amend-ments to chapter 35 of title 44, United States Code.
U.S. Department of Agriculture, 1970, Irrigation water require-ments: Washington, D.C., Technical Release 21 (revision 2 of 1967 edition, available from National Technical Informa-tion Service, Springfield, Virginia, as NTIS Report PB 85–178390/XAB.), 88 p.
U.S. Department of Agriculture, 1976, Crop consumptive irri-gation requirements and irrigation efficiency coefficients for the United States: Washington, D.C., SCS Special Projects Division, 118 p.
U.S. Department of Agriculture, 1997, National engineering handbook, part 652, irrigation guide: Natural Resources Conservation Service, information available on World Wide Web, accessed April 14, 2004, at http://www.wcc.nrcs.usda.gov/nrcsirrig/ irrig-handbooks-part652.html
U.S. Department of Agriculture, 1999a, 1997 Census of agri-culture: National Agricultural Statistics Service, information available on World Wide Web, accessed April 14, 2004, at http://www.nass.usda.gov/census/census97/volume1/vol1pubs.htm
U.S. Department of Agriculture, 1999b, 1997 Natural resources inventory: Natural Resources Conservation Service, infor-mation available on World Wide Web, accessed April 14, 2004, at http://www.nrcs.usda.gov/technical/NRI/1997/national_results.html
U.S. Department of Agriculture, 2000a, 1998 Census of aquac-ulture: National Agricultural Statistics Service, information available on World Wide Web, accessed April 16, 2004, at http://www.nass.usda.gov/census/census97/aquaculture/aquaculture.htm
U.S. Department of Agriculture, 2000b, 1998 Census of horti-cultural specialties: National Agricultural Statistics Service, information available on World Wide Web, accessed April 14, 2004, at http://www.nass.usda.gov/census/census97/horticulture/horticulture.htm
U.S. Department of Agriculture, 2000c, 1998 Farm and ranch irrigation survey: National Agricultural Statistics Service, information available on World Wide Web, accessed April 14, 2004, at http://www.nass.usda.gov/census/census97/fris/fris.htm
U.S. Department of Agriculture, 2002, 2000 Published esti-mates database: National Agricultural Statistics Service, information available on World Wide Web, accessed April 14, 2004, at http://www.nass.usda.gov:81/ipedb/
U.S. Environmental Protection Agency, 2003, Water discharge permits, permit compliance system: Information available on World Wide Web, accessed April 13, 2004, at http://www.epa.gov/enviro/html/pcs/pcs_query_java.html
U.S. Geological Survey, 2003, Principal aquifers, in National Atlas of the United States of America: Washington, D.C., 1 sheet, information available on World Wide Web, accessed June 17, 2004, at http://nationalatlas.gov/ aquifermapwhole.html
U.S. Geological Survey, 2004, State minerals statistics and information: Information available on World Wide Web, accessed April 14, 2004, at http://minerals.usgs.gov/ minerals/pubs/state/
van der Leeden, Frits, Troise, F.L., and Todd, D.K., 1990, The water encyclopedia (2d ed.): Chelsea, Michigan, Lewis Pub-lishers, 808 p.
Vickers, A.L., 2001, Handbook of water use and conservation: Amherst, Massachusetts, WaterPlow Press, 446 p.

26 Guidelines for Preparation of State Water-Use Estimates for 2000

Supplemental Information

28 Guidelines for Preparation of State Water-Use Estimates for 2000
Table 1. Mandatory and optional data elements for the 2000 national water-use compilation.
[x, applies; --, does not apply]
Category and data elements Mandatory at county level
Mandatory at State level only
Mandatory at aquifer level
Mandatory for selected States
Optional at county level1
Public supply
Ground-water withdrawals - freshwater x -- x -- --
Surface-water withdrawals - freshwater x -- -- -- --
Ground-water withdrawals - saline water -- -- -- -- x
Surface-water withdrawals - saline water -- -- -- -- x
Population served - total -- x -- -- --
Population served - ground water -- -- -- -- x
Population served - surface water -- -- -- -- x
Number of facilities -- -- -- -- x
Reclaimed wastewater -- -- -- -- x
Domestic
Ground-water withdrawals - freshwater -- x -- -- x
Surface-water withdrawals - freshwater -- x -- -- x
Deliveries from public supply -- -- -- -- x
Consumptive use - freshwater -- -- -- -- x
Industrial
Ground-water withdrawals - freshwater x -- x -- --
Surface-water withdrawals - freshwater x -- -- -- --
Ground-water withdrawals - saline water x -- -- -- --
Surface-water withdrawals - saline water x -- -- -- --
Deliveries from public supply -- -- -- -- x
Consumptive use - freshwater -- -- -- -- x
Consumptive use - saline water -- -- -- -- x
Number of facilities -- -- -- -- x
Reclaimed wastewater -- -- -- -- x
Irrigation
Ground-water withdrawals - freshwater x -- x -- --
Surface-water withdrawals - freshwater x -- -- -- --
Ground-water withdrawals - freshwater, crop only x2 -- x2 -- x2
Surface-water withdrawals - freshwater, crop only x2 -- -- x2
Ground-water withdrawals - freshwater, golf course x2 -- x2 -- x2
Surface-water withdrawals - freshwater, golf course x2 -- -- -- x2
Acres irrigated - sprinkler x -- -- -- --
Acres irrigated - surface systems x -- -- -- --
Acres irrigated - microirrigation x -- -- -- --
Consumptive use - freshwater -- -- -- -- --
Conveyance loss -- -- -- -- x
Reclaimed wastewater -- -- -- -- x
Thermoelectric power generation
Ground-water withdrawals, once through - freshwater x -- -- -- --
Surface-water withdrawals, once through, freshwater x -- -- -- --
Surface-water withdrawals, once through - saline water x -- -- -- --
Ground-water withdrawals, closed loop - freshwater x -- -- -- --
Surface-water withdrawals, closed loop - freshwater x -- -- -- --
Surface-water withdrawals, closed loop - saline water x -- -- -- --
Deliveries from public supply - once through -- -- -- -- x

Supplemental Information 29
Thermoelectric power generation—Continued
Deliveries from public supply - closed loop -- -- -- -- x
Consumptive use, once though - freshwater -- -- -- -- x
Consumptive use, once through - saline water -- -- -- -- x
Consumptive use, closed loop - freshwater -- -- -- -- x
Consumptive use, closed loop - saline water -- -- -- -- x
Power generated - once-though -- -- -- -- x
Power generated - closed loop -- -- -- -- x
Number of facilities - once through -- -- -- -- x
Number of facilities - closed loop -- -- -- -- x
Reclaimed wastewater - once through -- -- -- -- x
Reclaimed wastewater - closed loop -- -- -- -- x
Mining -- -- --
Ground-water withdrawals - freshwater -- -- -- x3 x
Surface-water withdrawals - freshwater -- -- -- x3 x
Ground-water withdrawals - saline water -- -- -- x3 x
Surface-water withdrawals - saline water -- -- -- x3 x
Consumptive use - freshwater -- -- -- -- x
Consumptive use - saline water -- -- -- -- x
Reclaimed wastewater -- -- -- -- x
Livestock
Ground-water withdrawals - freshwater -- -- -- x4 x
Surface-water withdrawals - freshwater -- -- -- x4 x
Consumptive use - freshwater -- -- -- -- x
Aquaculture
Ground-water withdrawals - freshwater -- -- -- x5 x
Surface-water withdrawals - freshwater -- -- -- x5 x
Ground-water withdrawals - saline water -- -- -- -- x
Surface-water withdrawals - saline water -- -- -- -- x
Consumptive use - freshwater -- -- -- -- x
Consumptive use - saline water -- -- -- -- x
Commercial
Ground-water withdrawals - freshwater -- -- -- -- x
Surface-water withdrawals - freshwater -- -- -- -- x
Deliveries from public supply -- -- -- -- x
Consumptive use - freshwater -- -- -- -- x
Hydroelectric power generation
Instream water use -- -- -- -- x
Power generation -- -- -- -- x
Number of facilities -- -- -- -- x
Table 1. Mandatory and optional data elements for the 2000 national water-use compilation.
[x, applies; --, does not apply]
Category and data elements Mandatory at county level
Mandatory at State level only
Mandatory at aquifer level
Mandatory for selected States
Optional at county level1
—Continued

30 Guidelines for Preparation of State Water-Use Estimates for 2000
Wastewater treatment
Number of facilities -- -- -- -- x
Wastewater returns - public facilities -- -- -- -- x
Reclaimed wastewater -- -- -- -- x
1Any data aggregated by hydrologic cataloging unit are optional for all States.2Subdivision of irrigation withdrawals into crop and golf-course categories is optional, but both categories are mandatory if withdrawals are subdivided.3Mining withdrawals are mandatory for Alaska, Arizona, California, Florida, Indiana, Minnesota, Nebraska, Oklahoma, Pennsylvania, Texas, Utah, and
Wyoming, and are optional for all other States.4Livestock withdrawals are mandatory for California, Iowa, Kansas, Minnesota, Missouri, Nebraska, North Carolina, Oklahoma, Texas, and Wisconsin, and
are optional for all other States.5Aquaculture withdrawals are mandatory for Alabama, Arkansas, California, Idaho, Louisiana, Mississippi, North Carolina, and Utah, and are optional for all
other States.
Table 1. Mandatory and optional data elements for the 2000 national water-use compilation.
[x, applies; --, does not apply]
Category and data elements Mandatory at county level
Mandatory at State level only
Mandatory at aquifer level
Mandatory for selected States
Optional at county level1
—Continued

Supplemental Information 31
Table 2. List of principal aquifers and aquifer systems by State that are used by the U.S. Geological Survey for aggregation of 2000 water-use data.
State Name of principal aquifer or aquifer system
Alabama Coastal lowlands aquifer system
Floridan aquifer system
Mississippi embayment aquifer system
Mississippian aquifers
Pennsylvanian aquifers
Piedmont and Blue Ridge crystalline-rock aquifers
Southeastern Coastal Plain aquifer system
Surficial aquifer system
Valley and Ridge aquifers
Valley and Ridge carbonate-rock aquifers
Alaska Unconsolidated-deposit aquifers
Arizona Basin and Range basin-fill aquifers
Basin and Range carbonate-rock aquifers
Colorado Plateaus aquifers
Arkansas Alluvial aquifers
Edwards-Trinity aquifer system
Mississippi embayment aquifer system
Mississippi River Valley alluvial aquifer
Ozark Plateaus aquifer system
California Basin and Range basin-fill aquifers
Basin and Range carbonate-rock aquifers
California Coastal Basin aquifers
Central Valley aquifer system
Pacific Northwest basin-fill aquifers
Pacific Northwest volcanic-rock aquifers
Colorado Alluvial aquifers
Colorado Plateaus aquifers
Denver Basin aquifer system
High Plains aquifer
Rio Grande aquifer system
Connecticut Early Mesozoic basin aquifers
New England crystalline-rock aquifers
New York and New England carbonate-rock aquifers
Sand and gravel aquifers (glaciated regions)
Delaware Northern Atlantic Coastal Plain aquifer system
Piedmont and Blue Ridge crystalline-rock aquifers
Surficial aquifer system
District of Columbia Northern Atlantic Coastal Plain aquifer system
Piedmont and Blue Ridge crystalline-rock aquifers
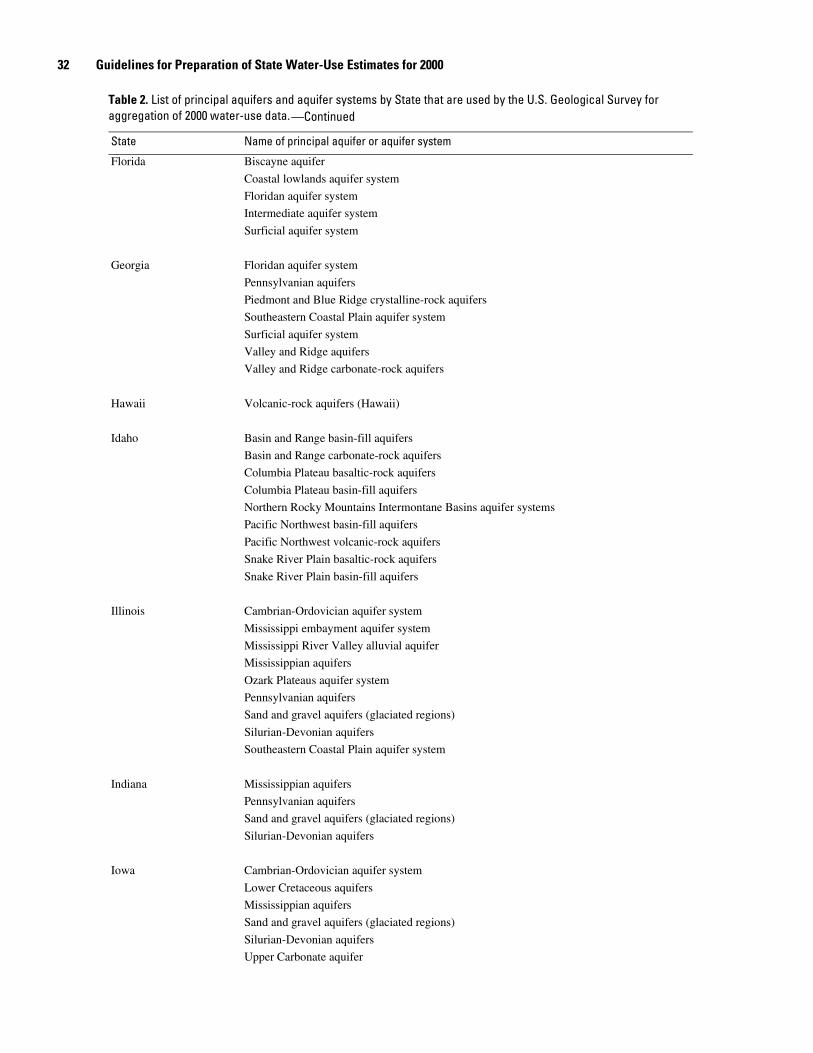
32 Guidelines for Preparation of State Water-Use Estimates for 2000
Florida Biscayne aquifer
Coastal lowlands aquifer system
Floridan aquifer system
Intermediate aquifer system
Surficial aquifer system
Georgia Floridan aquifer system
Pennsylvanian aquifers
Piedmont and Blue Ridge crystalline-rock aquifers
Southeastern Coastal Plain aquifer system
Surficial aquifer system
Valley and Ridge aquifers
Valley and Ridge carbonate-rock aquifers
Hawaii Volcanic-rock aquifers (Hawaii)
Idaho Basin and Range basin-fill aquifers
Basin and Range carbonate-rock aquifers
Columbia Plateau basaltic-rock aquifers
Columbia Plateau basin-fill aquifers
Northern Rocky Mountains Intermontane Basins aquifer systems
Pacific Northwest basin-fill aquifers
Pacific Northwest volcanic-rock aquifers
Snake River Plain basaltic-rock aquifers
Snake River Plain basin-fill aquifers
Illinois Cambrian-Ordovician aquifer system
Mississippi embayment aquifer system
Mississippi River Valley alluvial aquifer
Mississippian aquifers
Ozark Plateaus aquifer system
Pennsylvanian aquifers
Sand and gravel aquifers (glaciated regions)
Silurian-Devonian aquifers
Southeastern Coastal Plain aquifer system
Indiana Mississippian aquifers
Pennsylvanian aquifers
Sand and gravel aquifers (glaciated regions)
Silurian-Devonian aquifers
Iowa Cambrian-Ordovician aquifer system
Lower Cretaceous aquifers
Mississippian aquifers
Sand and gravel aquifers (glaciated regions)
Silurian-Devonian aquifers
Upper Carbonate aquifer
Table 2. List of principal aquifers and aquifer systems by State that are used by the U.S. Geological Survey for aggregation of 2000 water-use data.
State Name of principal aquifer or aquifer system
—Continued

Supplemental Information 33
Kansas Alluvial aquifers
High Plains aquifer
Lower Cretaceous aquifers
Ozark Plateaus aquifer system
Sand and gravel aquifers (glaciated regions)
Kentucky Alluvial aquifers
Mississippi embayment aquifer system
Mississippi River Valley alluvial aquifer
Mississippian aquifers
Ordovician aquifers
Pennsylvanian aquifers
Sand and gravel aquifers (glaciated regions)
Silurian-Devonian aquifers
Louisiana Alluvial aquifers
Coastal lowlands aquifer system
Mississippi embayment aquifer system
Mississippi River Valley alluvial aquifer
Texas coastal uplands aquifer system
Maine New England crystalline-rock aquifers
New York and New England carbonate-rock aquifers
Sand and gravel aquifers (glaciated regions)
Maryland Early Mesozoic basin aquifers
Mississippian aquifers
Northern Atlantic Coastal Plain aquifer system
Pennsylvanian aquifers
Piedmont and Blue Ridge carbonate-rock aquifers
Piedmont and Blue Ridge crystalline-rock aquifers
Surficial aquifer system
Valley and Ridge aquifers
Valley and Ridge carbonate-rock aquifers
Massachusetts Early Mesozoic basin aquifers
New England crystalline-rock aquifers
New York and New England carbonate-rock aquifers
Sand and gravel aquifers (glaciated regions)
Michigan Cambrian-Ordovician aquifer system
Jacobsville aquifer
Marshall aquifer
Pennsylvanian aquifers
Sand and gravel aquifers (glaciated regions)
Silurian-Devonian aquifers
Table 2. List of principal aquifers and aquifer systems by State that are used by the U.S. Geological Survey for aggregation of 2000 water-use data.
State Name of principal aquifer or aquifer system
—Continued

34 Guidelines for Preparation of State Water-Use Estimates for 2000
Minnesota Cambrian-Ordovician aquifer system
Lower Cretaceous aquifers
Paleozoic aquifers
Sand and gravel aquifers (glaciated regions)
Upper Carbonate aquifer
Mississippi Coastal lowlands aquifer system
Mississippi embayment aquifer system
Mississippi River Valley alluvial aquifer
Southeastern Coastal Plain aquifer system
Missouri Alluvial aquifers
Cambrian-Ordovician aquifer system
Mississippi embayment aquifer system
Mississippi River Valley alluvial aquifer
Mississippian aquifers
Ozark Plateaus aquifer system
Sand and gravel aquifers (glaciated regions)
Silurian-Devonian aquifers
Montana Alluvial aquifers
Lower Cretaceous aquifers
Lower Tertiary aquifers
Northern Great Plains aquifer system
Northern Rocky Mountains Intermontane Basins aquifer systems
Pacific Northwest volcanic-rock aquifers
Paleozoic aquifers
Sand and gravel aquifers (glaciated regions)
Upper Cretaceous aquifers
Nebraska Alluvial aquifers
High Plains aquifer
Lower Cretaceous aquifers
Sand and gravel aquifers (glaciated regions)
Nevada Basin and Range basin-fill aquifers
Basin and Range carbonate-rock aquifers
Pacific Northwest basin-fill aquifers
Pacific Northwest volcanic-rock aquifers
Southern Nevada volcanic-rock aquifers
New Hampshire New England crystalline-rock aquifers
Sand and gravel aquifers (glaciated regions)
New Jersey Early Mesozoic basin aquifers
New York and New England carbonate-rock aquifers
Northern Atlantic Coastal Plain aquifer system
Piedmont and Blue Ridge carbonate-rock aquifers
Table 2. List of principal aquifers and aquifer systems by State that are used by the U.S. Geological Survey for aggregation of 2000 water-use data.
State Name of principal aquifer or aquifer system
—Continued

Supplemental Information 35
New Jersey—Continued Piedmont and Blue Ridge crystalline-rock aquifers
Sand and gravel aquifers (glaciated regions)
Surficial aquifer system
Valley and Ridge aquifers
Valley and Ridge carbonate-rock aquifers
New Mexico Basin and Range basin-fill aquifers
Colorado Plateaus aquifers
High Plains aquifer
Pecos River Basin alluvial aquifer
Rio Grande aquifer system
Roswell Basin aquifer system
New York Early Mesozoic basin aquifers
New England crystalline-rock aquifers
New York and New England carbonate-rock aquifers
New York Sandstone aquifers
Northern Atlantic Coastal Plain aquifer system
Piedmont and Blue Ridge crystalline-rock aquifers
Sand and gravel aquifers (glaciated regions)
Valley and Ridge aquifers
North Carolina Castle Hayne aquifer
Early Mesozoic basin aquifers
Northern Atlantic Coastal Plain aquifer system
Piedmont and Blue Ridge carbonate-rock aquifers
Piedmont and Blue Ridge crystalline-rock aquifers
Southeastern Coastal Plain aquifer system
Surficial aquifer system
Valley and Ridge aquifers
North Dakota Alluvial aquifers
Lower Cretaceous aquifers
Lower Tertiary aquifers
Northern Great Plains aquifer system
Paleozoic aquifers
Sand and gravel aquifers (glaciated regions)
Upper Cretaceous aquifers
Ohio Alluvial aquifers
Mississippian aquifers
Pennsylvanian aquifers
Sand and gravel aquifers (glaciated regions)
Silurian-Devonian aquifers
Oklahoma Ada-Vamoosa aquifer
Alluvial aquifers
Arbuckle-Simpson aquifer
Table 2. List of principal aquifers and aquifer systems by State that are used by the U.S. Geological Survey for aggregation of 2000 water-use data.
State Name of principal aquifer or aquifer system
—Continued
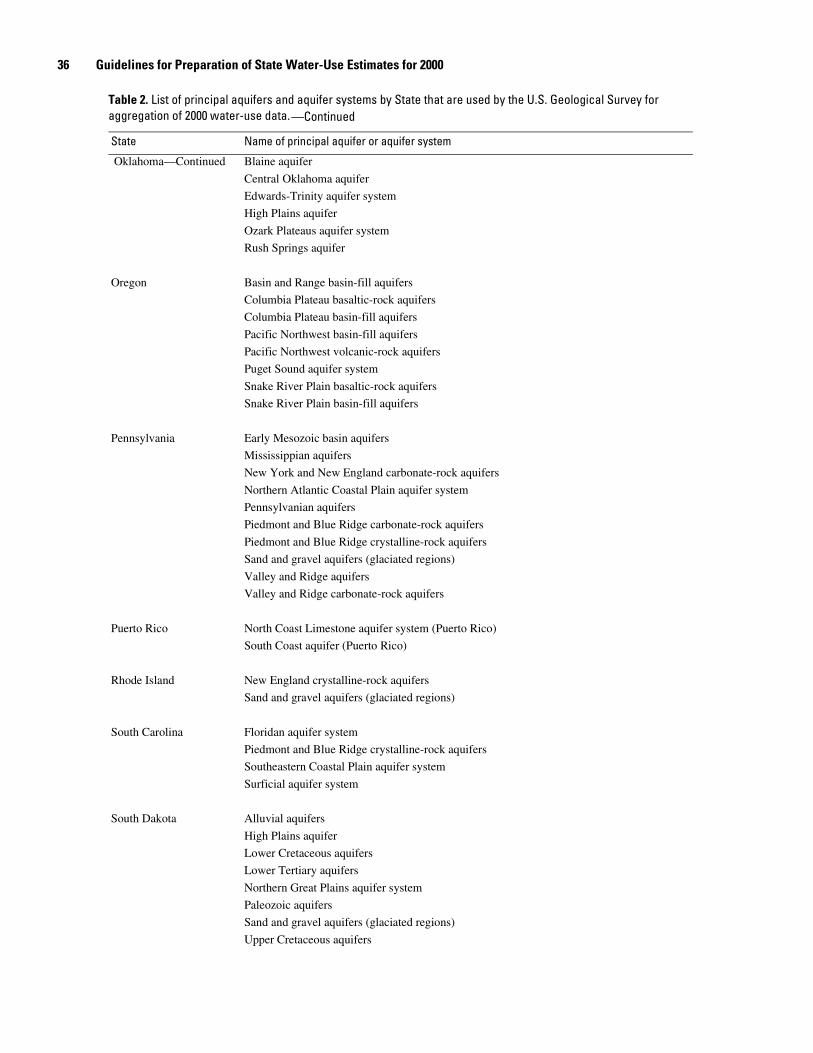
36 Guidelines for Preparation of State Water-Use Estimates for 2000
Oklahoma—Continued Blaine aquifer
Central Oklahoma aquifer
Edwards-Trinity aquifer system
High Plains aquifer
Ozark Plateaus aquifer system
Rush Springs aquifer
Oregon Basin and Range basin-fill aquifers
Columbia Plateau basaltic-rock aquifers
Columbia Plateau basin-fill aquifers
Pacific Northwest basin-fill aquifers
Pacific Northwest volcanic-rock aquifers
Puget Sound aquifer system
Snake River Plain basaltic-rock aquifers
Snake River Plain basin-fill aquifers
Pennsylvania Early Mesozoic basin aquifers
Mississippian aquifers
New York and New England carbonate-rock aquifers
Northern Atlantic Coastal Plain aquifer system
Pennsylvanian aquifers
Piedmont and Blue Ridge carbonate-rock aquifers
Piedmont and Blue Ridge crystalline-rock aquifers
Sand and gravel aquifers (glaciated regions)
Valley and Ridge aquifers
Valley and Ridge carbonate-rock aquifers
Puerto Rico North Coast Limestone aquifer system (Puerto Rico)
South Coast aquifer (Puerto Rico)
Rhode Island New England crystalline-rock aquifers
Sand and gravel aquifers (glaciated regions)
South Carolina Floridan aquifer system
Piedmont and Blue Ridge crystalline-rock aquifers
Southeastern Coastal Plain aquifer system
Surficial aquifer system
South Dakota Alluvial aquifers
High Plains aquifer
Lower Cretaceous aquifers
Lower Tertiary aquifers
Northern Great Plains aquifer system
Paleozoic aquifers
Sand and gravel aquifers (glaciated regions)
Upper Cretaceous aquifers
Table 2. List of principal aquifers and aquifer systems by State that are used by the U.S. Geological Survey for aggregation of 2000 water-use data.
State Name of principal aquifer or aquifer system
—Continued

Supplemental Information 37
Tennessee Alluvial aquifers
Mississippi embayment aquifer system
Mississippi River Valley alluvial aquifer
Mississippian aquifers
Ordovician aquifers
Pennsylvanian aquifers
Piedmont and Blue Ridge crystalline-rock aquifers
Silurian-Devonian aquifers
Southeastern Coastal Plain aquifer system
Valley and Ridge aquifers
Valley and Ridge carbonate-rock aquifers
Texas Alluvial aquifers
Blaine aquifer
Coastal lowlands aquifer system
Edwards-Trinity aquifer system
High Plains aquifer
Mississippi embayment aquifer system
Pecos River Basin alluvial aquifer
Rio Grande aquifer system
Seymour aquifer
Texas coastal uplands aquifer system
Utah Alluvial aquifers
Basin and Range basin-fill aquifers
Basin and Range carbonate-rock aquifers
Colorado Plateaus aquifers
Pacific Northwest basin-fill aquifers
Pacific Northwest volcanic-rock aquifers
Vermont New England crystalline-rock aquifers
New York and New England carbonate-rock aquifers
Sand and gravel aquifers (glaciated regions)
Virgin Islands Kingshill aquifer (Virgin Islands)
Virginia Early Mesozoic basin aquifers
Mississippian aquifers
Northern Atlantic Coastal Plain aquifer system
Pennsylvanian aquifers
Piedmont and Blue Ridge crystalline-rock aquifers
Surficial aquifer system
Valley and Ridge aquifers
Valley and Ridge carbonate-rock aquifers
Washington Columbia Plateau basaltic-rock aquifers
Columbia Plateau basin-fill aquifers
Northern Rocky Mountains Intermontane Basins aquifer systems
Table 2. List of principal aquifers and aquifer systems by State that are used by the U.S. Geological Survey for aggregation of 2000 water-use data.
State Name of principal aquifer or aquifer system
—Continued

38 Guidelines for Preparation of State Water-Use Estimates for 2000
Washington—Continued Pacific Northwest basin-fill aquifers
Pacific Northwest volcanic-rock aquifers
Puget Sound aquifer system
Willamette Lowland basin-fill aquifers
West Virginia Alluvial aquifers
Mississippian aquifers
Pennsylvanian aquifers
Valley and Ridge aquifers
Valley and Ridge carbonate-rock aquifers
Wisconsin Cambrian-Ordovician aquifer system
Jacobsville aquifer
Sand and gravel aquifers (glaciated regions)
Silurian-Devonian aquifers
Wyoming Alluvial aquifers
Colorado Plateaus aquifers
High Plains aquifer
Lower Cretaceous aquifers
Lower Tertiary aquifers
Northern Great Plains aquifer system
Northern Rocky Mountains Intermontane Basins aquifer systems
Pacific Northwest basin-fill aquifers
Pacific Northwest volcanic-rock aquifers
Paleozoic aquifers
Upper Cretaceous aquifers
Wyoming Tertiary aquifers
Table 2. List of principal aquifers and aquifer systems by State that are used by the U.S. Geological Survey for aggregation of 2000 water-use data.
State Name of principal aquifer or aquifer system
—Continued

Supplemental Information 39
Table 3. List of Standard Industrial Classification (SIC) codes by water-use category.
Water-use category SIC code or range Description
Public supply 4941 Water supply
Domestic 8811 Private households
Industrial 1521–1522 General building contractors—residential buildings
1531 Operative builders
1541–1542 General building contractors—nonresidential buildings
1611 Highway and street construction, except elevated highways
1622–1629 Heavy construction, except highway and street construction
1711 Plumbing, heating, air-conditioning
1721 Painting and paper hanging
1731 Electrical work
1741–1743 Masonry, stonework, tile setting, and plastering
1751–1752 Carpentry and floor work
1761 Roofing, siding, and sheet metal work
1771 Concrete work
1781 Water well drilling
1791–1799 Miscellaneous special trade contractors
2011–2015 Meat products
2021–2026 Dairy products
2032–2038 Canned, frozen, and preserved fruits, and vegetables, and food specialties
2041–2048 Grain mill products
2051–2053 Bakery products
2061–2068 Sugar and confectionery products
2074–2079 Fats and oils
2082–2087 Beverages
2091–2099 Miscellaneous food preparations and kindred products
2111 Cigarettes
2121 Cigars
2131 Chewing and smoking tobacco and snuff
2141 Tobacco stemming and redrying
2211 Broadwoven fabric mills, cotton
2221 Broadwoven fabric mills, manmade fiber and silk
2231 Broadwoven fabric mills, wool (including dyeing and finishing)
2241 Narrow fabric and other smallwares mills: cotton, wool, silk, and manmade fiber
2251–2259 Knitting mills
2261–2269 Dyeing and finishing textiles, except wool fabrics and knit goods
2273 Carpets and rugs
2281–2284 Yarn and thread mills
2295–2299 Miscellaneous textile goods

40 Guidelines for Preparation of State Water-Use Estimates for 2000
Industrial—Continued 2311 Men's and boys' suits, coats and overcoats
2321–2329 Men's and boys' furnishings, work clothing, and allied garments
2331–2339 Women's, misses', and juniors' outerwear
2341–2342 Women's, misses', children's, and infants' undergarments
2353 Hats, caps, and millinery
2361–2369 Girls', children's, and infants' outerwear
2371 Fur goods
2381–2389 Miscellaneous apparel and accessories
2391–2399 Miscellaneous fabricated textile products
2411 Logging
2421–2429 Sawmills and planing mills
2431–2439 Millwork, veneer, plywood, and structural wood members
2441–2449 Wood containers
2451–2452 Wood buildings and mobile homes
2491–2499 Miscellaneous wood products
2511–2519 Household furniture
2521–2522 Office furniture
2531 Public building and related furniture
2541–2542 Partitions, shelving, lockers, and office and store fixtures
2591–2599 Miscellaneous furniture and fixtures
2611 Pulp mills
2621 Paper mills
2631 Paperboard mills
2652–2657 Paperboard containers and boxes
2671–2679 Converted paper and paperboard products, except containers and boxes
2711 Newspapers: publishing, or publishing and printing
2721 Periodicals: publishing, or publishing and printing
2731–2732 Books
2741 Miscellaneous publishing
2752–2759 Commercial printing
2761 Manifold business forms
2771 Greeting cards
2782–2789 Blankbooks, looseleaf binders, and bookbinding and related work
2791–2796 Service industries for the printing trade
2812–2819 Industrial inorganic chemicals
2821–2824 Plastics materials and synthetic resins, synthetic rubber, cellulosic and other manmade fibers, except glass
2833–2836 Drugs
2841–2844 Soap, detergents, and cleaning preparations; perfumes, cosmetics, and other toilet preparations
2851 Paints, varnishes, lacquers, enamels, and allied products
2861–2869 Industrial organic chemicals
Table 3. List of Standard Industrial Classification (SIC) codes by water-use category.
Water-use category SIC code or range Description
—Continued

Supplemental Information 41
Industrial—Continued 2873–2879 Agricultural chemicals
2891–2899 Miscellaneous chemical products
2911 Petroleum refining
2951–2952 Asphalt paving and roofing materials
2992–2999 Miscellaneous products of petroleum and coal
3011 Tires and inner tubes
3021 Rubber and plastics footwear
3052–3053 Gaskets, packing, and sealing devices and rubber and plastic hose and belting
3061–3069 Fabricated rubber products, not elsewhere classified
3081–3089 Miscellaneous plastics products
3111 Leather tanning and finishing
3131 Boot and shoe cut stock and findings
3142–3149 Footwear, except rubber
3151 Leather gloves and mittens
3161 Luggage
3171–3172 Handbags and other personal leather goods
3199 Leather goods, not elsewhere classified
3211 Flat glass
3221–3229 Glass and glassware, pressed or blown
3231 Glass products, made of purchased glass
3241 Cement, hydraulic
3251–3259 Structural clay products
3261–3269 Pottery and related products
3271–3275 Concrete, gypsum, and plaster products
3281 Cut stone and stone products
3291–3299 Abrasive, asbestos, and miscellaneous nonmetallic mineral products
3312–3317 Steel works, blast furnaces, and rolling and finishing mills
3321–3325 Iron and steel foundries
3331–3339 Primary smelting and refining of nonferrous metals
3341 Secondary smelting and refining of nonferrous metals
3351–3357 Rolling, drawing, and extruding of nonferrous metals
3363–3369 Nonferrous foundries (castings)
3398–3399 Miscellaneous primary metal products
3411–3412 Metal cans and shipping containers
3421–3429 Cutlery, handtools, and general hardware
3431–3433 Heating equipment, except electric and warm air; and plumbing fixtures
3441–3449 Fabricated structural metal products
3451–3452 Screw machine products, and bolts, nuts, screws, rivets, and washers
3462–3469 Metal forgings and stampings
3471–3479 Coating, engraving, and allied services
Table 3. List of Standard Industrial Classification (SIC) codes by water-use category.
Water-use category SIC code or range Description
—Continued

42 Guidelines for Preparation of State Water-Use Estimates for 2000
Industrial—Continued 3482–3489 Ordnance and accessories, except vehicles and guided missiles
3491–3499 Miscellaneous fabricated metal products
3511–3519 Engines and turbines
3523–3524 Farm and garden machinery and equipment
3531–3537 Construction, mining, and materials handling machinery and equipment
3541–3549 Metalworking machinery and equipment
3552–3559 Special industry machinery, except metalworking machinery
3561–3569 General industrial machinery and equipment
3571–3579 Computer and office equipment
3581–3589 Refrigeration and service industry machinery
3592–3599 Miscellaneous industrial and commercial machinery and equipment
3612–3613 Electric transmission and distribution equipment
3621–3629 Electrical industrial apparatus
3631–3639 Household appliances
3641–3648 Electric lighting and wiring equipment
3651–3652 Household audio and video equipment, and audio recordings
3661–3669 Communications equipment
3671–3679 Electronic components and accessories
3691–3699 Miscellaneous electrical machinery, equipment, and supplies
3711–3716 Motor vehicles and motor vehicle equipment
3721–3728 Aircraft and parts
3731–3732 Ship and boat building and repairing
3743 Railroad equipment
3751 Motorcycles, bicycles, and parts
3761–3769 Guided missiles and space vehicles and parts
3792–3799 Miscellaneous transportation equipment
3812 Search, detection, navigation, guidance, aeronautical, and nautical systems, instruments, and equipment
3821–3829 Laboratory apparatus and analytical, optical, measuring and controlling instruments
3841–3845 Surgical, medical, and dental instruments and supplies
3851 Ophthalmic goods
3861 Photographic equipment and supplies
3873 Watches, clocks, clockwork operated devices, and parts
3911–3915 Jewelry, silverware, and plated ware
3931 Musical instruments
3942–3949 Dolls, toys, games and sporting and athletic goods
3951–3955 Pens, pencils, and other artists' materials
3961–3965 Costume jewelry, costume novelties, buttons, and miscellaneous notions, except precious metal
3991–3999 Miscellaneous manufacturing industries
Irrigation 0111–0119 Cash grains (wheat, rice, corn, soybeans, other)
Table 3. List of Standard Industrial Classification (SIC) codes by water-use category.
Water-use category SIC code or range Description
—Continued

Supplemental Information 43
Irrigation—Continued 0131–0139 Field crops, except cash grains (cotton, tobacco, sugarcane, sugarbeets, potatoes, alfalfa, hay, other)
0161 Vegetables and melons
0171–0179 Fruits and tree nuts (berry crops, grapes, tree nuts, citrus fruit, deciduous tree fruits, other)
0181–0182 Horticultural specialties (ornamental floriculture and nursery products including sod farms, food crops grown under cover)
0191 General farms, primarily crop
4971 Irrigation systems
7992 Public golf courses
7997 Membership sports and recreation clubs
Thermoelectric power 4911 Electric services
Mining 1011 Iron ores
1021 Copper ores
1031 Lead and zinc ores
1041–1044 Gold and silver ores
1061 Ferroalloy ores, except vanadium
1081 Metal mining services
1094–1099 Miscellaneous metal ores
1221–1222 Bituminous coal and lignite mining
1231 Anthracite mining
1241 Coal mining services
1311 Crude petroleum and natural gas
1321 Natural gas liquids
1381–1389 Oil and gas field services
1411 Dimension stone
1422–1429 Crushed and broken stone, including riprap
1442–1446 Sand and gravel
1455–1459 Clay, ceramic, and refractory minerals
1474–1479 Chemical and fertilizer mineral mining
1481 Nonmetallic minerals services, except fuels
1499 Miscellaneous nonmetallic minerals, except fuels
Livestock 0211–0219 Livestock, except dairy and poultry (beef cattle, hogs, sheep and goats)
0240–0241 Dairy farms
0251–0259 Poultry and eggs farms (chickens, turkeys, ducks, other)
0271 Fur-bearing animals and rabbits
0272 Horses and other equines
0279 Animal specialties, not elsewhere classified
0291 General farms, primarily livestock and animal specialties
Aquaculture 0273 Animal aquaculture (catfish, crustaceans, finfish, tropical fish, trout)
0921 Fish hatcheries and preserves
Table 3. List of Standard Industrial Classification (SIC) codes by water-use category.
Water-use category SIC code or range Description
—Continued
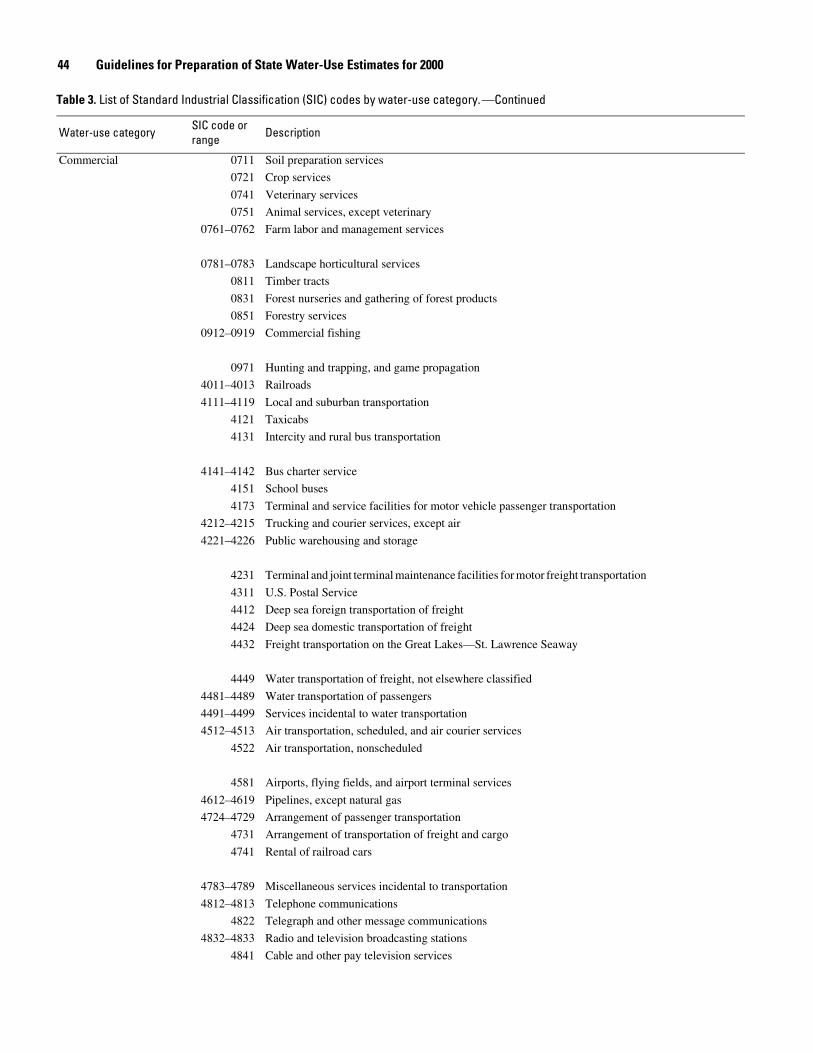
44 Guidelines for Preparation of State Water-Use Estimates for 2000
Commercial 0711 Soil preparation services
0721 Crop services
0741 Veterinary services
0751 Animal services, except veterinary
0761–0762 Farm labor and management services
0781–0783 Landscape horticultural services
0811 Timber tracts
0831 Forest nurseries and gathering of forest products
0851 Forestry services
0912–0919 Commercial fishing
0971 Hunting and trapping, and game propagation
4011–4013 Railroads
4111–4119 Local and suburban transportation
4121 Taxicabs
4131 Intercity and rural bus transportation
4141–4142 Bus charter service
4151 School buses
4173 Terminal and service facilities for motor vehicle passenger transportation
4212–4215 Trucking and courier services, except air
4221–4226 Public warehousing and storage
4231 Terminal and joint terminal maintenance facilities for motor freight transportation
4311 U.S. Postal Service
4412 Deep sea foreign transportation of freight
4424 Deep sea domestic transportation of freight
4432 Freight transportation on the Great Lakes—St. Lawrence Seaway
4449 Water transportation of freight, not elsewhere classified
4481–4489 Water transportation of passengers
4491–4499 Services incidental to water transportation
4512–4513 Air transportation, scheduled, and air courier services
4522 Air transportation, nonscheduled
4581 Airports, flying fields, and airport terminal services
4612–4619 Pipelines, except natural gas
4724–4729 Arrangement of passenger transportation
4731 Arrangement of transportation of freight and cargo
4741 Rental of railroad cars
4783–4789 Miscellaneous services incidental to transportation
4812–4813 Telephone communications
4822 Telegraph and other message communications
4832–4833 Radio and television broadcasting stations
4841 Cable and other pay television services
Table 3. List of Standard Industrial Classification (SIC) codes by water-use category.
Water-use category SIC code or range Description
—Continued

Supplemental Information 45
Commercial—Continued 4899 Communications services, not elsewhere classified
4922–4925 Gas production and distribution
4931–4939 Combination electric and gas, other utility services
4953–4959 Sanitary services, other than sewage systems
4961 Steam and air-conditioning supply
5012–5015 Motor vehicles and motor vehicle parts and supplies
5021–5023 Furniture and home furnishings
5031–5039 Lumber and construction materials
5043–5049 Professional and commercial, equipment and supplies
5051–5052 Metals and minerals, except petroleum
5063–5065 Electrical goods
5072–5078 Hardware, and plumbing and heating equipment and supplies
5082–5088 Machinery, equipment, and supplies
5091–5099 Miscellaneous durable goods
5111–5113 Paper and paper products
5122 Drugs, drug proprietaries, and druggists' sundries
5131–5139 Apparel, piece goods, and notions
5141–5149 Groceries and related products
5153–5159 Farm-product raw materials
5162–5169 Chemicals and allied products
5171–5172 Petroleum and petroleum products
5181–5182 Beer, wine, and distilled alcoholic beverages
5191–5199 Miscellaneous nondurable goods
5211 Lumber and other building materials dealers
5231 Paint, glass, and wallpaper stores
5251 Hardware stores
5261 Retail nurseries and garden supply stores
5271 Mobile home dealers
5311 Department stores
5331 Variety stores
5399 Miscellaneous general merchandise stores
5411 Grocery stores
5421 Meat and fish (seafood) markets, including freezer provisioners
5431 Fruit and vegetable markets
5441 Candy, nut, and confectionery stores
5451 Dairy products stores
5461 Retail bakeries
5499 Miscellaneous food stores
5511 Motor vehicle dealers (new and used)
5521 Motor vehicle dealers (used only)
Table 3. List of Standard Industrial Classification (SIC) codes by water-use category.
Water-use category SIC code or range Description
—Continued

46 Guidelines for Preparation of State Water-Use Estimates for 2000
Commercial—Continued 5531 Auto and home supply stores
5541 Gasoline service stations
5551 Boat dealers
5561 Recreational vehicle dealers
5571 Motorcycle dealers
5599 Automotive dealers, not elsewhere classified
5611 Men's and boys' clothing and accessory stores
5621 Women's clothing stores
5632 Women's accessory and specialty stores
5641 Children's and infants' wear stores
5651 Family clothing stores
5661 Shoe stores
5699 Miscellaneous apparel and accessory stores
5712–5719 Home furniture and furnishing stores
5722 Household appliance stores
5731–5736 Radio, television, consumer electronics, and music stores
5812–5813 Eating and drinking places
5912 Drug stores and proprietary stores
5921 Liquor stores
5932 Used merchandise stores
5941–5949 Miscellaneous shopping goods stores
5961–5963 Nonstore retailers
5983–5989 Fuel dealers
5992–5999 Retail stores, not elsewhere classified
6011–6019 Central Reserve depository institutions
6021–6029 Commercial banks
6035–6036 Savings institutions
6061–6062 Credit unions
6081–6082 Foreign banking and branches and agencies of foreign banks
6091–6099 Functions related to depository banking
6111 Federal and Federally sponsored credit agencies
6141 Personal credit institutions
6153–6159 Business credit institutions
6162–6163 Mortgage bankers and brokers
6211 Security brokers, dealers, and flotation companies
6221 Commodity contracts brokers and dealers
6231 Security and commodity exchanges
6182–6189 Services allied with the exchange of securities or commodities
6311 Life insurance
6321–6324 Accident and health insurance and medical service plans
Table 3. List of Standard Industrial Classification (SIC) codes by water-use category.
Water-use category SIC code or range Description
—Continued

Supplemental Information 47
Commercial—Continued 6331 Fire, marine, and casualty insurance
6351 Surety insurance
6361 Title insurance
6371 Pension, health, and welfare funds
6399 Insurance carriers, not elsewhere classified
6411 Insurance agents, brokers, and service
6512–6519 Real estate operators (except developers) and lessors
6531 Real estate agents and managers
6541 Title abstract offices
6552–6553 Land subdividers and developers
6712–6719 Holding offices
6722–6726 Investment offices
6732–6733 Trusts
6792–6799 Miscellaneous investing
7011 Hotels and motels
7021 Rooming and boarding houses
7032–7033 Camps and recreational vehicle parks
7041 Organization hotels and lodging houses, on membership basis
7211–7219 Laundry, cleaning, and garment services
7221 Photographic studios, portrait
7231 Beauty shops
7241 Barber shops
7251 Shoe repair shops and shoeshine parlors
7261 Funeral service and crematories
7291–7299 Miscellaneous personal services
7311–7319 Advertising
7322–7323 Consumer credit reporting agencies, mercantile reporting agencies, and adjustment and collection agencies
7331–7338 Mailing, reproduction, commercial art and photography, and stenographic services
7342–7349 Services to dwellings and other buildings
7352–7359 Miscellaneous equipment rental and leasing
7361–7363 Personnel supply services
7371–7379 Computer programming, data processing, and other computer related services
7381–7389 Miscellaneous business services
7513–7519 Automotive rental and leasing, without drivers
7521 Automobile parking
7532–7539 Automotive repair shops
7542–7549 Automotive services, except repair
7622–7629 Electrical repair shops
7631 Watch, clock, and jewelry repair
7641 Re-upholstery and furniture repair
Table 3. List of Standard Industrial Classification (SIC) codes by water-use category.
Water-use category SIC code or range Description
—Continued
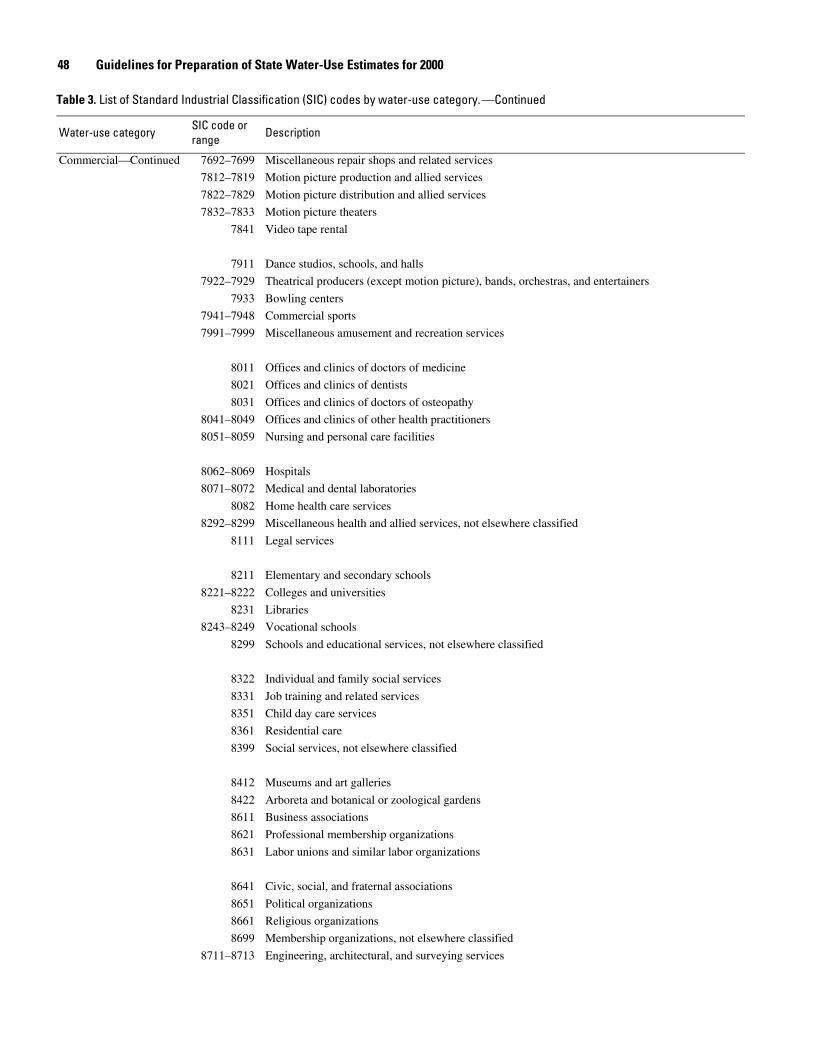
48 Guidelines for Preparation of State Water-Use Estimates for 2000
Commercial—Continued 7692–7699 Miscellaneous repair shops and related services
7812–7819 Motion picture production and allied services
7822–7829 Motion picture distribution and allied services
7832–7833 Motion picture theaters
7841 Video tape rental
7911 Dance studios, schools, and halls
7922–7929 Theatrical producers (except motion picture), bands, orchestras, and entertainers
7933 Bowling centers
7941–7948 Commercial sports
7991–7999 Miscellaneous amusement and recreation services
8011 Offices and clinics of doctors of medicine
8021 Offices and clinics of dentists
8031 Offices and clinics of doctors of osteopathy
8041–8049 Offices and clinics of other health practitioners
8051–8059 Nursing and personal care facilities
8062–8069 Hospitals
8071–8072 Medical and dental laboratories
8082 Home health care services
8292–8299 Miscellaneous health and allied services, not elsewhere classified
8111 Legal services
8211 Elementary and secondary schools
8221–8222 Colleges and universities
8231 Libraries
8243–8249 Vocational schools
8299 Schools and educational services, not elsewhere classified
8322 Individual and family social services
8331 Job training and related services
8351 Child day care services
8361 Residential care
8399 Social services, not elsewhere classified
8412 Museums and art galleries
8422 Arboreta and botanical or zoological gardens
8611 Business associations
8621 Professional membership organizations
8631 Labor unions and similar labor organizations
8641 Civic, social, and fraternal associations
8651 Political organizations
8661 Religious organizations
8699 Membership organizations, not elsewhere classified
8711–8713 Engineering, architectural, and surveying services
Table 3. List of Standard Industrial Classification (SIC) codes by water-use category.
Water-use category SIC code or range Description
—Continued

Supplemental Information 49
Commercial—Continued 8721 Accounting, auditing, and bookkeeping services
8731–8734 Research and testing services
8741–8748 Management and public relations
8999 Services, not elsewhere classified
9111 Executive offices
9121 Legislative bodies
9131 Executive and legislative offices combined
9199 General government, not elsewhere classified
9211 Courts
9221–9229 Public order and safety
9311 Public finance, taxation, and monetary policy
9411 Administration of educational programs
9431 Administration of public health programs
9441 Administration of social, human resource and income maintenance programs
9451 Administration of veterans' affairs, except health and insurance
9511–9512 Administration of environmental quality programs
9531–9532 Housing and urban development
9611 Administration of general economic programs
9621 Regulation and administration of transportation programs
9631 Regulation and administration of communications, electric, gas and other utilities
9641 Regulation of agricultural marketing and commodities
9651 Regulation, licensing, and inspection of miscellaneous commercial sectors
9661 Space research and technology
9711 National security
9721 International affairs
Hydroelectric power 4911 Electric services
Table 3. List of Standard Industrial Classification (SIC) codes by water-use category.
Water-use category SIC code or range Description
—Continued