guidelines for reliability analysis of digital systems …€¦ · guidelines for reliability...
TRANSCRIPT

VTT-M-08815-13
NOTES
1 (5)
Guidelines for reliability analysis of digital systems in
PSA context
DIGREL Seminar
Drawn up by: Kim Björkman & Tero Tyrväinen, VTT, Jan-Erik Holmberg,
Risk Pilot, 2013
Date: November 26, 2013
Place: VTT Digitalo, Vuorimiehentie 3, Espoo, Finland
Participants:
Name Organisation Country
Jan-Erik Holmberg Risk Pilot Finland
Ola Bäckström Lloyd’s Register Consulting -
Energy AB
Sweden
Mariana Jockenhövel-
Bartfeld
Areva Germany
Wietske Postma NRG Netherlands
Alexander
Konovalenko
KTH Sweden
Stefan Eriksson RAB Sweden
Jari Pesonen TVO Finland
Atte Helminen TVO Finland
Anders Karlsson FKA Sweden
Tero Tyrväinen VTT Finland
Kim Björkman VTT Finland
Jari Hämäläinen VTT Finland
Markus Porthin VTT Finland
Essi Ahonen STUK Finland
Jorma Sandberg STUK Finland
Heimo Takala STUK Finland
Björn Wahlström BEWAS Finland
Ilkka Männistö Fennovoima Finland

VTT-M-08815-13 2 (5)
1 Opening of the seminar
Jan-Erik Holmberg, Risk Pilot, opened the seminar, welcomed the
participants and presented the agenda (Att. 1).
Participants presented themselves.
2 Status of NKS/NPSAG DIGREL project, overview of the activities
Jan-Erik Holmberg, Risk Pilot, presented the objectives and scope of the
DIGREL Nordic NKS research activity (Att. 2).
3 WGRISK TG DIGREL, failure modes taxonomy report
Jan-Erik Holmberg, Risk Pilot, presented the objectives and scope of the
WGRISK DIGREL task (Att. 3). The task focuses on failure model
taxonomy and on application of the taxonomy in PRA modelling. He also
presented the developed taxonomy and the contents of the related
WGRISK/DIGREL working report.
The definitions of different uncovering situations of faults were discussed.
Also the complexity of digital I&C model was discussed. The proposed
approach will consider digital I&C related faults, e.g. software faults, in
more detail than current industrial PRAs generally do.
4 Experiments with the Nordic example PSA model
Jan-Erik Holmberg, Risk Pilot, presented the background of the Nordic
example PSA model and the structure of the model (Att. 4). The example
model has been modelled and analysed with Risk Spectrum and FinPSA.
The example model has, thus far, been used to evaluate, for instance,
hardware failure modes, level of detail and default values (fault tolerant
design). Software failures will be included in the model in 2013-2014.
Tero Tyrväinen, VTT, presented the FinPSA version of the example
model (Att. 5). He introduced the alternative I&C modelling approach of
FinPSA and some preliminary results of the model analysis.
5 Software quantification
Ola Bäckström, Lloyd’s Register Consulting - Energy AB, presented a
method for quantification of reactor protection system software failures in
nuclear PSA context (Att. 6).
The categorization of the transformation of Functional Requirements
Specifications to the application software was briefly discussed. The way
the software is classified into the V&V software was discussed. One
alternative is to utilize Safety Integrity Levels of the standard IEC 61508.

VTT-M-08815-13 3 (5)
6 Common Cause Failure Analysis of Teleperm XS for the PSA
Mariana Jockenhövel-Bartfeld, AREVA GmbH, presented probabilistic
analysis of software common cause failures and effects of TXS (att. 7).
The presentation included a short introduction to the TXS platform and
the engineering process, specifically the V&V process. She presented the
general faults and failure modes of TXS software, the triggering
mechanisms of software CCF, the assessment of relevant TXS CCF
modes, and the modelling TXS software CCF in the PSA.
The assignment of software modules to hardware modules was discussed,
as well as, the definitions of application software, operating system
software and system software in design and when the software is running.
In TXS the operating system software can be considered to be part of the
system software.
7 TOPAAS
Wietske Postma, NRG, presented the TOPAAS (Task-Oriented
Probability of Abnormalities Analysis for Software) approach, which is a
tool for the assessment of software reliability (att. 8). An example of the
approach was presented. The approach is being refined. The method has
been used in several real life Quantitative Risk Analyses in the
Netherlands.
The definition of TOPAAS software module corresponds to the definition
of application software in DIGREL.
8 Software reliability quantification Markus Porthin
Markus Porthin, VTT, gave a presentation on software reliability
quantification (att. 9). The presented approach is based on using
Bayesian Belief Networks for the quantification. There are three main
branches that influence the failure probability of task execution; software
development process (V&V), the complexity of the product, and test and
user experiences.
9 Discussion, conclusions of the seminar
The discussion included the following topics:
License-holders are little worried on PSA model complexity with
regard to I&C. A good approach might be to keep PSA model as
simple as possible and keep more detailed model in background.
Concept of fatal and non-fatal failure is not completely clear for
everybody and needs to be clarified more.
To give a failure probability below 1E-5 for a software failure
needs to be justified convincingly. BBN approach might suit for
that.
An analytical method is needed to assess non-fatal failures. Fatal
failures can be assessed using AREVA’s approach, i.e.,
VTT-M-08815-13 4 (5)
operational data from processors. For hardware failures vendors
should have enough data.
OECD/NEA CCF data collection project ICDE has taken over the
responsibility to collect I&C system related data. There was an
earlier effort called COMPSIS, which was not so successful and
was then terminated by OECD/NEA. It may be difficult to get
statistical applicable failure data from safety-critical I&C, but at
least data may provide some qualitative insights. DIGREL has an
opportunity to give guidance for the new I&C data collection
effort.
It was concluded that the outlined BBN model is already complex
enough. If more nodes are added to model, it will be difficult find
data for the probability tables.
Active failures in PSA: spurious signal is already one of the
considered failure modes.
Attachments
1. Agenda
2–9. Presentations
DISTRIBUTION Seminar participants, NPSAG representatives, SAFIR RG2 and
RG 8, NKS-R Programme Manager
VTT-M-08815-13 5 (5)
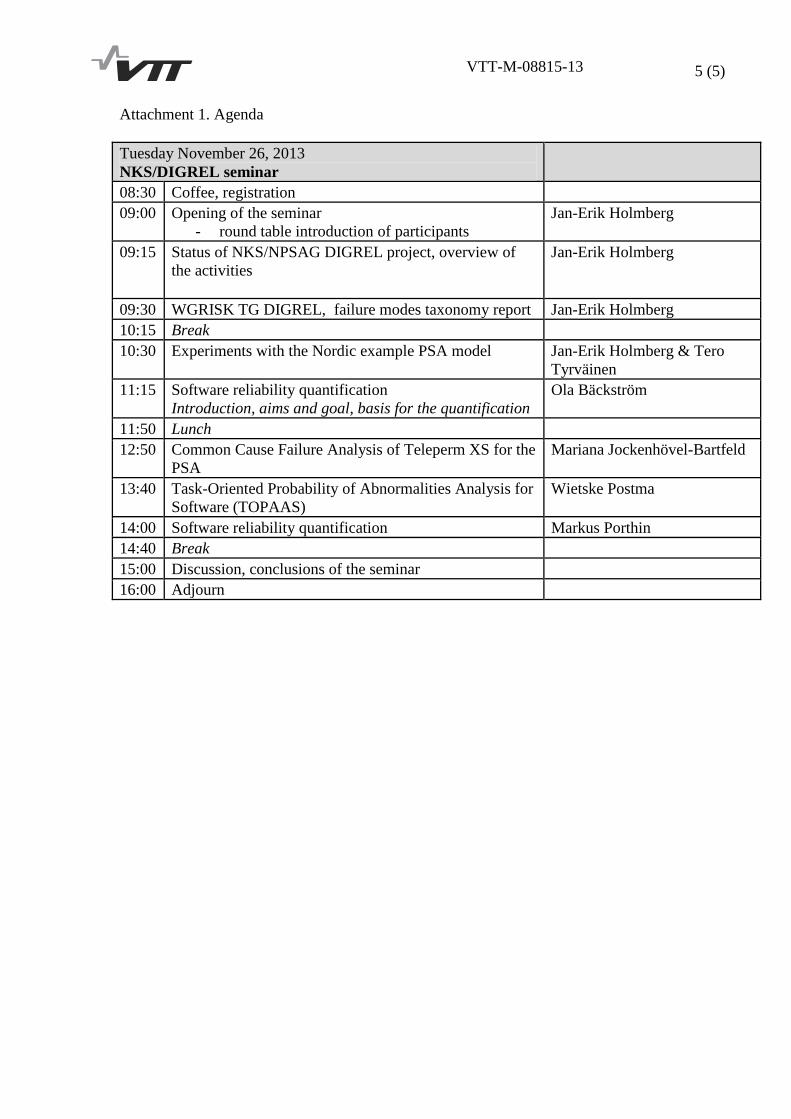
Attachment 1. Agenda
Tuesday November 26, 2013
NKS/DIGREL seminar
08:30 Coffee, registration
09:00 Opening of the seminar
- round table introduction of participants
Jan-Erik Holmberg
09:15
Status of NKS/NPSAG DIGREL project, overview of
the activities
Jan-Erik Holmberg
09:30 WGRISK TG DIGREL, failure modes taxonomy report Jan-Erik Holmberg
10:15 Break
10:30 Experiments with the Nordic example PSA model Jan-Erik Holmberg & Tero
Tyrväinen
11:15 Software reliability quantification
Introduction, aims and goal, basis for the quantification
Ola Bäckström
11:50 Lunch
12:50 Common Cause Failure Analysis of Teleperm XS for the
PSA
Mariana Jockenhövel-Bartfeld
13:40 Task-Oriented Probability of Abnormalities Analysis for
Software (TOPAAS)
Wietske Postma
14:00 Software reliability quantification Markus Porthin
14:40 Break
15:00 Discussion, conclusions of the seminar
16:00 Adjourn

1
Jan-Erik Holmberg
Digital I&C systems in probabilistic safety
assessment (PSA) — DIGREL project overview
DIGREL seminar, November 26, 2013, Espoo
ACKNOWLEDGMENTS
• The work has been financed by NKS (Nordic nuclear safety research), SAFIR2014 (The Finnish
Research Program on Nuclear Power Plant Safety 2011–2014) and the members of the Nordic
PSA Group: Forsmark, Oskarshamn Kraftgrupp, Ringhals AB and Swedish Radiation Safety
Authority
• Major part of the work is contributions from the OECD/NEA WGRISK/DIGREL task group
members
• NKS conveys its gratitude to all organizations and persons who by means of financial support or
contributions in kind have made the work presented in this report possible
• DIGREL project partners: Risk Pilot AB, Lloyd's Register Consulting - Energy AB, VTT (Technical
Research Centre of Finland)
2
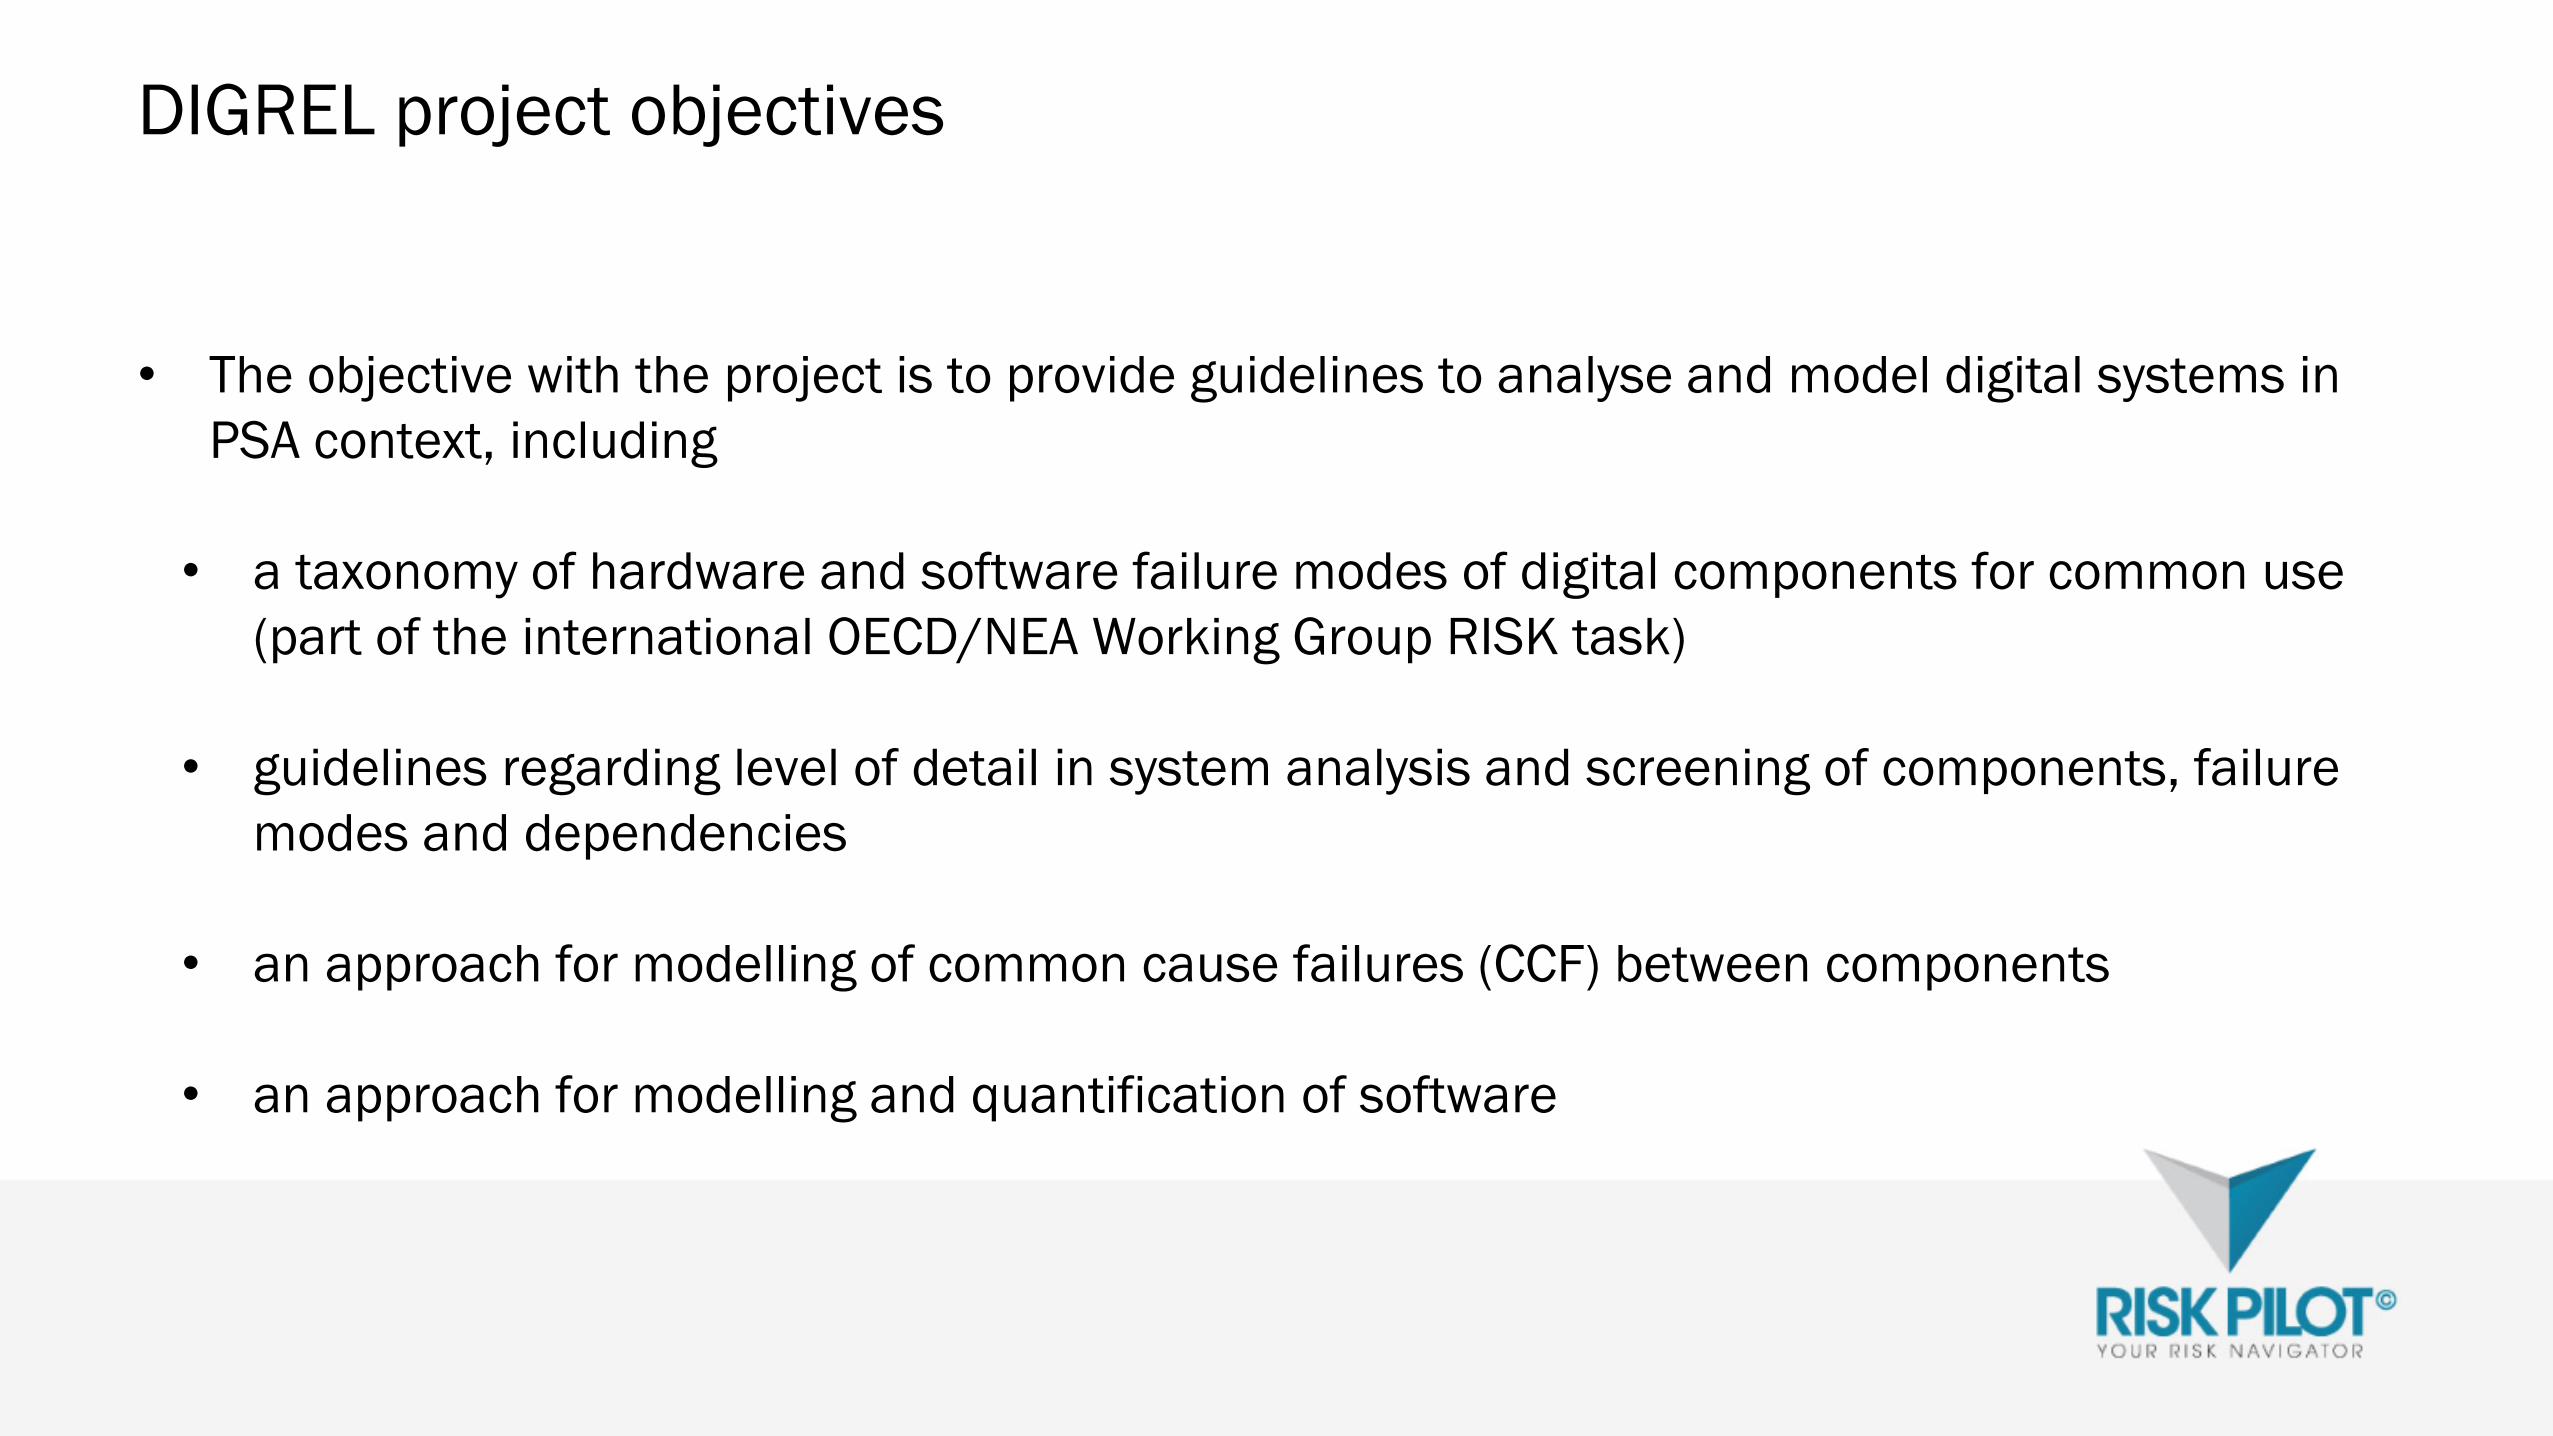
DIGREL project objectives
• The objective with the project is to provide guidelines to analyse and model digital systems in
PSA context, including
• a taxonomy of hardware and software failure modes of digital components for common use
(part of the international OECD/NEA Working Group RISK task)
• guidelines regarding level of detail in system analysis and screening of components, failure
modes and dependencies
• an approach for modelling of common cause failures (CCF) between components
• an approach for modelling and quantification of software

DIGREL task background
• In 2007, the OECD/NEA CSNI directed the Working Group on Risk Assessment (WGRisk) to set
up a task group to coordinate an activity in this field
• One of the recommendations was to develop a taxonomy of failure modes of digital components
for the purposes of probabilistic safety assessment (PSA)
• Task report NEA/CSNI/R(2009)18, OECD/NEA/CSNI, Paris, 2009 http://www.oecd-
nea.org/nsd/docs/2009/csni-r2009-18.pdf
• A new task (abbreviated DIGREL) was started 2010

Nordic project background
• Variety of experience of analysing digital I&C in PSA context
• Most plants do not yet have digital RPS, but will have in future
• Turbine plant I&C and diverse other safety-related systems are already digital, but have minor
role in PSA context
• New-builts (in Finland) will have complete digital I&C
• No common approach (yet)
• However, there is a tradition to try find harmonised approaches for PSA and its applications
• Generally strong interest to find solutions and guidelines how assess safety and reliability of
digital I&C and how to meet regulatory requirements

DIGREL activities
WGRISK
activties
Activity on Digital
Instrumentation and Control
Risk
Report NEA/CSNI/
R(2009)18
2007 2008 2009 2010 2011 2012 2013 2014
Nordic
activities
Pre-study
survey,
needs
NKS-230
Example
PSA, 1st
version
NKS-261
DIGREL Task: Failure modes taxonomy
Example
PSA, 2nd
version
Data
survey
NKS-277
Modelling
guidance
SW
reliability
Survey Requirements
Taxonomy
hierarchy Draft reports
Internal
processing
External
review
Final
report
Dissemination

NKS/DIGREL reports
• can be loaded from www.nks.org
• NKS-230 (2010)
• NKS-261 (2011)
• NKS-277 (2012)
• also the proceedings of the previous years’ seminar can be found in www.nks.org
7

1
Jan-Erik Holmberg
OECD/NEA WGRISK Task DIGREL —
failure modes taxonomy for digital I&C systems
DIGREL seminar, November 26, 2013, Espoo
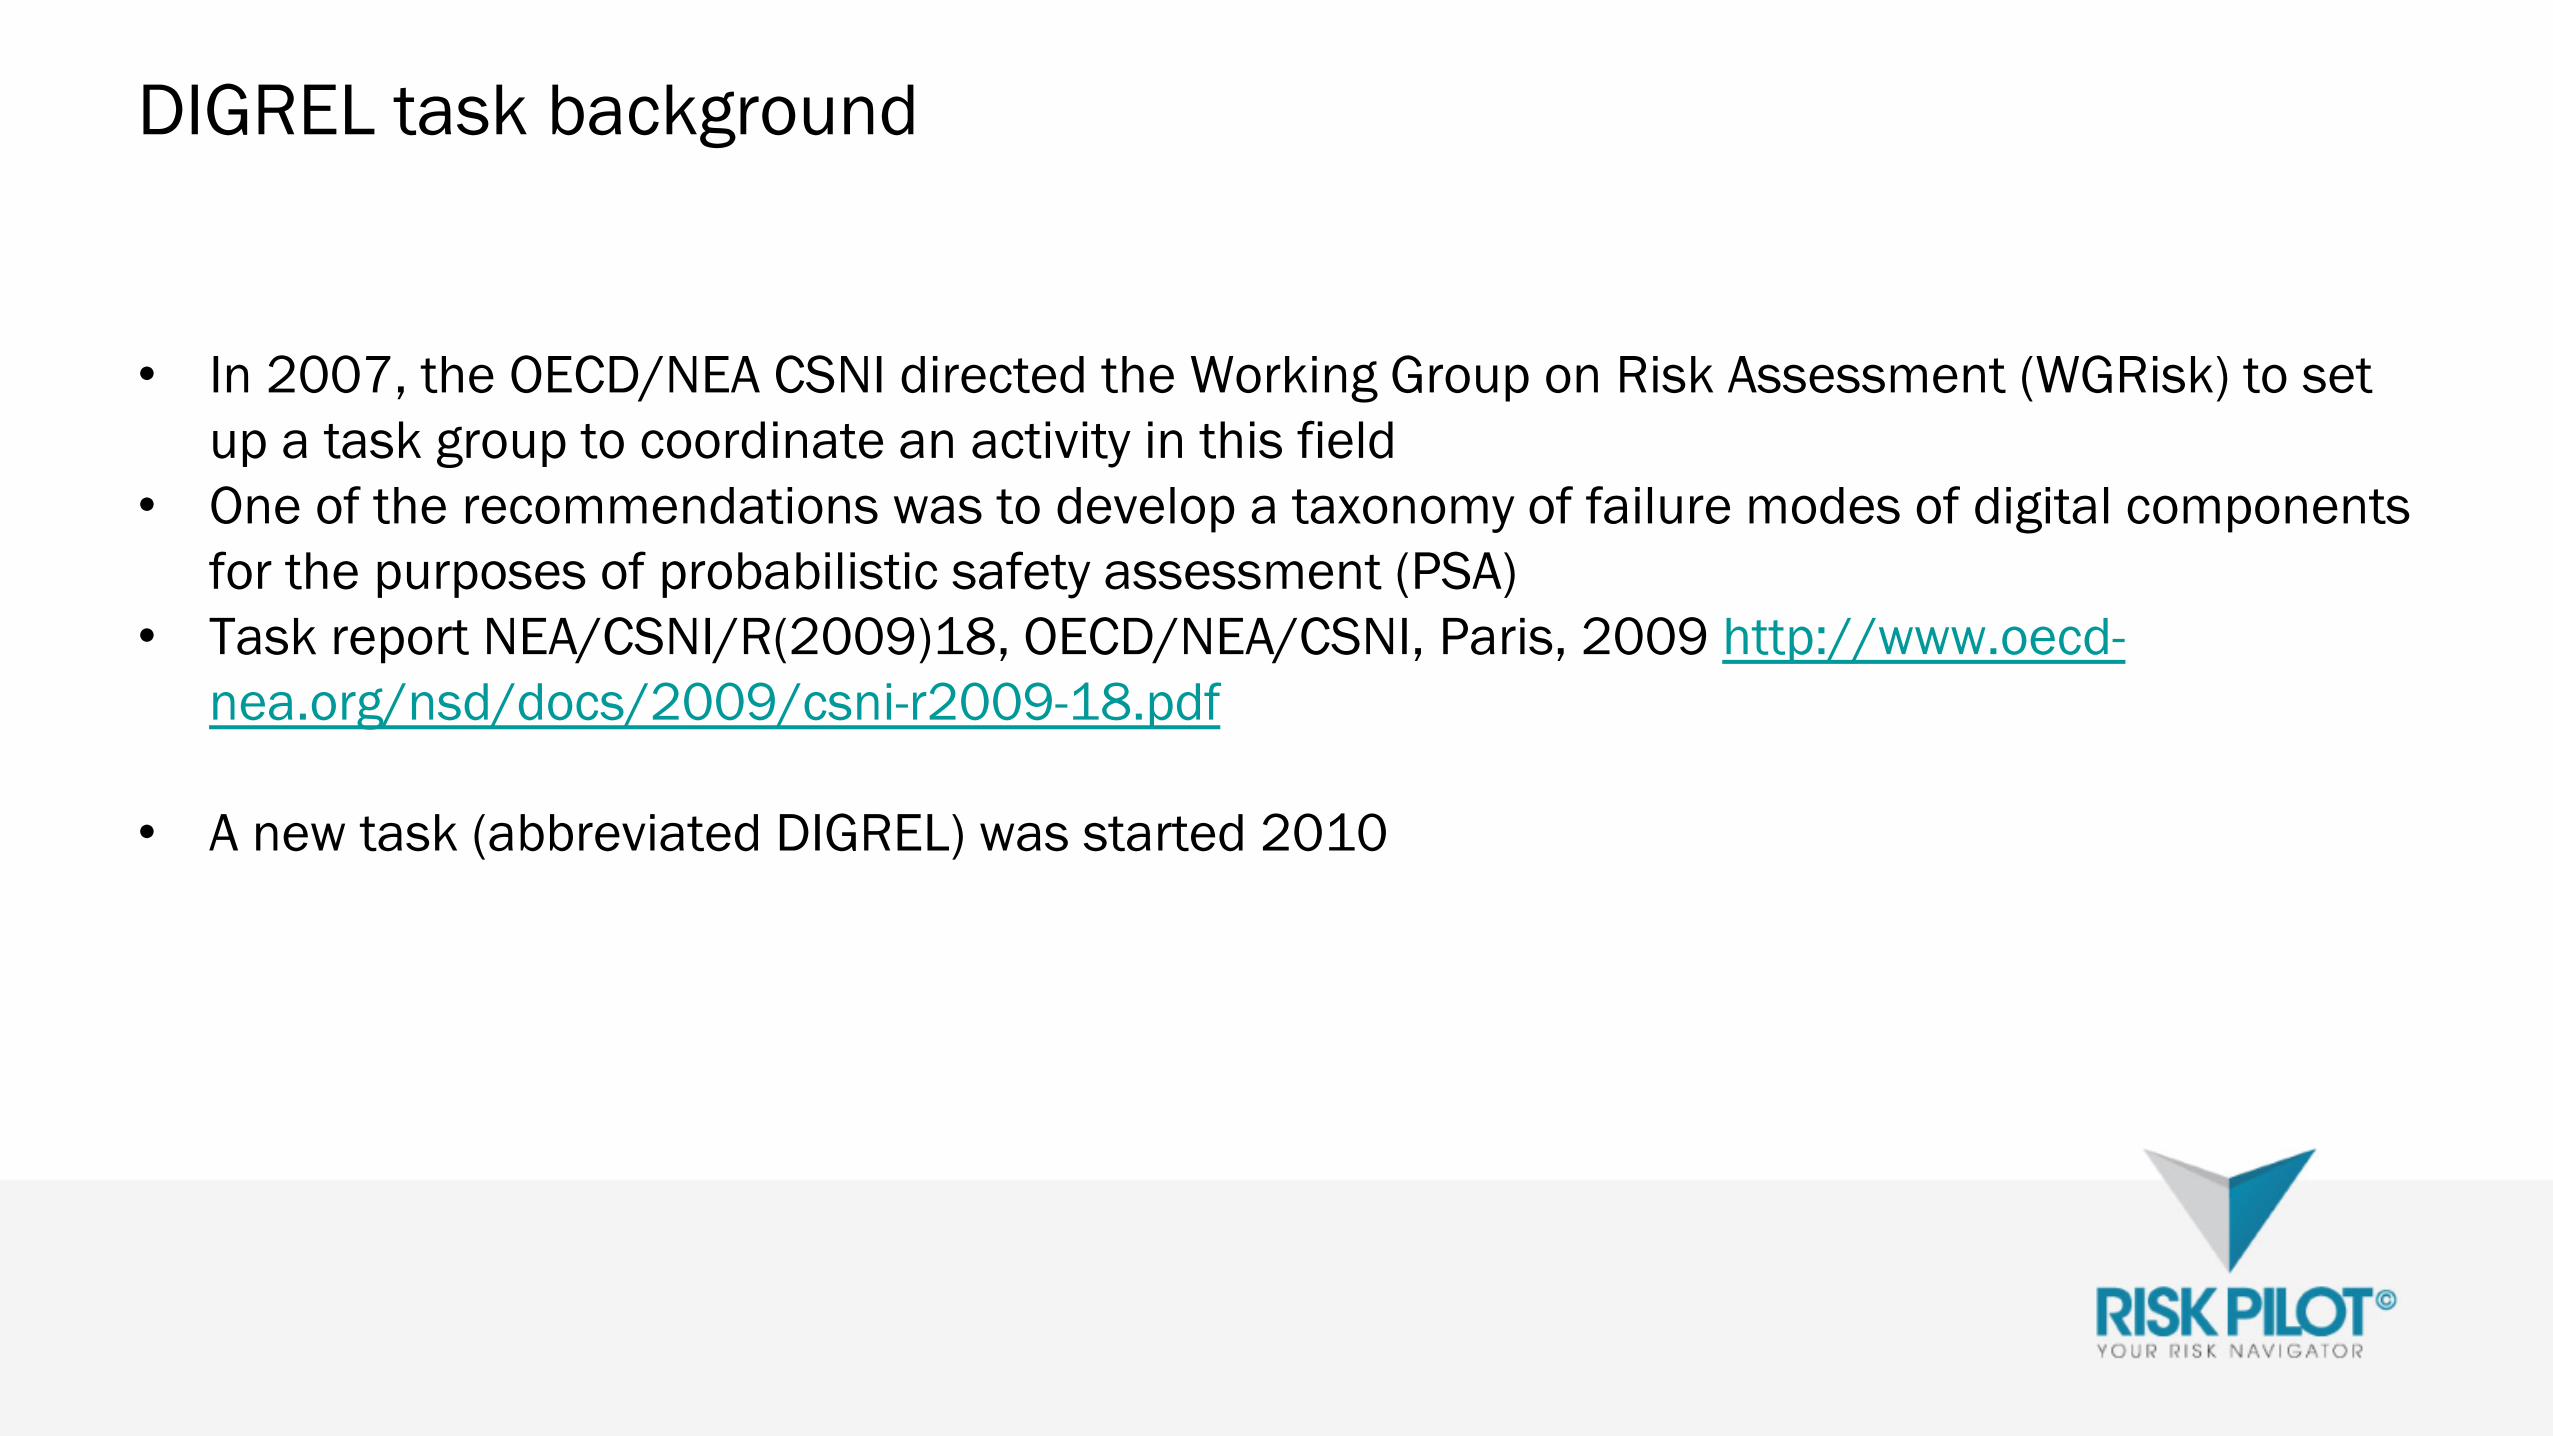
DIGREL task background
• In 2007, the OECD/NEA CSNI directed the Working Group on Risk Assessment (WGRisk) to set
up a task group to coordinate an activity in this field
• One of the recommendations was to develop a taxonomy of failure modes of digital components
for the purposes of probabilistic safety assessment (PSA)
• Task report NEA/CSNI/R(2009)18, OECD/NEA/CSNI, Paris, 2009 http://www.oecd-
nea.org/nsd/docs/2009/csni-r2009-18.pdf
• A new task (abbreviated DIGREL) was started 2010
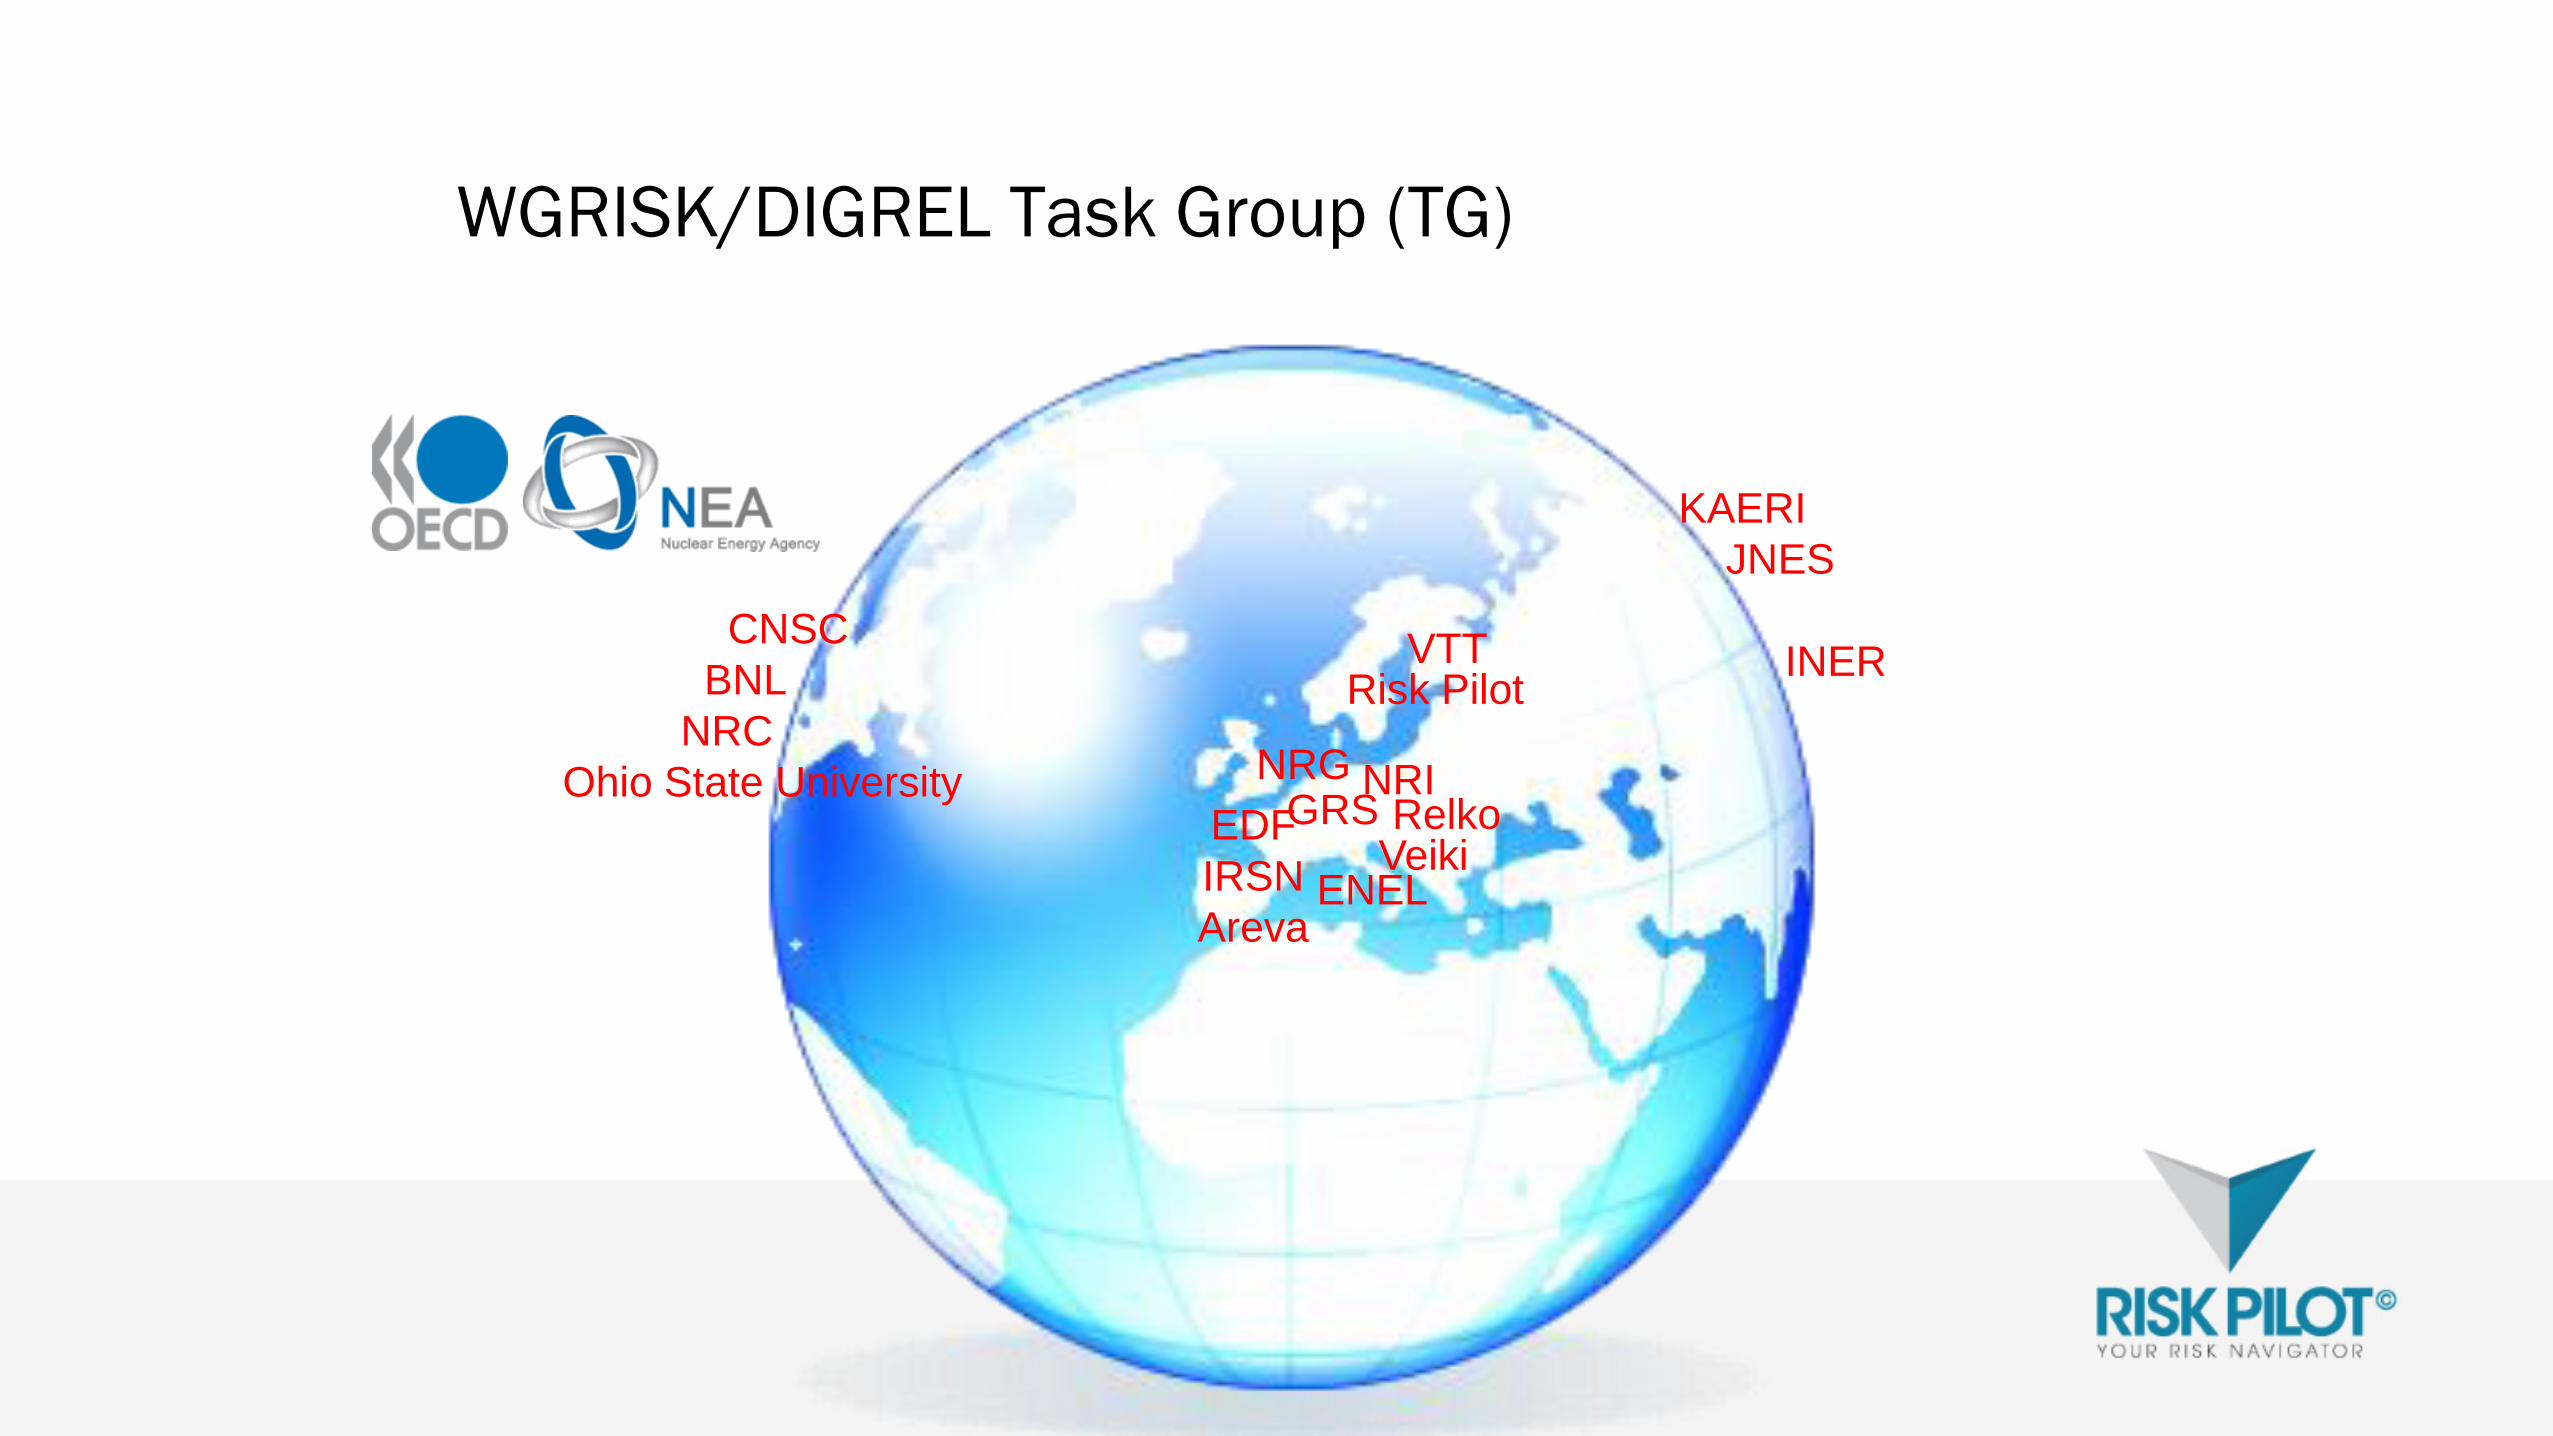
WGRISK/DIGREL Task Group (TG)
VTTRisk Pilot
GRSNRG NRI
RelkoEDF
IRSN
Areva
VeikiENEL
CNSC
BNL
NRC
Ohio State University
KAERI
JNES
INER
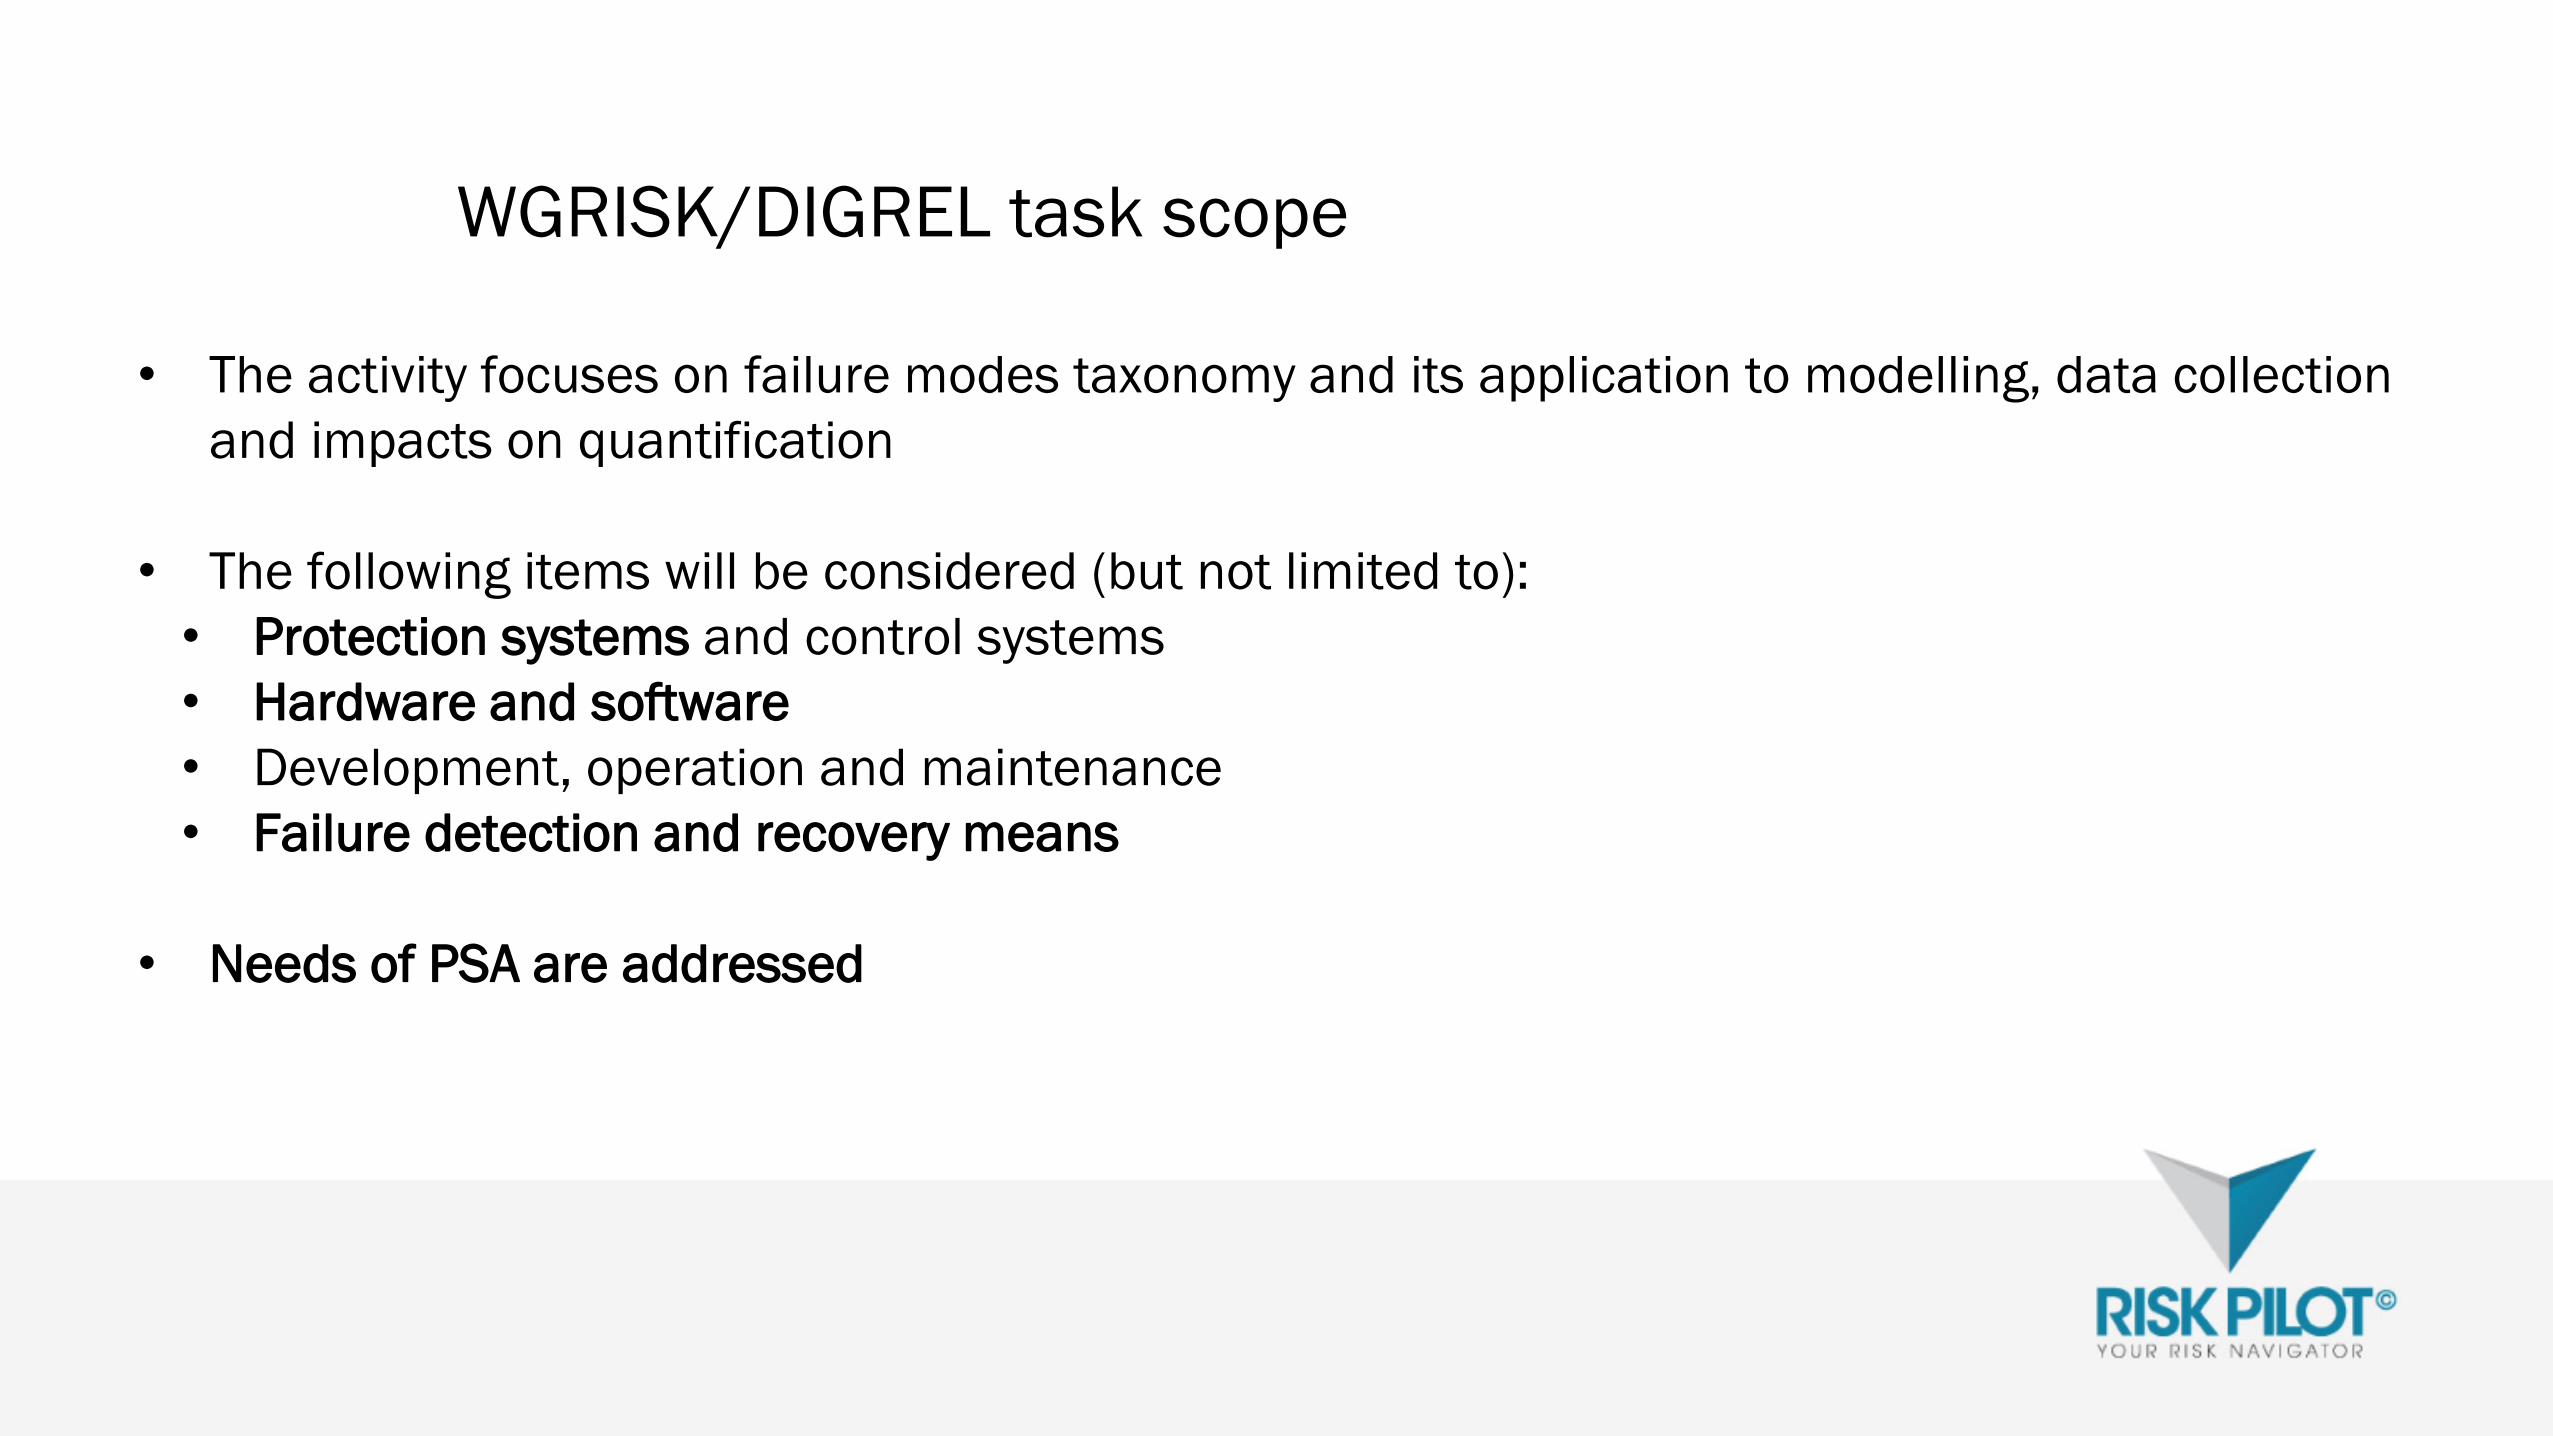
WGRISK/DIGREL task scope
• The activity focuses on failure modes taxonomy and its application to modelling, data collection
and impacts on quantification
• The following items will be considered (but not limited to):
• Protection systems and control systems
• Hardware and software
• Development, operation and maintenance
• Failure detection and recovery means
• Needs of PSA are addressed
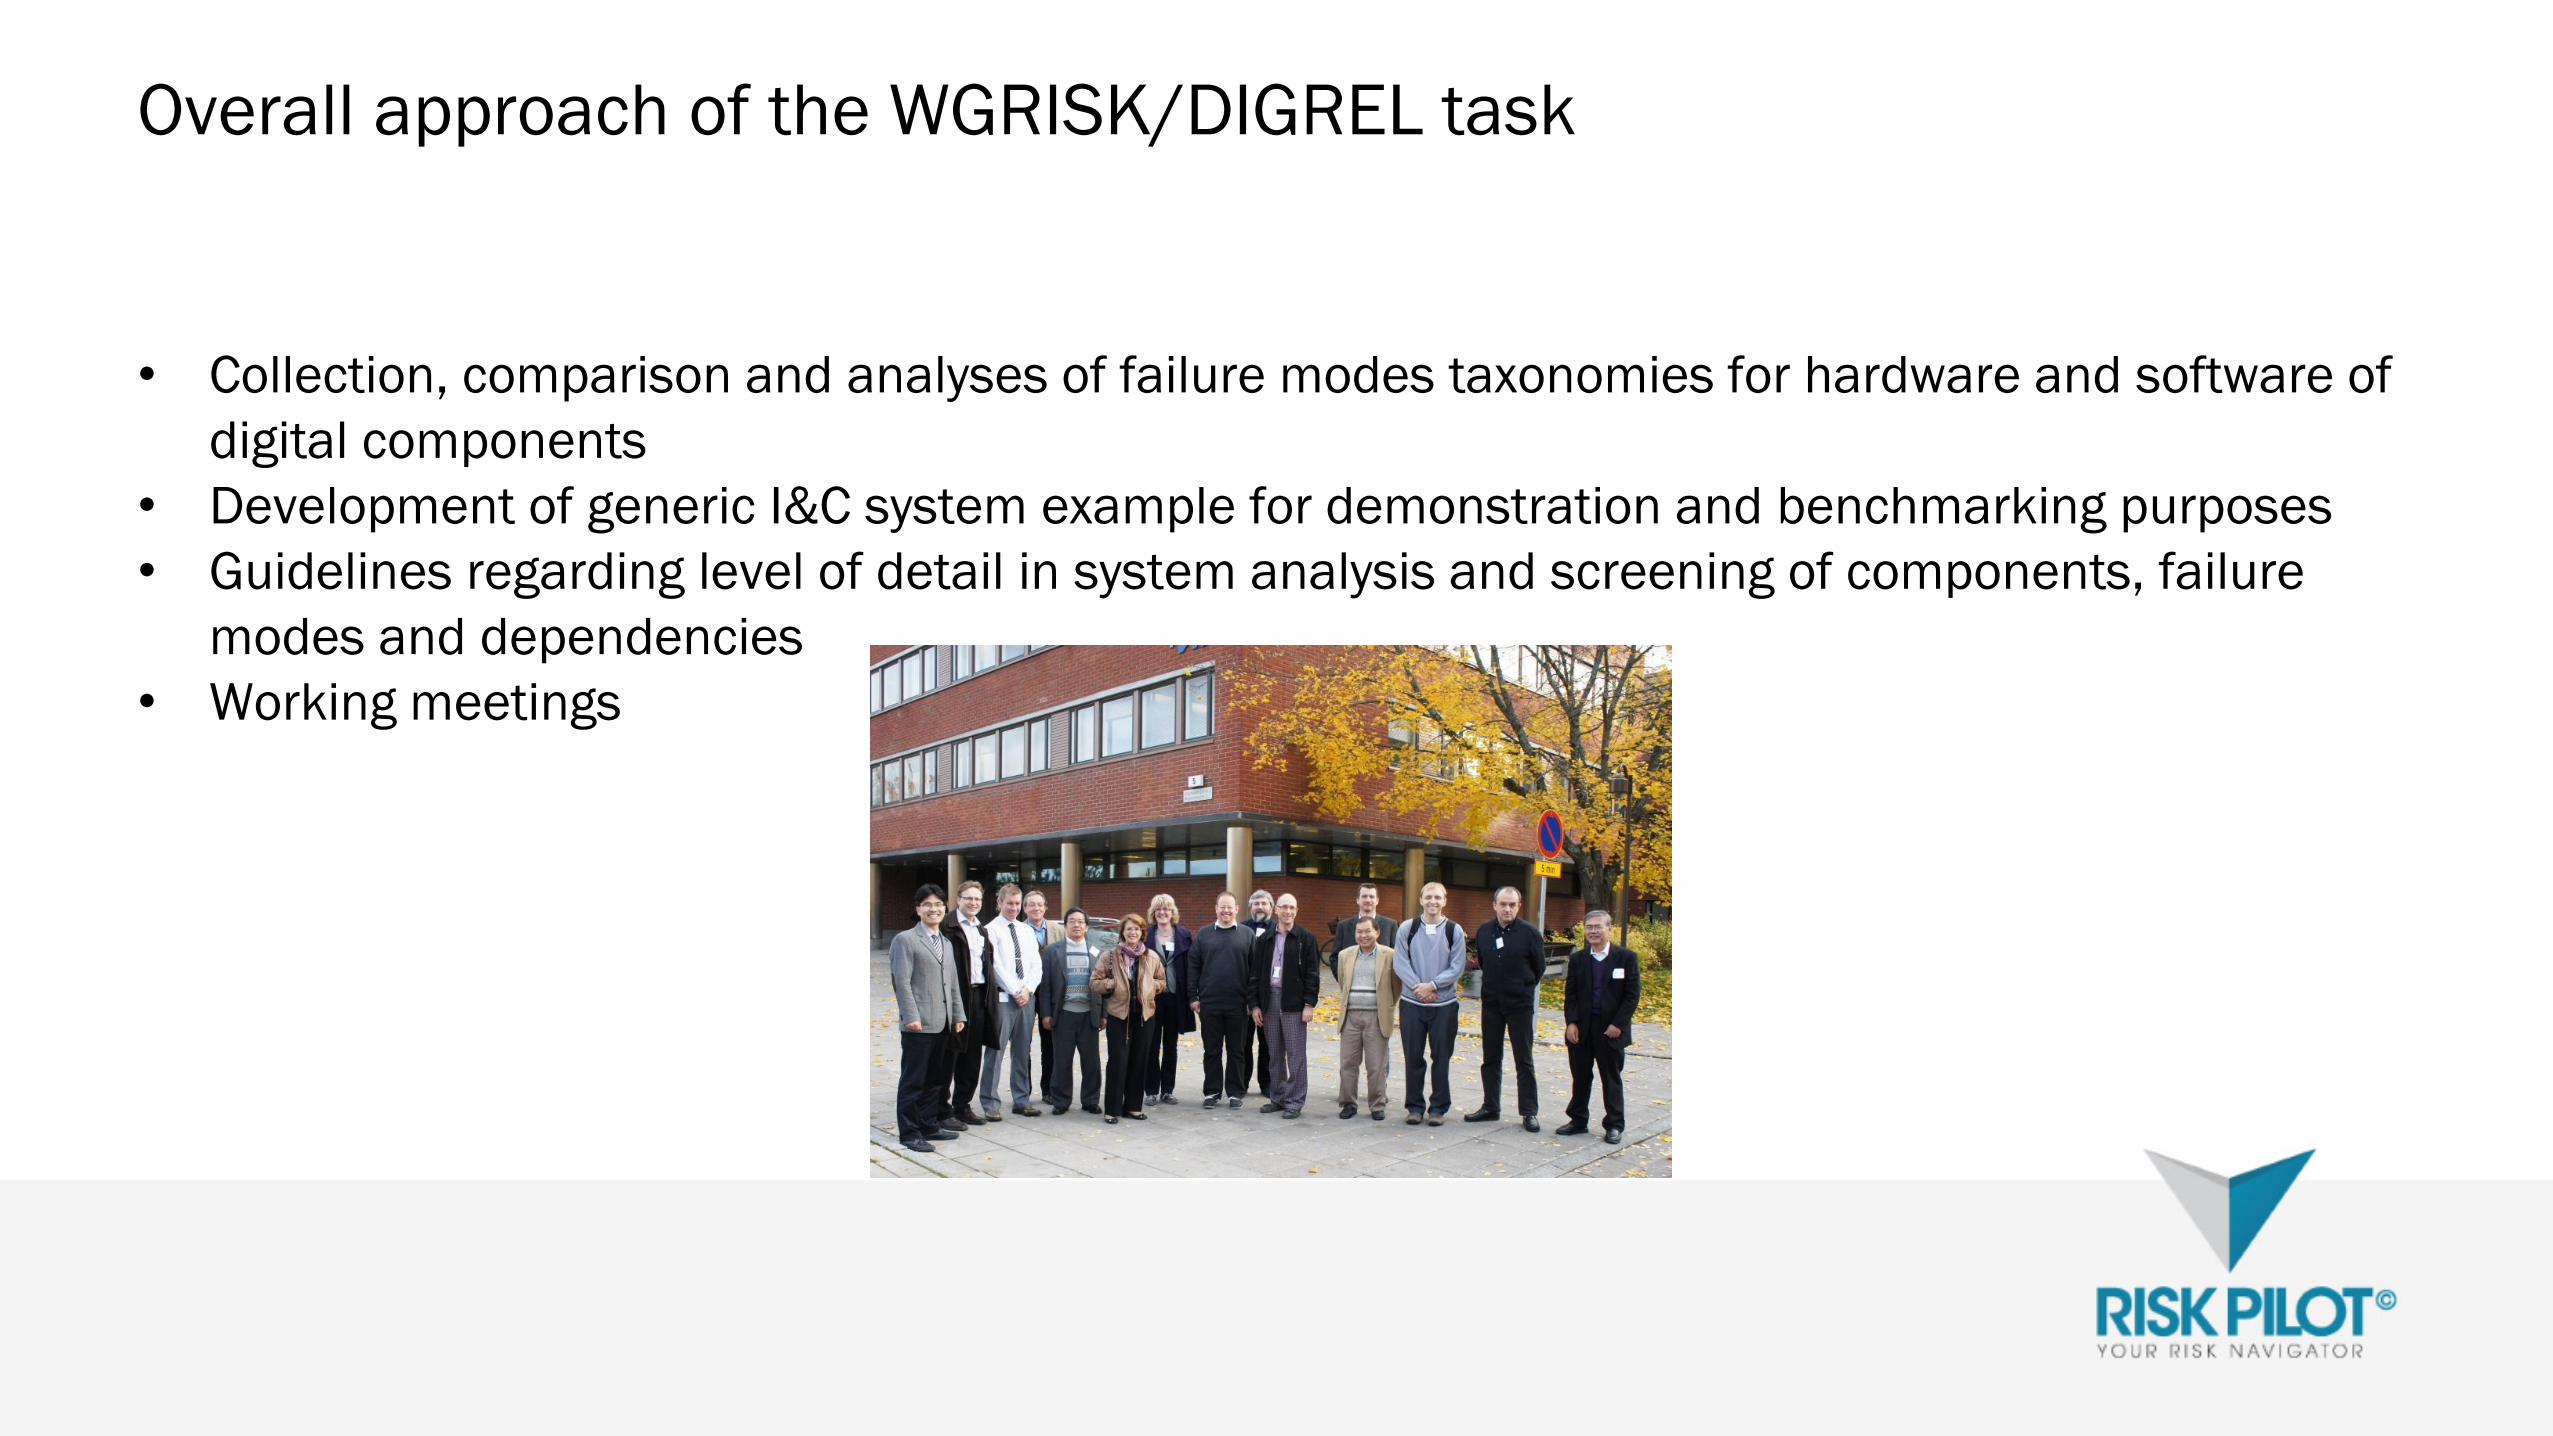
Overall approach of the WGRISK/DIGREL task
• Collection, comparison and analyses of failure modes taxonomies for hardware and software of
digital components
• Development of generic I&C system example for demonstration and benchmarking purposes
• Guidelines regarding level of detail in system analysis and screening of components, failure
modes and dependencies
• Working meetings
Status November 2013
• Draft report prepared
• ~130 pages => almost complete
• Some issues to be clarified and agreed upon
• The failure modes taxonomy presented here reflect proposals made in the recent TG meeting
September 25-27, 2013, i.e., not necessarily agreed by the task group
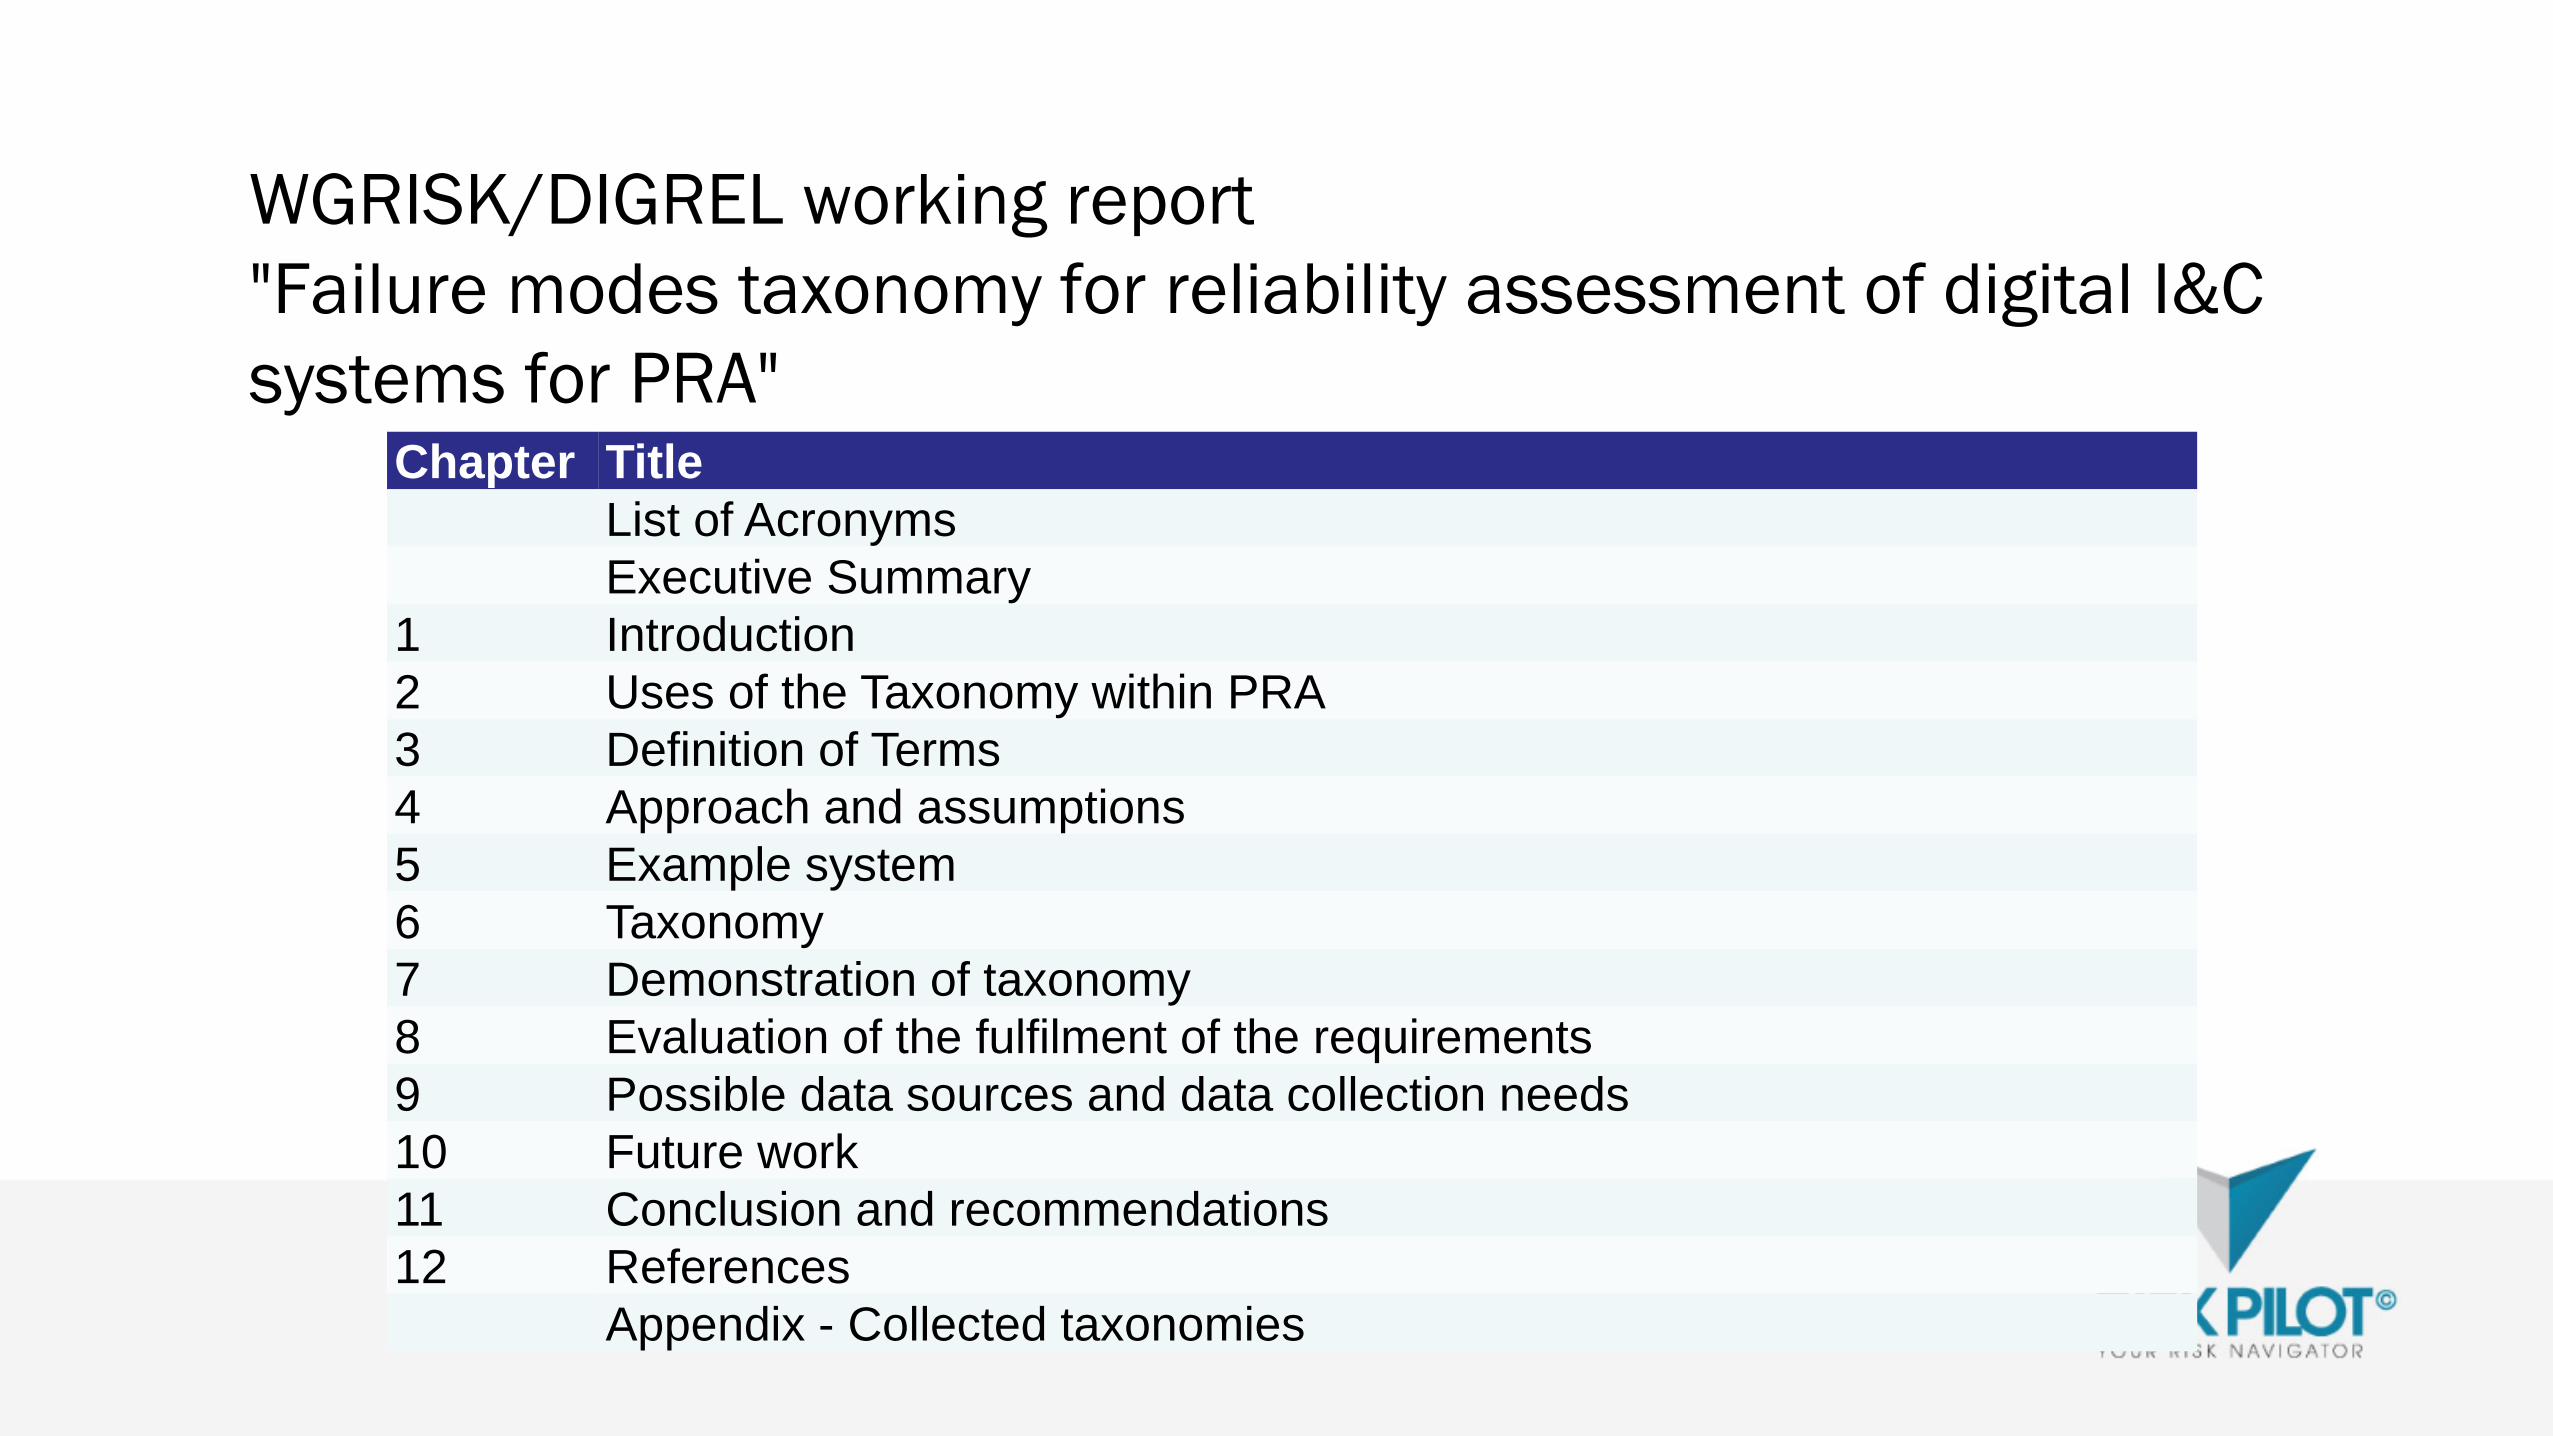
WGRISK/DIGREL working report
"Failure modes taxonomy for reliability assessment of digital I&C
systems for PRA"Chapter Title
List of Acronyms
Executive Summary
1 Introduction
2 Uses of the Taxonomy within PRA
3 Definition of Terms
4 Approach and assumptions
5 Example system
6 Taxonomy
7 Demonstration of taxonomy
8 Evaluation of the fulfilment of the requirements
9 Possible data sources and data collection needs
10 Future work
11 Conclusion and recommendations
12 References
Appendix - Collected taxonomies

Dissemination
• WGRISK working report (2014)
• Conference papers (several papers per conference)
• PSAM11/ESREL2012
• NPIC & HMIT 2012
• PSA-2013
• PSAM-2014
• NKS-261, NKS-230, NKS-261, NKS-277, NKS-2013, NKS-2014 (www.nks.org)
• Journal articles
• Nuclear Engineering and Technology, Vol. 44, No. 5, June 2012. 471–482.

General principles of the taxonomy
• It is not possible to propose an exhaustive failure taxonomy, without any assumption regarding
its scope and a particular I&C system, including its architecture, hardware and software
• Focus on functional aspects in contrast with structural aspects
• permits to handle some variability of failure modes and mechanisms
• reduces the difficulties associated to considering the complex structural aspects of software
• The failure modes taxonomy basically results from:
• a digital I&C architecture
• a failure model

Levels and approaches of the taxonomy

Example reactor protection system architecture and
modules of I&C units
11
DPSRPS
Division 1
APU
A1
...
VU
B1
APU
B1
...
Division 2 Division 3 Division 4
... ... ...
VU
A1
Actuator ...
110 V
DC
Analog in Digital in
Signal conditioning
module, SCM
Analog input module,
AIM
Analog output module,
AOM
Digital output module,
DOM
Communi-
cation link
module,
COM
Bus
linkProcessor module, CPU
Subrack,
incl. power
supply
Digital input module,
DIM
Software modules in hardware modules,
e.g.:
- operating system
- application function modules
- library functions
- proprietary software modules
- data communication protocol
- data tables
- functional requirements specification
(virtual software)
Failure model

Failure modes at the system and division level
Required output
Actual outputActuation No actuation
Actuation Success Failure (Spurious actuation)
Late actuation, Partial
actuationFailure (Failure-on-demand) Failure (Spurious actuation)
No actuation Failure (Failure-on-demand) Success
Rationale for the taxonomy at the
I&C unit, module and basic component level
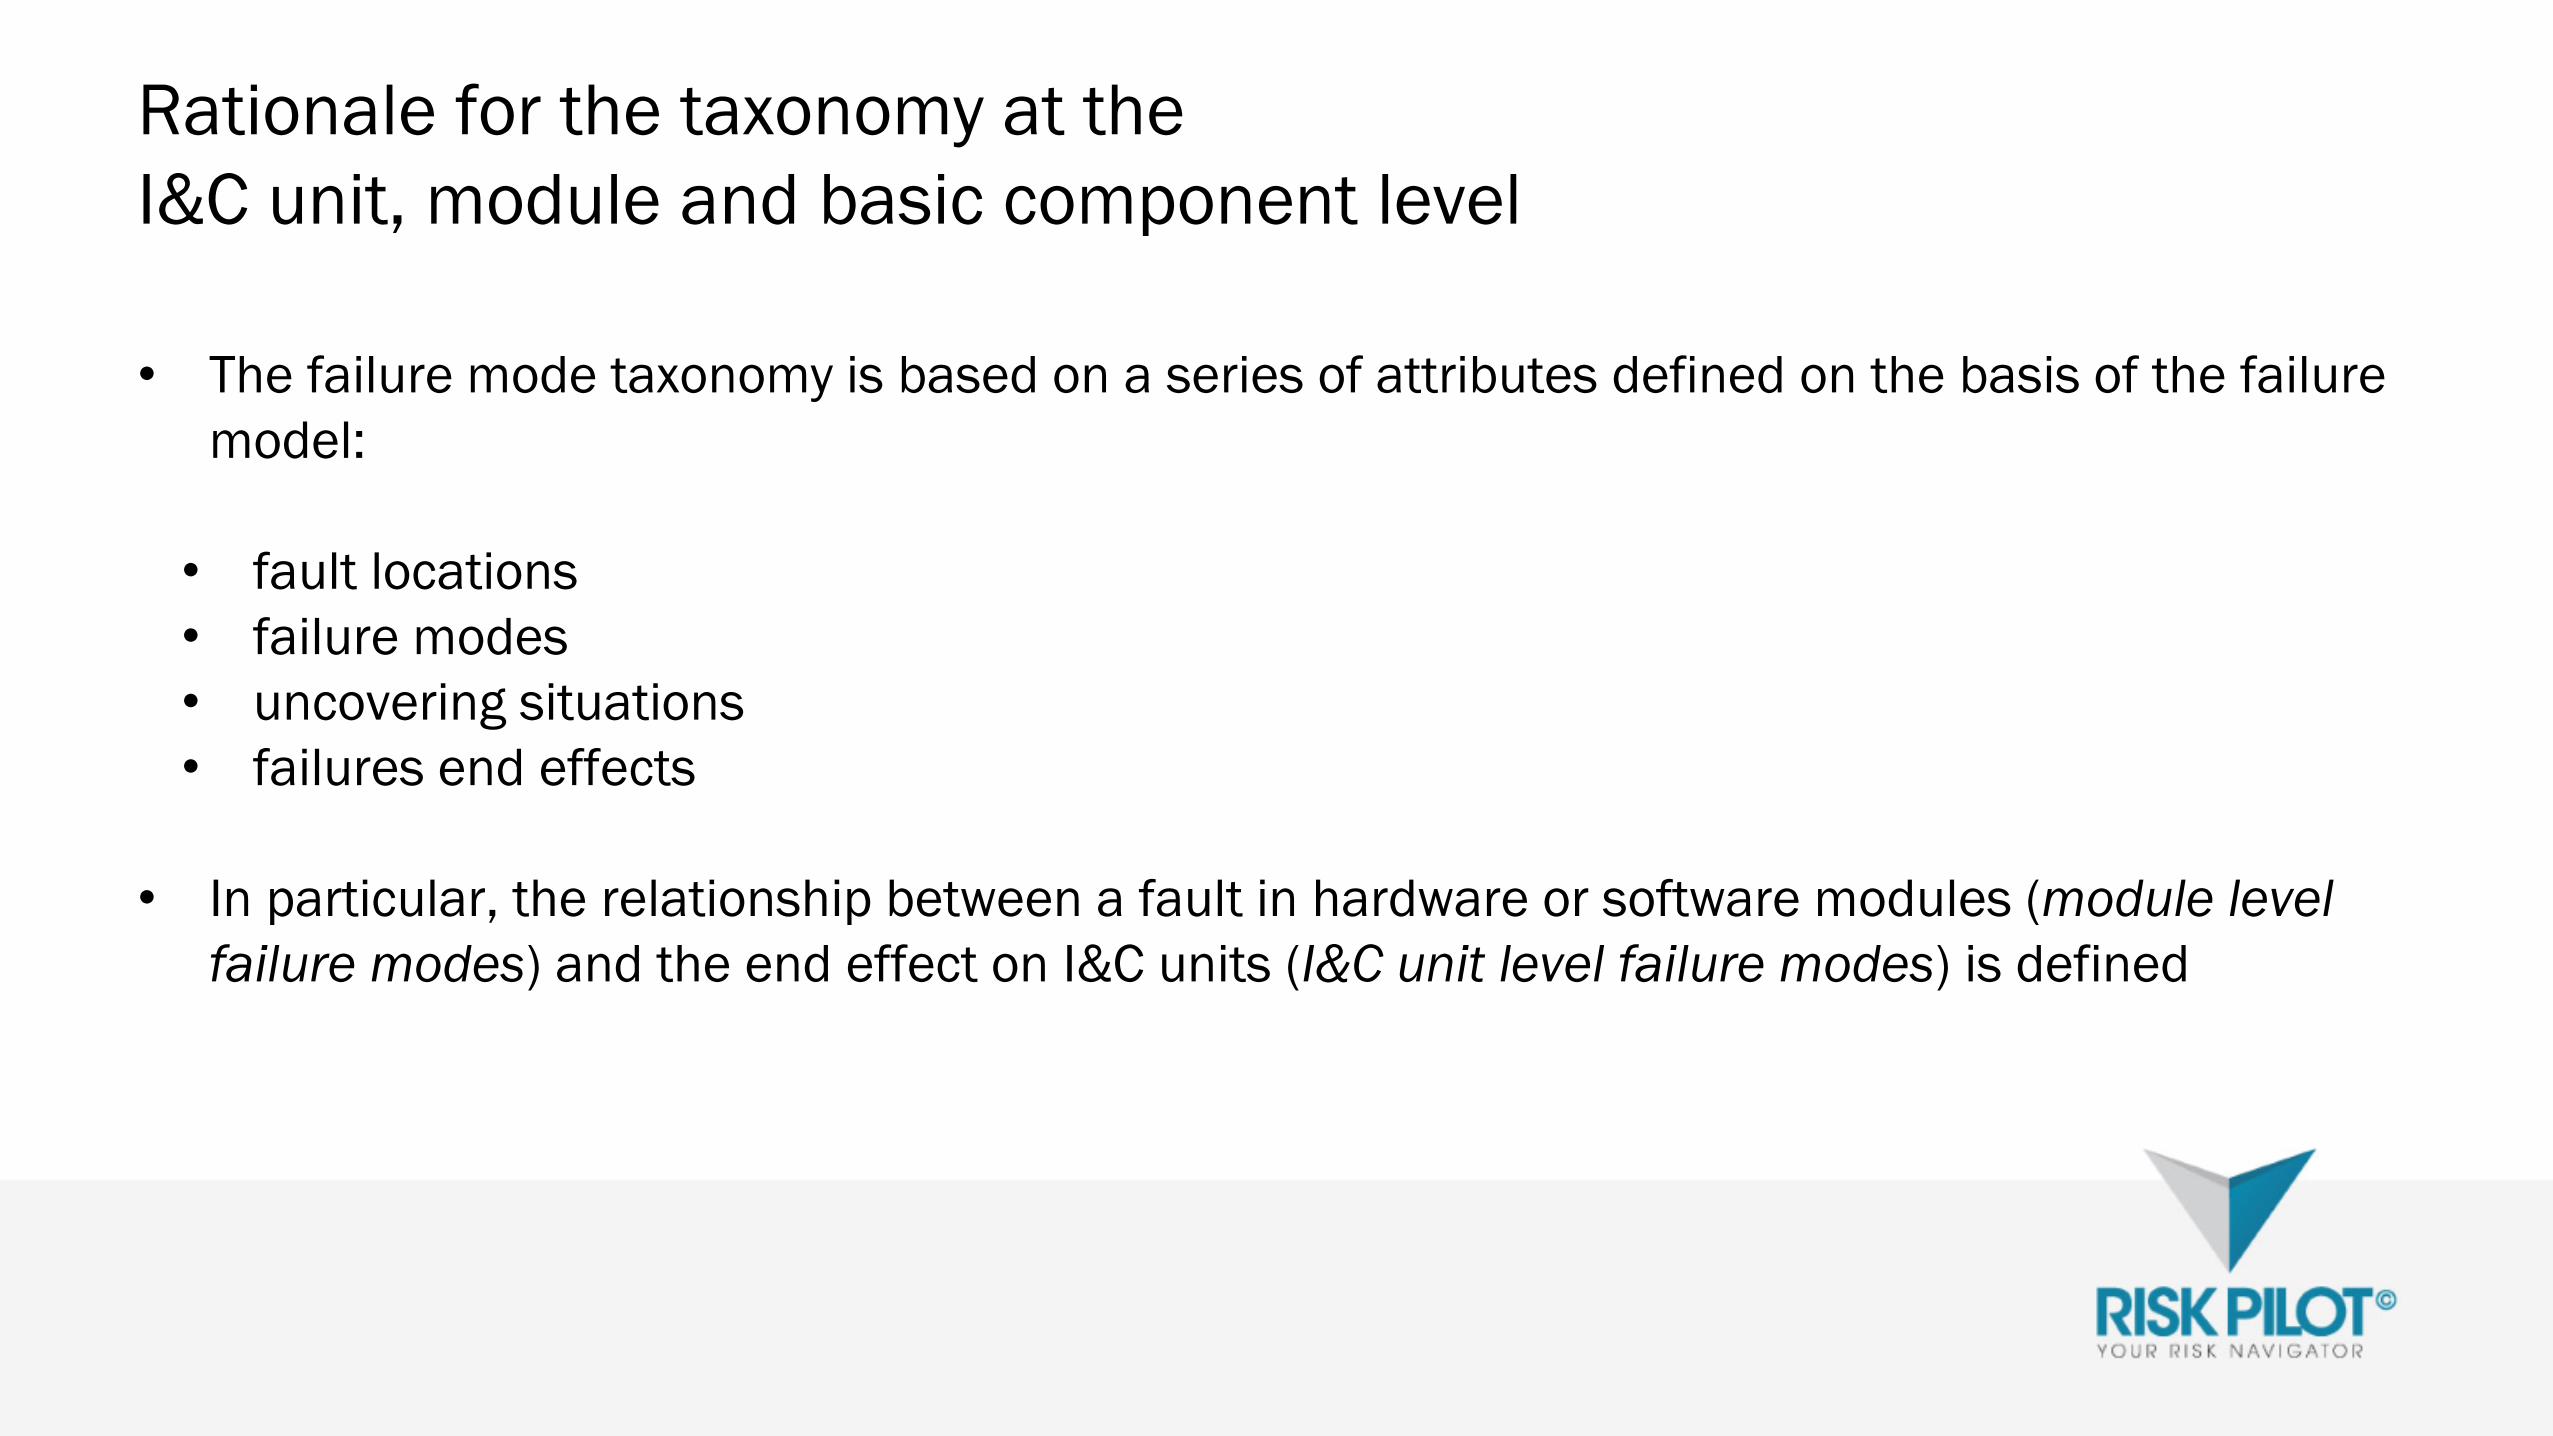
• The failure mode taxonomy is based on a series of attributes defined on the basis of the failure
model:
• fault locations
• failure modes
• uncovering situations
• failures end effects
• In particular, the relationship between a fault in hardware or software modules (module level
failure modes) and the end effect on I&C units (I&C unit level failure modes) is defined
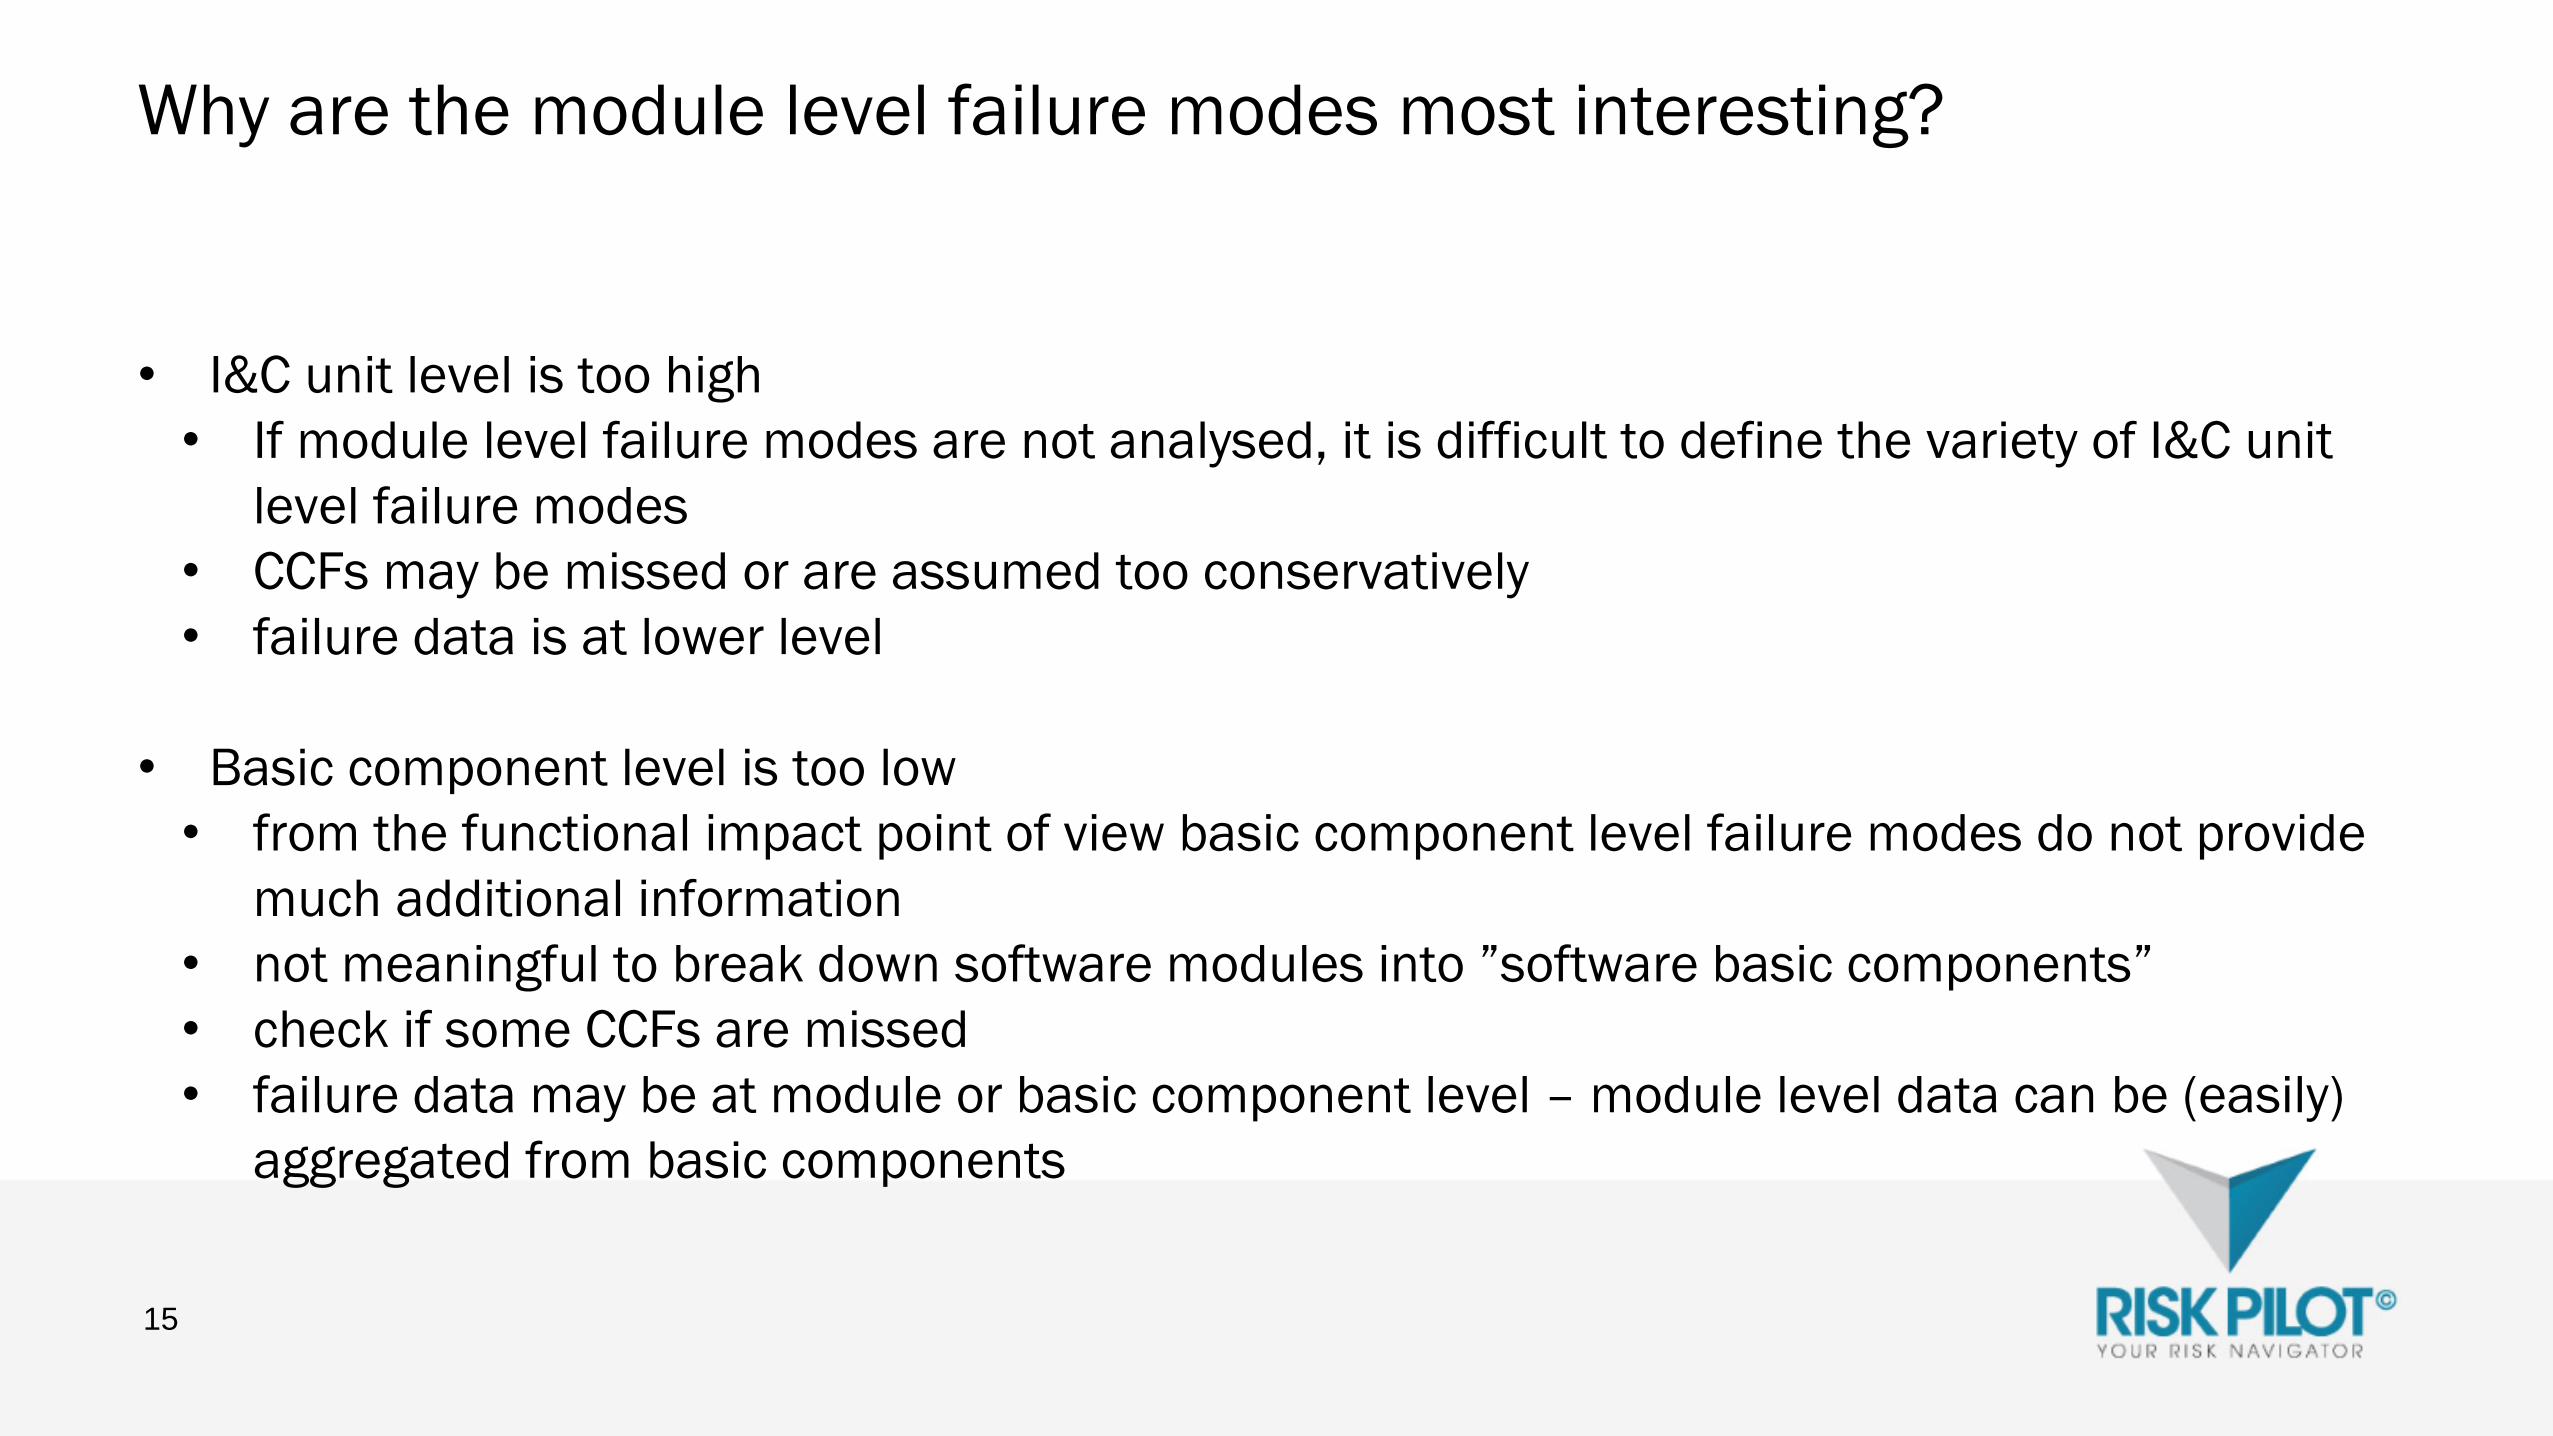
Why are the module level failure modes most interesting?
• I&C unit level is too high
• If module level failure modes are not analysed, it is difficult to define the variety of I&C unit
level failure modes
• CCFs may be missed or are assumed too conservatively
• failure data is at lower level
• Basic component level is too low
• from the functional impact point of view basic component level failure modes do not provide
much additional information
• not meaningful to break down software modules into ”software basic components”
• check if some CCFs are missed
• failure data may be at module or basic component level – module level data can be (easily)
aggregated from basic components
15

Fault location - Hardware
16
I&C Modules (Fault Locations) - Hardware aspect Relevant I&C unit category
APU input module hardware (digital or analog)
APU processing module hardware
APU subrack hardware
APU output modules hardware (digital or analog)
Acquisition & processing unit
(APU)
VU output module hardware
VU processing module hardware
VU subrack hardware
Voting unit (VU)
Link module hardware
DCU processing module hardware
DCU subrack hardware
Network wires
Network optical cables
APU/DCU interface
Data communication unit (DCU)

Fault location - Software
17
I&C Modules (Fault Locations) - Software aspect Relevant I&C unit category
Operating system (OS)
Elementary functions (EF)
Application specific software (APU-AS)
Functional requirements specification (APU-FRS)
Acquisition & processing unit
(APU)
Operating system (OS)
Elementary functions (EF)
Application specific software (VU-AS)
Functional requirements specification (VU-FRS)
Voting unit (VU)
Operating system (OS)
Data communication software (DCS)
Application specific software (Data Link Configuration) (DLC)
Functional requirements specification (DCU-FRS)
Data communication unit (DCU)
Proprietary SW Modules = specific pieces of software present in hardware
modules in APU, DCU, VU or any other module of the system (power
supply...)
Potentially any kind of I&C unit
Case by case assessment to be
done
Failure modes
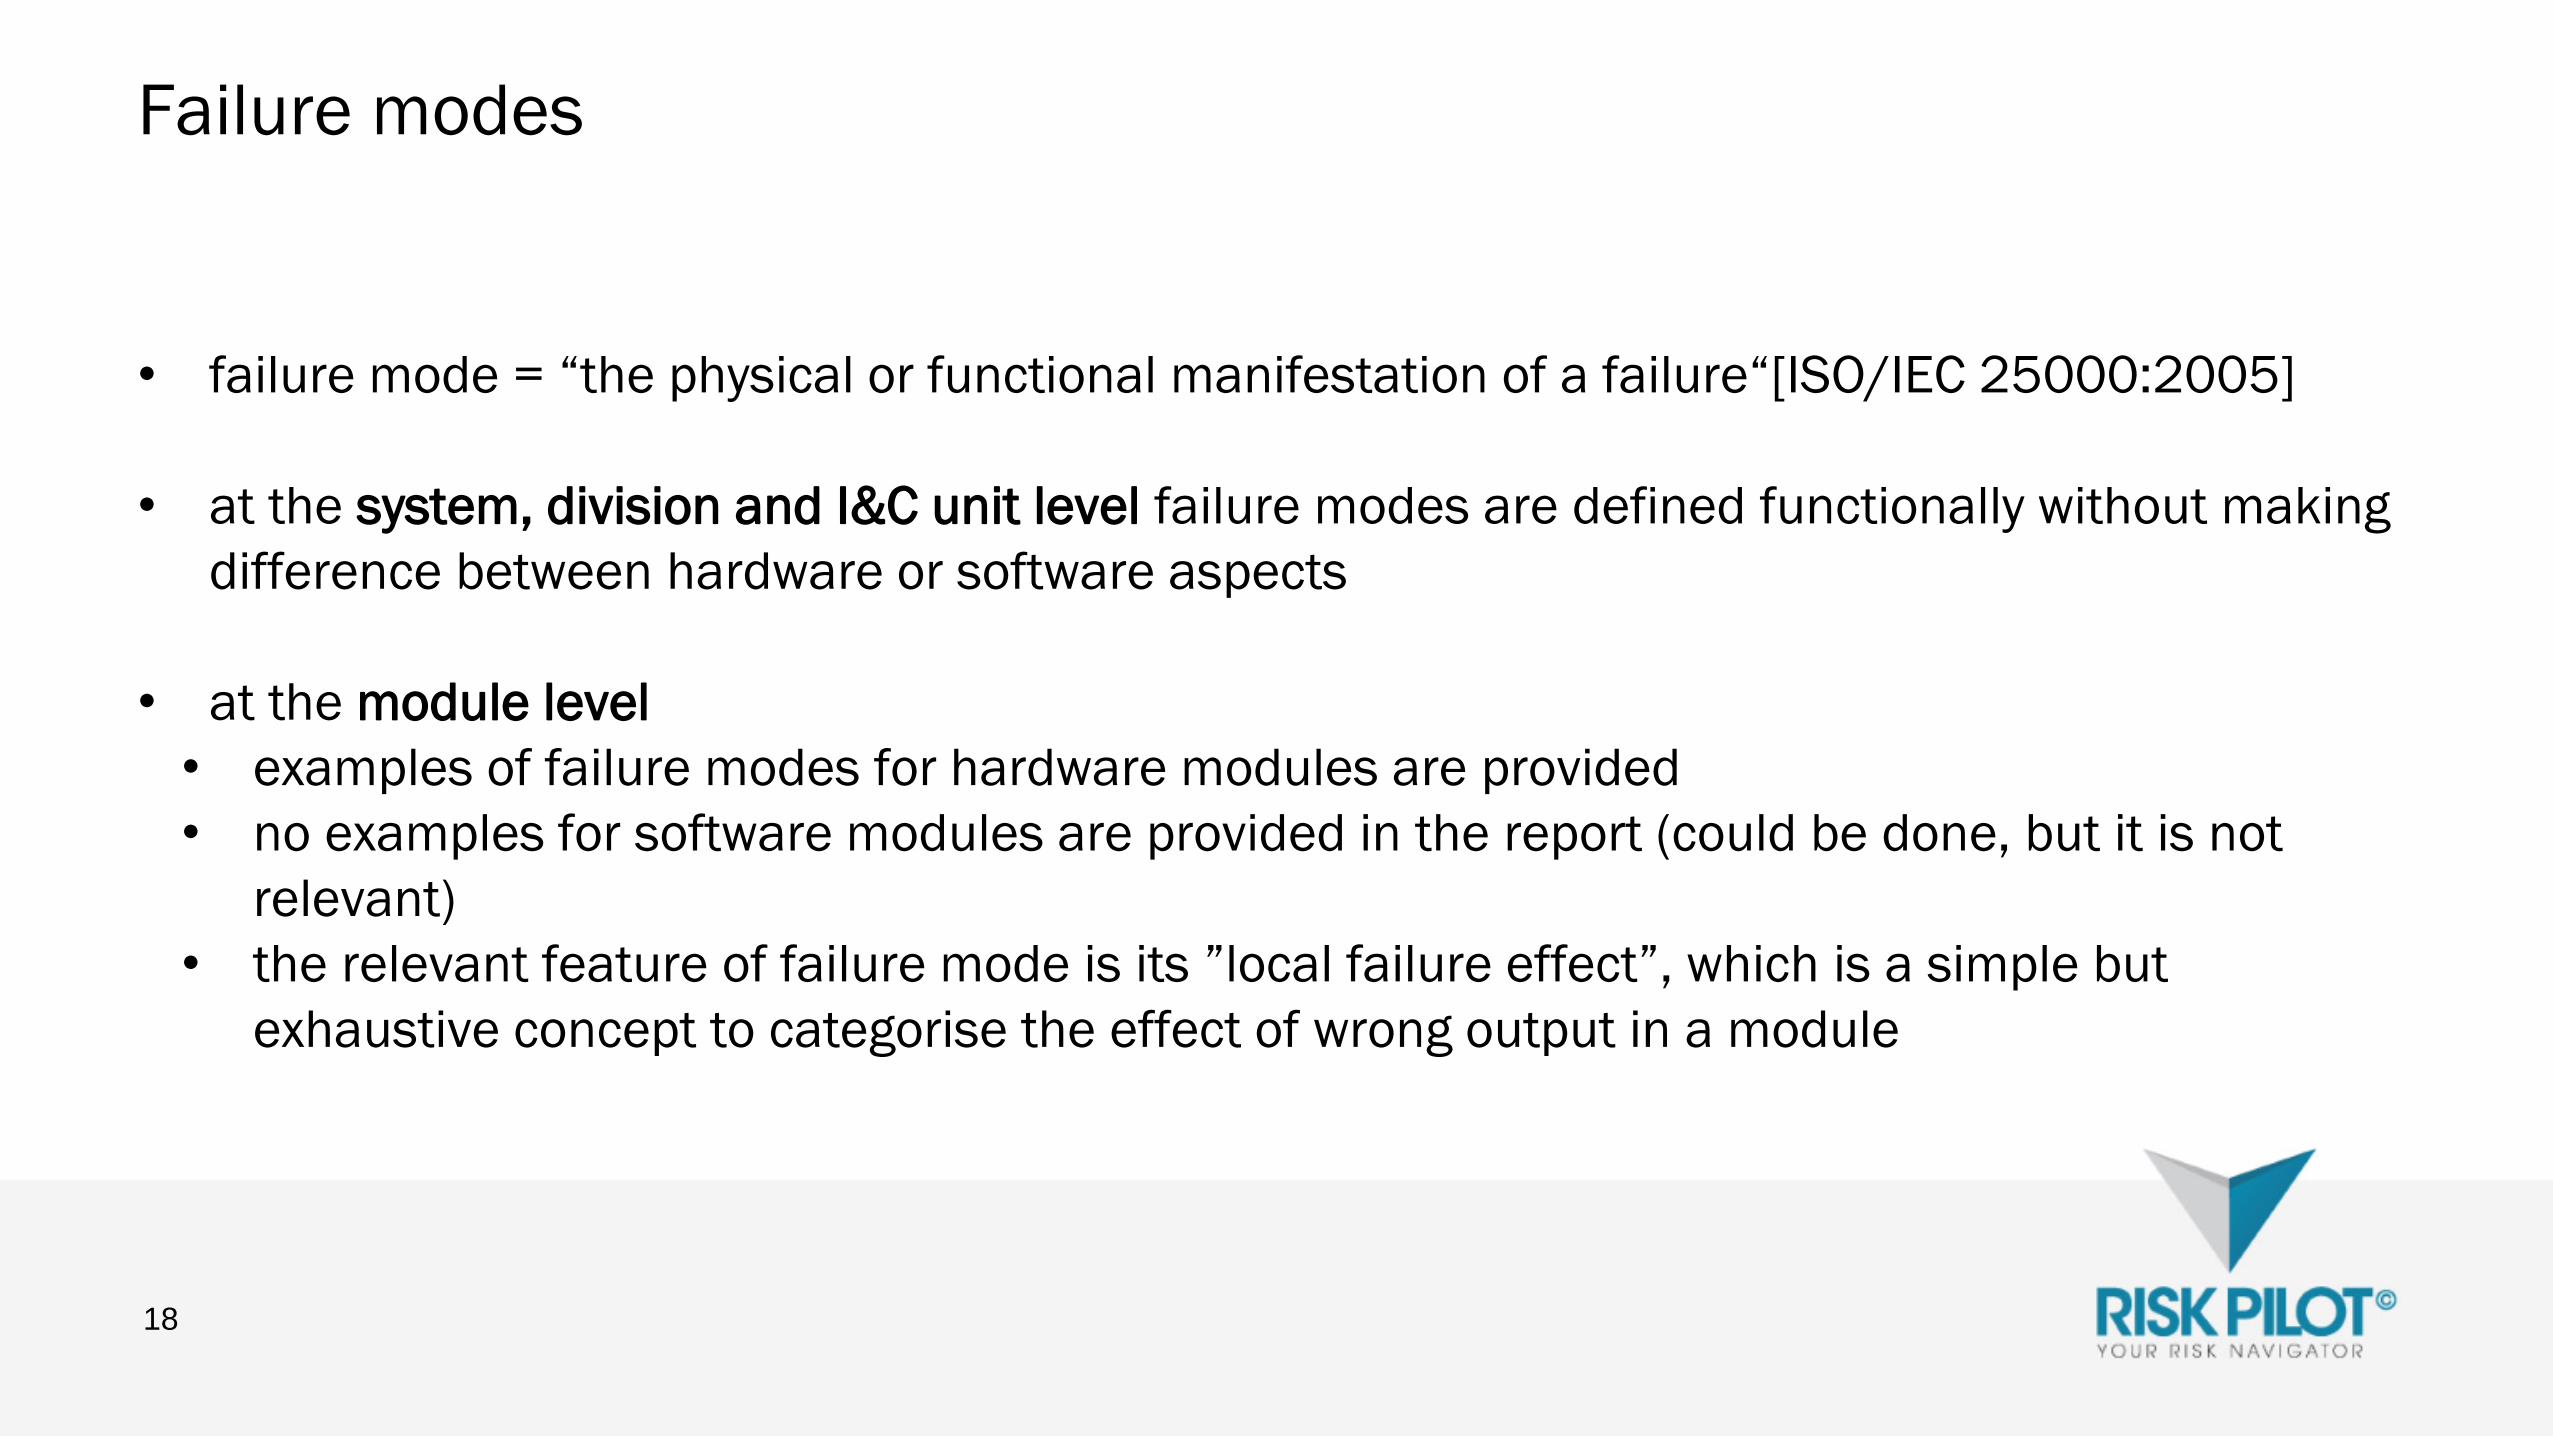
• failure mode = “the physical or functional manifestation of a failure“[ISO/IEC 25000:2005]
• at the system, division and I&C unit level failure modes are defined functionally without making
difference between hardware or software aspects
• at the module level
• examples of failure modes for hardware modules are provided
• no examples for software modules are provided in the report (could be done, but it is not
relevant)
• the relevant feature of failure mode is its ”local failure effect”, which is a simple but
exhaustive concept to categorise the effect of wrong output in a module
18
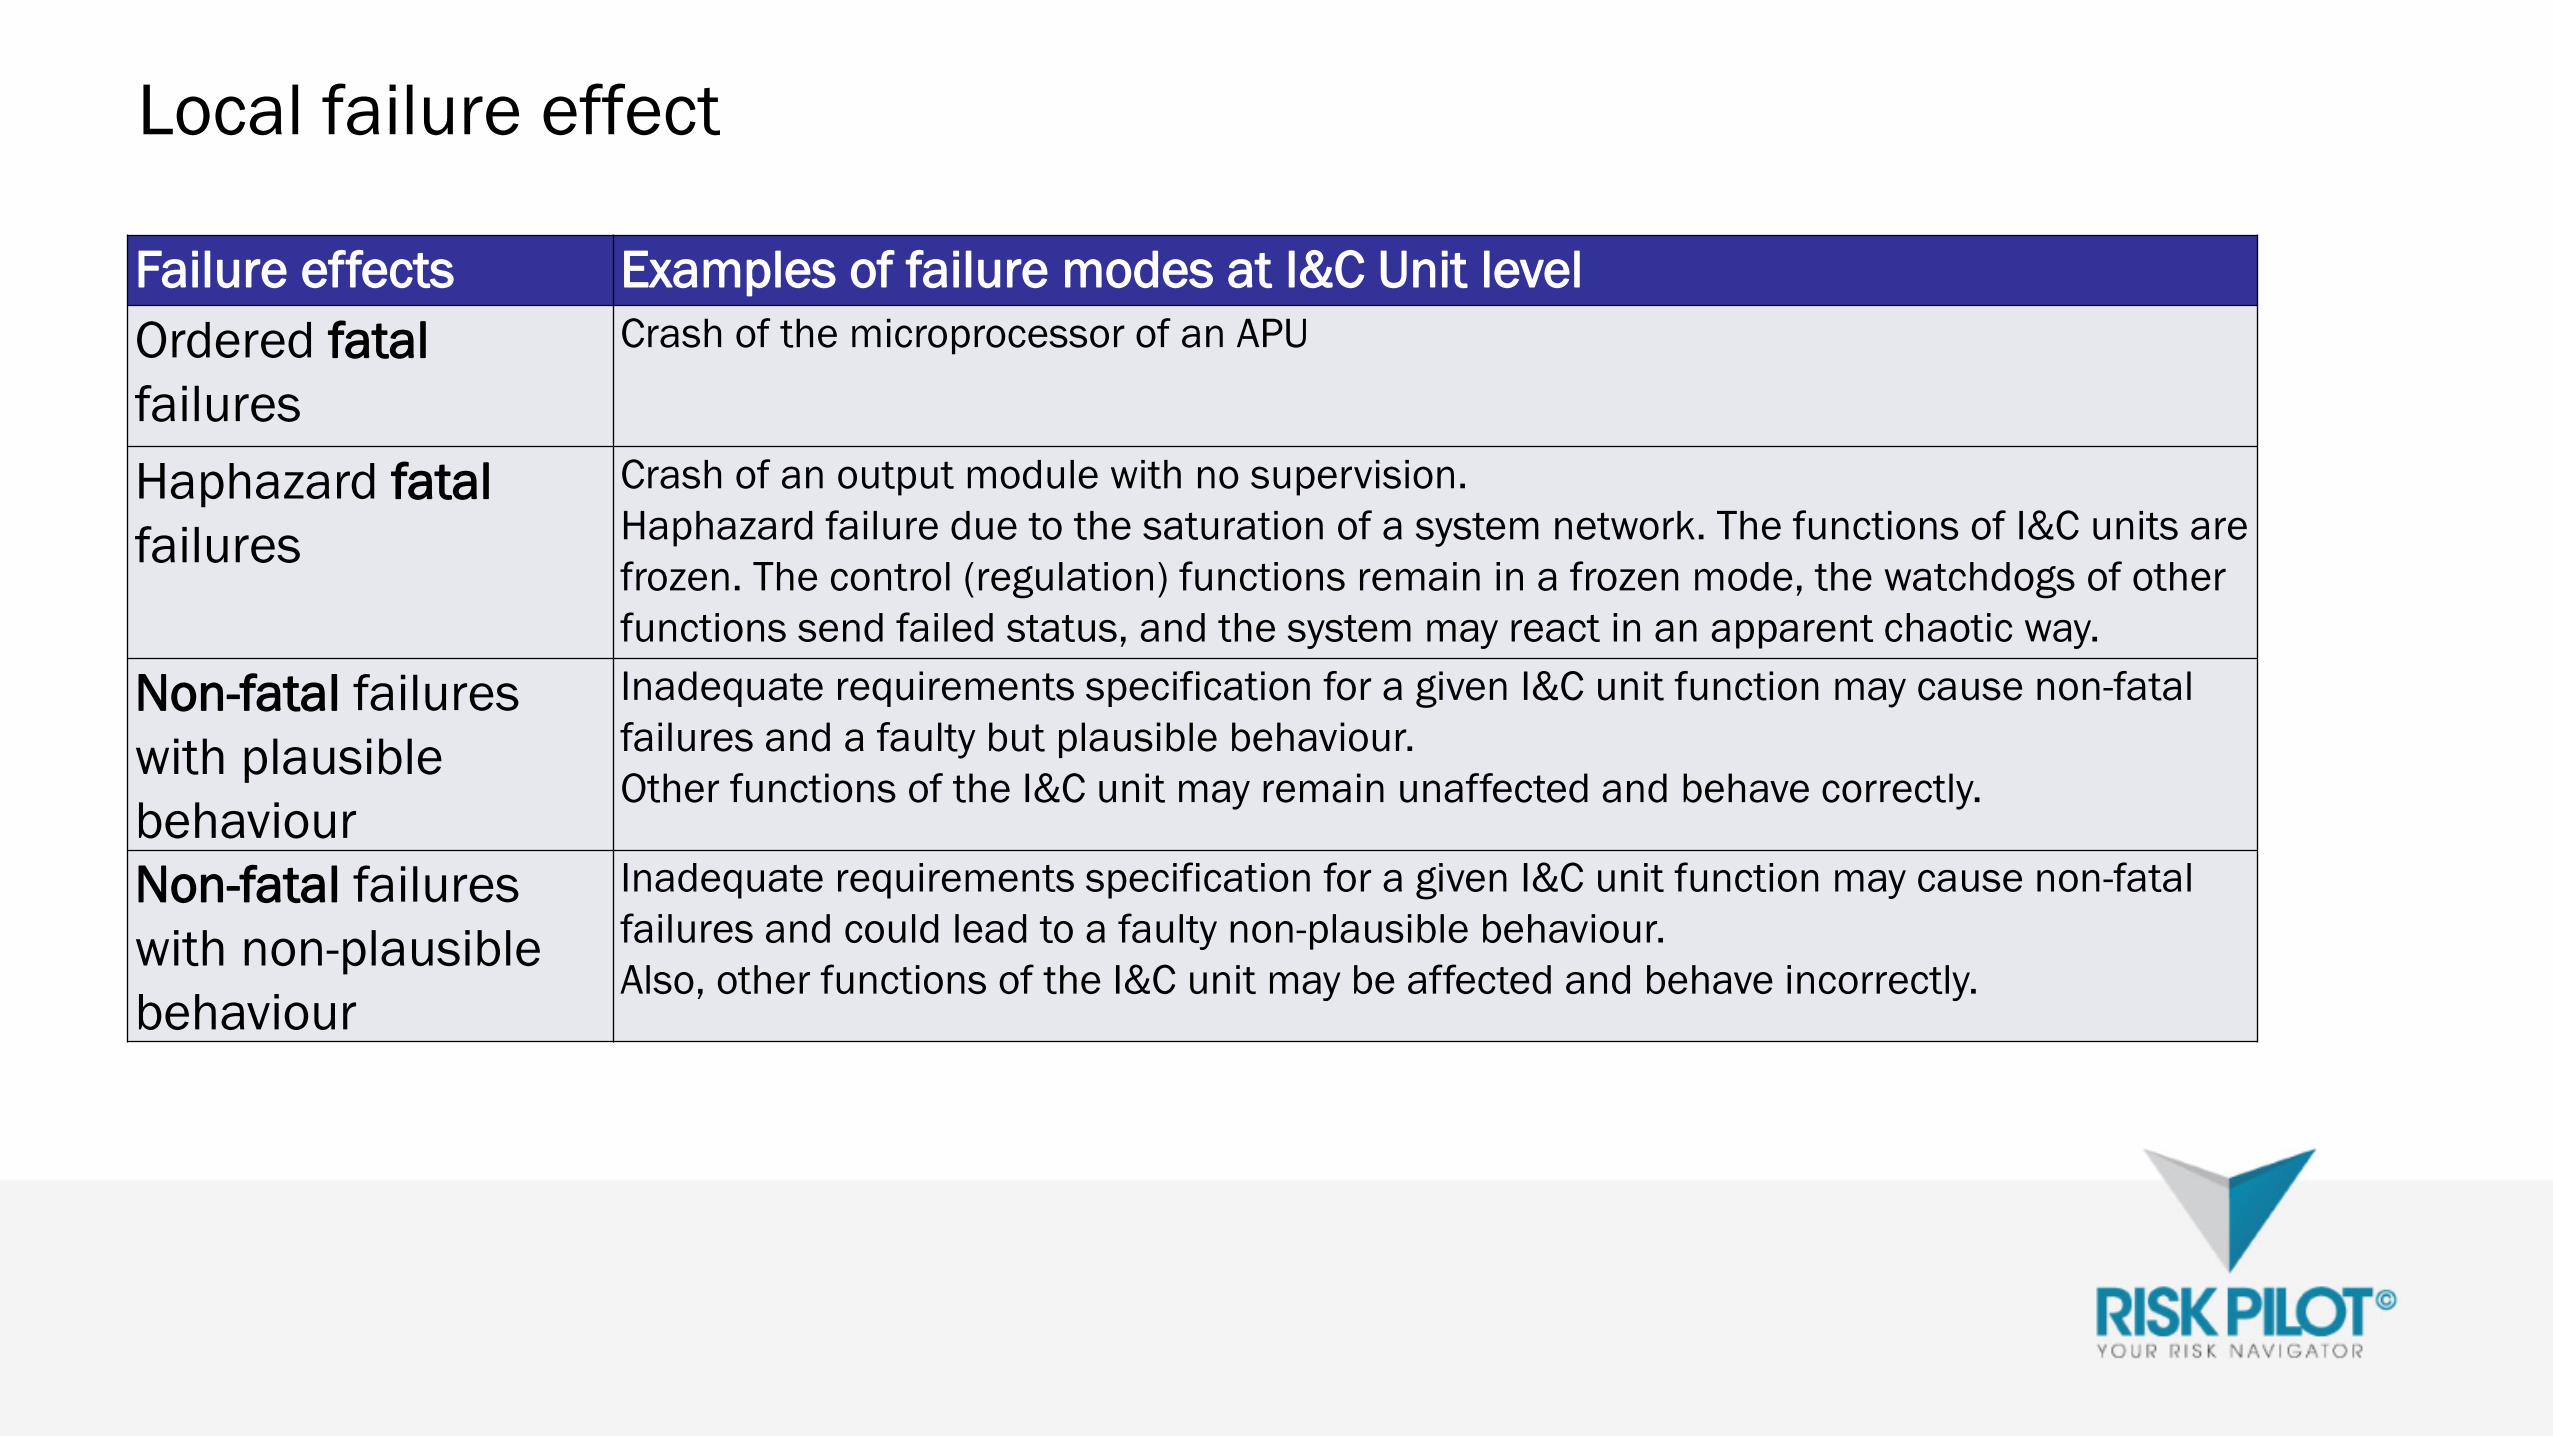
Local failure effect
Failure effects Examples of failure modes at I&C Unit level
Ordered fatal
failures
Crash of the microprocessor of an APU
Haphazard fatal
failures
Crash of an output module with no supervision.
Haphazard failure due to the saturation of a system network. The functions of I&C units are
frozen. The control (regulation) functions remain in a frozen mode, the watchdogs of other
functions send failed status, and the system may react in an apparent chaotic way.
Non-fatal failures
with plausible
behaviour
Inadequate requirements specification for a given I&C unit function may cause non-fatal
failures and a faulty but plausible behaviour.
Other functions of the I&C unit may remain unaffected and behave correctly.
Non-fatal failures
with non-plausible
behaviour
Inadequate requirements specification for a given I&C unit function may cause non-fatal
failures and could lead to a faulty non-plausible behaviour.
Also, other functions of the I&C unit may be affected and behave incorrectly.
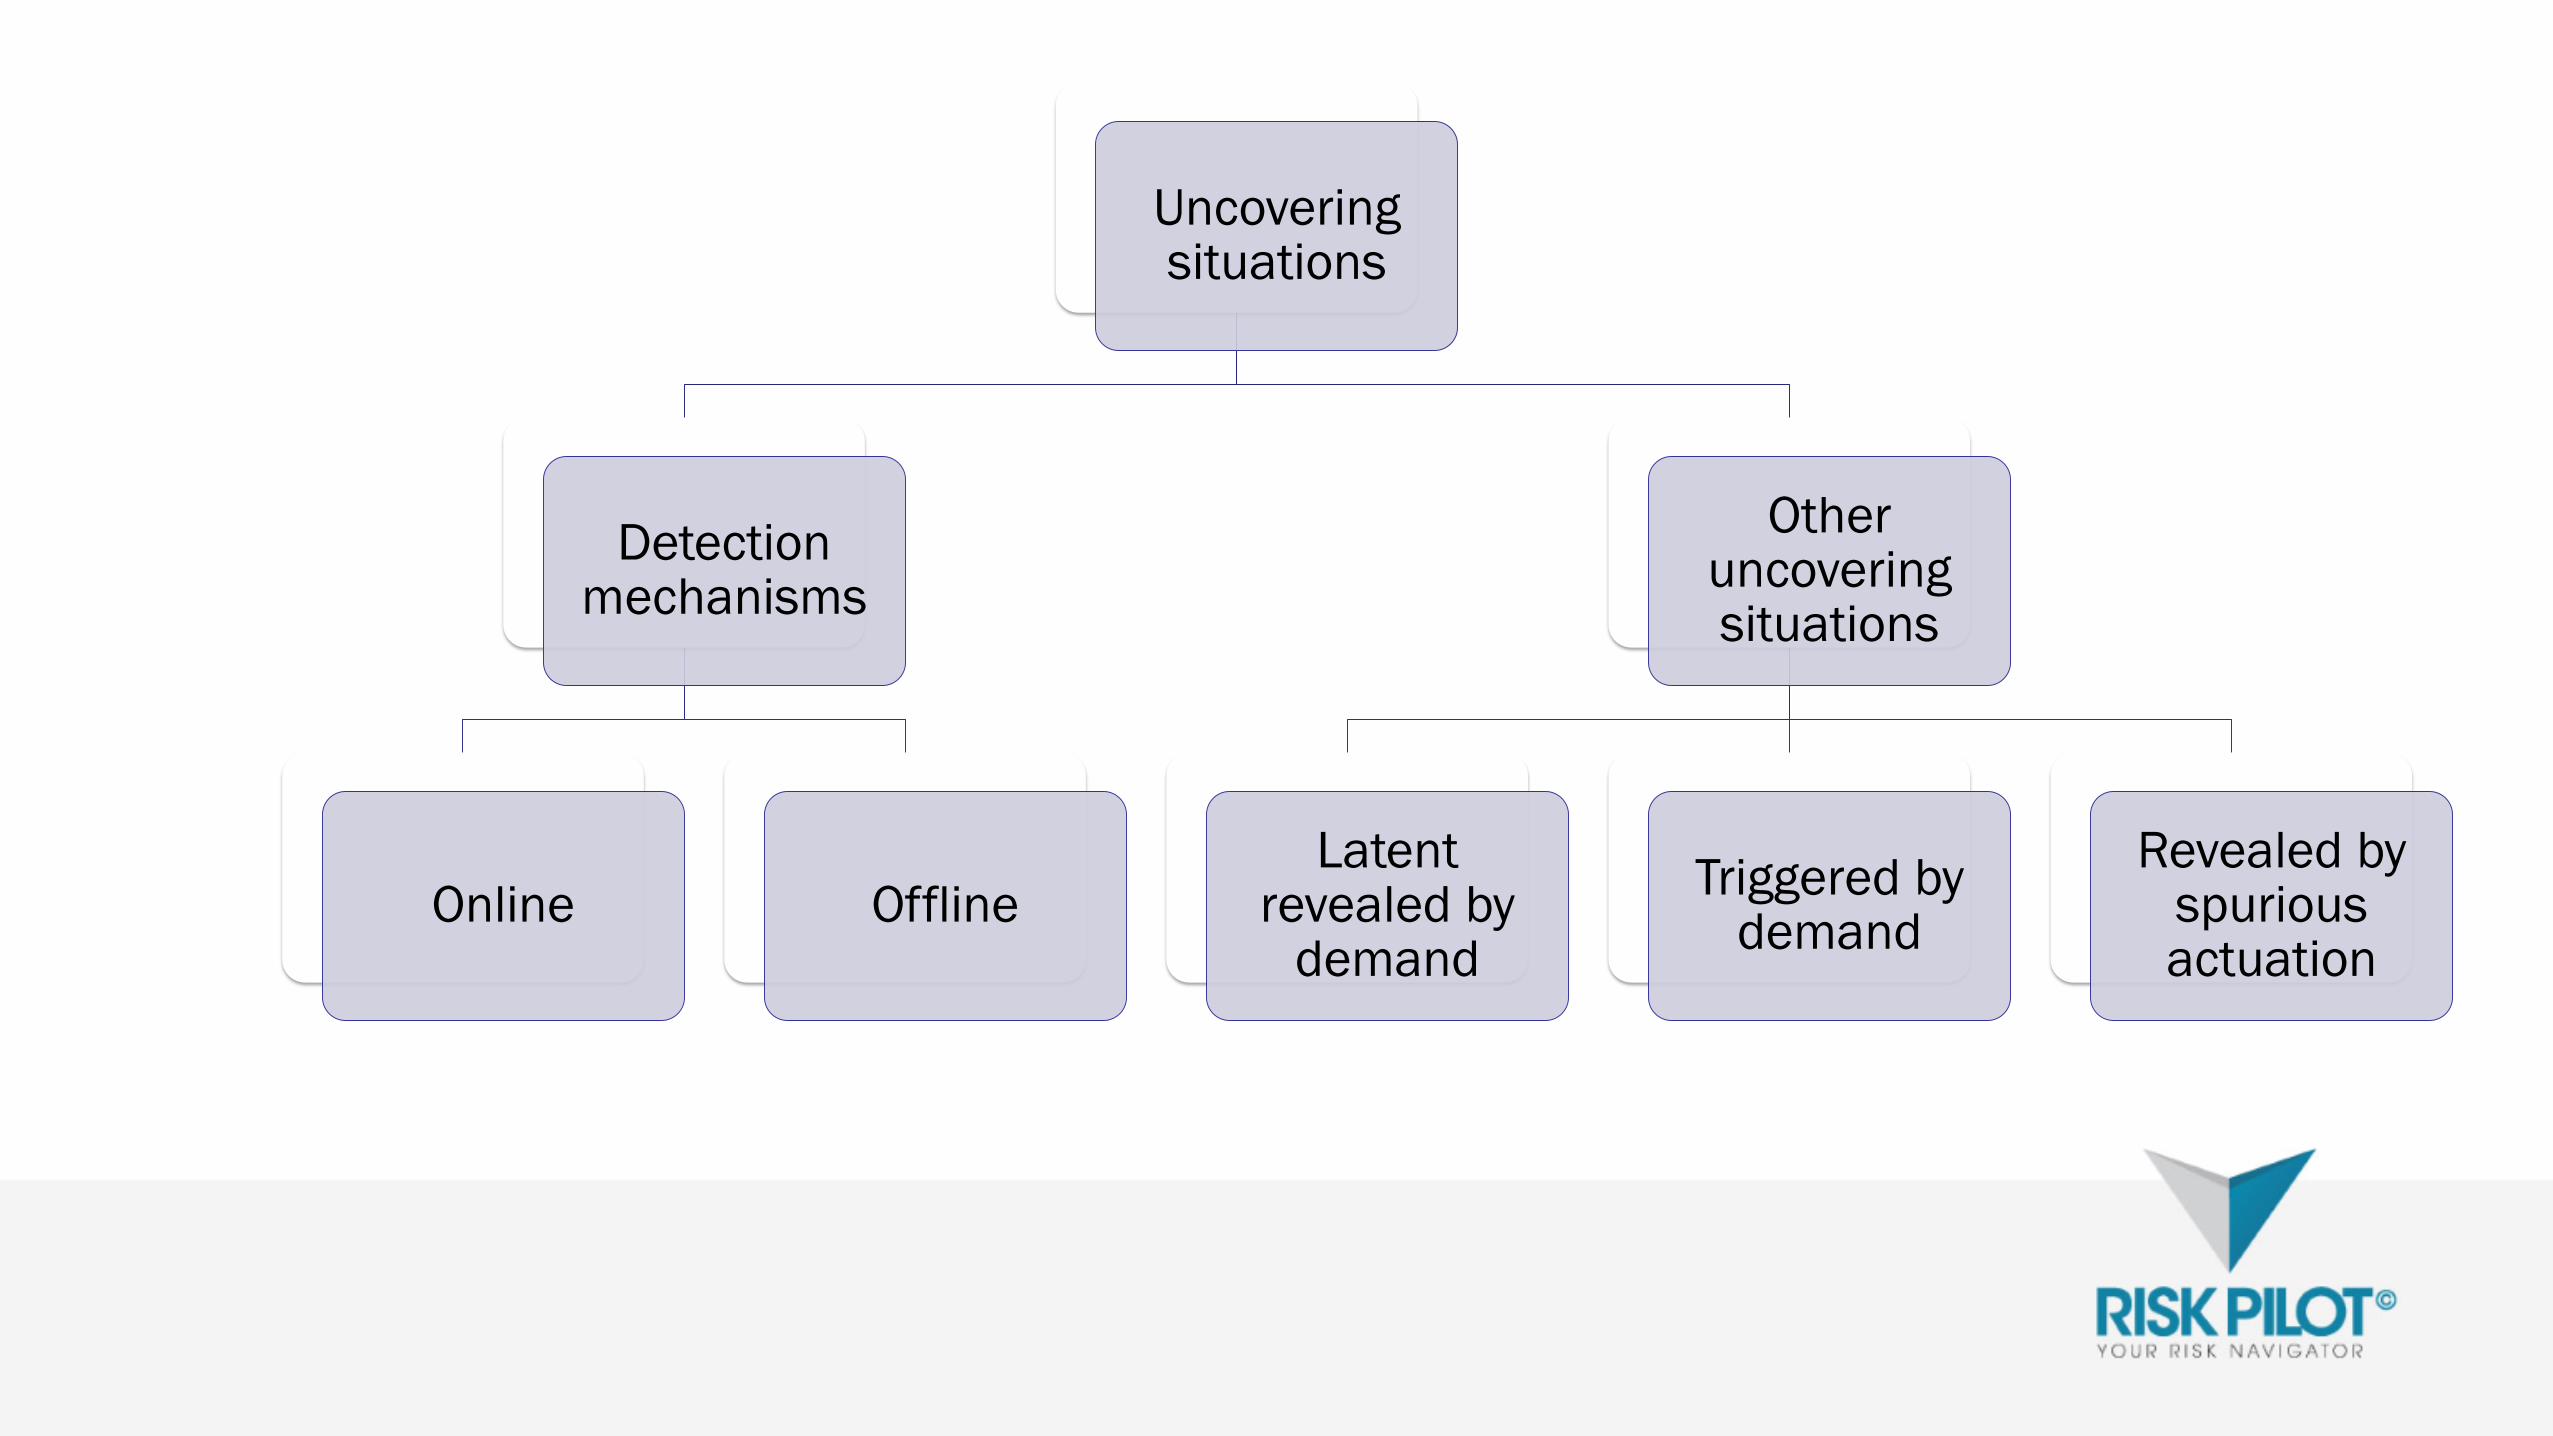
Uncoveringsituations
Detectionmechanisms
Online Offline
Otheruncoveringsituations
Latentrevealed by
demand
Triggered bydemand
Revealed byspuriousactuation

Relevance of local failure effect and uncovering situations
Failure effect
Uncovering situation
Online
detection
Offline
detection
Revealed by
spurious action
Latent revealed
by demand
Triggered by
demand
Fatal, ordered R NR R NR R
Fatal, haphazard NR R R R R
Non-fatal, plausible
behaviour
NR R R R R
Non-fatal, non-
plausible behaviour
R NR R NR R
R: Combination relevant for further analysis of end effects
NR: Combination not relevant for the analysis of the effects. Non-relevance is due to logical
considerations

Failure end effect
• Extent of the failure – which I&C units of the
system are affected
• maximally
• most likely
• Functional failure mode of the I&C unit
22
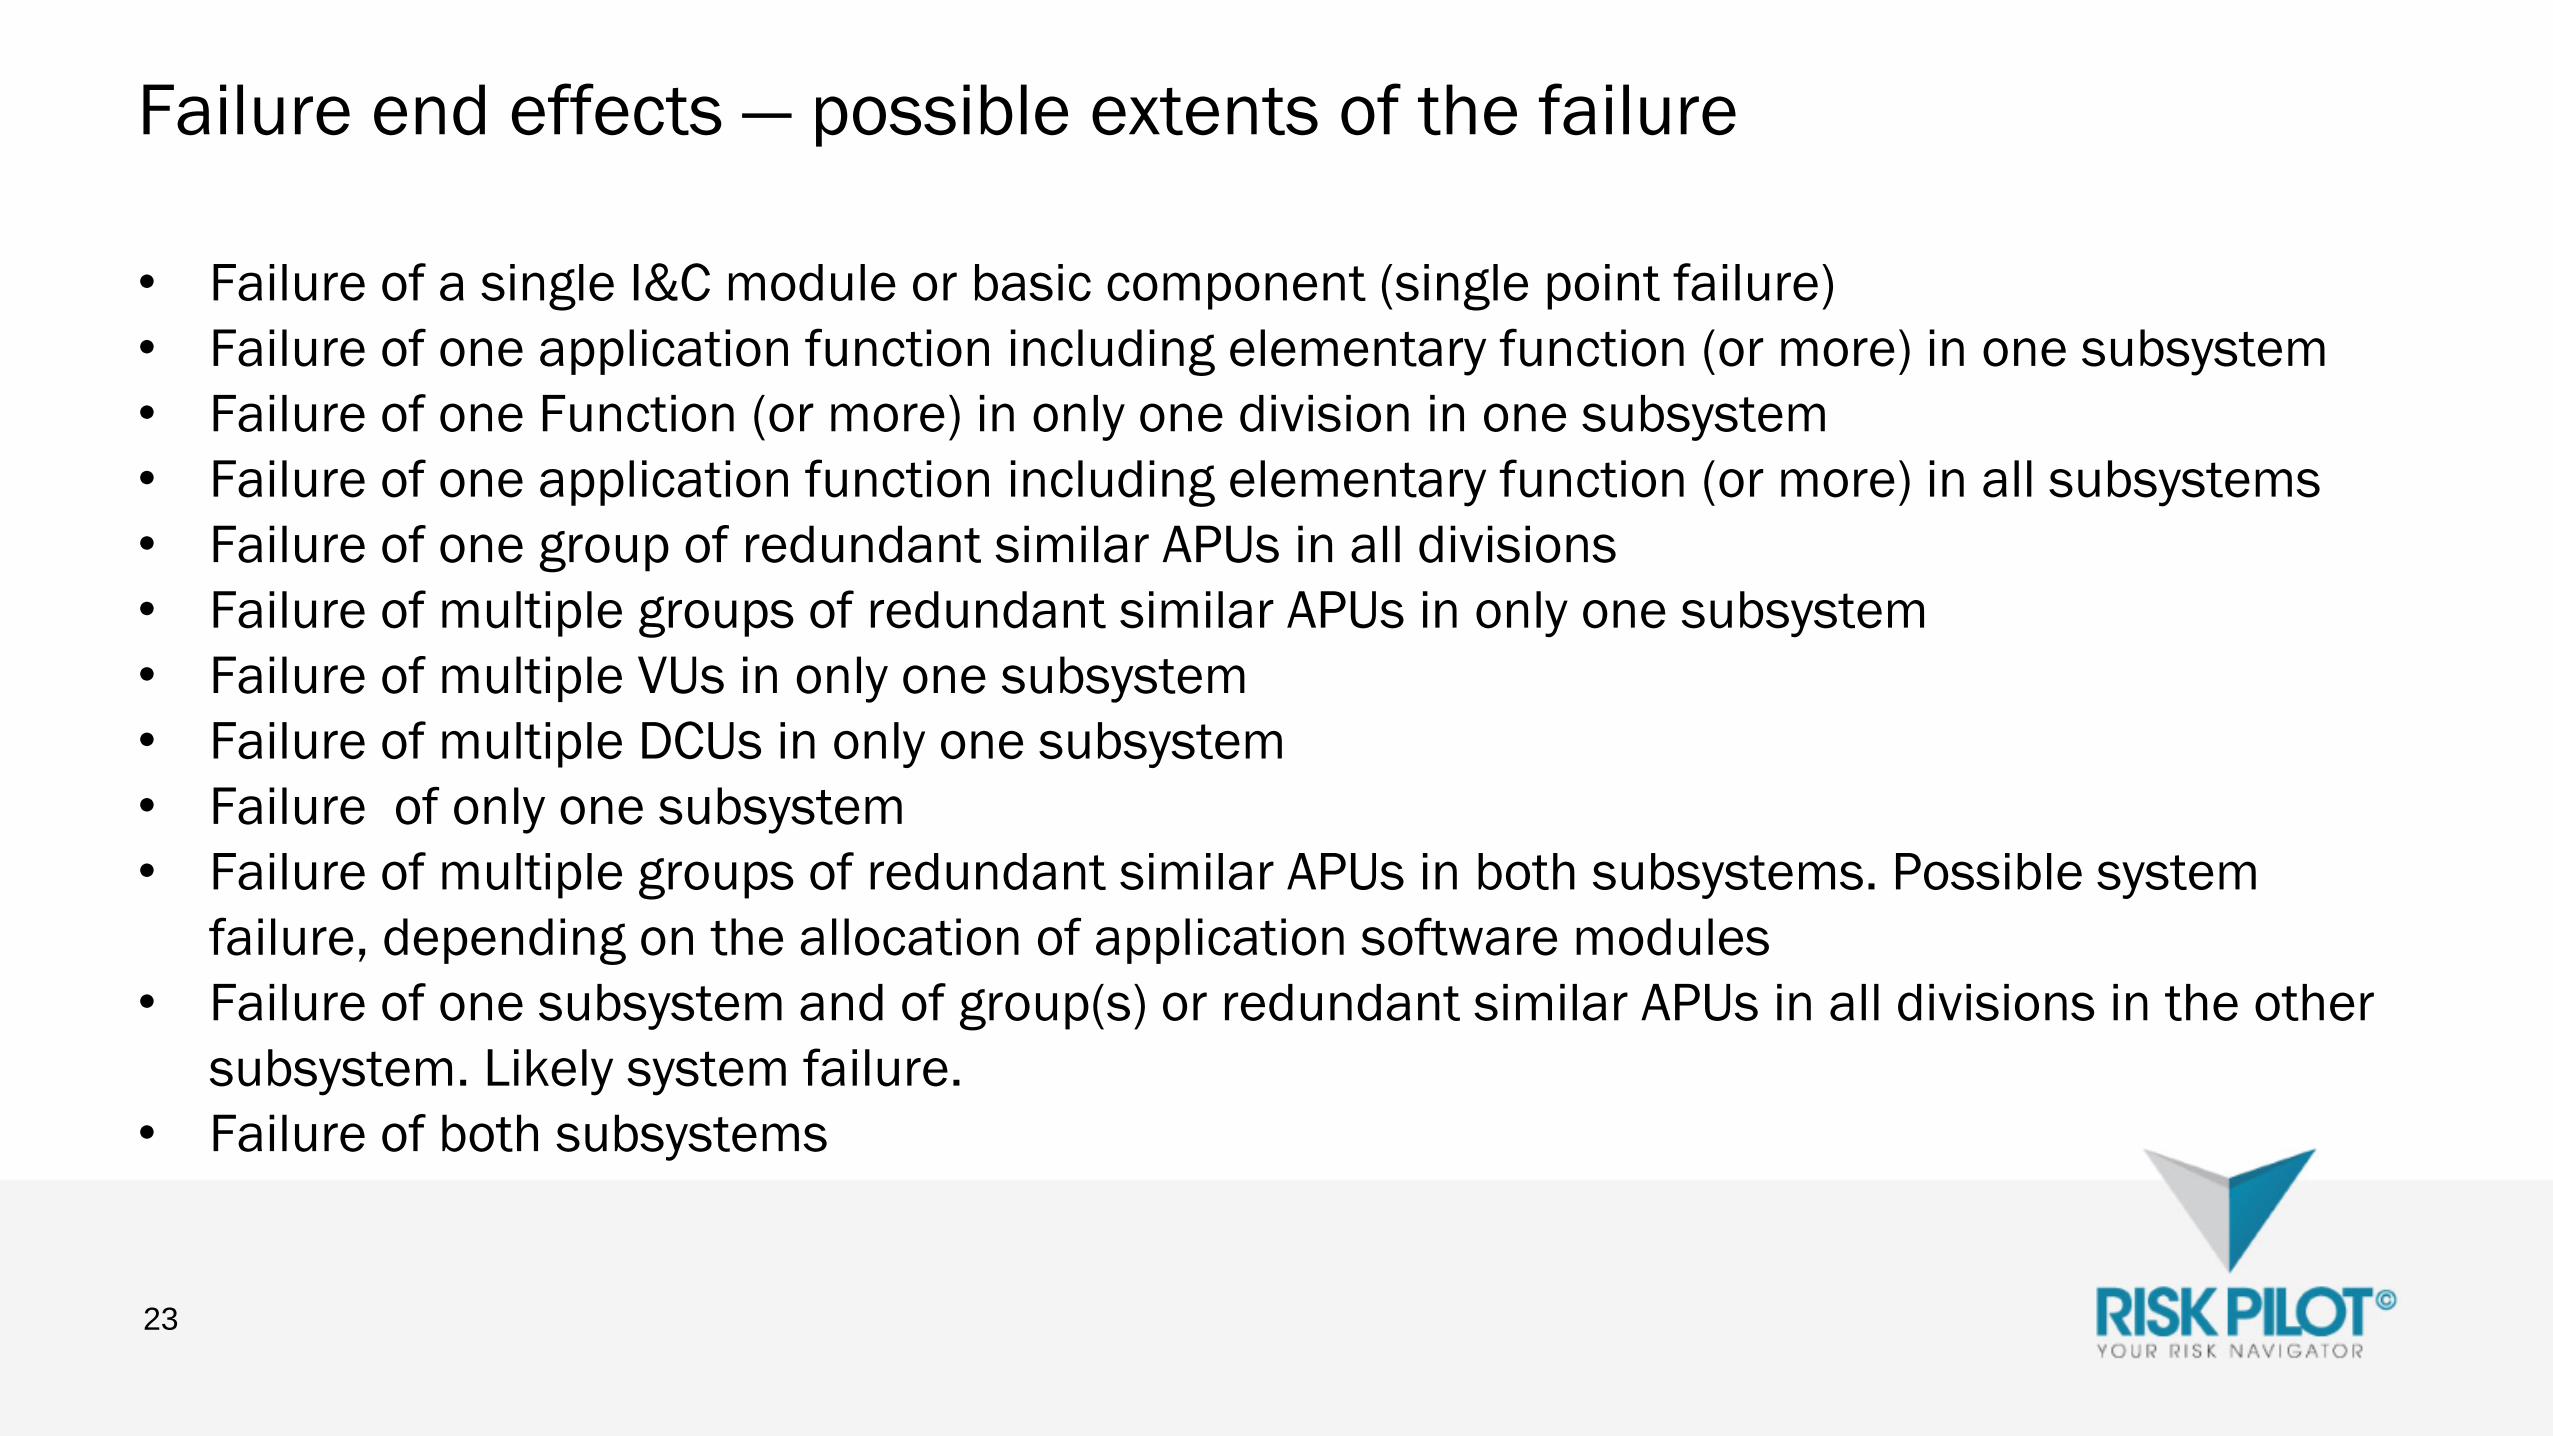
Failure end effects — possible extents of the failure
• Failure of a single I&C module or basic component (single point failure)
• Failure of one application function including elementary function (or more) in one subsystem
• Failure of one Function (or more) in only one division in one subsystem
• Failure of one application function including elementary function (or more) in all subsystems
• Failure of one group of redundant similar APUs in all divisions
• Failure of multiple groups of redundant similar APUs in only one subsystem
• Failure of multiple VUs in only one subsystem
• Failure of multiple DCUs in only one subsystem
• Failure of only one subsystem
• Failure of multiple groups of redundant similar APUs in both subsystems. Possible system
failure, depending on the allocation of application software modules
• Failure of one subsystem and of group(s) or redundant similar APUs in all divisions in the other
subsystem. Likely system failure.
• Failure of both subsystems
23
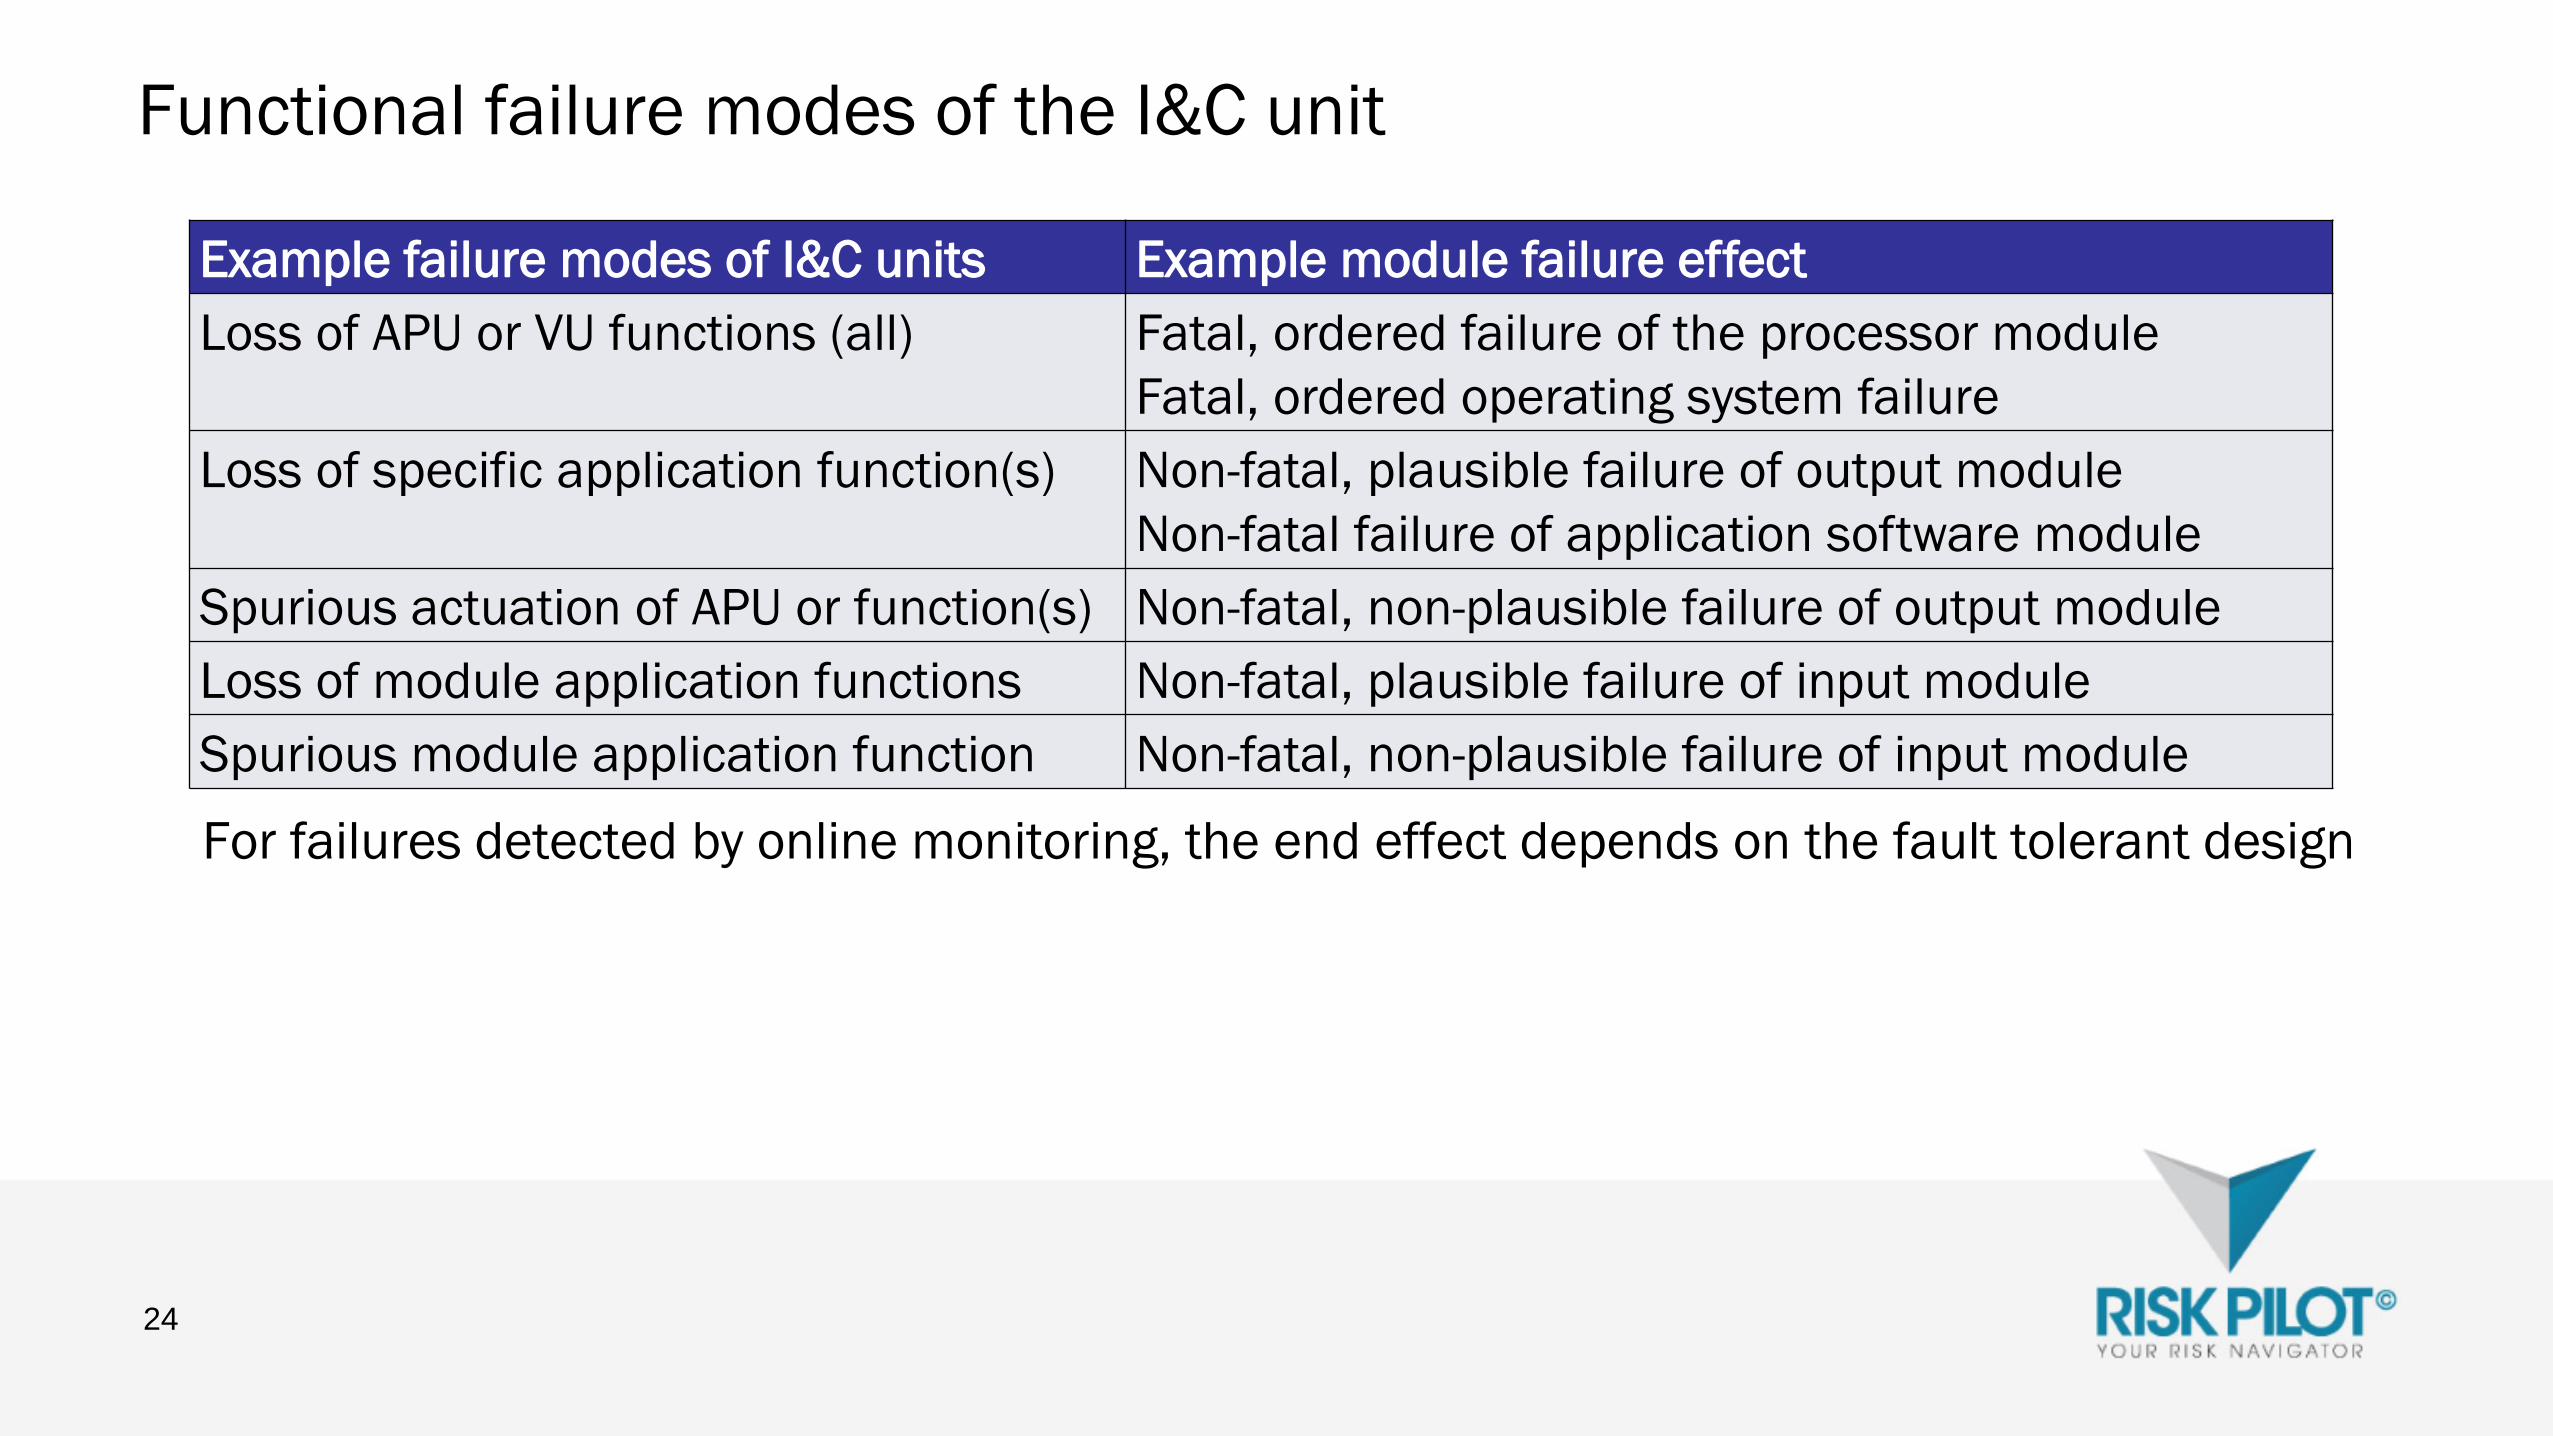
Functional failure modes of the I&C unit
For failures detected by online monitoring, the end effect depends on the fault tolerant design
24
Example failure modes of I&C units Example module failure effect
Loss of APU or VU functions (all) Fatal, ordered failure of the processor module
Fatal, ordered operating system failure
Loss of specific application function(s) Non-fatal, plausible failure of output module
Non-fatal failure of application software module
Spurious actuation of APU or function(s) Non-fatal, non-plausible failure of output module
Loss of module application functions Non-fatal, plausible failure of input module
Spurious module application function Non-fatal, non-plausible failure of input module

Application of the taxonomy in PRA modelling
• The aim is to define the failure modes by functional effect rather than local effect
• keeps down the number of events and the model size
• simplifies the modelling efforts
• makes the fault tree structure and the dependencies more comprehensible to the PSA user
• Grouping of failure modes at as a high functional level as possible, taking into account failure
characteristics vital for the functional effect
• most important factor is means of failure detection
• other important factors in grouping
• differences in test intervals
• CCF categorization
• failure mode timing issues
25
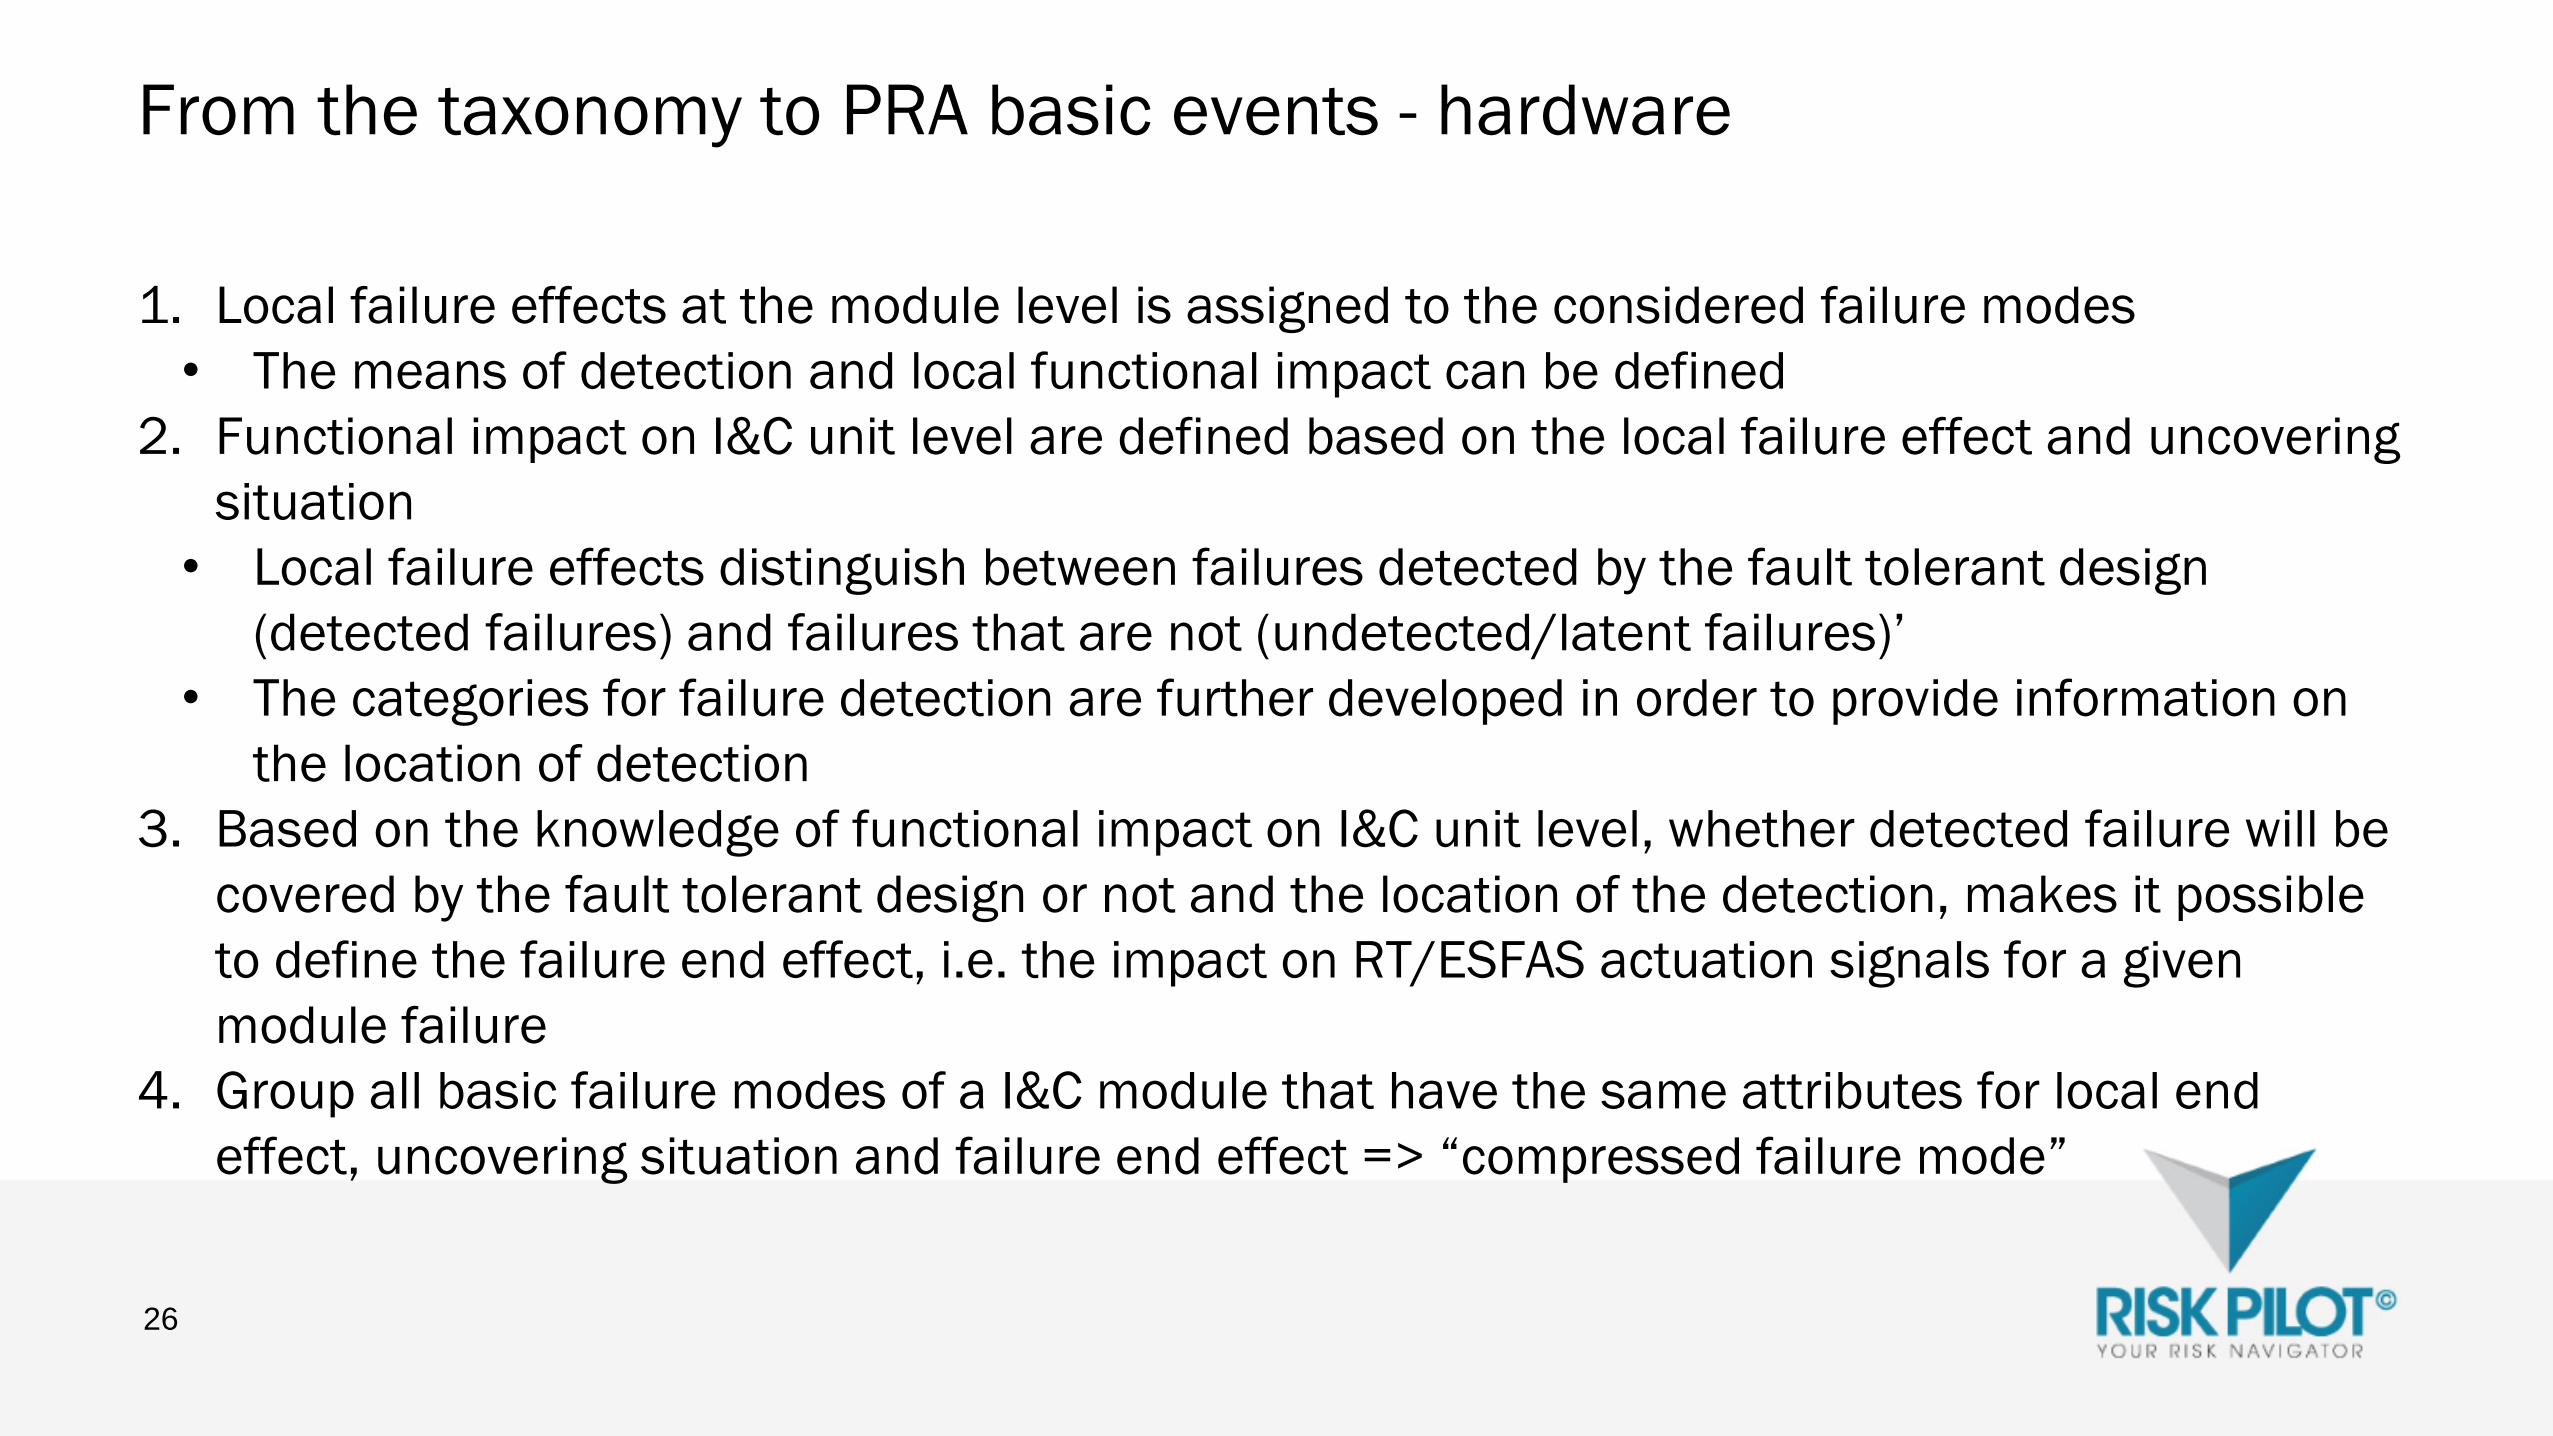
From the taxonomy to PRA basic events - hardware
1. Local failure effects at the module level is assigned to the considered failure modes
• The means of detection and local functional impact can be defined
2. Functional impact on I&C unit level are defined based on the local failure effect and uncovering
situation
• Local failure effects distinguish between failures detected by the fault tolerant design
(detected failures) and failures that are not (undetected/latent failures)’
• The categories for failure detection are further developed in order to provide information on
the location of detection
3. Based on the knowledge of functional impact on I&C unit level, whether detected failure will be
covered by the fault tolerant design or not and the location of the detection, makes it possible
to define the failure end effect, i.e. the impact on RT/ESFAS actuation signals for a given
module failure
4. Group all basic failure modes of a I&C module that have the same attributes for local end
effect, uncovering situation and failure end effect => “compressed failure mode”
26
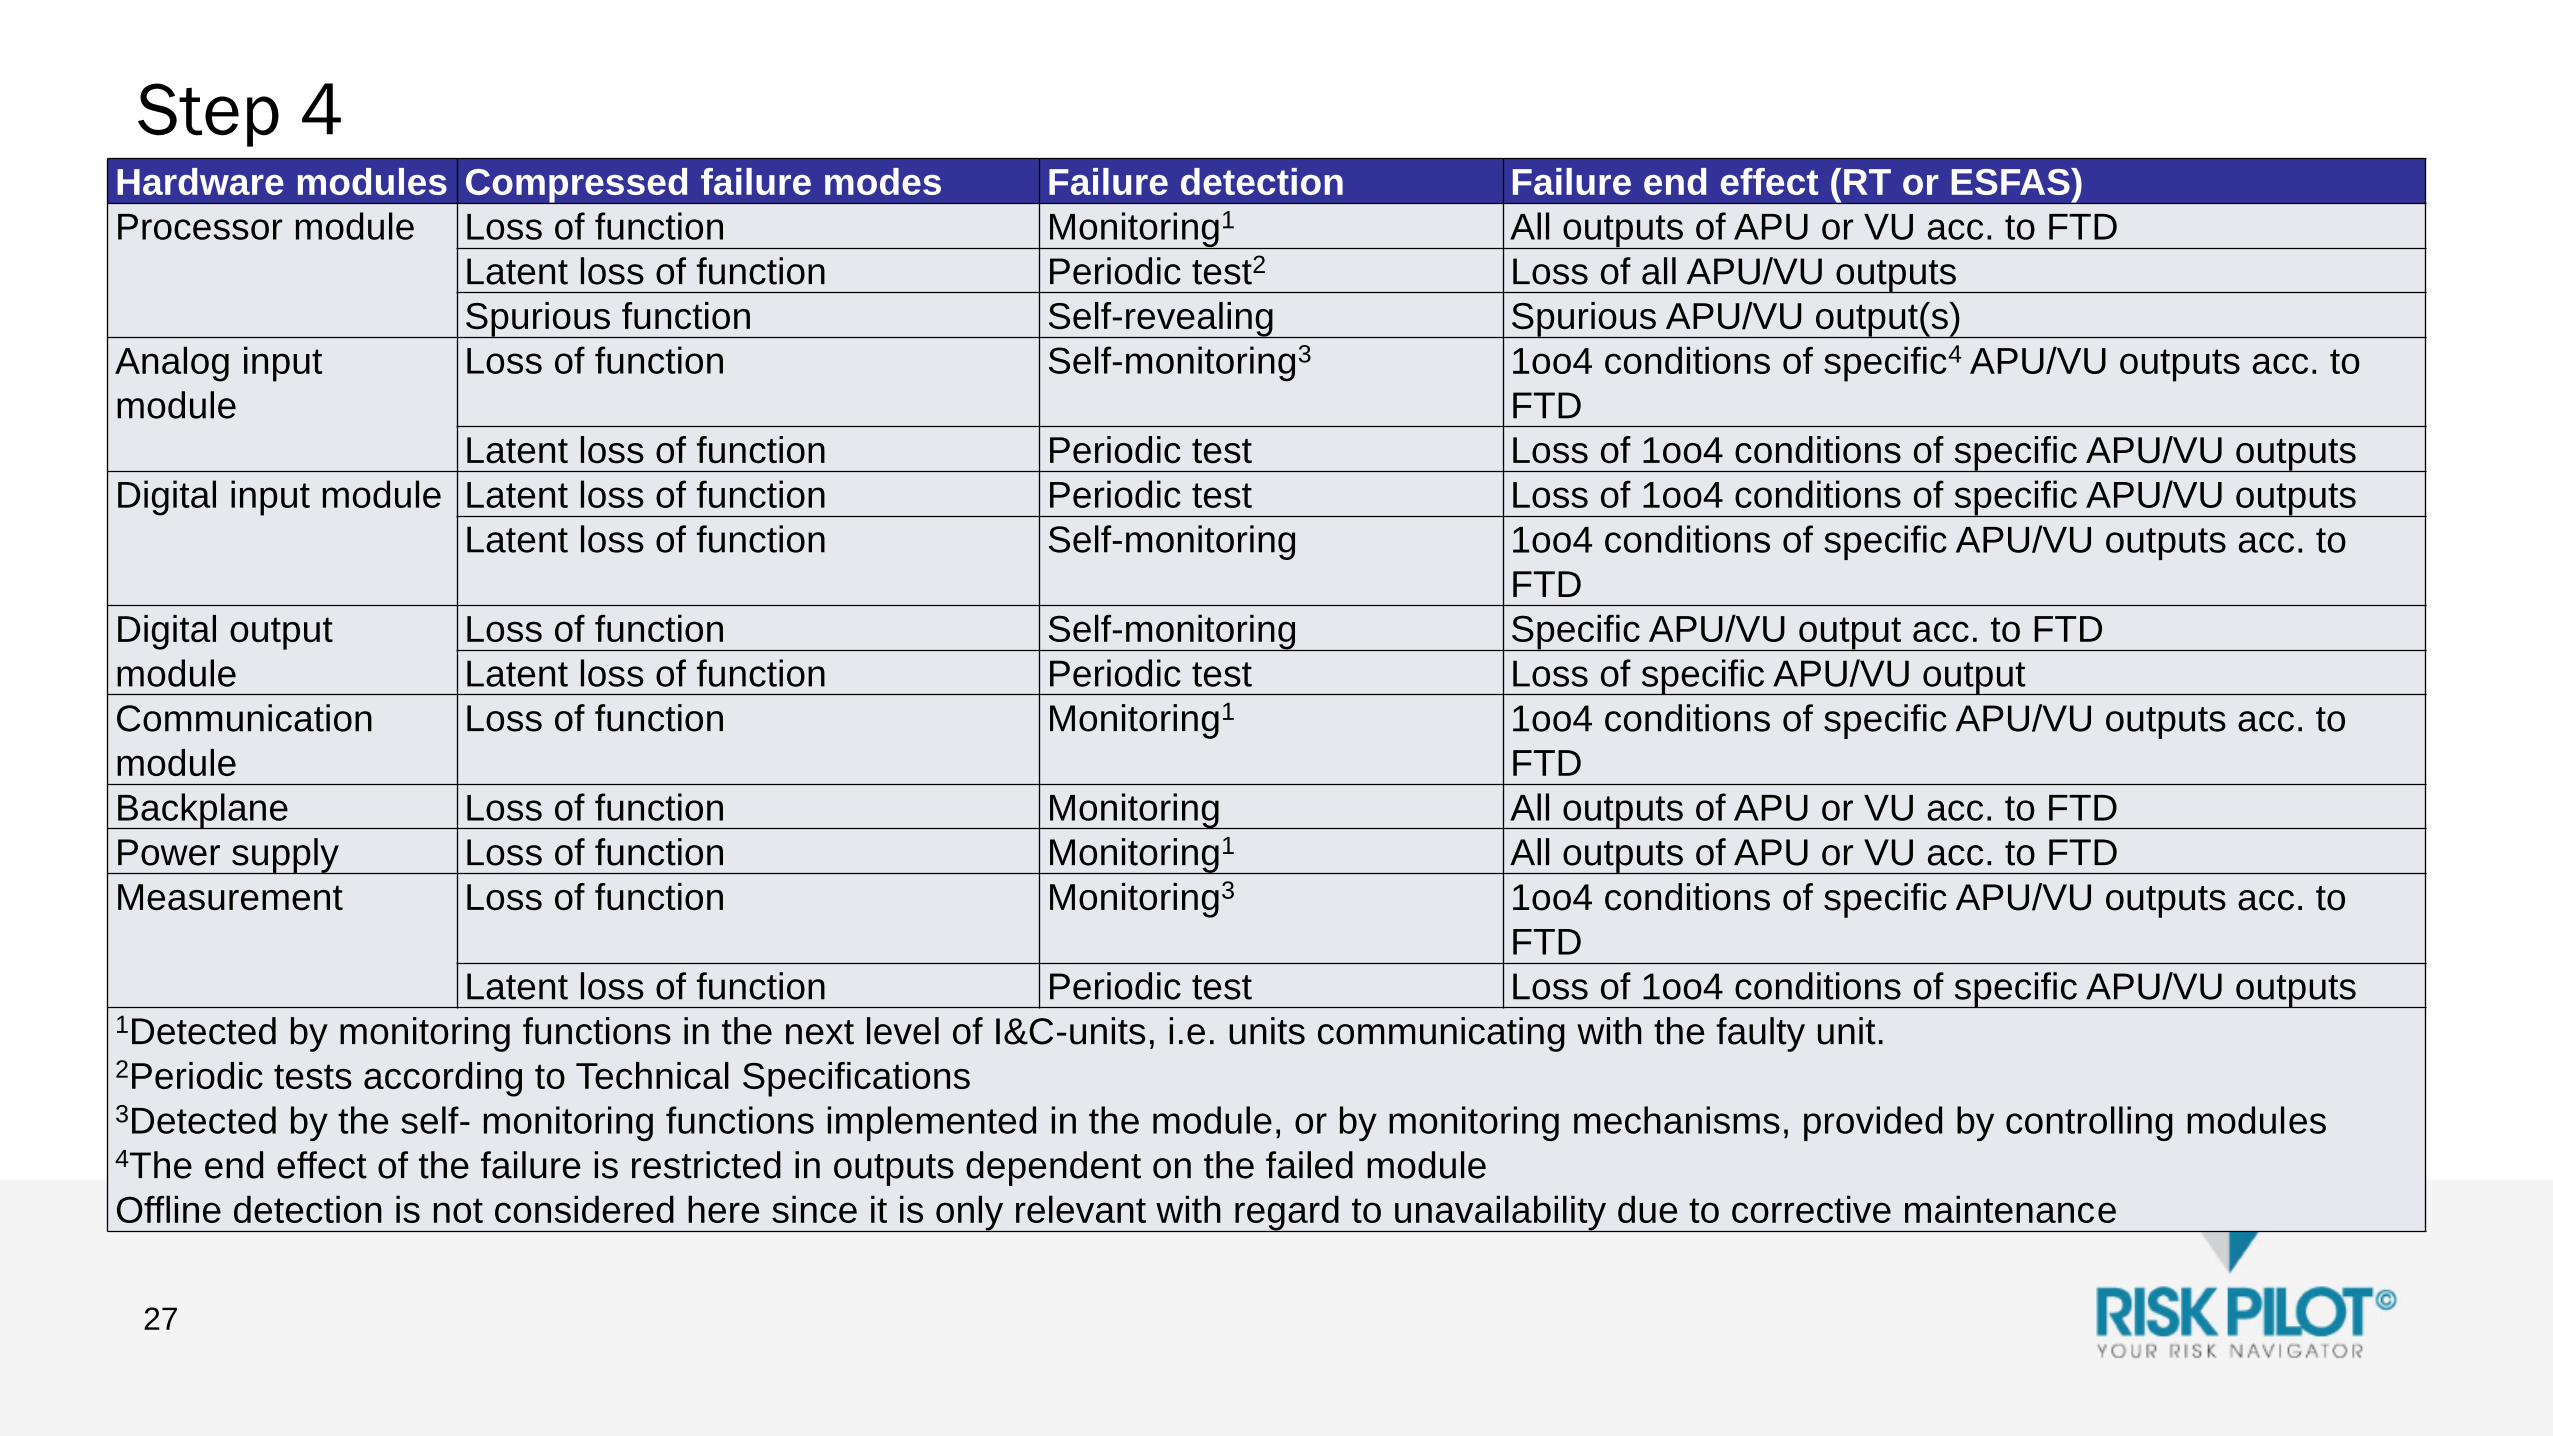
Step 4
27
Hardware modules Compressed failure modes Failure detection Failure end effect (RT or ESFAS)
Processor module Loss of function Monitoring1 All outputs of APU or VU acc. to FTD
Latent loss of function Periodic test2 Loss of all APU/VU outputs
Spurious function Self-revealing Spurious APU/VU output(s)
Analog input
module
Loss of function Self-monitoring3 1oo4 conditions of specific4 APU/VU outputs acc. to
FTD
Latent loss of function Periodic test Loss of 1oo4 conditions of specific APU/VU outputs
Digital input module Latent loss of function Periodic test Loss of 1oo4 conditions of specific APU/VU outputs
Latent loss of function Self-monitoring 1oo4 conditions of specific APU/VU outputs acc. to
FTD
Digital output
module
Loss of function Self-monitoring Specific APU/VU output acc. to FTD
Latent loss of function Periodic test Loss of specific APU/VU output
Communication
module
Loss of function Monitoring1 1oo4 conditions of specific APU/VU outputs acc. to
FTD
Backplane Loss of function Monitoring All outputs of APU or VU acc. to FTD
Power supply Loss of function Monitoring1 All outputs of APU or VU acc. to FTD
Measurement Loss of function Monitoring3 1oo4 conditions of specific APU/VU outputs acc. to
FTD
Latent loss of function Periodic test Loss of 1oo4 conditions of specific APU/VU outputs1Detected by monitoring functions in the next level of I&C-units, i.e. units communicating with the faulty unit.2Periodic tests according to Technical Specifications 3Detected by the self- monitoring functions implemented in the module, or by monitoring mechanisms, provided by controlling modules4The end effect of the failure is restricted in outputs dependent on the failed module
Offline detection is not considered here since it is only relevant with regard to unavailability due to corrective maintenance
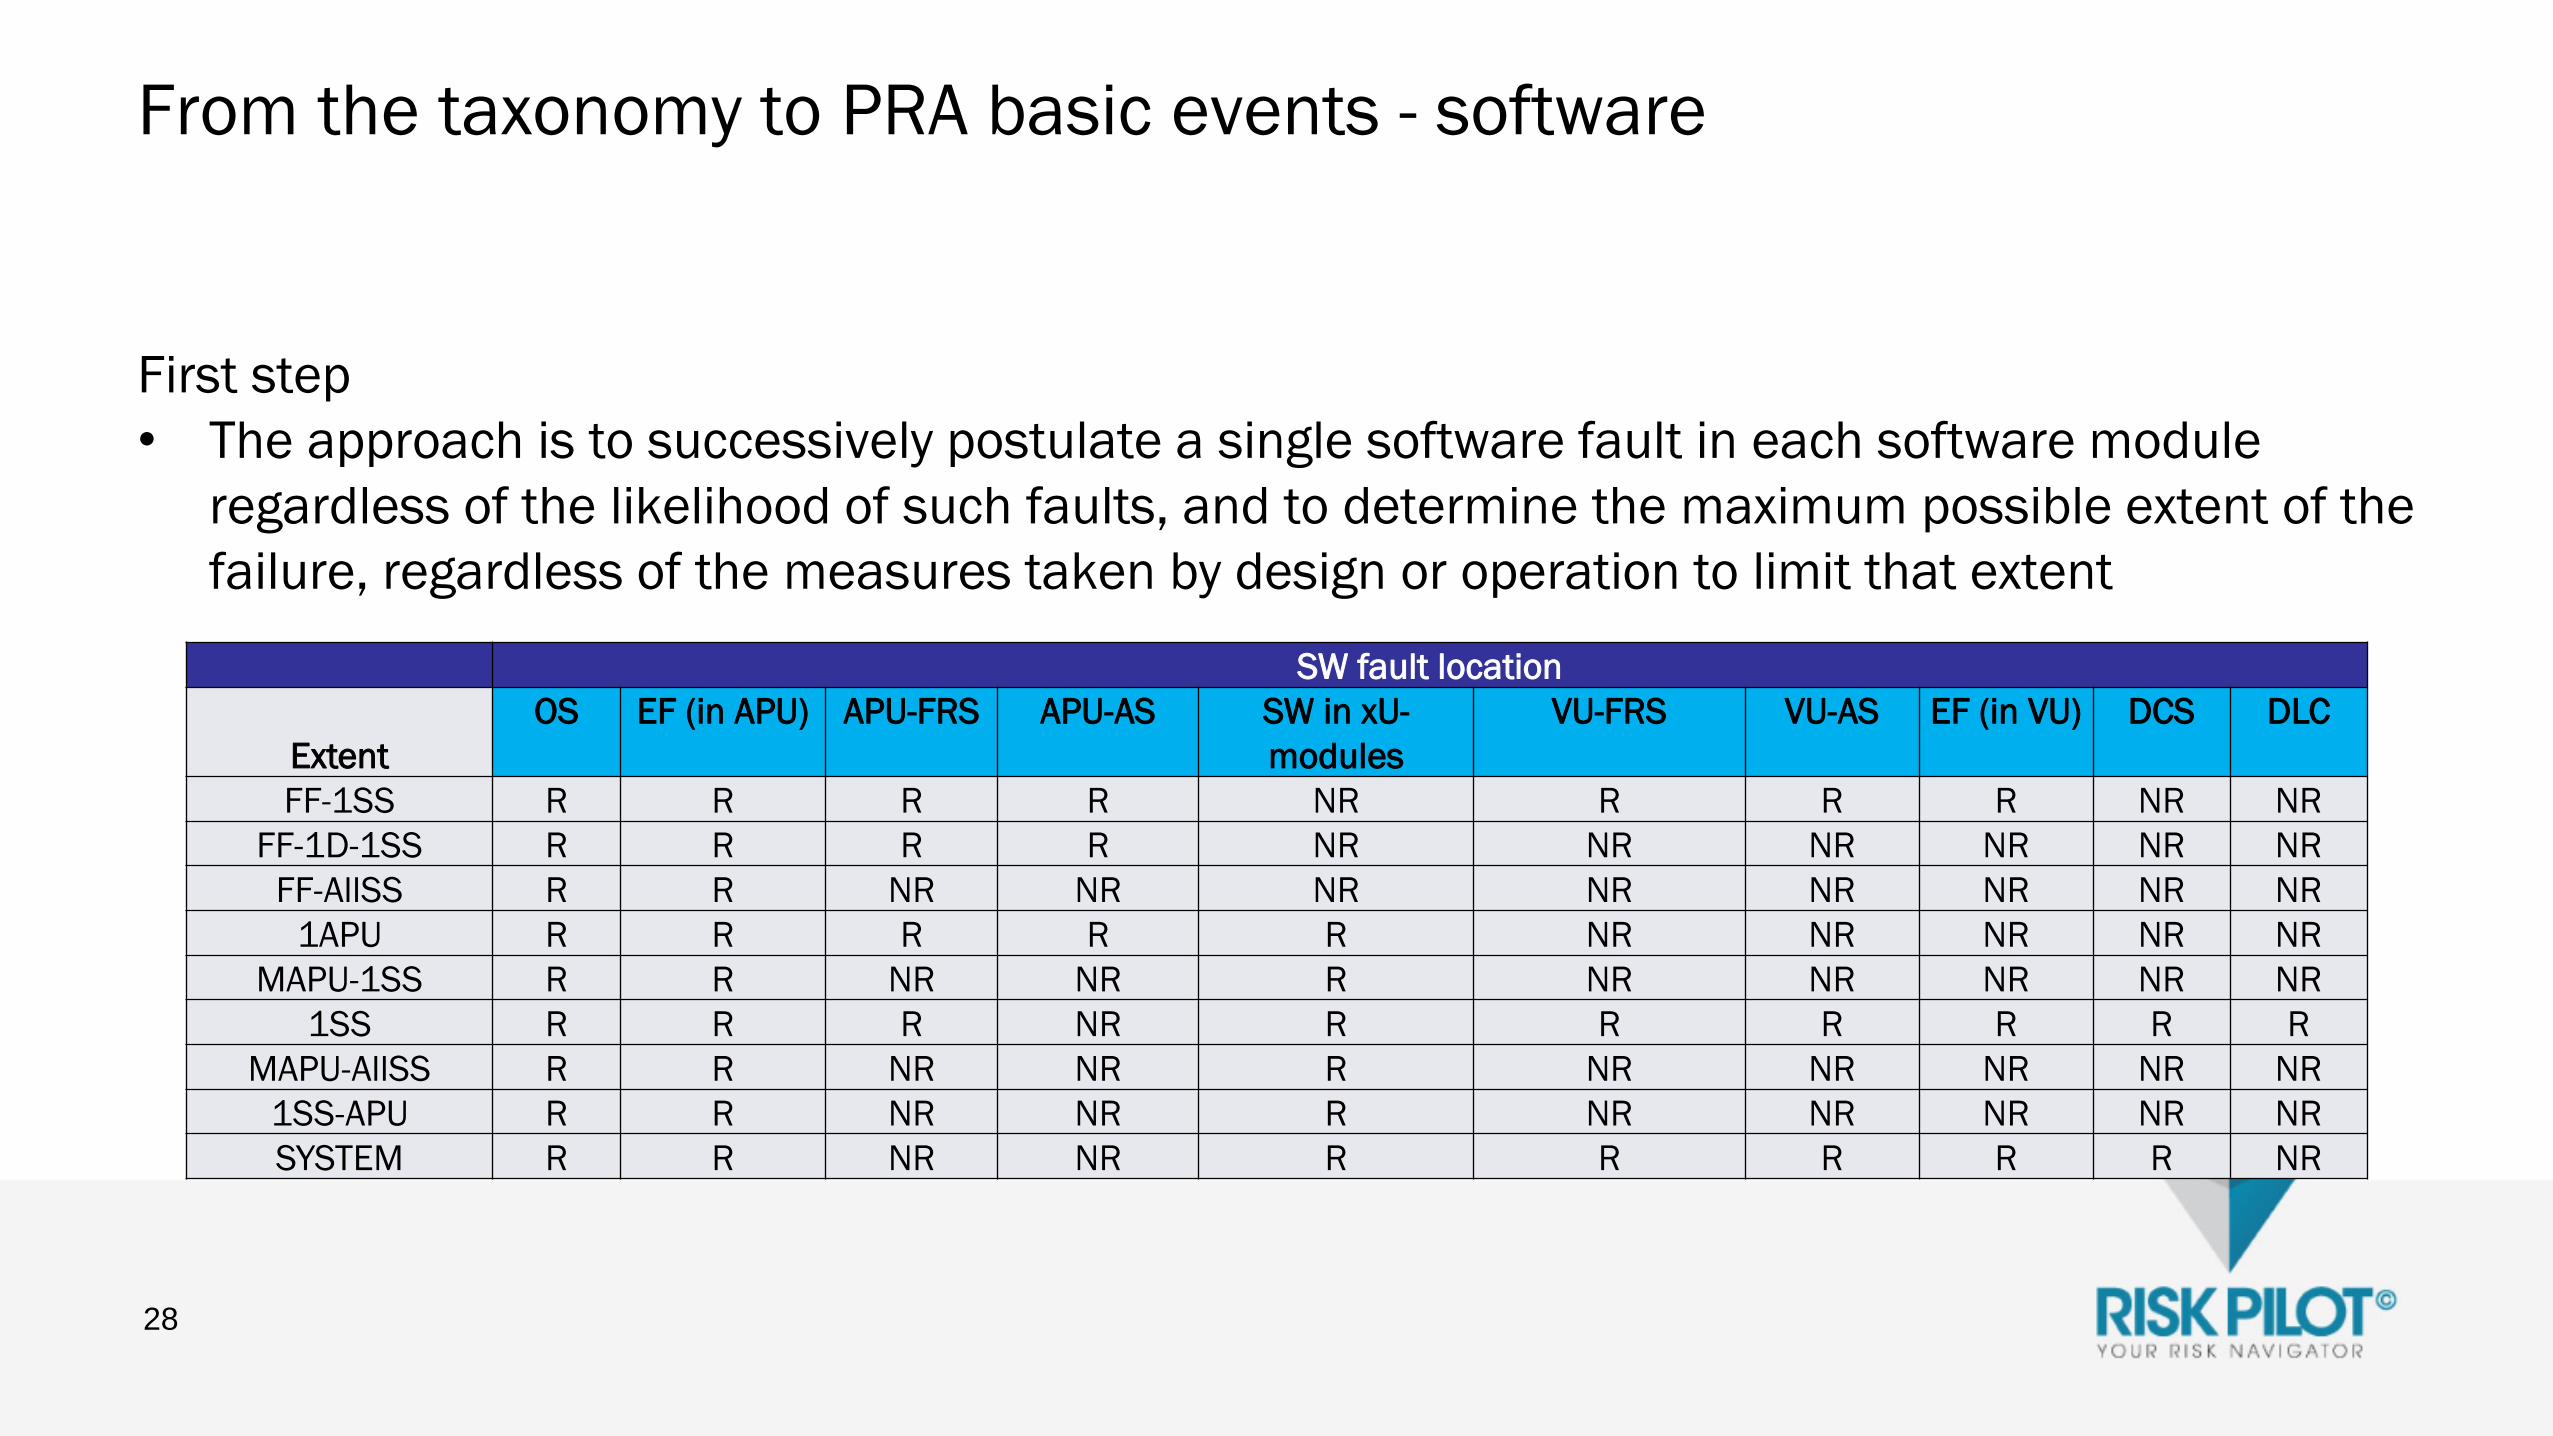
From the taxonomy to PRA basic events - software
First step
• The approach is to successively postulate a single software fault in each software module
regardless of the likelihood of such faults, and to determine the maximum possible extent of the
failure, regardless of the measures taken by design or operation to limit that extent
28
SW fault location
Extent
OS EF (in APU) APU-FRS APU-AS SW in xU-
modules
VU-FRS VU-AS EF (in VU) DCS DLC
FF-1SS R R R R NR R R R NR NR
FF-1D-1SS R R R R NR NR NR NR NR NR
FF-AllSS R R NR NR NR NR NR NR NR NR
1APU R R R R R NR NR NR NR NR
MAPU-1SS R R NR NR R NR NR NR NR NR
1SS R R R NR R R R R R R
MAPU-AllSS R R NR NR R NR NR NR NR NR
1SS-APU R R NR NR R NR NR NR NR NR
SYSTEM R R NR NR R R R R R NR

Software modules next steps
1. Hardware FMEA and FTs provide the structure into which software faults are ”added”
• I&C unit level failure modes are the same (effect of hardware resp. software module faults)
1. fatal failure causing loss of all I&C functions of the unit
2. non-fatal causing failure to actuation of an I&C function
3. spurious actuation of an I&C function
• ”CCF scope” may be different between HW and SW
2. Software module fault taxonomy including assessment of maximum/potential end effects
(previous slide)
• the key thing is to define which software faults and end effects are taken into account
• it is not practicable to include every ”R” element in the model (next slide)
29
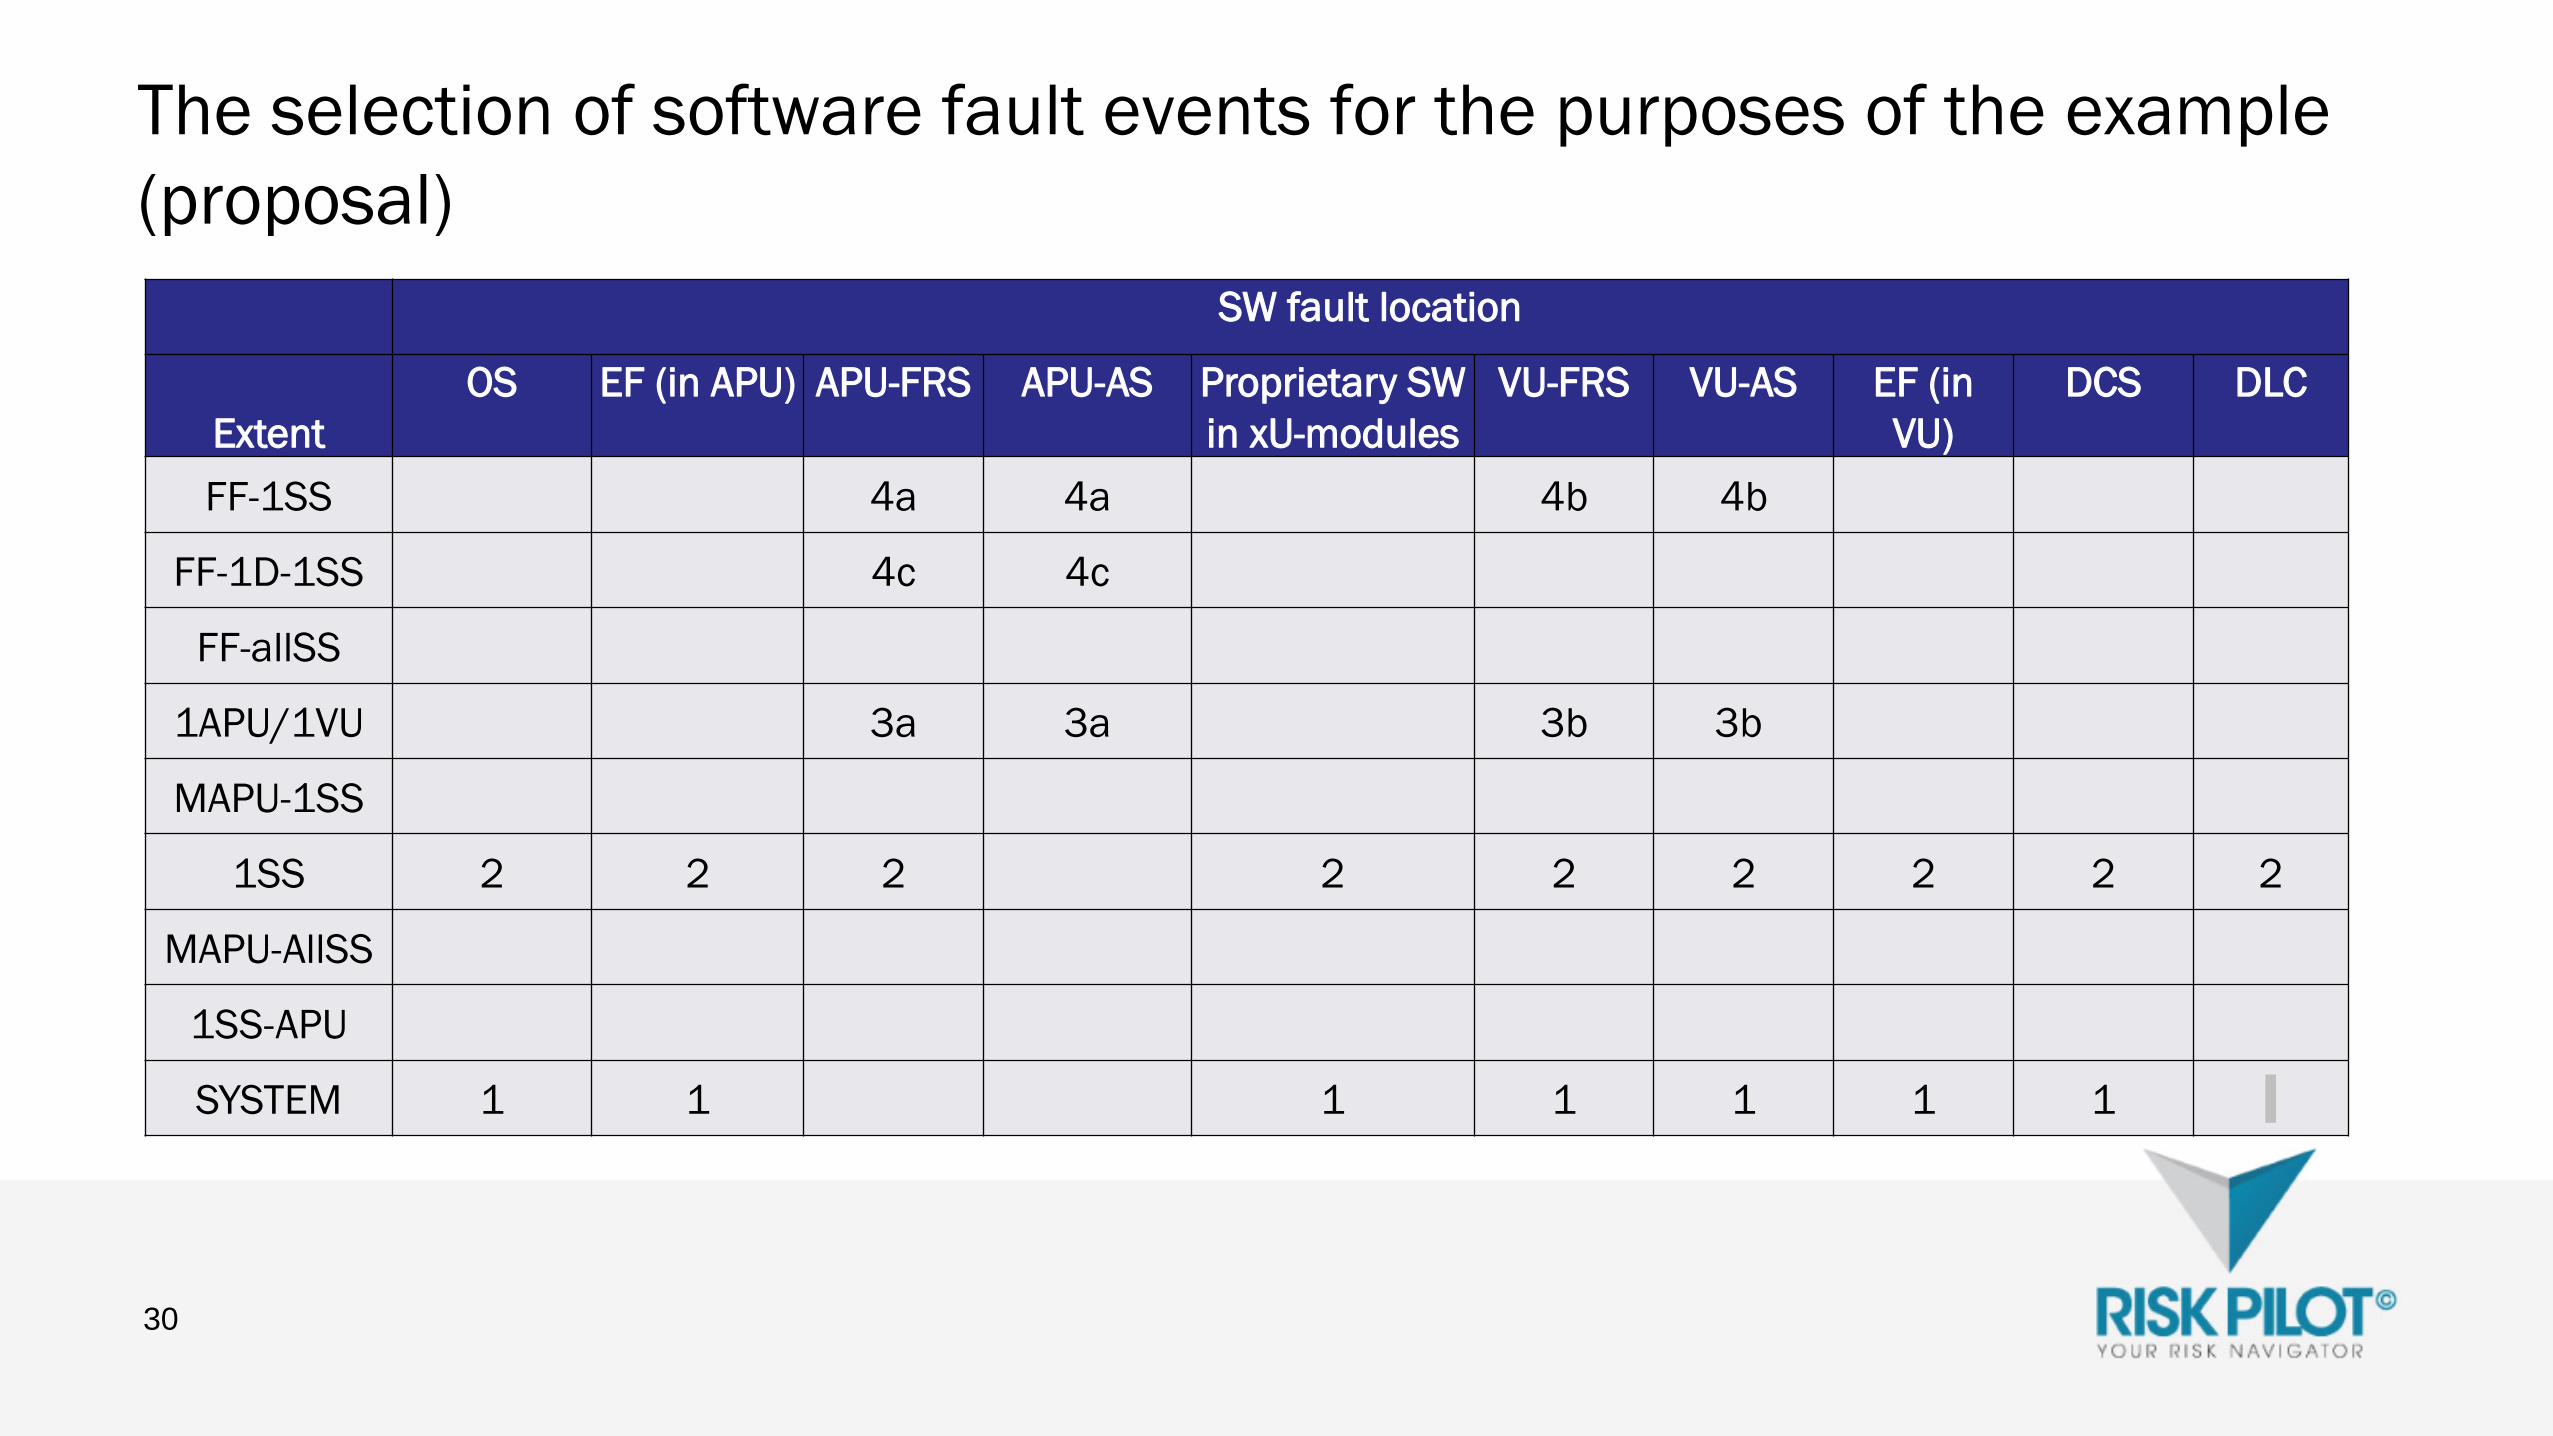
The selection of software fault events for the purposes of the example
(proposal)
30
SW fault location
Extent
OS EF (in APU) APU-FRS APU-AS Proprietary SW
in xU-modules
VU-FRS VU-AS EF (in
VU)
DCS DLC
FF-1SS 4a 4a 4b 4b
FF-1D-1SS 4c 4c
FF-allSS
1APU/1VU 3a 3a 3b 3b
MAPU-1SS
1SS 2 2 2 2 2 2 2 2 2
MAPU-AllSS
1SS-APU
SYSTEM 1 1 1 1 1 1 1

Next steps in the application of taxonomy in PRA
• SW failure modes and basic events to be further discussed in later presentations
• FT modelling also discussed in later presentations
31
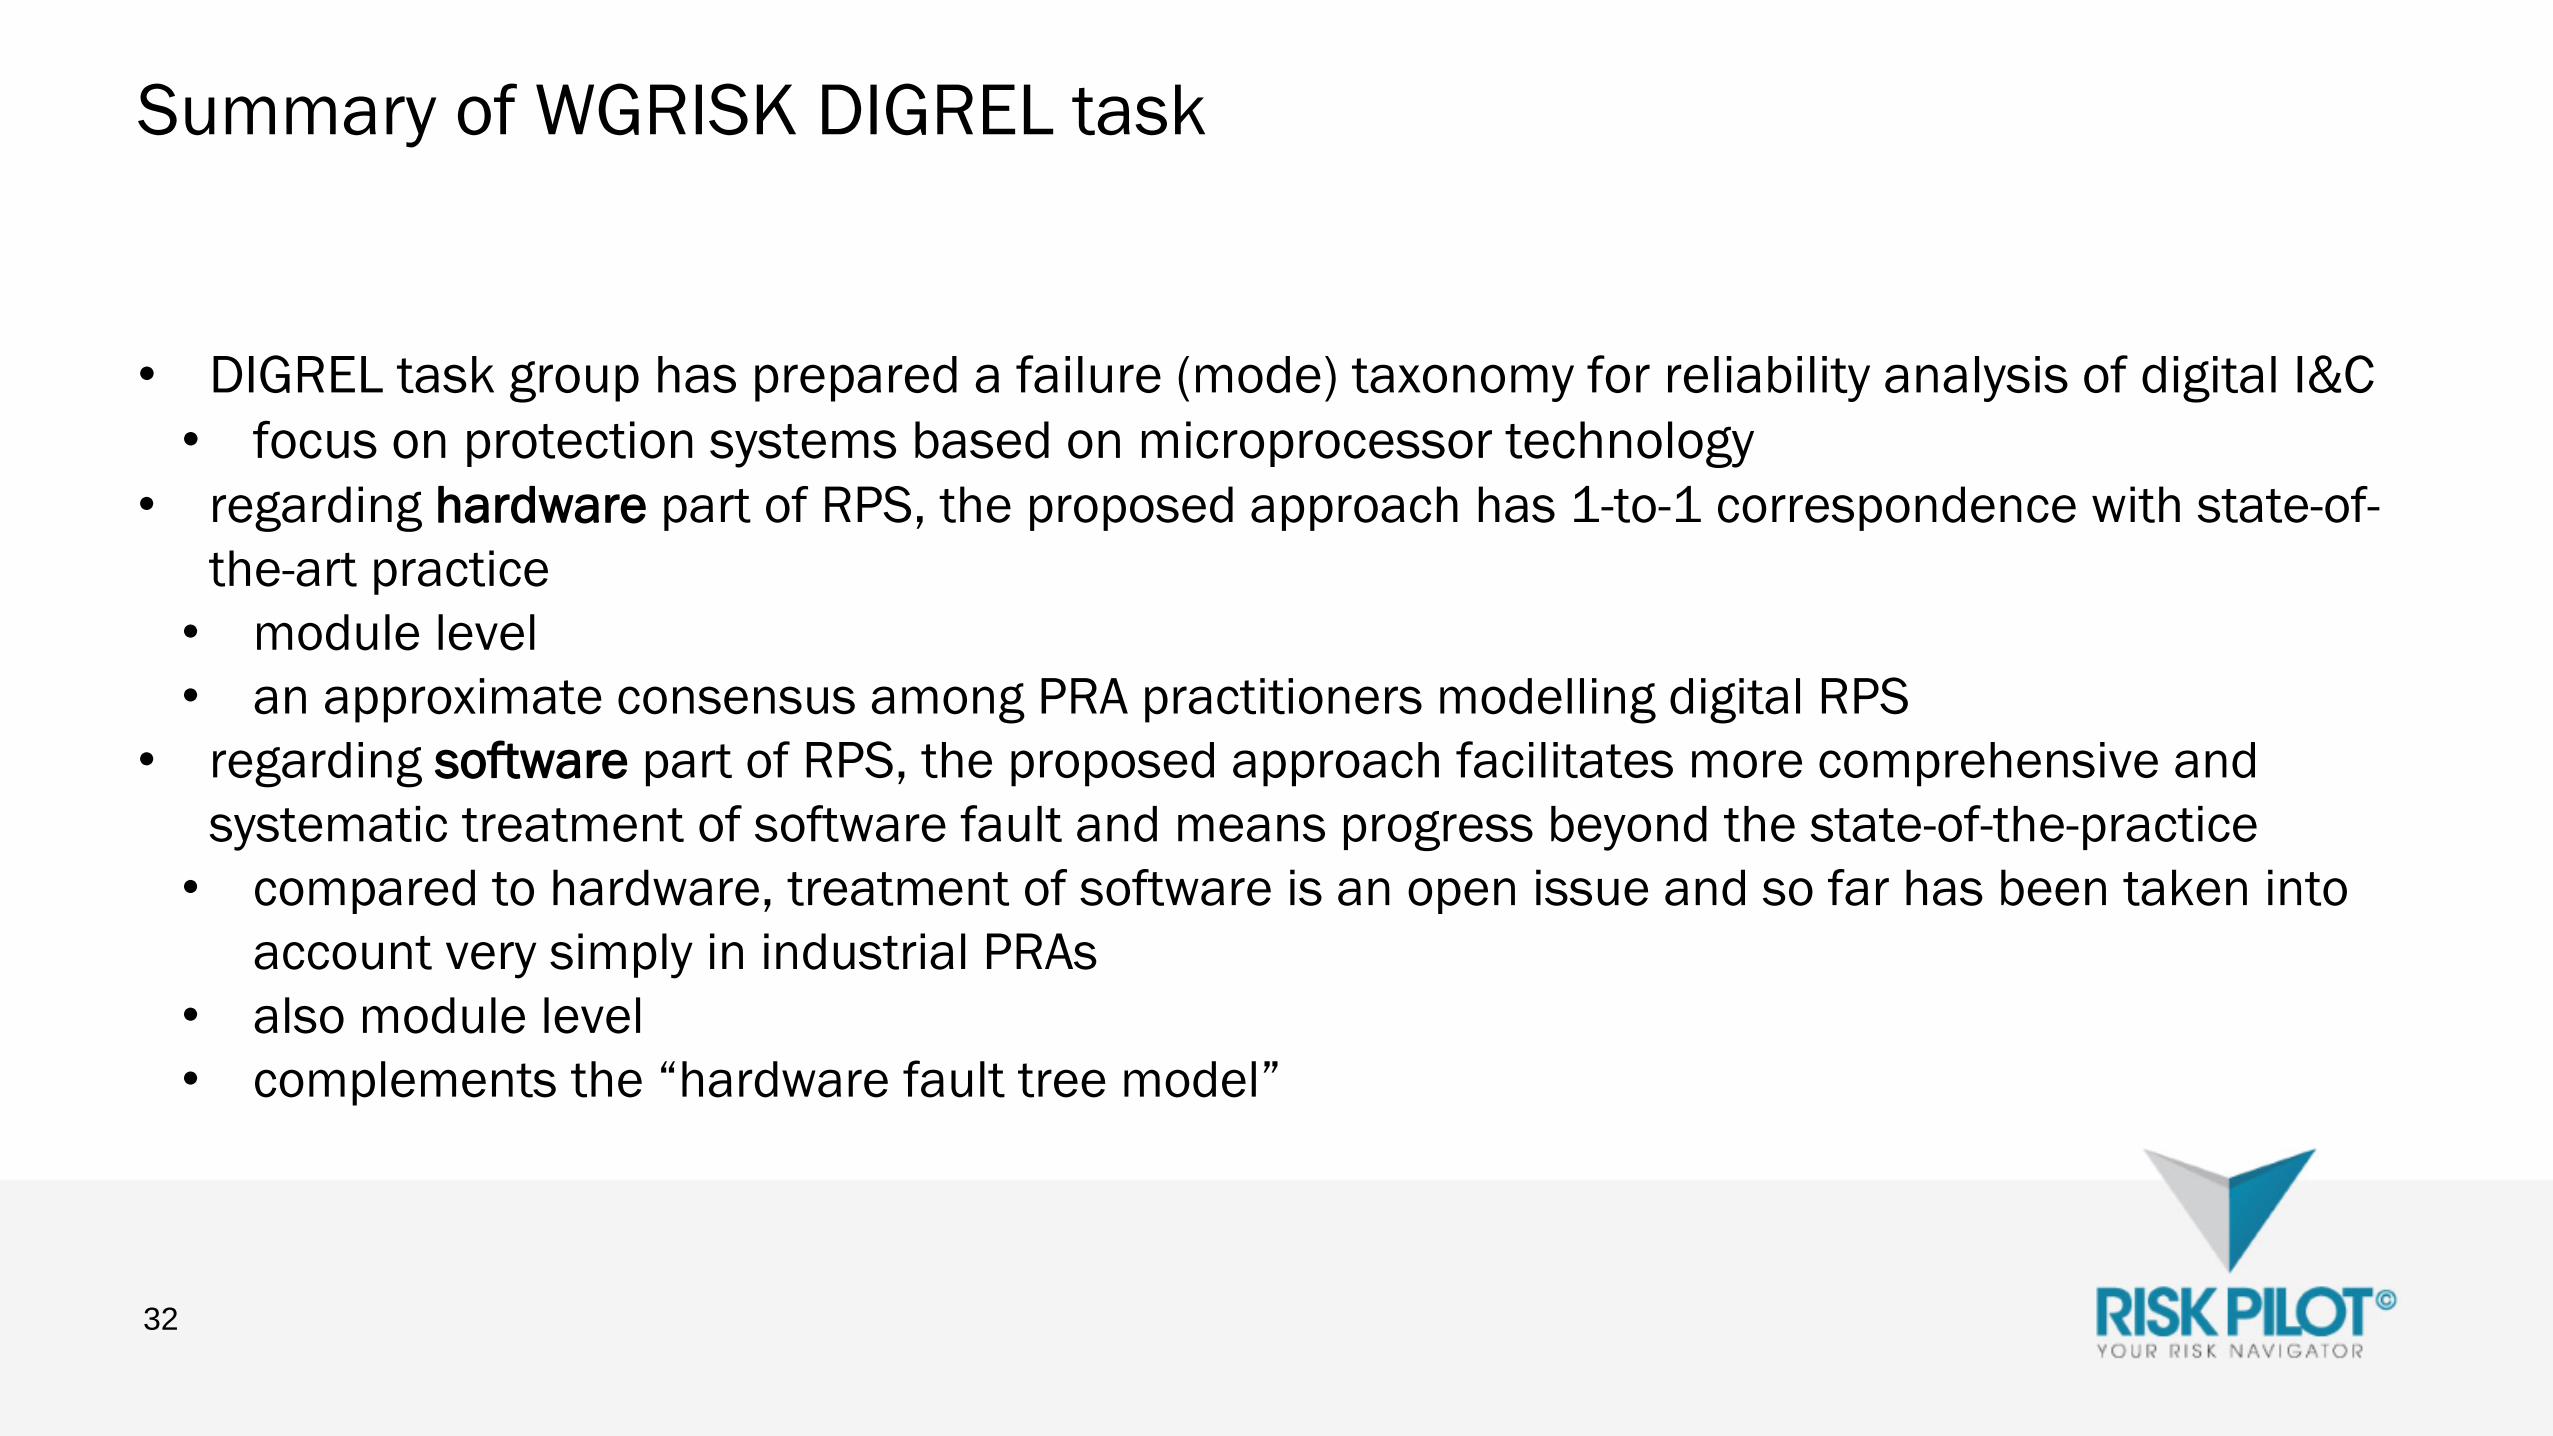
Summary of WGRISK DIGREL task
• DIGREL task group has prepared a failure (mode) taxonomy for reliability analysis of digital I&C
• focus on protection systems based on microprocessor technology
• regarding hardware part of RPS, the proposed approach has 1-to-1 correspondence with state-of-
the-art practice
• module level
• an approximate consensus among PRA practitioners modelling digital RPS
• regarding software part of RPS, the proposed approach facilitates more comprehensive and
systematic treatment of software fault and means progress beyond the state-of-the-practice
• compared to hardware, treatment of software is an open issue and so far has been taken into
account very simply in industrial PRAs
• also module level
• complements the “hardware fault tree model”
32


1
Jan-Erik Holmberg
DIGREL Nordic example model
DIGREL seminar, November 26, 2013, Espoo
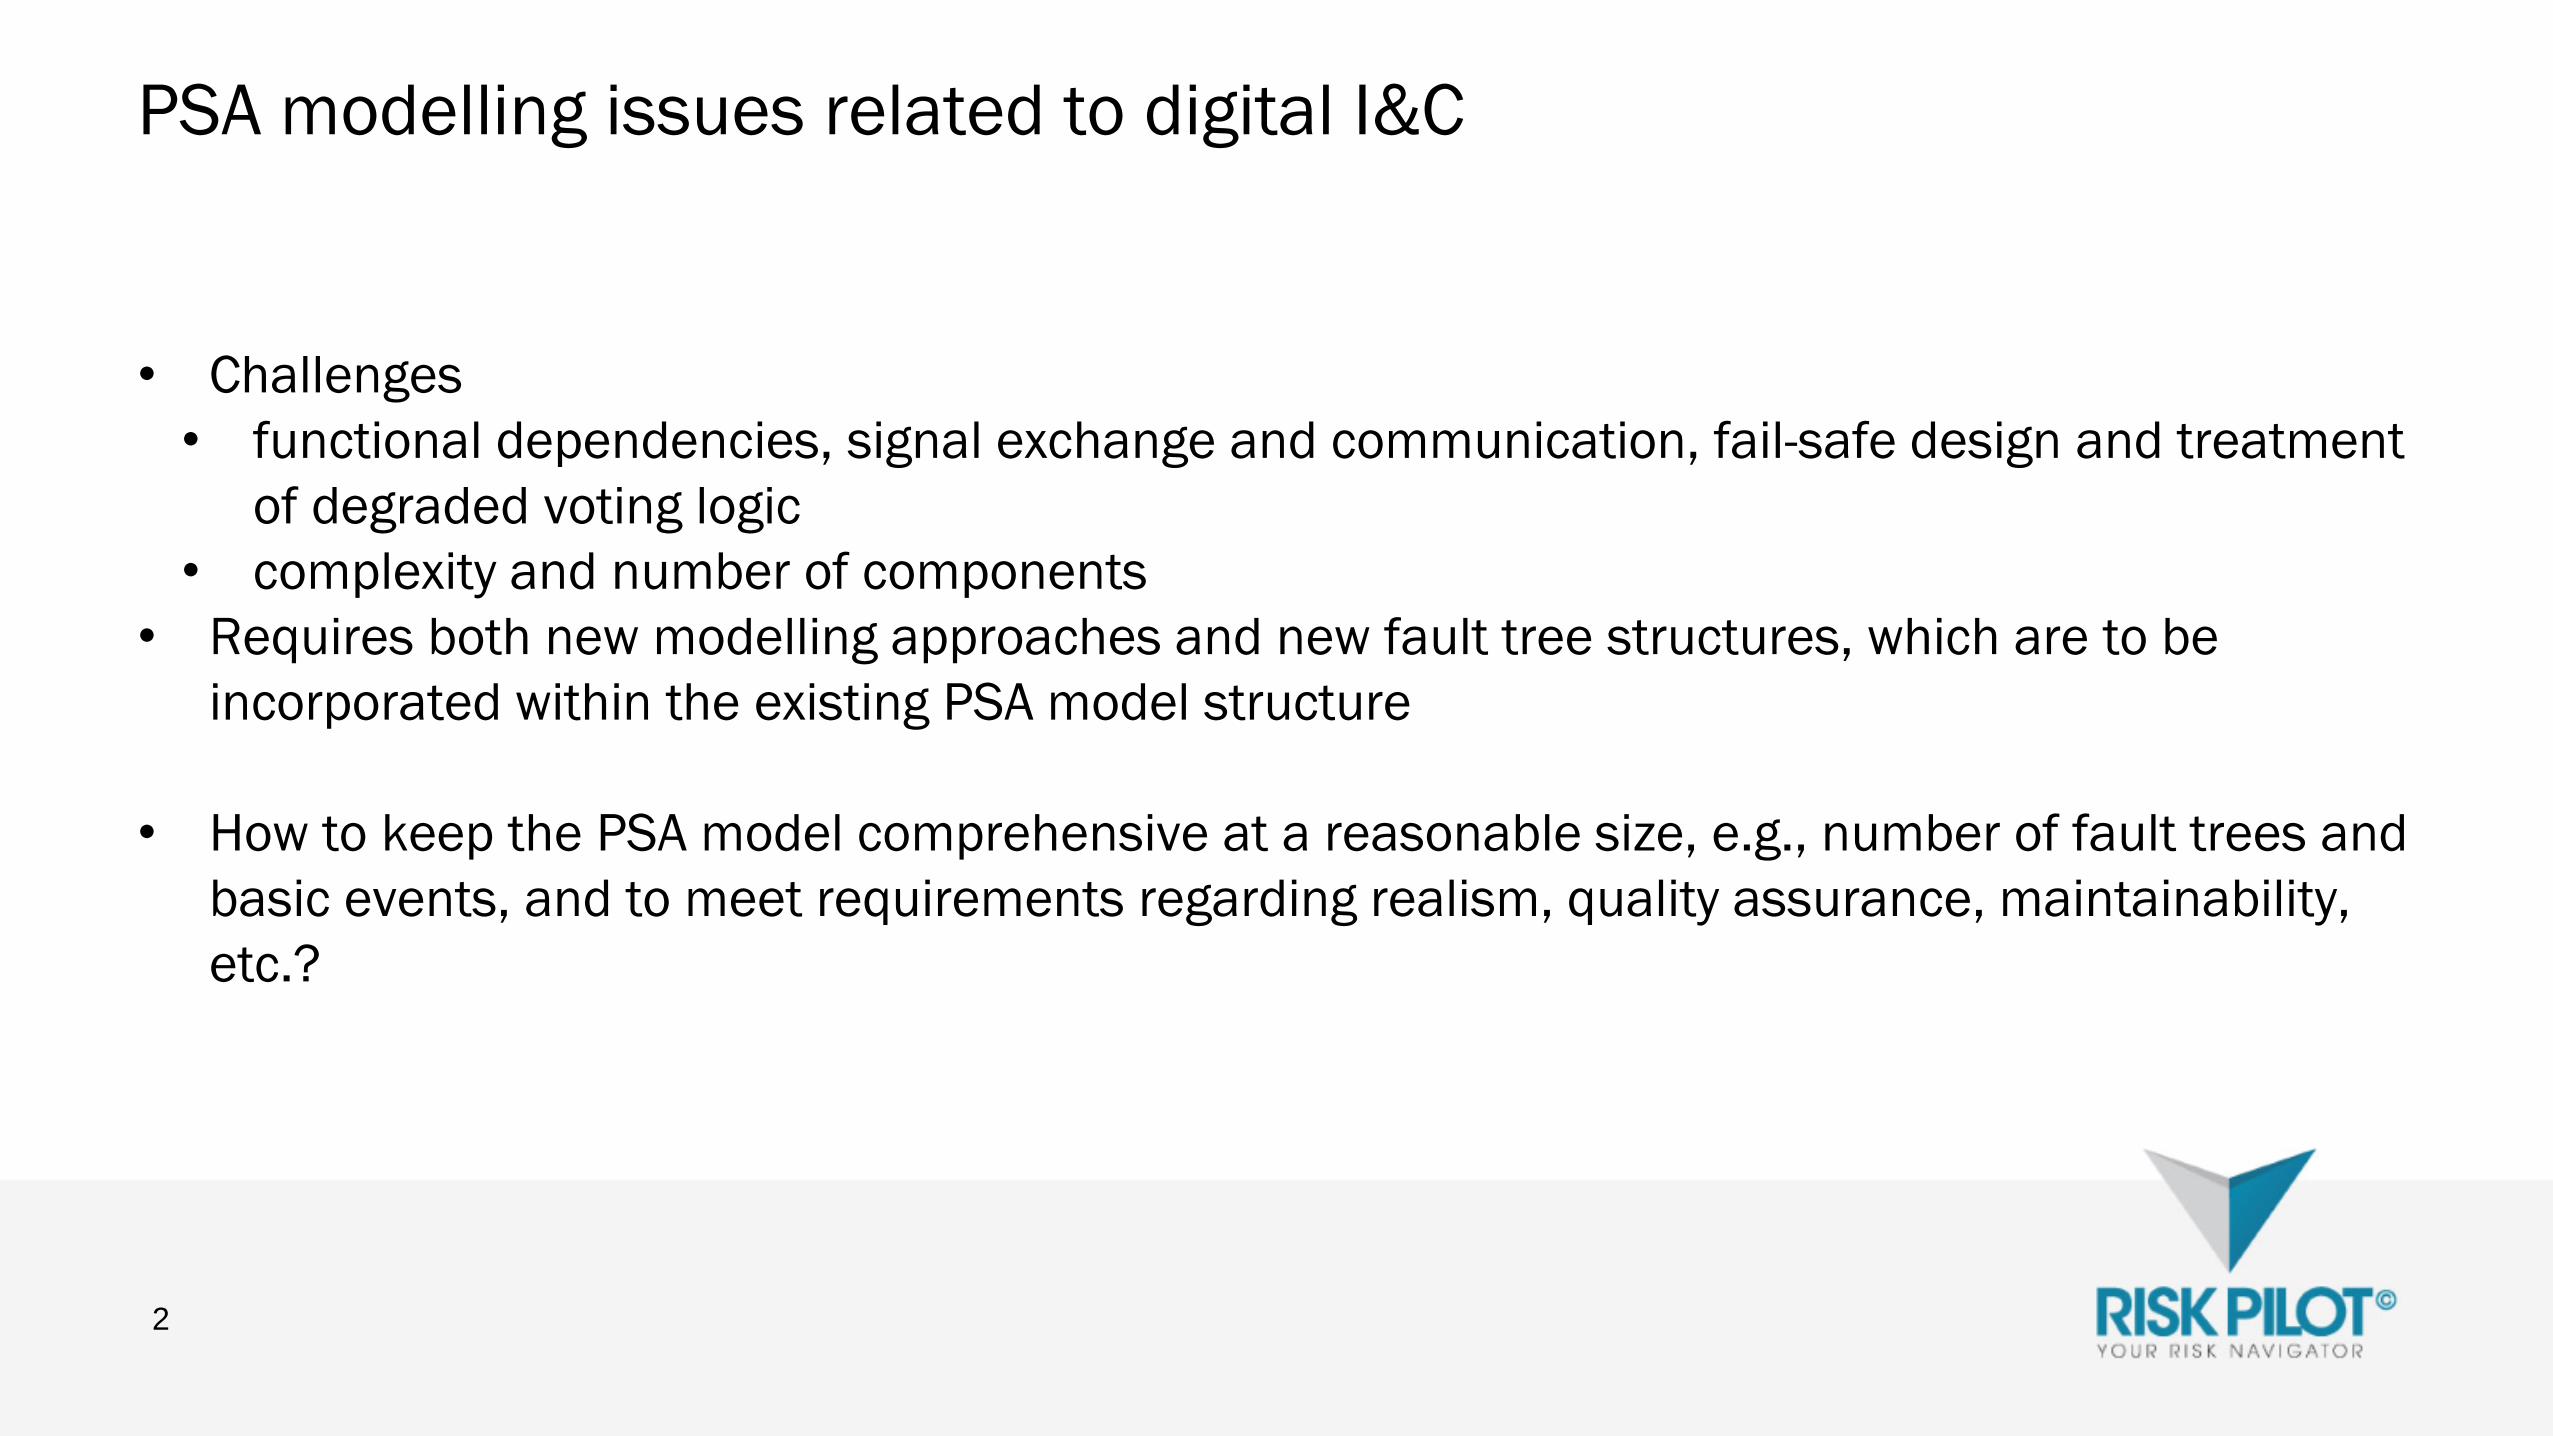
PSA modelling issues related to digital I&C
• Challenges
• functional dependencies, signal exchange and communication, fail-safe design and treatment
of degraded voting logic
• complexity and number of components
• Requires both new modelling approaches and new fault tree structures, which are to be
incorporated within the existing PSA model structure
• How to keep the PSA model comprehensive at a reasonable size, e.g., number of fault trees and
basic events, and to meet requirements regarding realism, quality assurance, maintainability,
etc.?
2
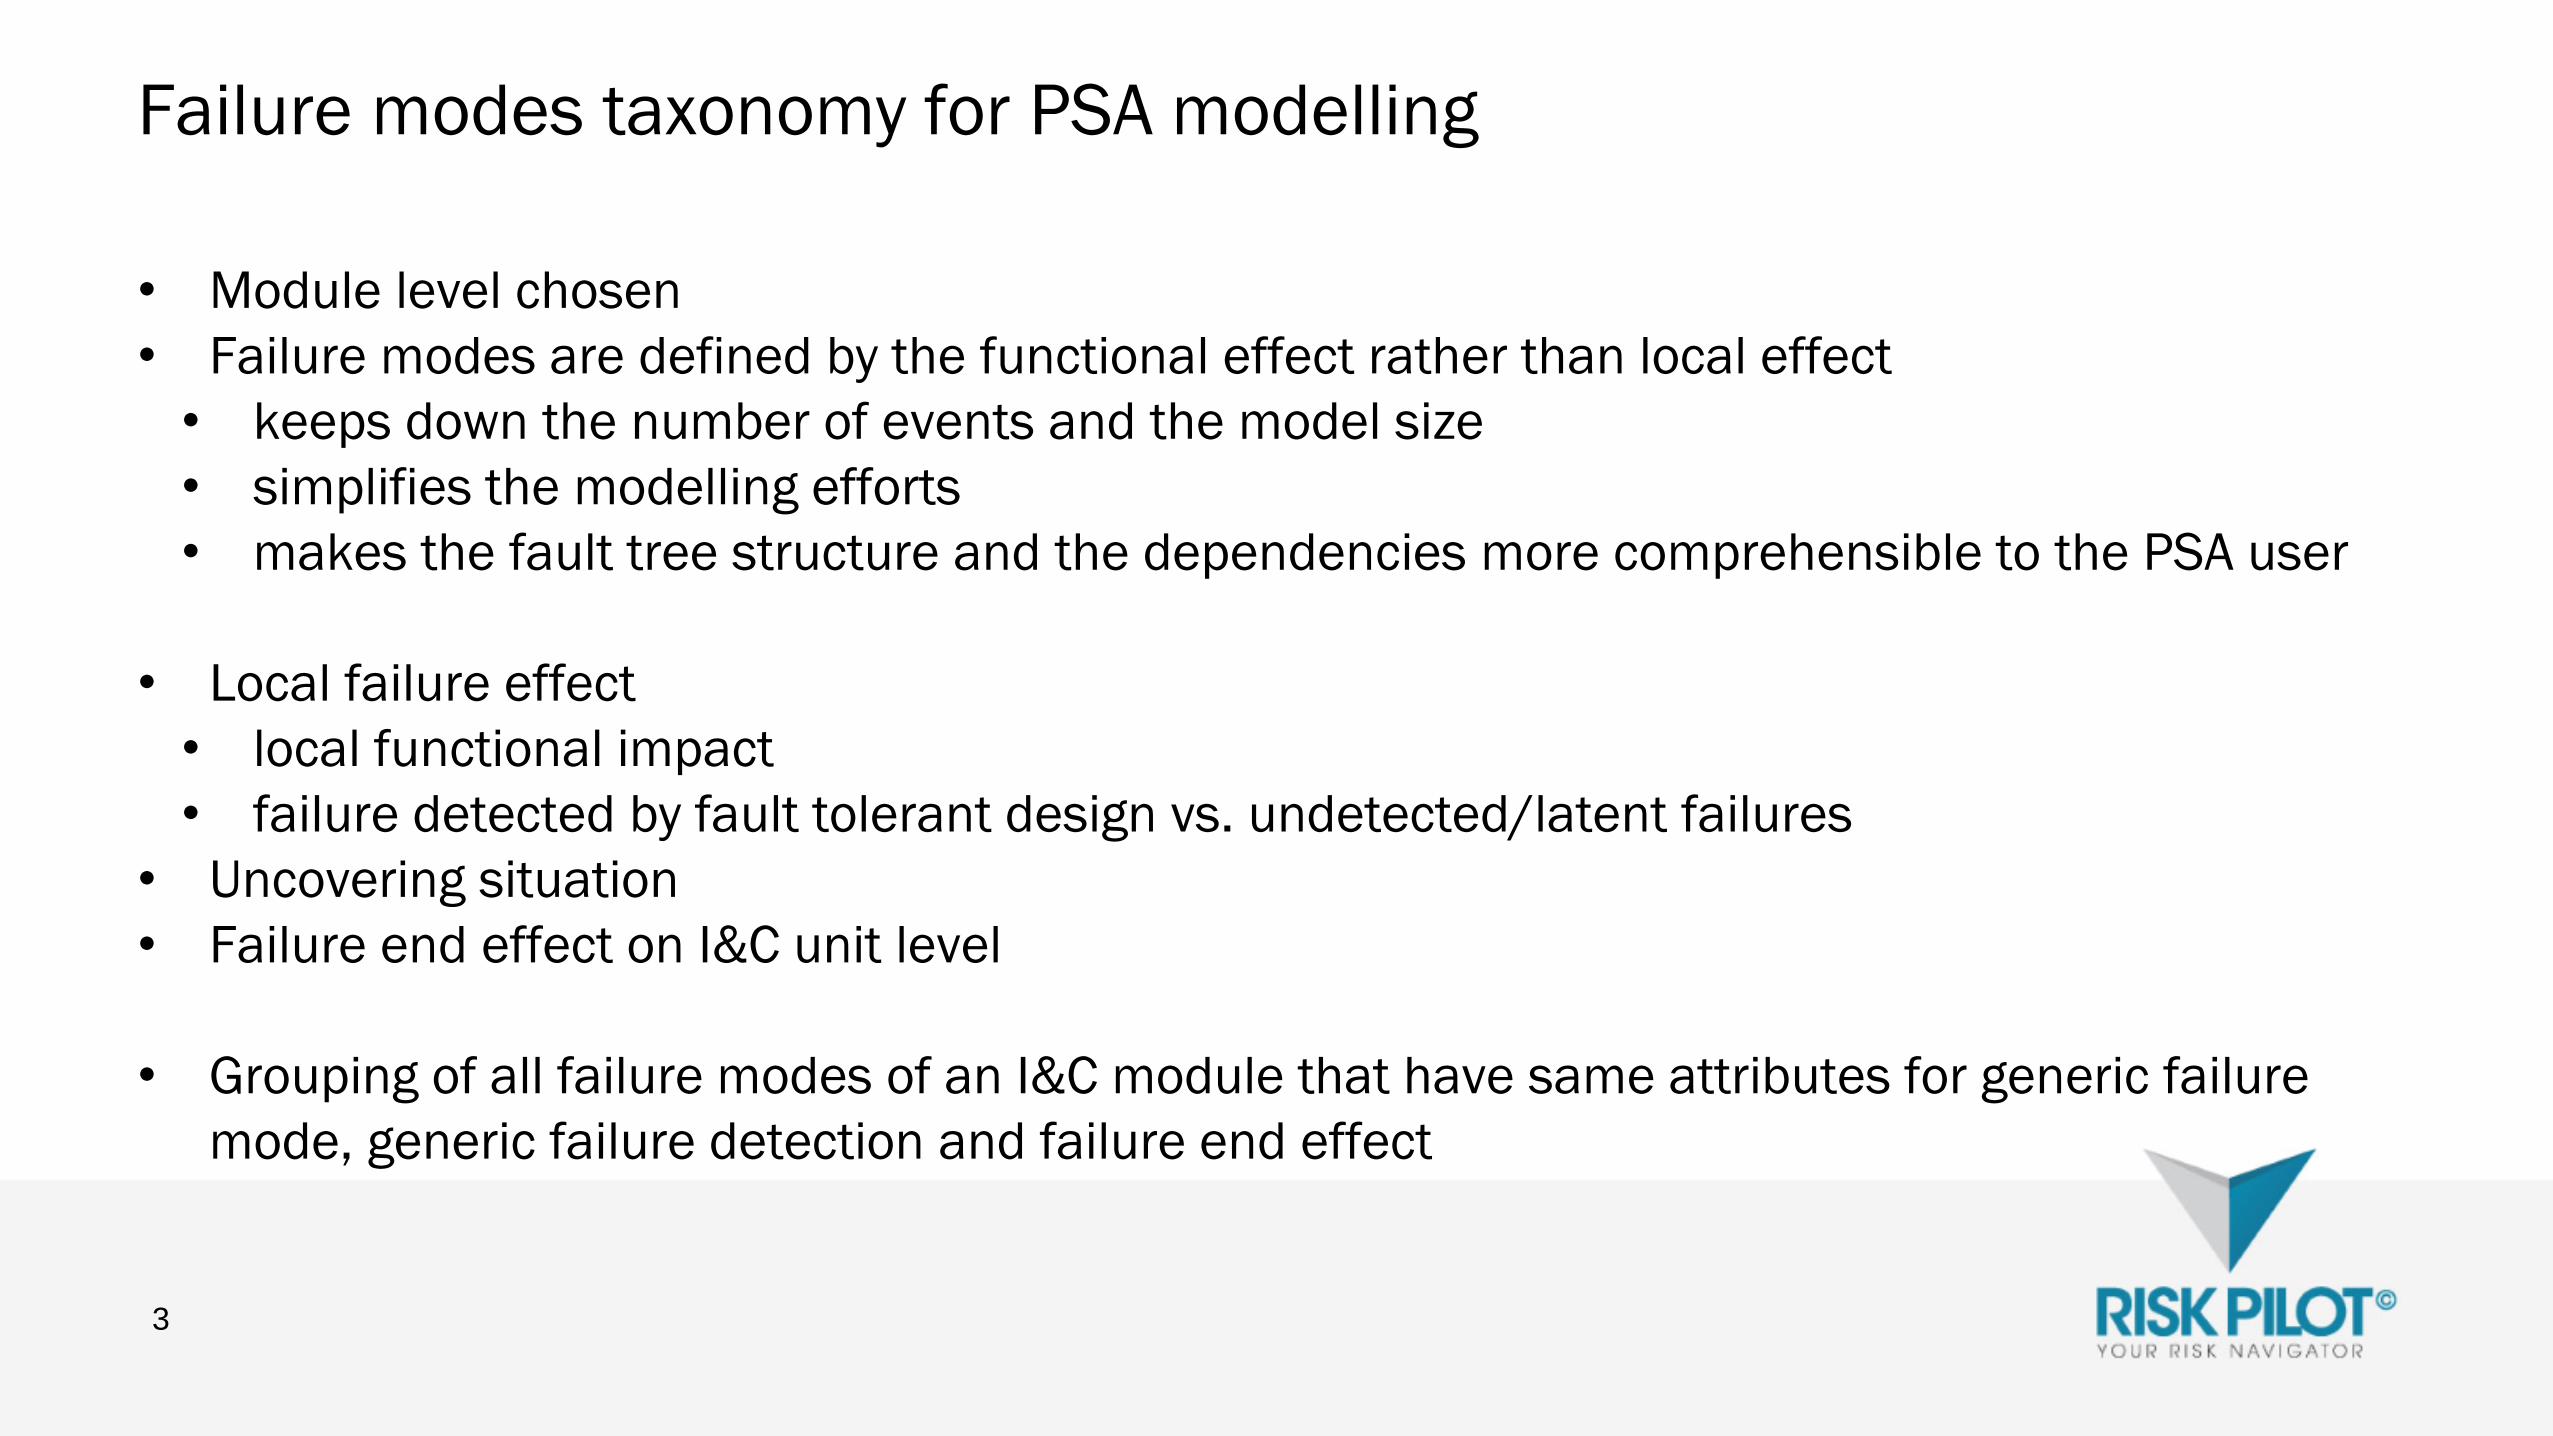
Failure modes taxonomy for PSA modelling
• Module level chosen
• Failure modes are defined by the functional effect rather than local effect
• keeps down the number of events and the model size
• simplifies the modelling efforts
• makes the fault tree structure and the dependencies more comprehensible to the PSA user
• Local failure effect
• local functional impact
• failure detected by fault tolerant design vs. undetected/latent failures
• Uncovering situation
• Failure end effect on I&C unit level
• Grouping of all failure modes of an I&C module that have same attributes for generic failure
mode, generic failure detection and failure end effect
3

Example Nuclear power plant
• Fictive boiling water reactor
• The protection system has two subsystems
• RPS (reactor protection system)
• DPS (diverse protection system)
• Diversification of safety functions the whole path from
sensors to actuators
• E.g., the emergency core cooling system (ECC) is
controlled by RPS and the emergency feedwater
system (EFW) is controlled by DPS
• RPS and DPS are designed with fault tolerant features
4

Example I&C architecture and hardware modules of an I&C unit
(APU/VU)
5
DPSRPS
Division 1
APU
A1
...
VU
B1
APU
B1
...
Division 2 Division 3 Division 4
... ... ...
VU
A1
Actuator ...
110 V
DC
Analog in Digital in
Signal conditioning
module, SCM
Analog input module,
AIM
Analog output module,
AOM
Digital output module,
DOM
Communi-
cation link
module,
COM
Bus
linkProcessor module, CPU
Subrack,
incl. power
supply
Digital input module,
DIM

Example PSA
• Developed in Risk Spectrum software (also FinPSA variant)
• Covers Digital I&C hardware failures and CCF:s at module level of detail
• Failure data and CCF parameters has been assigned acc. to state-of-practice, i.e. references
have been used when such exists, otherwise assumed based on “industry standard” and
engineering judgment
• Focus of the evaluation should be on dependencies rather than failure data
• Digital I&C model statistics (2013 January version):
• 500 Fault Trees, 360 Basic Events, 90 CCF groups
6
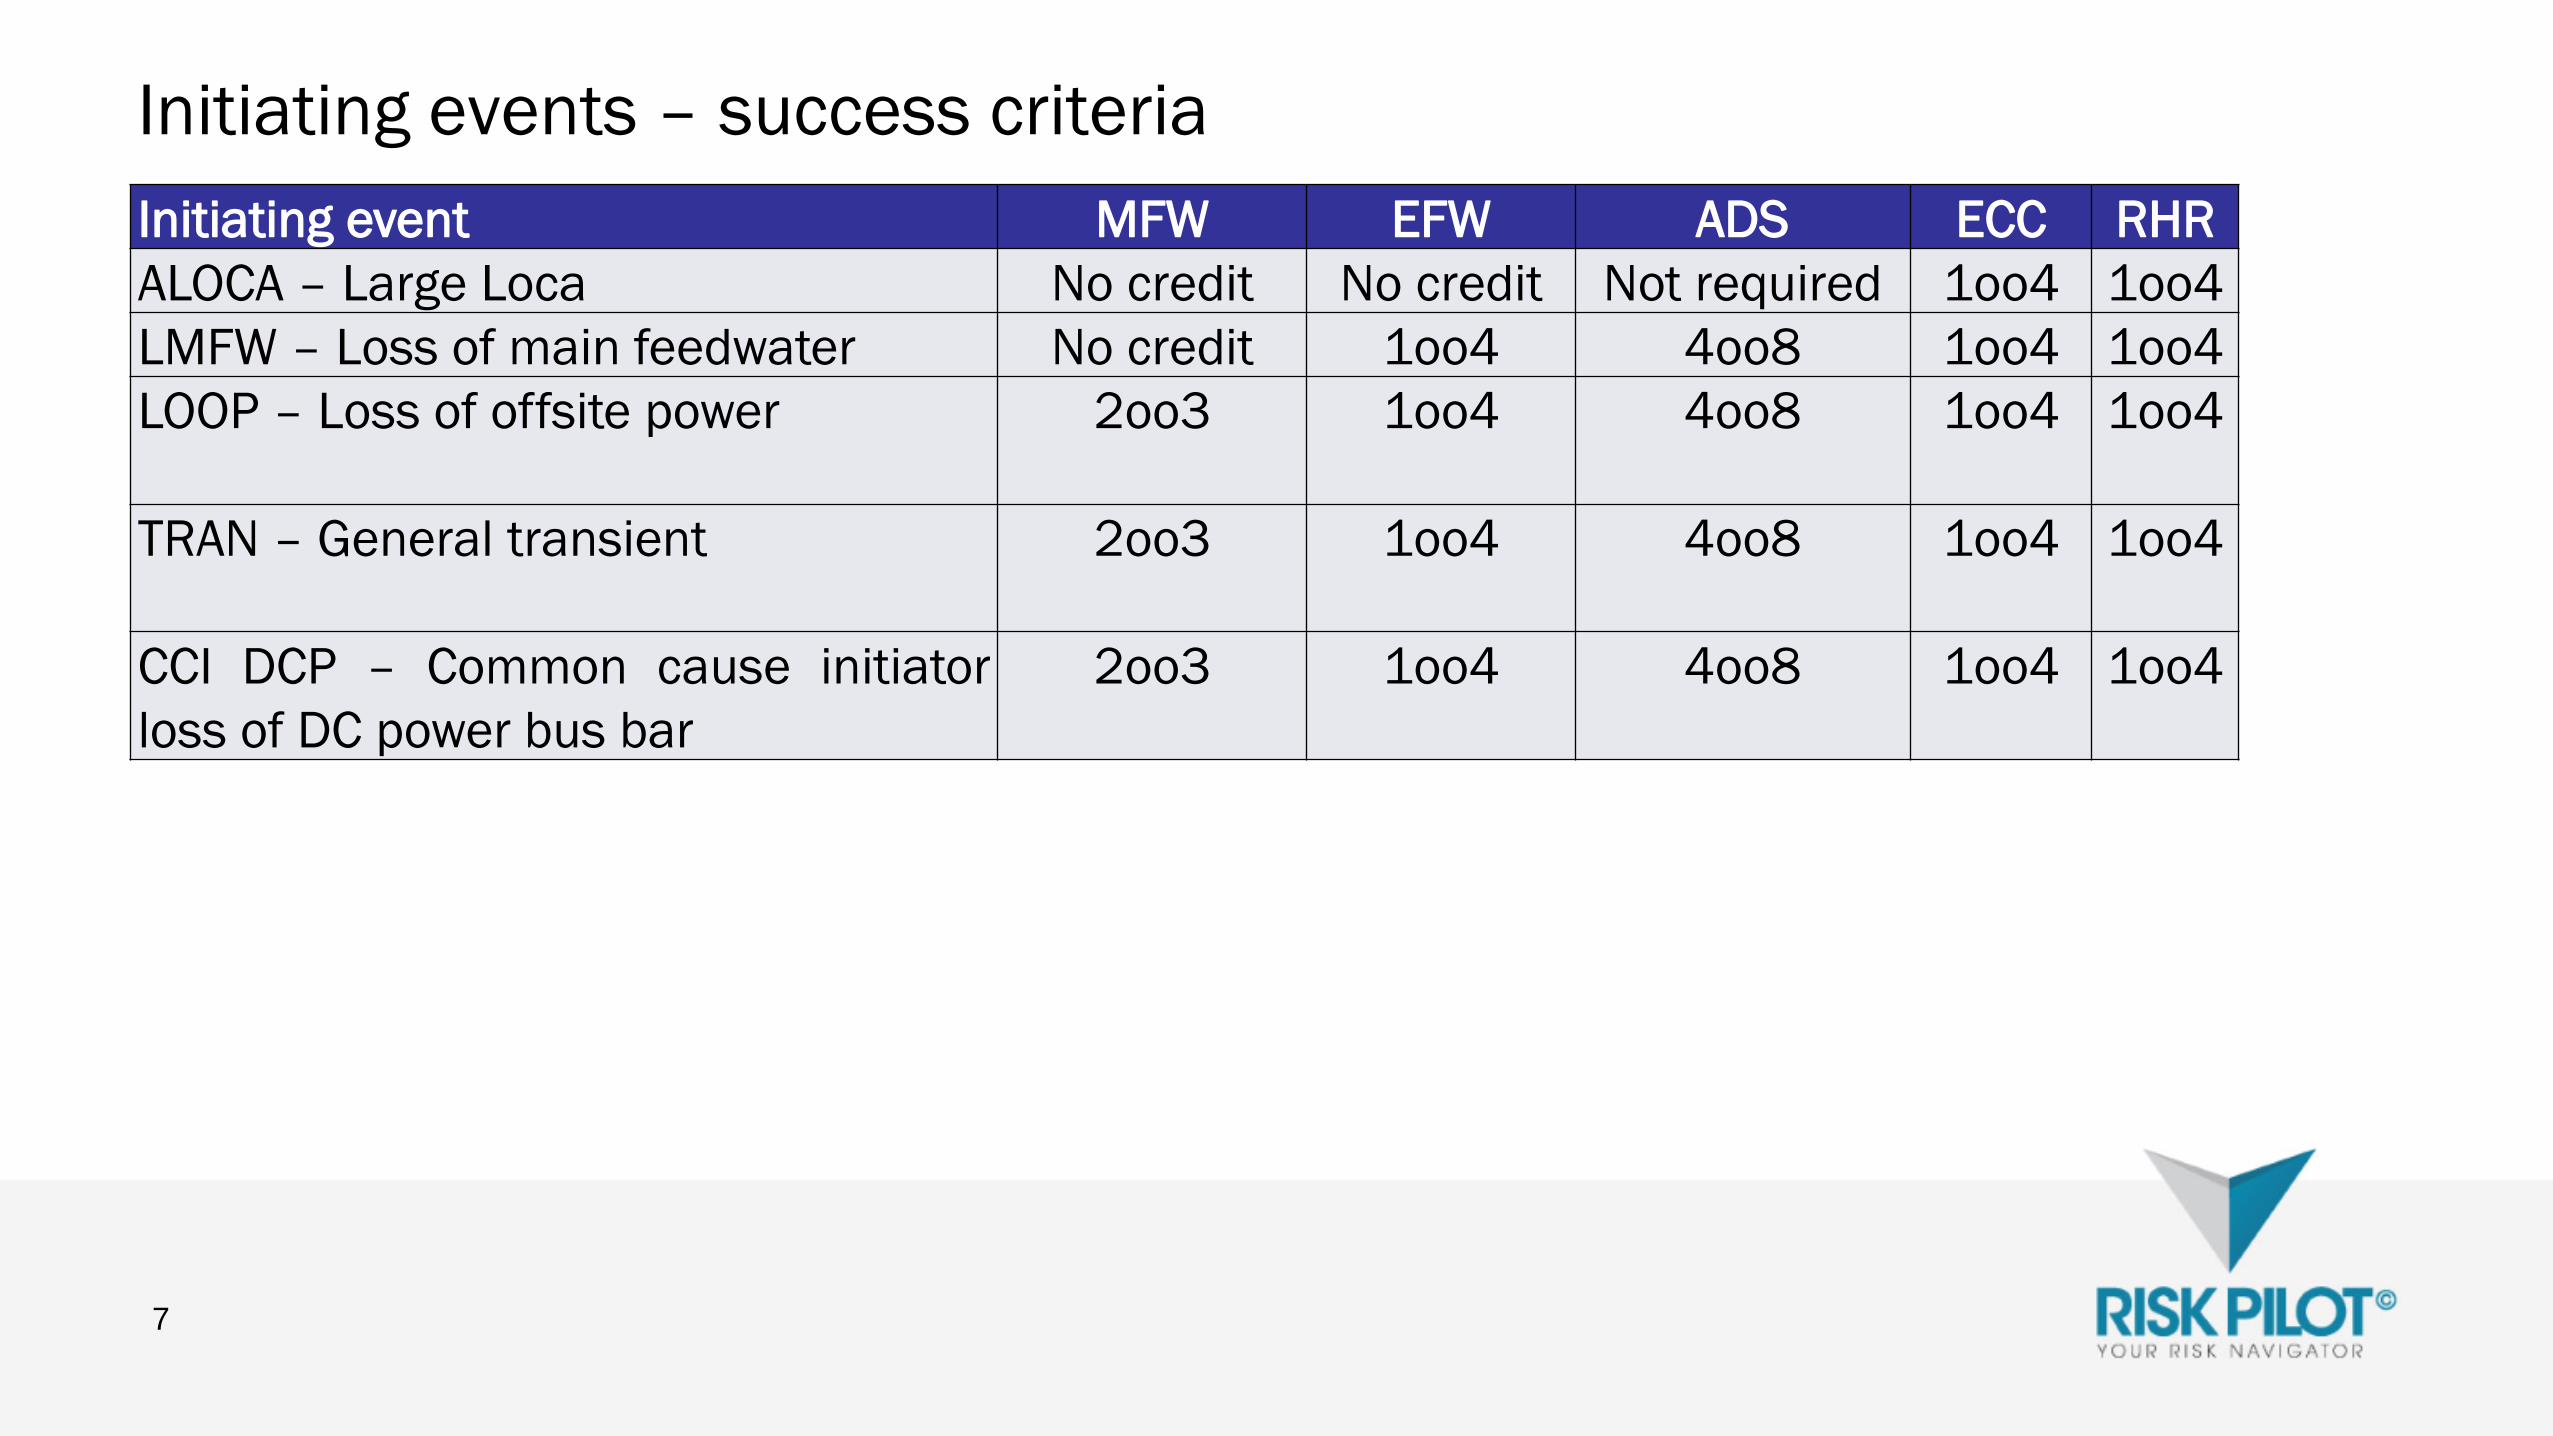
Initiating events – success criteria
7
Initiating event MFW EFW ADS ECC RHR
ALOCA – Large Loca No credit No credit Not required 1oo4 1oo4
LMFW – Loss of main feedwater No credit 1oo4 4oo8 1oo4 1oo4
LOOP – Loss of offsite power 2oo3 1oo4 4oo8 1oo4 1oo4
TRAN – General transient 2oo3 1oo4 4oo8 1oo4 1oo4
CCI DCP – Common cause initiator
loss of DC power bus bar
2oo3 1oo4 4oo8 1oo4 1oo4

Actuators and actuation signals (EFW and ECC)
8
System Actuator Control Condition for control type VU Signal ID APU Signal ID DFLT
ECC Pump Start Containment isolation and no water leakage in the
respective pump room
RECC1 NOT(RH00i) *
RI000
0
Stop Water leakage in the respective pump room RECC2 RH00i 0
ECC Motor-
operated
valve
Open Containment isolation and no water leakage in the
respective pump room
RECC1 NOT(RH00i) *
RI000
0
Close Water leakage in the respective pump room RECC2 RH00i 0
EFW Pump Start Feedwater system isolation, reactor scram due to
low water level in reactor or containment isolation
and no water leakage in the respective pump room
DEFW1 NOT(DH00i) *
(DM000 + DSS04
+ DI000)
0
Stop Water leakage in the respective pump room DEFW2 DH00i 1
EFW Motor-
operated
valve
Open Reactor scram due to low water level in reactor,
diverse low water level condition or very low water
level condition and no water leakage in the
respective pump room
DEFW3 NOT(DH00i) *
(DSS04 + DX001
+ DI002)
0
Close Water leakage in the respective pump room or very
high water level in reactor
DEFW4 DH00i + DSS05 1

RPS and DPS safety functions
9
Signal Description Condition DFLT
RPS
RH00i Isolation of the ECC pump room i ECCi0CL001-H1 + ECCi0CL002-H1 1
RI000 Containment isolation 2/4*(RI002-i + RI005-i) 1
RI002 Containment isolation due to extremly low level in RPV 2/4*(RPVi0CL002-L4) 1
RI005 Isolation due to high pressure in containment 2/4*(RCOi0CP001-H1) 1
RM000 Feedwater isolation 2/4*(RM005-i) 1
RM005 Feedwater isolation due to high temperature in feedwater system compartment 2/4*(MFWi0CT001-H1) 1
RSS00 Reactor scram 2/4*(RSS04-i + SS05-i + SS12-i + SS13-i) 1
RSS04 Reactor scram due to low water level in RPV 2/4*(RPVi0CL001-L2) 1
RSS05 Reactor scram due to high water level in RPV 2/4*(RPVi0CL001-H2) 1
RSS12 Reactor scram due to containment isolation (I- or M-isolation) 2/4*(RI000-i + RM000-i) 1
RSS13 Low pressure before feedwater pump 2/4*(MFWi0CP001-L1) 1
RTB00 Depressurisation of the primary circuit RTB01 * RTB02 0
RTB01 Depressurisation of the primary circuit condition 1: extreme low level in reactor (same as
I002)
2/4*(RPVi0CL002-L4) 0
RTB02 Depressurisation of the primary circuit condition 2: high pressure in containment (same as
I005) or manual actuation
RTB03 + 2/4*(RCOi0CP001-H1) 0
RTB03 Manual TB MAN-TB 0
RX003 High temperature in condensation pool 2/4*(RCOi0CT001-H1) 1
RZ00i Low voltage in AC bus bar i ACPi0CE001-L1 1
DPS
DH00i Isolation of the EFW pump room i EFWi0CL001-H1 + EFWi0CL002-H1 1
DI000 Containment isolation 2/4*(DI002-i + DI005-i) 1
DI002 Containment isolation due to extremly low level in RPV 2/4*(RPVi0CL002-L4) 1
DI005 Isolation due to high pressure in containment 2/4*(RCOi0CP001-H1) 1
DSS00 Reactor scram 2/4*(DSS04-i + SS05-i + SS12-i + SS13-i) 1
DSS04 Reactor scram due to low water level in RPV 2/4*(RPVi0CL001-L2) 1
DSS05 Reactor scram due to high water level in RPV 2/4*(RPVi0CL001-H2) 1
DSS12 Reactor scram due to containment isolation (I- or M-isolation) 2/4*(DI000-i + DM000-i) 1
DX001 Extra low level in RPV 2/4*(RPVi0CL002-L3) 1
DZ00i Low voltage in AC bus bar i ACPi0CE001-L1 1

Measurements
10
Measurement Component ID Limit Purpose RPS DPS
RPV water level, fine
level
RPVi1CL001 L2 Low level Core cooling protection RSS04
RPVi2CL001 H2 Extra high level RPV overfilling protection DSS05
RPVi2CL001 L2 Low level Core cooling protection DSS04
RPV water level, coarse
level
RPVi1CL002 L4 Extremly low level Core cooling protection RI002
RTB01
RPVi2CL002 L3 Extra low level Core cooling protection DX001
RPVi2CL002 L4 Extremly low level Core cooling protection DI002
Feedwater system
pump suction pressure
MFWi0CP001 L1 Low pressure before feedwater pump Loss of feedwater supervision DSS13
Feedwater system
room temperature
MFWi0CT001 H1 High room temperature Leakage supervision DM005
Containment pressure RCOi1CP001 H1 High pressure in containment Leakage supervision RI005
RTB02
RCOi2CP001 H1 High pressure in containment Leakage supervision DI005
Condensation pool
temperature
RCOi0CT001 H1 High temperature in condensation
pool
Residual heat removal RX003
Water level in the ECC
pump room
ECCi0CL001 H1 Water on the floor Leakage supervision RH00i
Water level in the EFW
pump room
EFWi0CL001 H1 Water on the floor Leakage supervision DH00i
AC power voltage bus
bar ACP-i
ACPi1CE001 L1 Low voltage on bus bar ACP-i Loss of offsite power supervision RZ00i
ACPi2CE001 L1 Low voltage on bus bar ACP-i Loss of offsite power supervision DZ00i
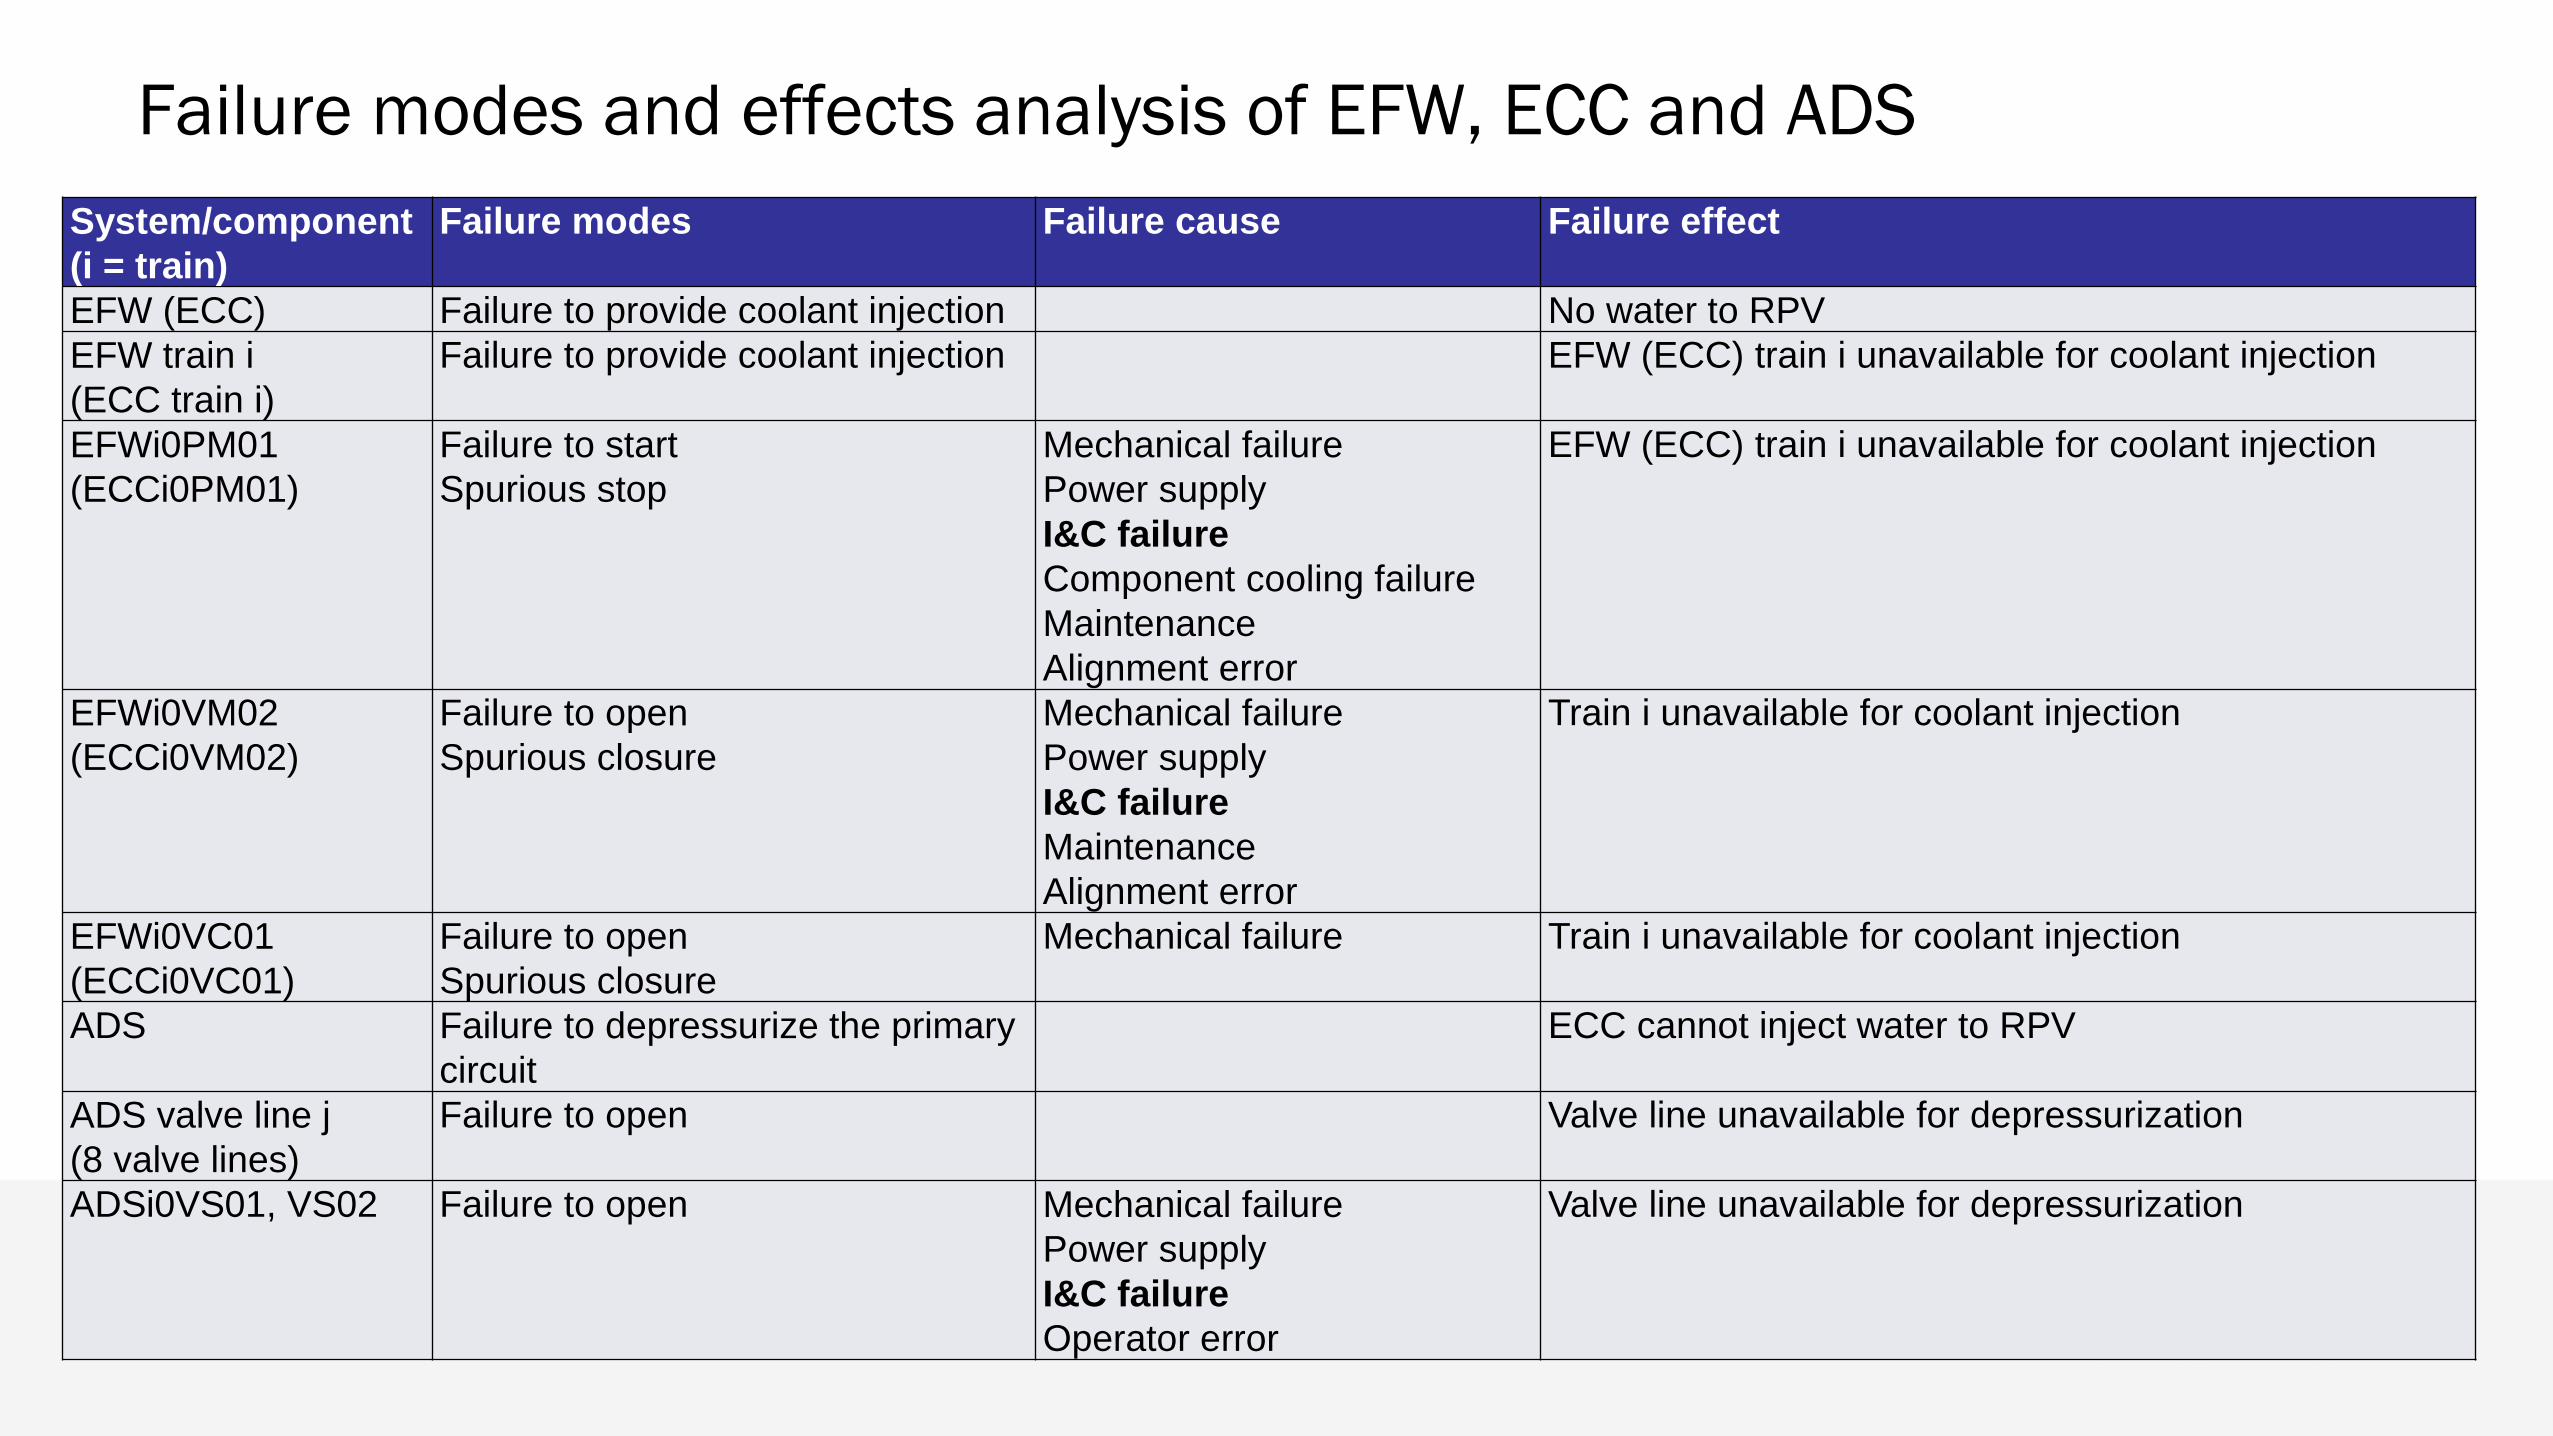
Failure modes and effects analysis of EFW, ECC and ADS
11
System/component
(i = train)
Failure modes Failure cause Failure effect
EFW (ECC) Failure to provide coolant injection No water to RPV
EFW train i
(ECC train i)
Failure to provide coolant injection EFW (ECC) train i unavailable for coolant injection
EFWi0PM01
(ECCi0PM01)
Failure to start
Spurious stop
Mechanical failure
Power supply
I&C failure
Component cooling failure
Maintenance
Alignment error
EFW (ECC) train i unavailable for coolant injection
EFWi0VM02
(ECCi0VM02)
Failure to open
Spurious closure
Mechanical failure
Power supply
I&C failure
Maintenance
Alignment error
Train i unavailable for coolant injection
EFWi0VC01
(ECCi0VC01)
Failure to open
Spurious closure
Mechanical failure Train i unavailable for coolant injection
ADS Failure to depressurize the primary
circuit
ECC cannot inject water to RPV
ADS valve line j
(8 valve lines)
Failure to open Valve line unavailable for depressurization
ADSi0VS01, VS02 Failure to open Mechanical failure
Power supply
I&C failure
Operator error
Valve line unavailable for depressurization

Failure modes and causes at the I&C unit level with respect to the EFW
function
12
Unit EFW function failure mode Failure causes
VU Failure to actuate EFW-ON VU internal failure
undetected failure
detected failure
Power supply failure
No EFW-ON from APU:s (3-o-o-4)
Spurious EFW-OFF VU failure causing spurious signal
detected failure
VU-APU communication link failure (2-o-o-4)
detected failure
Spurious EFW-OFF from APU:s (2-o-o-4)
APU No EFW-ON from APU APU internal failure
undetected failure
Failure of EFW-ON actuation from APU:s (3-o-o-4)
undetected failure
Failure of measurements for EFW-ON (3-o-o-4)
undetected failure
Spurious EFW-OFF APU internal failure
detected failure
APU-APU communication link failure
Failure of EFW-OFF actuation from APU:s (3-o-o-4)
detected failure
Failure of measurements for EFW-OFF (2-o-o-4)
detected failure

Hardware failure modes and basic events
• see previous presentation
13

Software fault cases
• See following presentations
14
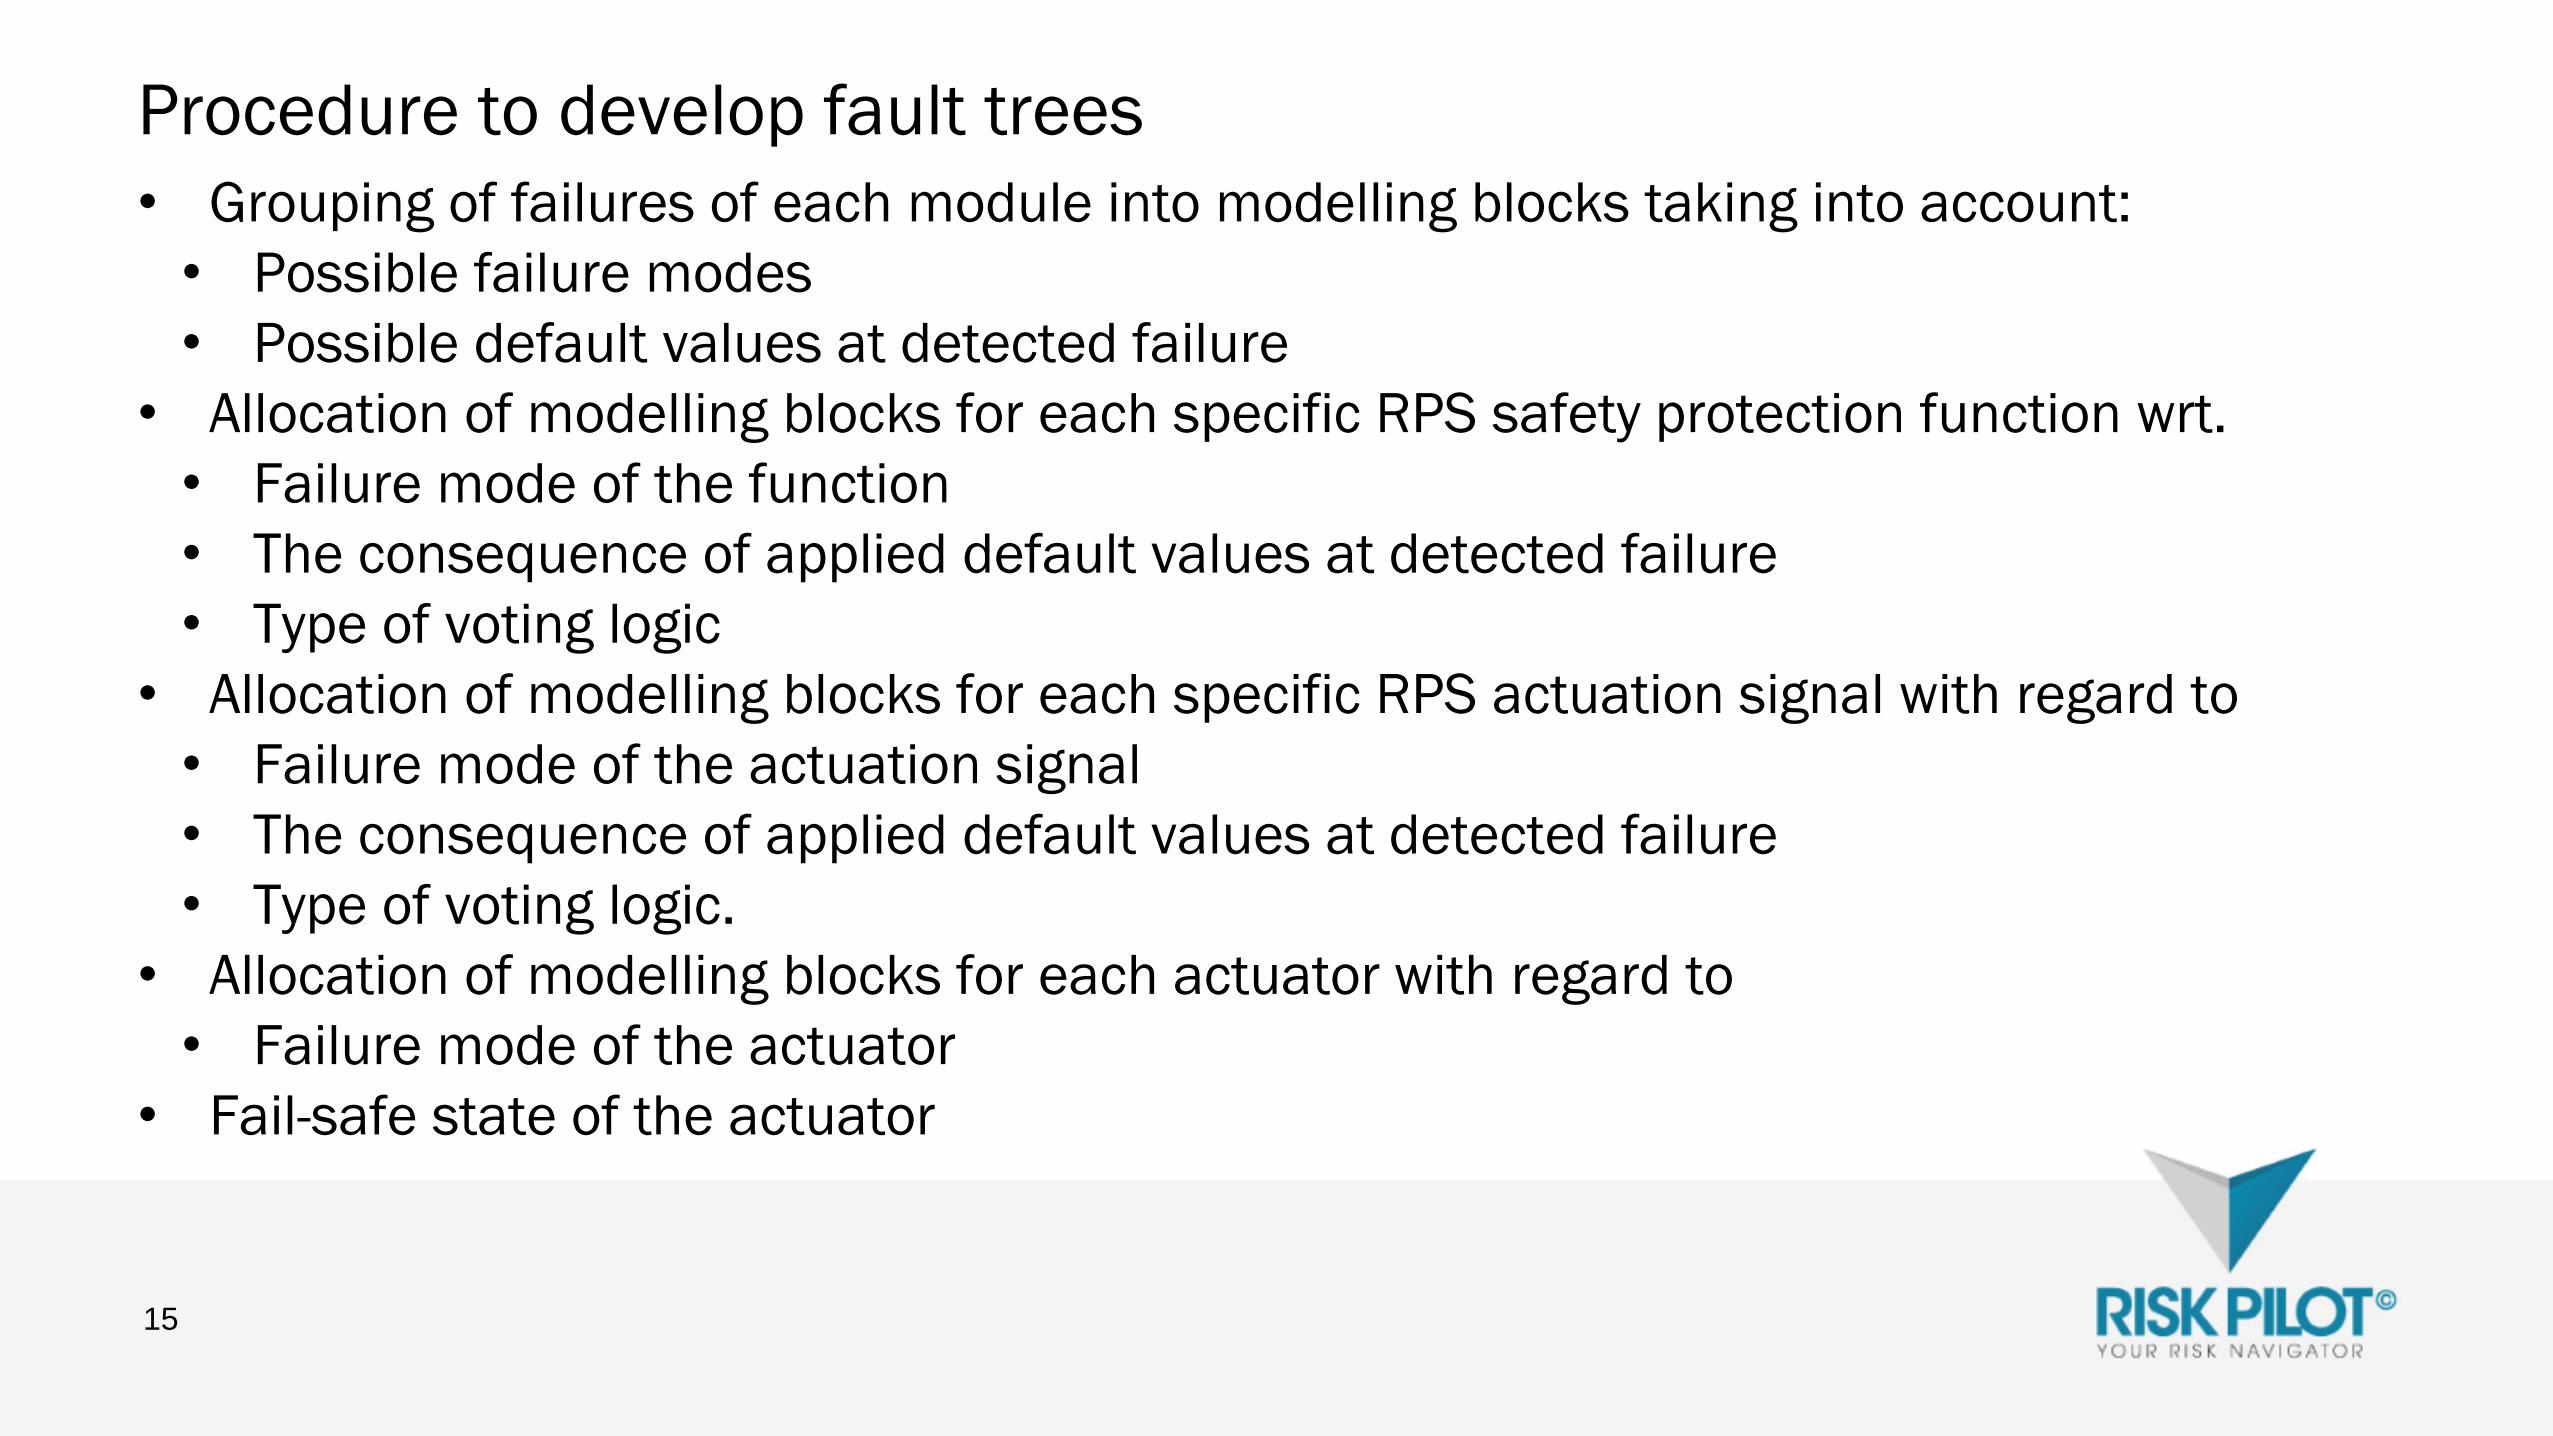
Procedure to develop fault trees
• Grouping of failures of each module into modelling blocks taking into account:
• Possible failure modes
• Possible default values at detected failure
• Allocation of modelling blocks for each specific RPS safety protection function wrt.
• Failure mode of the function
• The consequence of applied default values at detected failure
• Type of voting logic
• Allocation of modelling blocks for each specific RPS actuation signal with regard to
• Failure mode of the actuation signal
• The consequence of applied default values at detected failure
• Type of voting logic.
• Allocation of modelling blocks for each actuator with regard to
• Failure mode of the actuator
• Fail-safe state of the actuator
15

Failure to actuate EFW-ON
16
Unit EFW function failure mode Module level failure modes
VU No EFW-ON from VU Hardware modules:
digital output module, loss of function
digital output module, latent loss of function
processor module, loss of function
processor module, latent loss of function
backplane, loss of function
power supply, loss of function
digital input module, loss of function
digital input module, latent loss of function
Software modules:
SYSTEM level CCF in SW modules (case 1)
1SS level CCF in SW modules (case 2)
1VU level CCF in SW modules (case 3b)
EFW-ON application SW fault in VU (case 4b)
APU No EFW-ON from APU to VU Hardware modules:
processor module, latent loss of function
Software modules:
SYSTEM level CCF in SW modules (case 1)
1SS level CCF in SW modules (case 2)
1APU level CCF in SW modules (case 3a)
EFW-ON application SW fault in APU (case 4a)
EFW-ON condition RPV-LL fails in APU (3-o-
o-4)
Hardware modules:
APU-APU communication link failure, undetected failure (3 divisions)
analog input module (providing RPV-LL), latent loss of function (own division)
measurement signal (RPV-LL), latent loss of function (own division)
Software modules:
RPV-LL application SW fault in APU (case 4a)
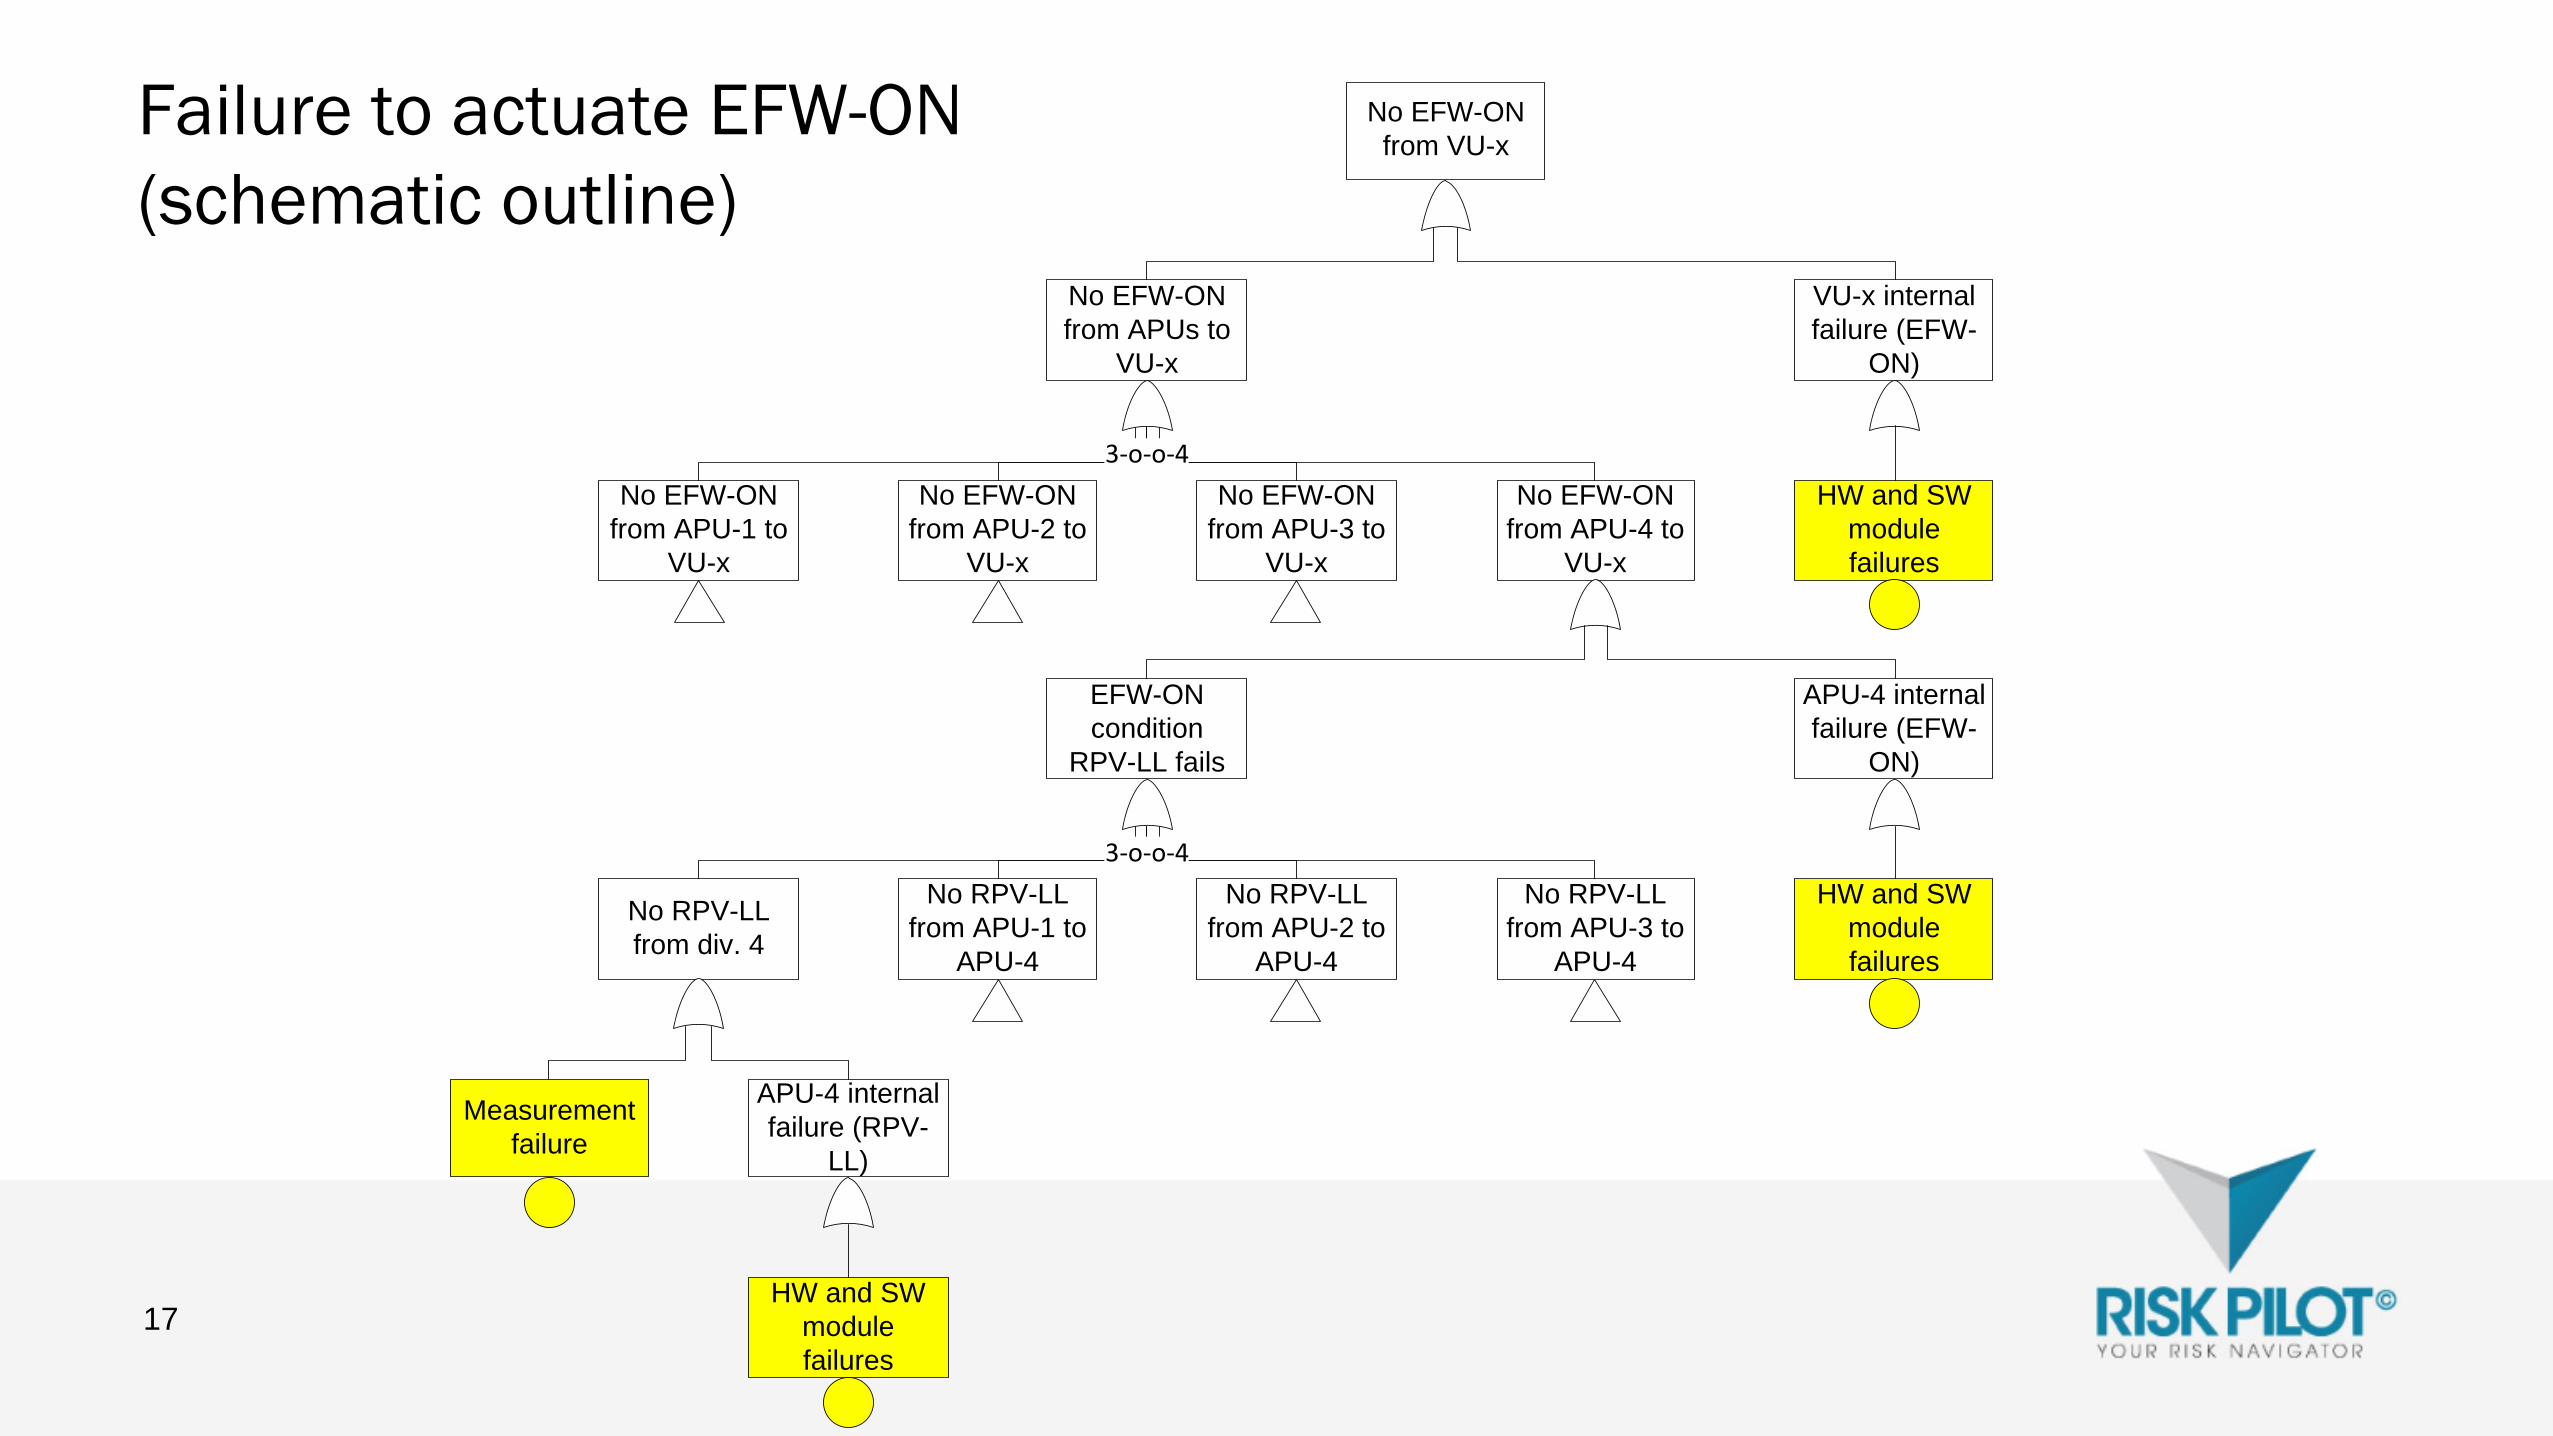
Failure to actuate EFW-ON
(schematic outline)
17
No EFW-ON
from VU-x
VU-x internal
failure (EFW-
ON)
HW and SW
module
failures
No EFW-ON
from APU-1 to
VU-x
No EFW-ON
from APU-2 to
VU-x
No EFW-ON
from APU-3 to
VU-x
No EFW-ON
from APU-4 to
VU-x
EFW-ON
condition
RPV-LL fails
APU-4 internal
failure (EFW-
ON)
HW and SW
module
failures
3-o-o-4
No RPV-LL
from div. 4
No RPV-LL
from APU-1 to
APU-4
No RPV-LL
from APU-2 to
APU-4
No RPV-LL
from APU-3 to
APU-4
APU-4 internal
failure (RPV-
LL)
HW and SW
module
failures
Measurement
failure
3-o-o-4
No EFW-ON
from APUs to
VU-x

Role of default values
• Failure modes to be accounted:
• Default values must be taken into account at all steps of the analysis (from actuator signal
down to measurements)
• may change during the signal path
• may be different for different actuators
18
Failure to actuate Spurious actuation
Default 1 Undetected failure modes Detected failure modes
Default 0 Undetected and detected
failure modes
Evaluation of modelling aspects
• Hardware failure modes
• Importance of failures detected and undetected (latent) by online monitoring
• Level of detail
• Effect on plant risk measures when performing the digital I&C reliability model at I&C unit
level compared to module level
• Default values (fault tolerant design)
• Impact of chosen fault tolerant design, i.e. appliance of default values at detected failure
• The model and data are fictive, why numerical results are less relevant
• The evaluation was instead made by comparing importance measures and cut set orders for
different configurations of design and modelling aspects
19

Preliminary conclusions
• The evaluation demonstrated the developed taxonomy and verified that it is suitable for PSA
purpose
• Performed test cases indicates that:
• Detected failures can contribute significantly to the plant risk indifferent of fault tolerant
design.
• Module level seems to be the most suitable level of detail. Modelling at to low level of detail
may produce misleading results and hence erroneous risk informed decisions.
• The results are naturally due to the specific design and assigned failure data and CCF
parameters.
• Differences in conclusions may of course be found for different designs and failure data
• These conclusions are preliminary and further work (e.g. treatment of CCF:s and software
failures) and validation is planned during 2013-14
20
Next steps
• Ongoing 2013
• Implementation of software failure modes
• Further tests with modelling aspects, e.g., CCF modelling
• Comparison Risk Spectrum and FinPSA tools for modelling of I&C
• Outline for the software quantification approach
• Finalisation of the WGRISK/DIGREL taxonomy
• 2014
• Software quantification approach
• Final reporting (Nordic and WGRISK)
• Finalisation of the example model (Risk Spectrum, FinPSA)
21
Additional conclusions
• In order to develop a realistic fault tree model for a digital I&C protection system it is vital that
the chosen fault tolerant design is fully understood and correctly described in the model
• The treatment of faulty inputs and degraded voting logic sets the foundation of the fault tree
analysis
• Modelling of digital I&C significantly increases the effort of failure mode analysis, dependency
analysis and fault tree modelling
• The amount of resource involved in such a task should not be underestimated, neither should
the task of quality assurance
22


Example PSA model
DIGREL seminar 26.11.2013
Tero Tyrväinen
VTT Technical Research Centre of Finland

2 27/11/2013
Example PSA model
Fictive and simplified nuclear power plant (BWR).
4-redundant safety systems.
Event trees for large LOCA, loss of main feedwater, transient and loss-of-
offsite power.
Fault trees for AC power system, component cooling water system,
emergency core cooling system, emergency feedwater system,
depressurisation valve system, reactor scram, residual heat removal
system, service water system and main feedwater system.
Model contains I&C systems.

3 27/11/2013
I&C system

4 27/11/2013
I&C system components
Components for RPS and DPS
Analog input modules
Digital output modules
Processors
Processor subtracts
Digital input modules
Communication links
Separate basic events for detected and undetected failures

5 27/11/2013
Two versions
The original version is made in RiskSpectrum.
The model has been ”copied” to FinPSA.
RiskSpectrum version models I&C systems in fault trees.
FinPSA version uses the I&C modelling feature to model I&C
systems.
6 27/11/2013
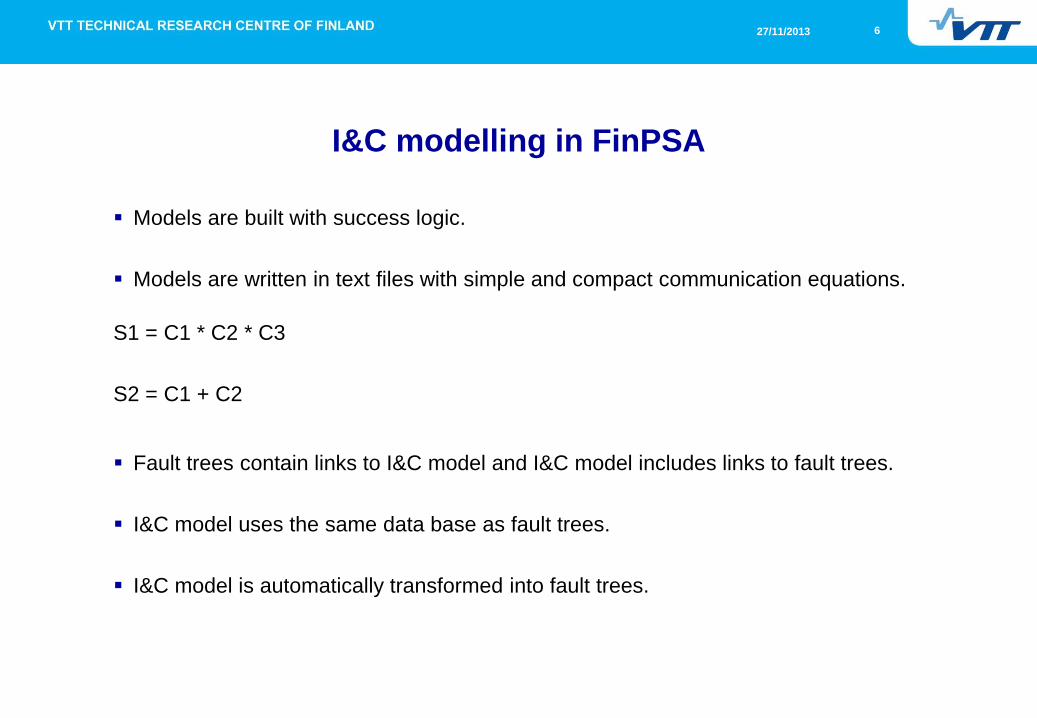
I&C modelling in FinPSA
Models are built with success logic.
Models are written in text files with simple and compact communication equations.
S1 = C1 * C2 * C3
S2 = C1 + C2
Fault trees contain links to I&C model and I&C model includes links to fault trees.
I&C model uses the same data base as fault trees.
I&C model is automatically transformed into fault trees.

7 27/11/2013
Fault tree of ECC system pump
A link to I&C-model.

8 27/11/2013
ECC pump start signal in I&C model
9 27/11/2013
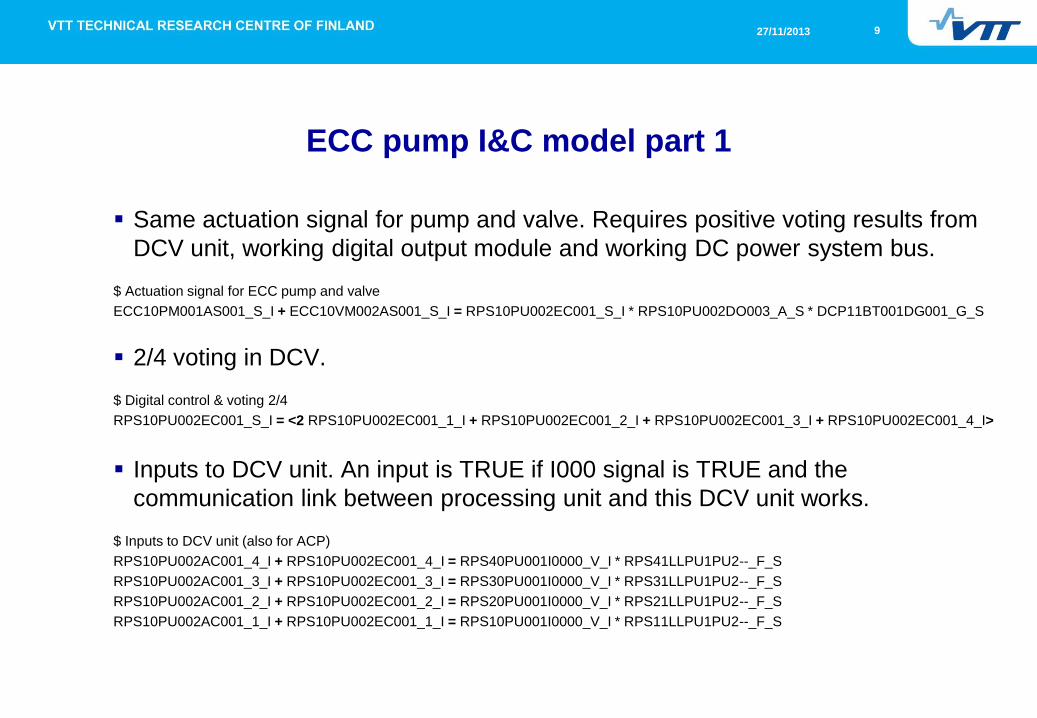
ECC pump I&C model part 1
Same actuation signal for pump and valve. Requires positive voting results from
DCV unit, working digital output module and working DC power system bus.
$ Actuation signal for ECC pump and valve
ECC10PM001AS001_S_I + ECC10VM002AS001_S_I = RPS10PU002EC001_S_I * RPS10PU002DO003_A_S * DCP11BT001DG001_G_S
2/4 voting in DCV.
$ Digital control & voting 2/4
RPS10PU002EC001_S_I = <2 RPS10PU002EC001_1_I + RPS10PU002EC001_2_I + RPS10PU002EC001_3_I + RPS10PU002EC001_4_I>
Inputs to DCV unit. An input is TRUE if I000 signal is TRUE and the
communication link between processing unit and this DCV unit works.
$ Inputs to DCV unit (also for ACP)
RPS10PU002AC001_4_I + RPS10PU002EC001_4_I = RPS40PU001I0000_V_I * RPS41LLPU1PU2--_F_S
RPS10PU002AC001_3_I + RPS10PU002EC001_3_I = RPS30PU001I0000_V_I * RPS31LLPU1PU2--_F_S
RPS10PU002AC001_2_I + RPS10PU002EC001_2_I = RPS20PU001I0000_V_I * RPS21LLPU1PU2--_F_S
RPS10PU002AC001_1_I + RPS10PU002EC001_1_I = RPS10PU001I0000_V_I * RPS11LLPU1PU2--_F_S

10 27/11/2013
ECC pump I&C model part 2
I000 signal is TRUE if I002 or I005 is TRUE. However, in the case of
TRANSIENT, I005 signal is cut off the model (by attribute assigned in the data
base) and I002 is required.
$ I000 signals from APUs (I005 cut off in case of TRANSIENT)
RPS10PU001I0000_V_I = RPS10PU001I0002_V_I + RPS10PU001I0005_V_I
RPS20PU001I0000_V_I = RPS20PU001I0002_V_I + RPS20PU001I0005_V_I
RPS30PU001I0000_V_I = RPS30PU001I0002_V_I + RPS30PU001I0005_V_I
RPS40PU001I0000_V_I = RPS40PU001I0002_V_I + RPS40PU001I0005_V_I
2/4 votings in processing units (I002).
$ Processing units 2/4 votings
RPS10PU001I0002_V_I = <2 RPS10PU001I0002_1_I + RPS10PU001I0002_2_I + RPS10PU001I0002_3_I + RPS10PU001I0002_4_I>
RPS20PU001I0002_V_I = <2 RPS20PU001I0002_1_I + RPS20PU001I0002_2_I + RPS20PU001I0002_3_I + RPS20PU001I0002_4_I>
RPS30PU001I0002_V_I = <2 RPS30PU001I0002_1_I + RPS30PU001I0002_2_I + RPS30PU001I0002_3_I + RPS30PU001I0002_4_I>
RPS40PU001I0002_V_I = <2 RPS40PU001I0002_1_I + RPS40PU001I0002_2_I + RPS40PU001I0002_3_I + RPS40PU001I0002_4_I>

11 27/11/2013
ECC pump I&C model part 3
Inputs to processing units. Input is TRUE if water level censor and the
communication link between two processing units work, except when the
measurement comes from the same division, there is no communication link.
$ Inputs to processing units
RPS10PU001I0002_4_I = RPS41PU001VL002_F_S * RPS14LLPU1PU1--_F_S
RPS10PU001I0002_3_I = RPS31PU001VL002_F_S * RPS13LLPU1PU1--_F_S
RPS10PU001I0002_2_I = RPS21PU001VL002_F_S * RPS12LLPU1PU1--_F_S
RPS10PU001I0002_1_I = RPS11PU001VL002_F_S
RPS20PU001I0002_4_I = RPS41PU001VL002_F_S * RPS24LLPU1PU1--_F_S
RPS20PU001I0002_3_I = RPS31PU001VL002_F_S * RPS23LLPU1PU1--_F_S
RPS20PU001I0002_2_I = RPS21PU001VL002_F_S
RPS20PU001I0002_1_I = RPS11PU001VL002_F_S * RPS21LLPU1PU1--_F_S
RPS30PU001I0002_4_I = RPS41PU001VL002_F_S * RPS34LLPU1PU1--_F_S
RPS30PU001I0002_3_I = RPS31PU001VL002_F_S
RPS30PU001I0002_2_I = RPS21PU001VL002_F_S * RPS32LLPU1PU1--_F_S
RPS30PU001I0002_1_I = RPS11PU001VL002_F_S * RPS31LLPU1PU1--_F_S
RPS40PU001I0002_4_I = RPS41PU001VL002_F_S
RPS40PU001I0002_3_I = RPS31PU001VL002_F_S * RPS43LLPU1PU1--_F_S
RPS40PU001I0002_2_I = RPS21PU001VL002_F_S * RPS42LLPU1PU1--_F_S
RPS40PU001I0002_1_I = RPS11PU001VL002_F_S * RPS41LLPU1PU1--_F_S

12 27/11/2013
I&C model is automatically transformed into fault tree
13 27/11/2013
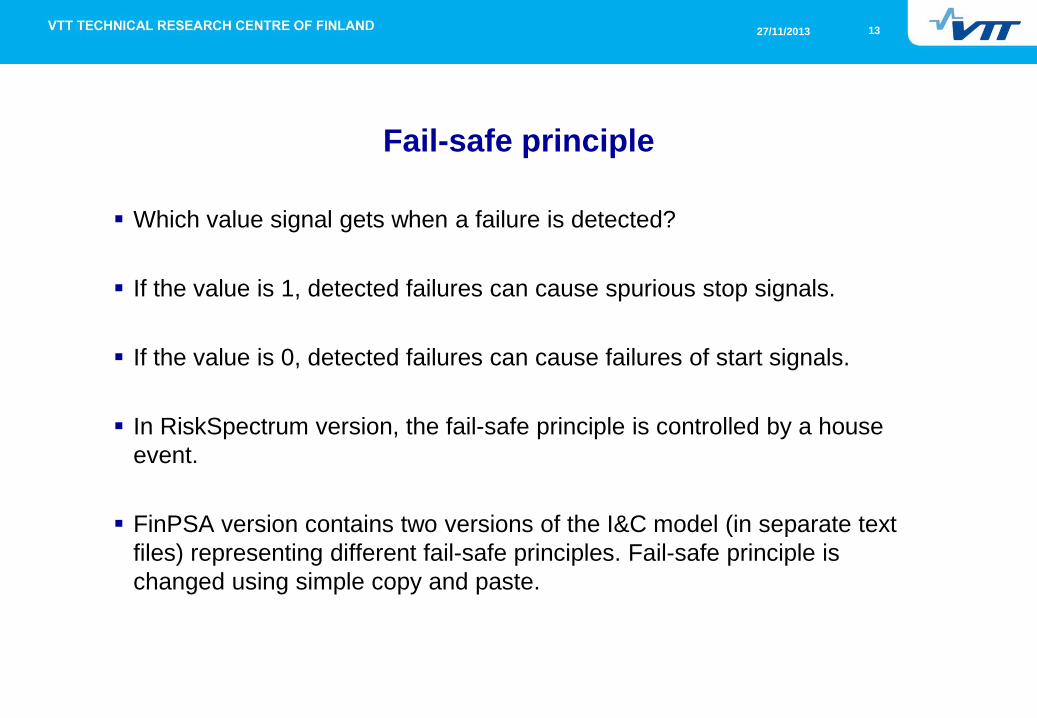
Fail-safe principle
Which value signal gets when a failure is detected?
If the value is 1, detected failures can cause spurious stop signals.
If the value is 0, detected failures can cause failures of start signals.
In RiskSpectrum version, the fail-safe principle is controlled by a house
event.
FinPSA version contains two versions of the I&C model (in separate text
files) representing different fail-safe principles. Fail-safe principle is
changed using simple copy and paste.

14 27/11/2013
Results EXPSA201311: TRANSIENT -> CD, cut set importances 131122 15:13 <TPT>
=================================================
MCU require IE 4.50E-08 S1-sum 4.50E-08 TOP mc S1-sum 4.54E-08
Num Seq. Freq. Prob Name Comment
1 15 1.43E-08 1.00E+00 TRANS General transient
4.12E-02 ACN10GT001_________A Gas turbine fail to start
1.45E-04 ACPC0DG001______D-ABCD 4x CCF Diesel generator in standby fails to operate
2.40E-03 OFFSITE-POWER Loss of off-site power
2 15 6.59E-09 1.00E+00 TRANS General transient
1.90E-02 ACN10GT001_________M Gas turbine unavailable due to maintenance
1.45E-04 ACPC0DG001______D-ABCD 4x CCF Diesel generator in standby fails to operate
2.40E-03 OFFSITE-POWER Loss of off-site power
3 15 1.67E-09 1.00E+00 TRANS General transient
4.12E-02 ACN10GT001_________A Gas turbine fail to start
1.69E-05 ACPC0DG001______A-ABCD 4x CCF Diesel generators fail to start
2.40E-03 OFFSITE-POWER Loss of off-site power
4 15 1.63E-09 1.00E+00 TRANS General transient
1.13E-05 ACN10BB001_________Y Failure of ACN busbar
1.45E-04 ACPC0DG001______D-ABCD 4x CCF Diesel generator in standby fails to operate
5 15 1.39E-09 1.00E+00 TRANS General transient
4.12E-02 ACN10GT001_________A Gas turbine fail to start
3.88E-02 ACP20DG001_________D Diesel generator fails to operate
3.62E-04 ACPC0DG001______D-ACD 3x CCF Diesel generator in standby fails to operate
2.40E-03 OFFSITE-POWER Loss of off-site power

15 27/11/2013
I&C related minimal cut sets
Num Freq. % Prob Name Comment
55 4.79E-11 0.11 1.00E+00 TRANS General transient
2.14E-05 EFWC0PM001______D-ABCD 4x CCF EFW system pumps stop operating
2.24E-06 RPSC0PU001SR001_E-BCD 3x CCF Detected failures of processor subtracks
78 2.18E-11 0.05 1.00E+00 TRANS General transient
9.75E-06 EFWC0PM001______A-ABCD 4x CCF EFW system pumps fail to start
2.24E-06 RPSC0PU001SR001_E-ABC 3x CCF Detected failures of processor subtracks
81 2.12E-11 0.05 1.00E+00 TRANS General transient
2.14E-05 EFWC0PM001______D-ABCD 4x CCF EFW system pumps stop operating
9.90E-07 RPSCCLLPU1PU1--_E-ABCD 4x CCF Detected failures of communication links
16 27/11/2013
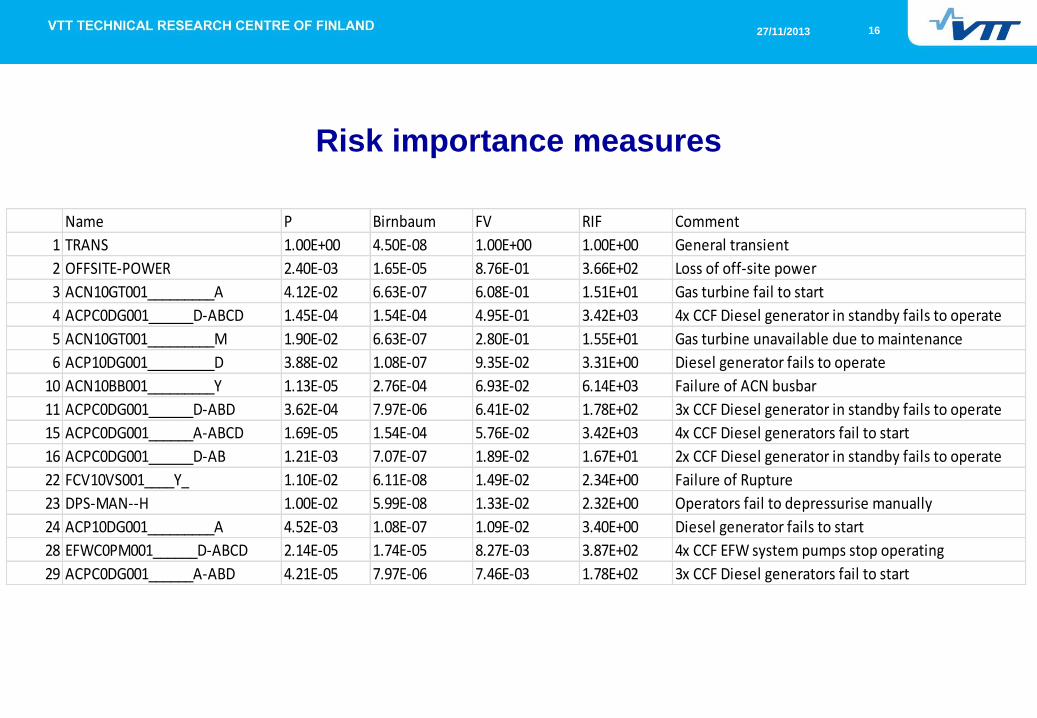
Risk importance measures
Name P Birnbaum FV RIF Comment
1 TRANS 1.00E+00 4.50E-08 1.00E+00 1.00E+00 General transient
2 OFFSITE-POWER 2.40E-03 1.65E-05 8.76E-01 3.66E+02 Loss of off-site power
3 ACN10GT001_________A 4.12E-02 6.63E-07 6.08E-01 1.51E+01 Gas turbine fail to start
4 ACPC0DG001______D-ABCD 1.45E-04 1.54E-04 4.95E-01 3.42E+03 4x CCF Diesel generator in standby fails to operate
5 ACN10GT001_________M 1.90E-02 6.63E-07 2.80E-01 1.55E+01 Gas turbine unavailable due to maintenance
6 ACP10DG001_________D 3.88E-02 1.08E-07 9.35E-02 3.31E+00 Diesel generator fails to operate
10 ACN10BB001_________Y 1.13E-05 2.76E-04 6.93E-02 6.14E+03 Failure of ACN busbar
11 ACPC0DG001______D-ABD 3.62E-04 7.97E-06 6.41E-02 1.78E+02 3x CCF Diesel generator in standby fails to operate
15 ACPC0DG001______A-ABCD 1.69E-05 1.54E-04 5.76E-02 3.42E+03 4x CCF Diesel generators fail to start
16 ACPC0DG001______D-AB 1.21E-03 7.07E-07 1.89E-02 1.67E+01 2x CCF Diesel generator in standby fails to operate
22 FCV10VS001____Y_ 1.10E-02 6.11E-08 1.49E-02 2.34E+00 Failure of Rupture
23 DPS-MAN--H 1.00E-02 5.99E-08 1.33E-02 2.32E+00 Operators fail to depressurise manually
24 ACP10DG001_________A 4.52E-03 1.08E-07 1.09E-02 3.40E+00 Diesel generator fails to start
28 EFWC0PM001______D-ABCD 2.14E-05 1.74E-05 8.27E-03 3.87E+02 4x CCF EFW system pumps stop operating
29 ACPC0DG001______A-ABD 4.21E-05 7.97E-06 7.46E-03 1.78E+02 3x CCF Diesel generators fail to start
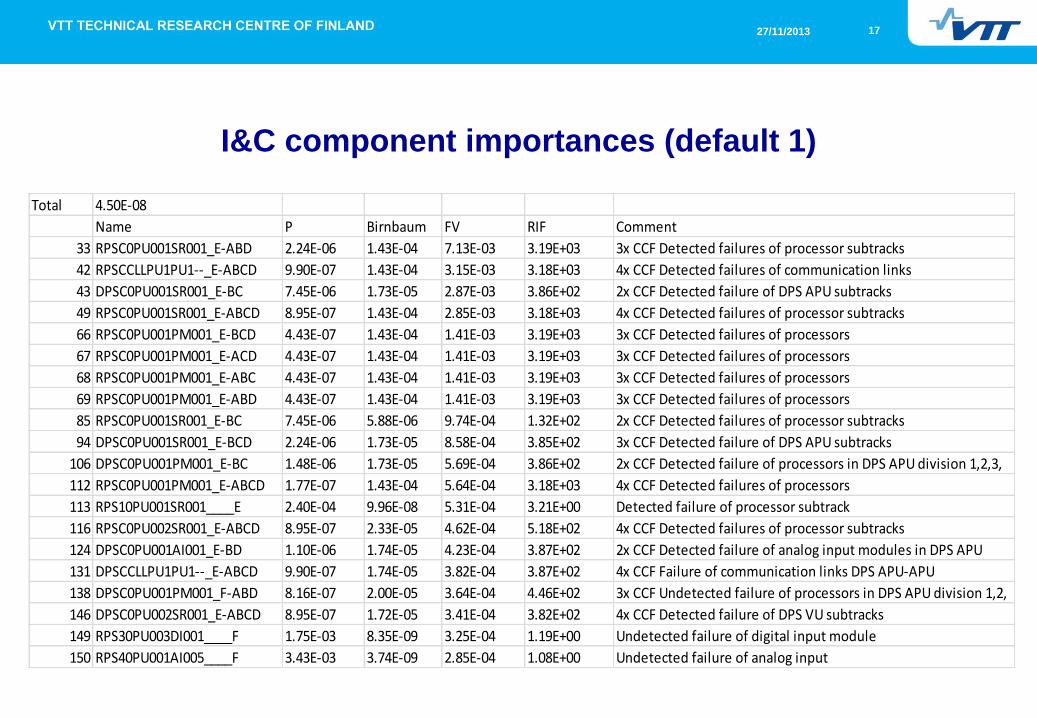
17 27/11/2013
I&C component importances (default 1)
Total 4.50E-08
Name P Birnbaum FV RIF Comment
33 RPSC0PU001SR001_E-ABD 2.24E-06 1.43E-04 7.13E-03 3.19E+03 3x CCF Detected failures of processor subtracks
42 RPSCCLLPU1PU1--_E-ABCD 9.90E-07 1.43E-04 3.15E-03 3.18E+03 4x CCF Detected failures of communication links
43 DPSC0PU001SR001_E-BC 7.45E-06 1.73E-05 2.87E-03 3.86E+02 2x CCF Detected failure of DPS APU subtracks
49 RPSC0PU001SR001_E-ABCD 8.95E-07 1.43E-04 2.85E-03 3.18E+03 4x CCF Detected failures of processor subtracks
66 RPSC0PU001PM001_E-BCD 4.43E-07 1.43E-04 1.41E-03 3.19E+03 3x CCF Detected failures of processors
67 RPSC0PU001PM001_E-ACD 4.43E-07 1.43E-04 1.41E-03 3.19E+03 3x CCF Detected failures of processors
68 RPSC0PU001PM001_E-ABC 4.43E-07 1.43E-04 1.41E-03 3.19E+03 3x CCF Detected failures of processors
69 RPSC0PU001PM001_E-ABD 4.43E-07 1.43E-04 1.41E-03 3.19E+03 3x CCF Detected failures of processors
85 RPSC0PU001SR001_E-BC 7.45E-06 5.88E-06 9.74E-04 1.32E+02 2x CCF Detected failures of processor subtracks
94 DPSC0PU001SR001_E-BCD 2.24E-06 1.73E-05 8.58E-04 3.85E+02 3x CCF Detected failure of DPS APU subtracks
106 DPSC0PU001PM001_E-BC 1.48E-06 1.73E-05 5.69E-04 3.86E+02 2x CCF Detected failure of processors in DPS APU division 1,2,3,
112 RPSC0PU001PM001_E-ABCD 1.77E-07 1.43E-04 5.64E-04 3.18E+03 4x CCF Detected failures of processors
113 RPS10PU001SR001____E 2.40E-04 9.96E-08 5.31E-04 3.21E+00 Detected failure of processor subtrack
116 RPSC0PU002SR001_E-ABCD 8.95E-07 2.33E-05 4.62E-04 5.18E+02 4x CCF Detected failures of processor subtracks
124 DPSC0PU001AI001_E-BD 1.10E-06 1.74E-05 4.23E-04 3.87E+02 2x CCF Detected failure of analog input modules in DPS APU
131 DPSCCLLPU1PU1--_E-ABCD 9.90E-07 1.74E-05 3.82E-04 3.87E+02 4x CCF Failure of communication links DPS APU-APU
138 DPSC0PU001PM001_F-ABD 8.16E-07 2.00E-05 3.64E-04 4.46E+02 3x CCF Undetected failure of processors in DPS APU division 1,2,
146 DPSC0PU002SR001_E-ABCD 8.95E-07 1.72E-05 3.41E-04 3.82E+02 4x CCF Detected failure of DPS VU subtracks
149 RPS30PU003DI001____F 1.75E-03 8.35E-09 3.25E-04 1.19E+00 Undetected failure of digital input module
150 RPS40PU001AI005____F 3.43E-03 3.74E-09 2.85E-04 1.08E+00 Undetected failure of analog input

18 27/11/2013
I&C component importances (default 0)
Total 4.26E-08
Name P Birnbaum FV RIF Comment
86 RPSC0PU002SR001_E-ABCD 8.95E-07 1.49E-05 3.14E-04 3.51E+02 4x CCF Detected failures of processor subtracks
124 DPSC0PU001SR001_E-ACD 2.24E-06 2.41E-06 1.26E-04 5.75E+01 3x CCF Detected failure of DPS APU subtracks
128 RPSC0PU002PM001_F-ABCD 3.27E-07 1.49E-05 1.14E-04 3.51E+02 4x CCF Undetected failures of processors
131 RPSC0PU001DO003_F-ABCD 4.95E-07 9.03E-06 1.05E-04 2.13E+02 4x CCF Undetected failures of digital output modules
132 DPSC0PU001DO003_F-ABCD 4.95E-07 9.03E-06 1.05E-04 2.13E+02 4x CCF Undetected failure of digital output modules DPS APU
141 RPSC0PU001PM001_F-ABC 8.16E-07 5.30E-06 1.01E-04 1.25E+02 3x CCF Undetected failures of processors
156 RPSC0PU001PM001_F-ABCD 3.27E-07 1.14E-05 8.77E-05 2.70E+02 4x CCF Undetected failures of processors
157 DPSC0PU001PM001_F-ABCD 3.27E-07 1.14E-05 8.73E-05 2.68E+02 4x CCF Undetected failure of processors in DPS APU division 1,2,
159 RPS30PU003DI001____F 1.75E-03 2.06E-09 8.44E-05 1.05E+00 Undetected failure of digital input module
164 RPSC0PU001DO003_F-ABC 1.24E-06 2.87E-06 8.34E-05 6.84E+01 3x CCF Undetected failures of digital output modules
165 DPSC0PU001DO003_F-ABD 1.24E-06 2.87E-06 8.34E-05 6.84E+01 3x CCF Undetected failure of digital output modules DPS APU
177 RPSC0PU002PM001_E-ABCD 1.77E-07 1.49E-05 6.21E-05 3.51E+02 4x CCF Detected failures of processors
178 RPS30PU002SR001____E 2.40E-04 1.07E-08 6.04E-05 1.25E+00 Detected failure of processor subtrack
192 DPSCCLLPU1PU1--_E-ABCD 9.90E-07 2.47E-06 5.74E-05 5.90E+01 4x CCF Failure of communication links DPS APU-APU
196 DPS30PU002SR001____E 2.40E-04 9.94E-09 5.59E-05 1.23E+00 Detected failure of processor subtrack
203 RPSC0PU001SR001_E-ABCD 8.95E-07 2.42E-06 5.09E-05 5.79E+01 4x CCF Detected failures of processor subtracks
205 DPSC0PU002SR001_E-ABCD 8.95E-07 2.39E-06 5.01E-05 5.70E+01 4x CCF Detected failure of DPS VU subtracks
206 DPSC0PU001SR001_E-ABCD 8.95E-07 2.39E-06 5.01E-05 5.70E+01 4x CCF Detected failure of DPS APU subtracks
222 RPSC0PU003DI001_F-ACD 1.63E-05 1.05E-07 4.04E-05 3.47E+00 3x CCF Undetected failure of digital input modules RPS APU
229 RPSC0PU002SR001_E-ACD 2.24E-06 6.55E-07 3.44E-05 1.64E+01 3x CCF Detected failures of processor subtracks

19 27/11/2013
References
Niemelä I. Isolation of I&C model from PRA fault tree model.
PSAM11 proceedings, 2012.

20 27/11/2013
VTT - 70 years of
technology for business
and society
Final slide is optional in VTT’s internal presentations
Digrel seminar 2013
Software quantification
Ola Bäckström
Lloyd’s Register Consulting
2013-11-26

Aims and goals
• This project discusses a method for quantification of reactor
protection system (RPS) software failures in nuclear PSA context
• The purpose is to define a simple yet sufficient model
– To describe the software failure impacts
– To provide a quantification model
– How to apply common cause failures is of special interest
• Collection of data and its challenges is also discussed

What is the Focus?
• Do we want to analyze the system in
detail and get as good estimates as
possible for each software fault?
Or
• Do we want to include a justifiable failure
probability for the system to account for in
the PSA?
• In this project we focus on the latter.
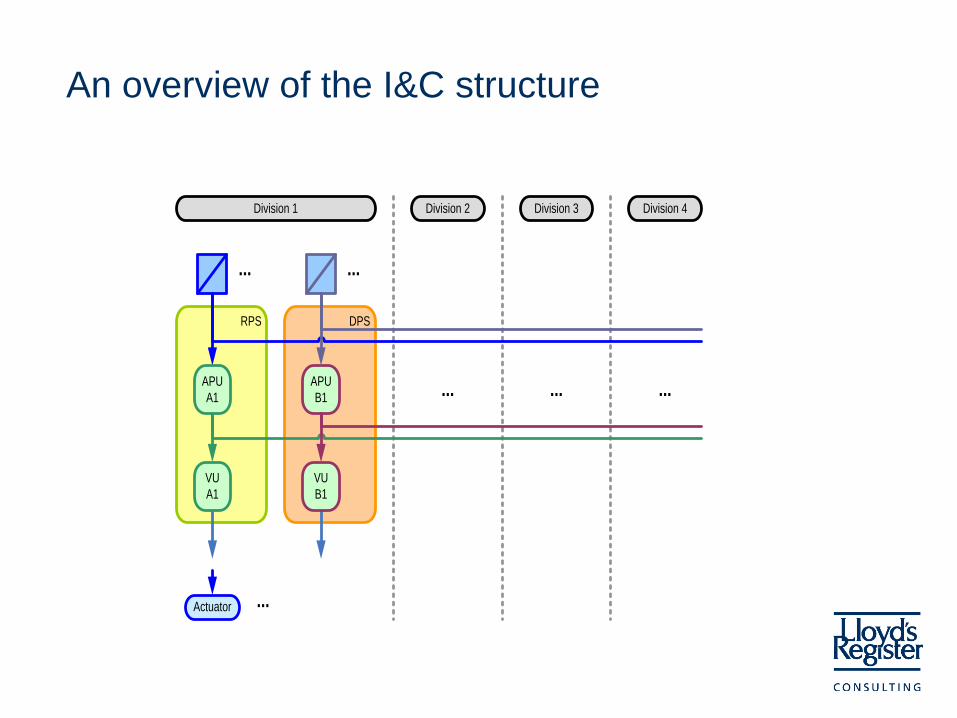
An overview of the I&C structure
DPSRPS
Division 1
APU
A1
...
VU
B1
APU
B1
...
Division 2 Division 3 Division 4
... ... ...
VU
A1
Actuator ...

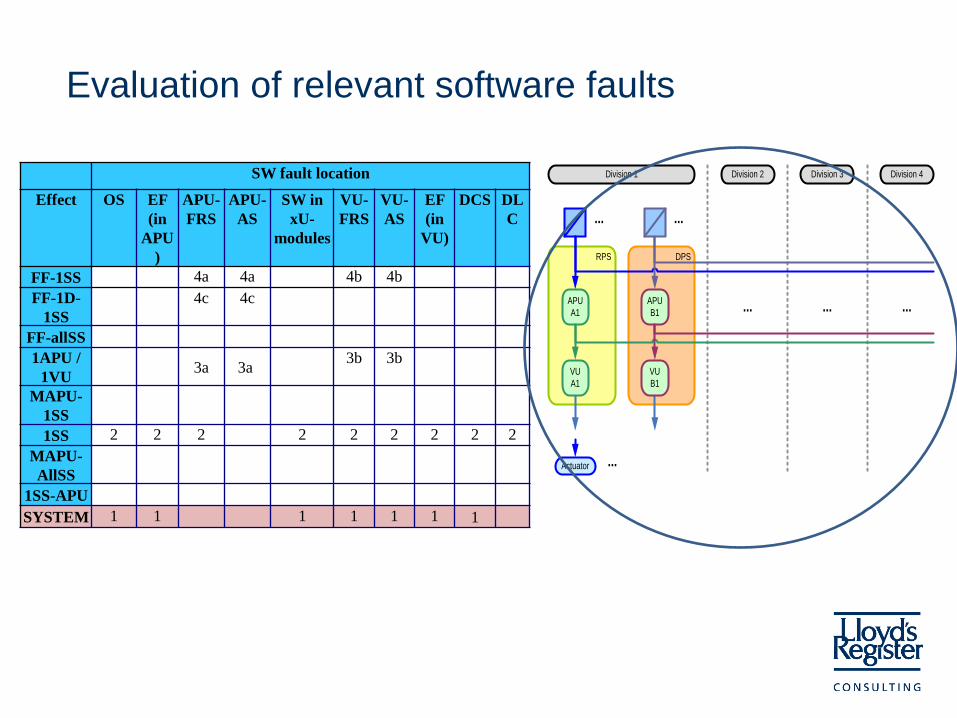
Evaluation of relevant software faults
SW fault location
Effect OS EF (in
APU)
APU-
FRS
APU-
AS
SW in xU-
modules
VU-
FRS
VU-
AS
EF (in
VU)
DCS DLC
FF-1SS 4a 4a 4b 4b
FF-1D-1SS 4c 4c
FF-allSS
1APU /
1VU 3a 3a
3b 3b
MAPU-1SS
1SS 2 2 2 2 2 2 2 2 2
MAPU-
AllSS
1SS-APU
SYSTEM 1 1 1 1 1 1 1
Evaluation of relevant software faults
SW fault location
Effect OS EF
(in
APU
)
APU-
FRS
APU-
AS
SW in
xU-
modules
VU-
FRS
VU-
AS
EF
(in
VU)
DCS DL
C
FF-1SS 4a 4a 4b 4b
FF-1D-
1SS
4c 4c
FF-allSS
1APU /
1VU 3a 3a
3b 3b
MAPU-
1SS
1SS 2 2 2 2 2 2 2 2 2
MAPU-
AllSS
1SS-APU
SYSTEM 1 1 1 1 1 1 1
DPSRPS
Division 1
APU
A1
...
VU
B1
APU
B1
...
Division 2 Division 3 Division 4
... ... ...
VU
A1
Actuator ...

Evaluation of relevant software faults
SW fault location
Effect OS EF
(in
APU
)
APU-
FRS
APU-
AS
SW in
xU-
modules
VU-
FRS
VU-
AS
EF
(in
VU)
DCS DL
C
FF-1SS 4a 4a 4b 4b
FF-1D-
1SS
4c 4c
FF-allSS
1APU /
1VU 3a 3a
3b 3b
MAPU-
1SS
1SS 2 2 2 2 2 2 2 2 2
MAPU-
AllSS
1SS-APU
SYSTEM 1 1 1 1 1 1 1

Outline of method
• OS, Operational System
– The fatal failures in the OS should be evaluated based on operational experience.
• SS, Sub System
– The fatal failures for the SS should be estimated in the same way as the OS, but only the failures that do not cause a complete fatal failure of the whole OS is interesting.
• VU, APU
– The fatal failure probability as well as the non-fatal probability is more complicated to estimate
– Will require a different approach

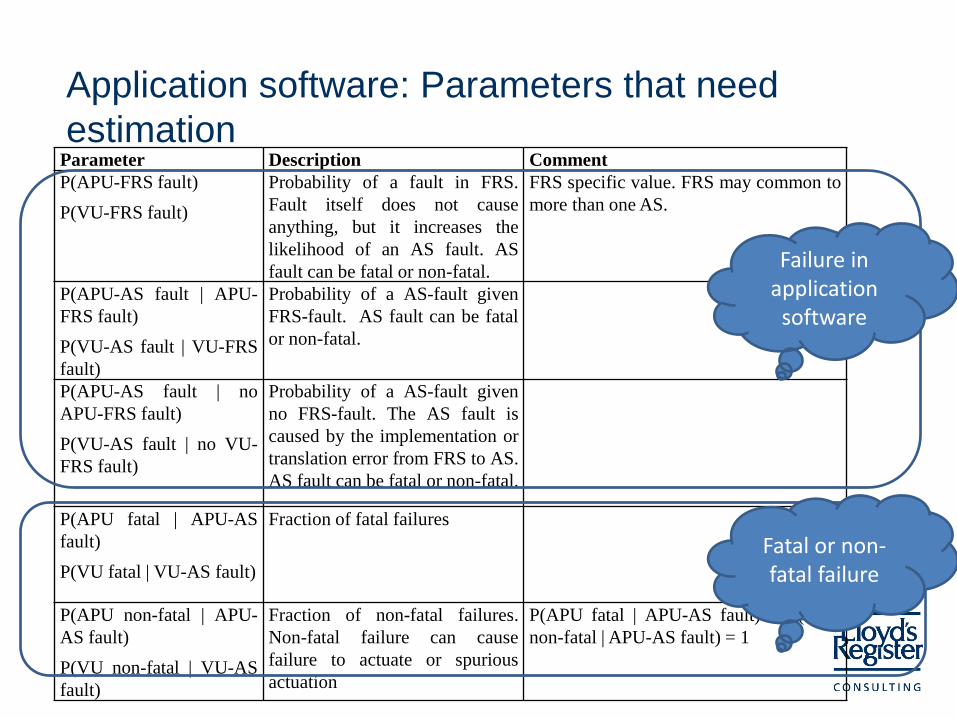
Application software: Parameters that need
estimation Parameter Description Comment
P(APU-FRS fault)
P(VU-FRS fault)
Probability of a fault in FRS.
Fault itself does not cause
anything, but it increases the
likelihood of an AS fault. AS
fault can be fatal or non-fatal.
FRS specific value. FRS may common to
more than one AS.
P(APU-AS fault | APU-
FRS fault)
P(VU-AS fault | VU-FRS
fault)
Probability of a AS-fault given
FRS-fault. AS fault can be fatal
or non-fatal.
P(APU-AS fault | no
APU-FRS fault)
P(VU-AS fault | no VU-
FRS fault)
Probability of a AS-fault given
no FRS-fault. The AS fault is
caused by the implementation or
translation error from FRS to AS.
AS fault can be fatal or non-fatal.
P(APU fatal | APU-AS
fault)
P(VU fatal | VU-AS fault)
Fraction of fatal failures
P(APU non-fatal | APU-
AS fault)
P(VU non-fatal | VU-AS
fault)
Fraction of non-fatal failures.
Non-fatal failure can cause
failure to actuate or spurious
actuation
P(APU fatal | APU-AS fault) + P(APU
non-fatal | APU-AS fault) = 1

Baseline failure estimate
What do we actually know?
• To make a waterproof estimate - insufficient knowledge!
• Some data
• Understanding that there ought to be a correlation between
– complexity and failure probability
– V&V and failure probability
• IEC 61508 provides some basis

Baseline failure estimate
V&V
Complexity
High Medium Low
0 1,0E-01
1 1,0E-02
2 1,0E-03
3 1,0E-04
4 1,0E-05
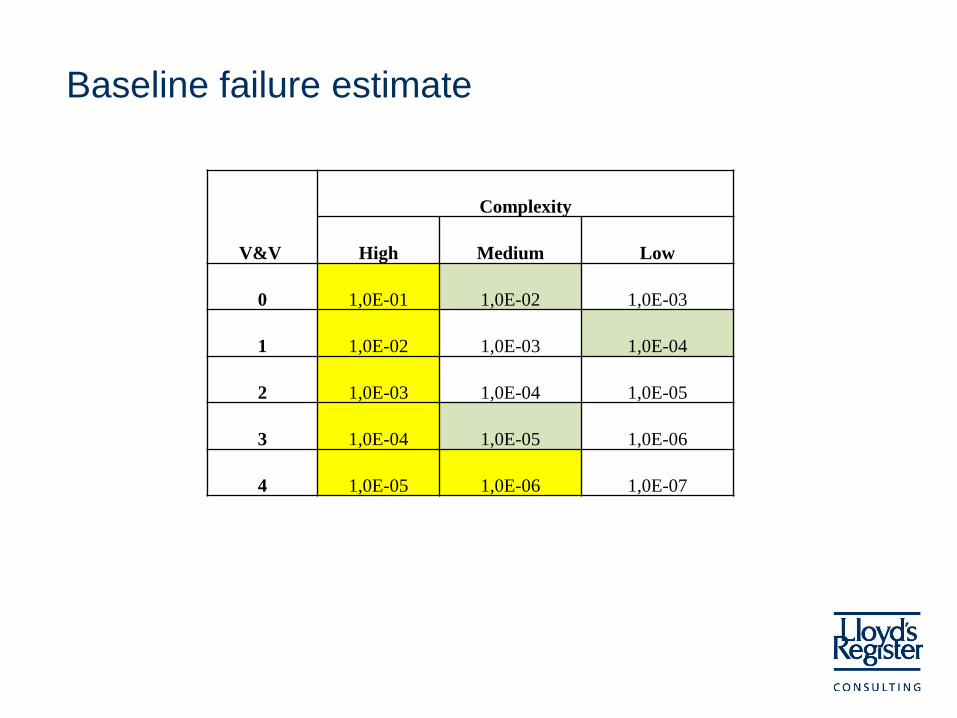
Baseline failure estimate
V&V
Complexity
High Medium Low
0 1,0E-01 1,0E-02 1,0E-03
1 1,0E-02 1,0E-03 1,0E-04
2 1,0E-03 1,0E-04 1,0E-05
3 1,0E-04 1,0E-05 1,0E-06
4 1,0E-05 1,0E-06 1,0E-07

Baseline failure estimate
V&V
Complexity
High Medium Low
0 1,0E-01 1,0E-02 1,0E-03
1 1,0E-02 1,0E-03 1,0E-04
2 1,0E-03 1,0E-04 1,0E-05
3 1,0E-04 1,0E-05 1,0E-06
4 1,0E-05 1,0E-06 1,0E-07
How to determine the
complexity?
Is this really SIL or is it “ZIL”?

Application software – how to determine the SW
failure probability
Application software: Parameters that need
estimation Parameter Description Comment
P(APU-FRS fault)
P(VU-FRS fault)
Probability of a fault in FRS.
Fault itself does not cause
anything, but it increases the
likelihood of an AS fault. AS
fault can be fatal or non-fatal.
FRS specific value. FRS may common to
more than one AS.
P(APU-AS fault | APU-
FRS fault)
P(VU-AS fault | VU-FRS
fault)
Probability of a AS-fault given
FRS-fault. AS fault can be fatal
or non-fatal.
P(APU-AS fault | no
APU-FRS fault)
P(VU-AS fault | no VU-
FRS fault)
Probability of a AS-fault given
no FRS-fault. The AS fault is
caused by the implementation or
translation error from FRS to AS.
AS fault can be fatal or non-fatal.
P(APU fatal | APU-AS
fault)
P(VU fatal | VU-AS fault)
Fraction of fatal failures
P(APU non-fatal | APU-
AS fault)
P(VU non-fatal | VU-AS
fault)
Fraction of non-fatal failures.
Non-fatal failure can cause
failure to actuate or spurious
actuation
P(APU fatal | APU-AS fault) + P(APU
non-fatal | APU-AS fault) = 1
Failure in application
software
Fatal or non-fatal failure

No signal
No output from
application software 1, fail safe
@NOSIGNAL-FAILSAFE-1
Non-fatal failures in AS1
@NOSIGNAL-FAILSAFE-3
Non-fatal failures in AS1
- no signal
AS1-NOSIG-NONFATAL
Failure probability in
ASx, CCF - no signal
ASX-NOSIG-CCF-NONFAT
No output from
application software 1, not fail safe
@NOSIGNAL-NOFAILS-1
Failure in any process on
processor running AS1
@NOSIGNAL-NOFAILS-2
Failure probability in AS1
AS1-FATAL
Failure probability in AS2
AS2-FATAL
Failure probability in ASn
ASN-FATAL
Non-fatal failures in AS1
@NOSIGNAL-NOFAILS-3
Non-fatal failures in AS1
- no signal
AS1-NOSIG-NONFATAL
Failure probability in
ASx, CCF - no signal
ASX-NOSIG-CCF-NONFAT
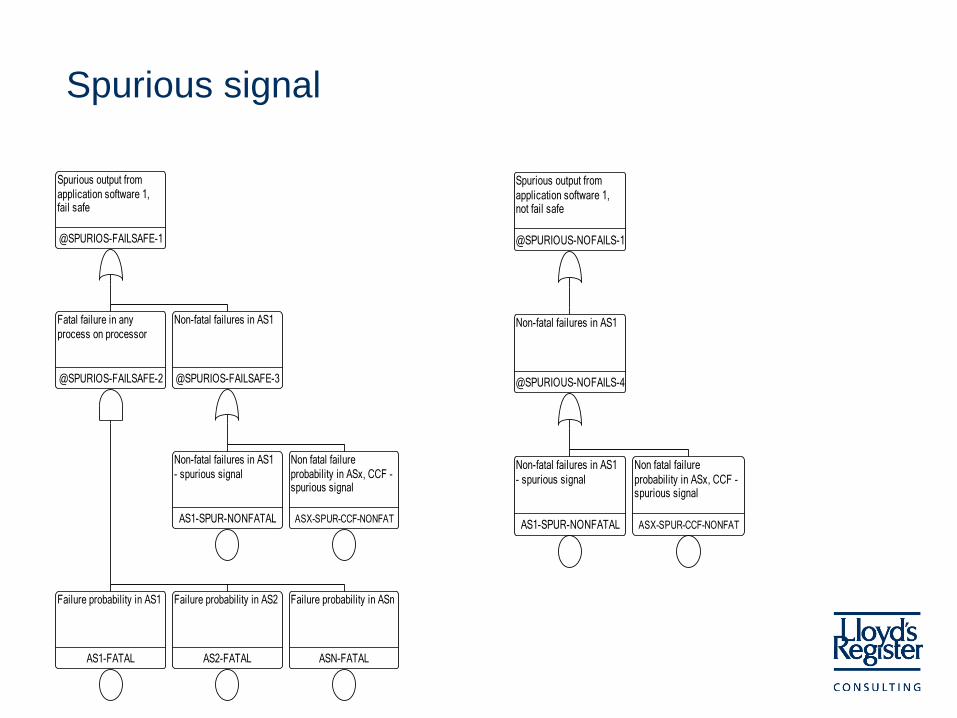
Spurious signal
Spurious output from
application software 1, fail safe
@SPURIOS-FAILSAFE-1
Fatal failure in any
process on processor
@SPURIOS-FAILSAFE-2
Failure probability in AS1
AS1-FATAL
Failure probability in AS2
AS2-FATAL
Failure probability in ASn
ASN-FATAL
Non-fatal failures in AS1
@SPURIOS-FAILSAFE-3
Non-fatal failures in AS1
- spurious signal
AS1-SPUR-NONFATAL
Non fatal failure
probability in ASx, CCF - spurious signal
ASX-SPUR-CCF-NONFAT
Spurious output from
application software 1, not fail safe
@SPURIOUS-NOFAILS-1
Non-fatal failures in AS1
@SPURIOUS-NOFAILS-4
Non-fatal failures in AS1
- spurious signal
AS1-SPUR-NONFATAL
Non fatal failure
probability in ASx, CCF - spurious signal
ASX-SPUR-CCF-NONFAT

Outline of method
• OS, Operational System – The fatal failures in the OS should be evaluated based on operational experience.
• SS, Sub System – The fatal failures for the SS should be estimated in the same way as the OS, but only the
failures that do not cause a complete fatal failure of the whole OS is interesting.
• VU, APU – The baseline failure probability for the application software is estimated from table.
– The failure probability is dependent on the software complexity and the V&V program.
– A fraction for fatal and non-fatal failures are used to estimate the failure probability for each of these failures.
– Non-fatal failures causing no signal and spurious signals are assumed to have the same probability due to lack of information.
– Fatal failures causing spurious and no signal is dependent on system design.
– CCF is especially interesting for functional requirements, and these are in their turn especially interesting for non-fatal failures. A simple application model for CCF is being considered.

For more information, please contact:
Ola Bäckström
Software manager, technical lead
Lloyd’s Register Consulting
T +46 70 742 13 93
W www.lr.org/consulting
W www.riskspectrum.com
Lloyd's Register and Lloyd’s Register Consulting are trading
names of the Lloyd's Register Group Limited and its
subsidiaries.
For further details please see our web site www.lr.org/entities

Wednesday, November 27, 2013
TOPAAS a tool for the assessment of
software reliability Wietske Postma
Consultant risk management

Overview
1. Background – QRA in the Netherlands – Development of TOPAAS
2. TOPAAS – Criteria – Philosophy – Basis – Metrics – Example
3. Further development
2

1. Background: quantitative risk assessment (QRA) in the Netherlands
• Dutch law imposes quantitative probabilistic requirements – For example on the probability of flooding of an area
• Major advantages of the probabilistic approach: – Transparency – Possibility to set limits and to show they have been met
3

1. Background: example
Measlantkering Requirements • Failure on demand: 1∙10-2 • Fault tree model is used
for the QRA • Hardware failure • Software important part
4
1. Background: development of TOPAAS
• In 2007 the ministry of infrastructure and environment initiated the development of a new model for quantitative risk assessment of software;
• Experts and critics of the previous used method were invited to contribute to the development: Technical University Eindhoven (TU/e), University of Amsterdam (UvA), Logica/CMG, Movares, Delta-Pi, Intermedion/KEMA, Refis, DNV-CIBIT, NRG
• This resulted in the method called TOPAAS: “Task-Oriented Probability of Abnormalities Analysis for Software”
• Bayesian probability concept Estimation of failure probability by experts. Expert opinion or engineering judgment is based on the belief of the expert
5

2. TOPAAS: Criteria of the method
• Contents the important parameters that influence software reliability
• Can be used in different situations, for instance the purchase of “black box” products or the development of your own products
• Focuses on the critical parts of the software system
• Generally accepted
• Allows for process control
• Freely usable, no restrictive ownership rights
6
2. TOPAAS: philosophy
• Makes an estimate of the probability of failure of 1 software module
• Based on 15 metrics: – Product and process metrics – Calibrated on expert opinion per aspect – Calibration on 20 different sorts of software (all
modules)
• The probabilities of failure of multiple software modules are settled through a (standard) fault tree
7

2. TOPAAS: The Basis
Formula P = PB * F1 * F2 * F3 … F15
with PB = 1
If property is unknown: Fi = 1 (do not take into account)
Probabilities in powers of 10. Thus, for easy usage: Log(P) = Sum( Log(Fi) )
If property is unknown: Log(Fi) = 0 (do not take into account)
8

2. TOPAAS: metrics (1)
15 metrics Software development process 1. Software development process used that complies with
the IEC 61508 - SIL 2. Use of software inspections 3. Frequency and impact of design changes 4. “Safety culture” within development team 5. Experience and level of education of development team
(both in IT and in specific domain) 6. Nature of collaboration between development team and
client 7. Traceability of requirements 8. Test-techniques used and test coverage attained
9

2. TOPAAS: metrics (2)
Product characteristics 1. Complexity of decision logic 2. Size of the module 3. Clarity and transparency of module architecture 4. Amount of trust in compiler (e.g. certified)
Execution environment: 1. Run-time environment 2. Availability of representative field data elsewhere 3. Availability of field monitoring
10

2. TOPAAS: Example of Reliability Scores
9 Transparency of the used architecture concepts 1 Unknown 0
2 No clear demarcation defined in the design for the task performance of the modules
½
3 Task performance of the modules is defined in broad lines, but without follow up in the development
⅓
4 A separation of the task performance between the modules is described, with respect to the principle “maximum cohesion and minimal coupling”, but this is monitored passively during the development process
0
5 There is a clear separation of the task performance between the modules, described on the basis of valid documents, with respect to the principle “maximum cohesion and minimal coupling”, and this is monitored actively during the development process
-½
11
Product properties
2. TOPAAS: Example of the application of TOPAAS on COTS software (I)
• A “commercial-of-the-shelf” valve control device
• Working on a dedicated PLC • Many aspects are unknown
12

13
Development process
4 The “Safety” culture within the development team Choice: Learning Organisation Based on the experienced delivery and installation procedures
-1/2
5 The experience and level of education of the development team (both in IT and in the specific domain) Choice: Demonstrable excellent knowledge and lots of experience of IT and of the specific domain. Based on the reputation of the producing company, in combination with experience during delivery and installation
-1/2
Product characteristics
9 The complexity of the decision logic of thee task execution Choice: Decision logic and error recognition are very simple, McCabe Index smaller than 10. Based on an estimate of the decision logic that was automated: the actions to be taken are extremely straight-forward.
-1/2
10 The size of the decision logic of the task execution Choice: LOC less than 1000 Based on an estimate by function point analysis
-1/2
Execution environment
13 Run-time environment Choice: Dedicated CPU and memory on no or trivial OS Based on application runs on a dedicated PLC
-1/3
14 Availability of representative field date for the specific function Choice: Lots of representative field data present of identical comparable applications Based on the huge amount of the same valve controls used in the gas and oil industry, in comparable circumstances.
-2
Total -4 1/3

2. TOPAAS: Example of the application of TOPAAS on COTS software (II)
The failure probability per demand is then: P = 10-4 1/3
The method prescribes to round to the next natural power of 10
Failure probability of the software = 10-4
14

3. Further development
• More important role of test and quality assurance processes within TOPAAS
• The requirements of SIL-qualification are not always consistently incorporated in the TOPAAS-model
• Assessment of dependencies between software modules
15
Thank you for your attention
For more information
Sipke van Manen (Ministry of Infrastructure and Environment)
E-mail: [email protected]
Wietske Postma (NRG)
E-mail: [email protected]
Use this link to find the report on TOPAAS (in Dutch)
Welkom bij NRG - 27 november 2013 / 16

Software reliability quantification
Markus Porthin, VTT
DIGREL seminar, Espoo, Finland
November 26, 2013
2 12/12/2013
Objective
To develop a method to assess reliability of safety-
related software for the purpose of PSA of NPP

3 12/12/2013
Software reliability
Quantity to be estimated: P(Failure of task execution) of application
software
Failure of task execution can be further divided into:
Fatal failures (generation of output ceases, sets out all
applications in the processor)
Non-fatal failures
Failure to actuate function
Spurious actuation
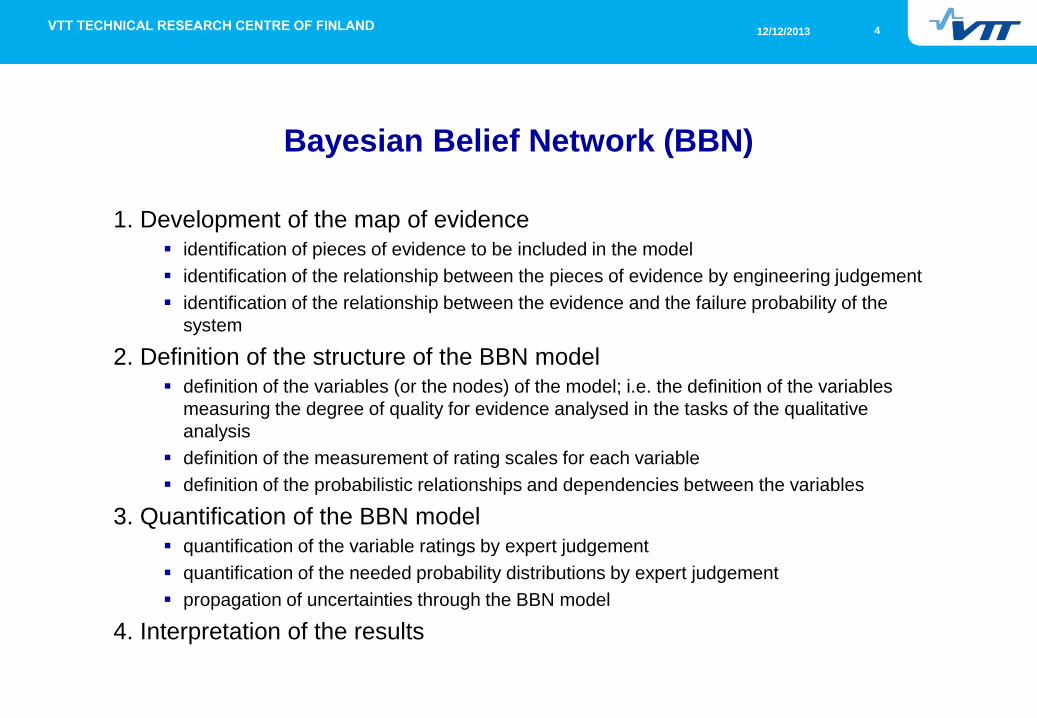
4 12/12/2013
Bayesian Belief Network (BBN)
1. Development of the map of evidence identification of pieces of evidence to be included in the model
identification of the relationship between the pieces of evidence by engineering judgement
identification of the relationship between the evidence and the failure probability of the
system
2. Definition of the structure of the BBN model definition of the variables (or the nodes) of the model; i.e. the definition of the variables
measuring the degree of quality for evidence analysed in the tasks of the qualitative
analysis
definition of the measurement of rating scales for each variable
definition of the probabilistic relationships and dependencies between the variables
3. Quantification of the BBN model quantification of the variable ratings by expert judgement
quantification of the needed probability distributions by expert judgement
propagation of uncertainties through the BBN model
4. Interpretation of the results

5 12/12/2013
Evidence in SW reliability BBN models
The evidence (observable or potentially observable quantities) on
SW reliability can partitioned into
those affecting P(failure) (“performance shaping factors” as in human
reliability analysis context)
those affected by P(failure), such as test results and operating
experience

6 12/12/2013
BBN for quantification of software reliability

7 12/12/2013
BBN for quantification of software reliability

8 12/12/2013
SW development process
A high quality SW development process can be expected to
produce SW of good quality containing few errors
Verification and validation (V&V)
Installation tests
The Safety integrity level (SIL, IEC 61508) is proposed to be used
as an indicator of the SW development process

9 12/12/2013
Safety integrity level as an indication of SW process
IEC 61508 defines SIL classes for systems
Software has no SIL in its own right, but IEC 61508-4 states that is
it still convenient to talk about “SIL N software”
SW included in a SIL N system
Rationale to use as evidence: higher SIL higher requirements
on SW development methods and techniques higher reliability
Given a SIL, which probability distribution estimate is justifiable?
Safety integrity level (SIL)
Probability of dangerous failure on demand
Frequency of dangerous failure [h-1] in continuous/high demand mode
4 10-5 to 10-4 10-9 to 10-8
3 10-4 to 10-3 10-8 to 10-7
2 10-3 to 10-2 10-7 to 10-6
1 10-2 to 10-1 10-6 to 10-5

10 12/12/2013
BBN for quantification of software reliability
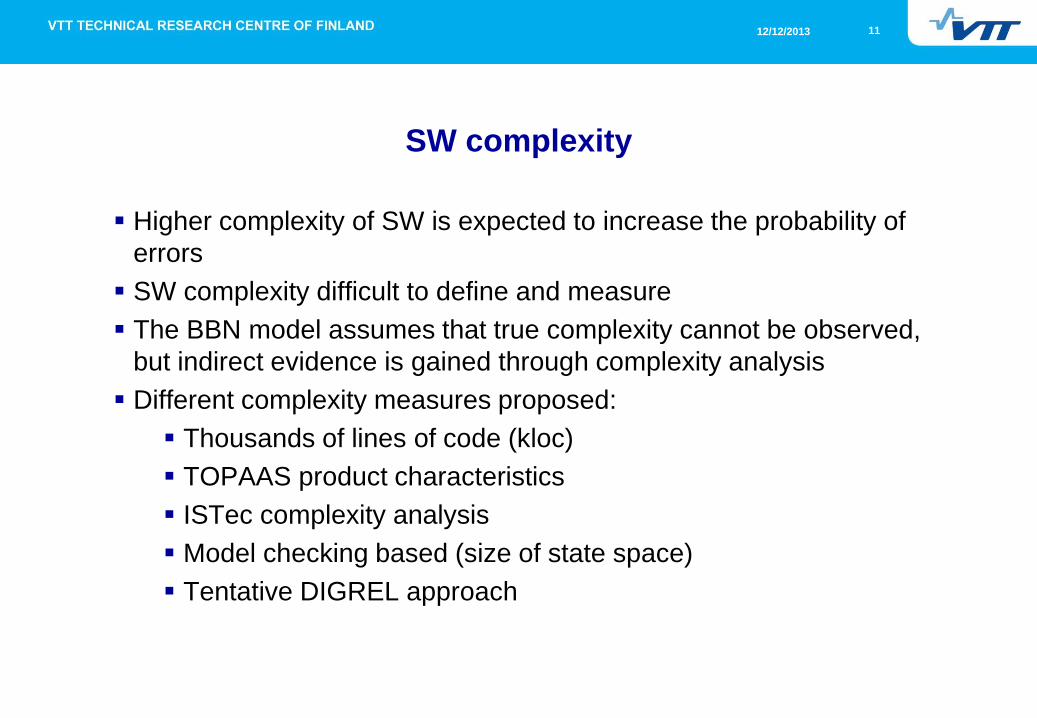
11 12/12/2013
SW complexity
Higher complexity of SW is expected to increase the probability of
errors
SW complexity difficult to define and measure
The BBN model assumes that true complexity cannot be observed,
but indirect evidence is gained through complexity analysis
Different complexity measures proposed:
Thousands of lines of code (kloc)
TOPAAS product characteristics
ISTec complexity analysis
Model checking based (size of state space)
Tentative DIGREL approach
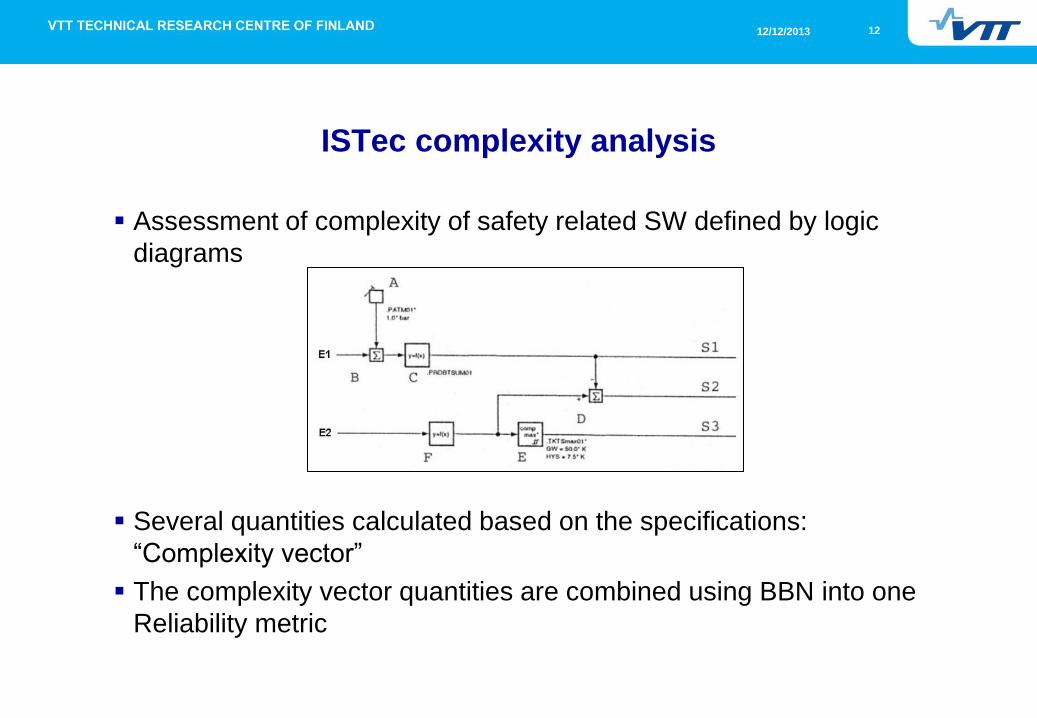
12 12/12/2013
ISTec complexity analysis
Assessment of complexity of safety related SW defined by logic
diagrams
Several quantities calculated based on the specifications:
“Complexity vector”
The complexity vector quantities are combined using BBN into one
Reliability metric

13 12/12/2013
ISTec complexity
vector

14 12/12/2013
ISTec: Complexity vector quantities combined using BBN

15 12/12/2013
Tentative DIGREL approach for complexity
DIGREL is looking for a simple (simpler than ISTec) approach to
measure the complexity
The main thing is to find an association between a complexity
metric and what is meant by low/medium/high complexity
If needed and possible, the ”simple method” can be validated by
more sophisticated methods to measure complexity
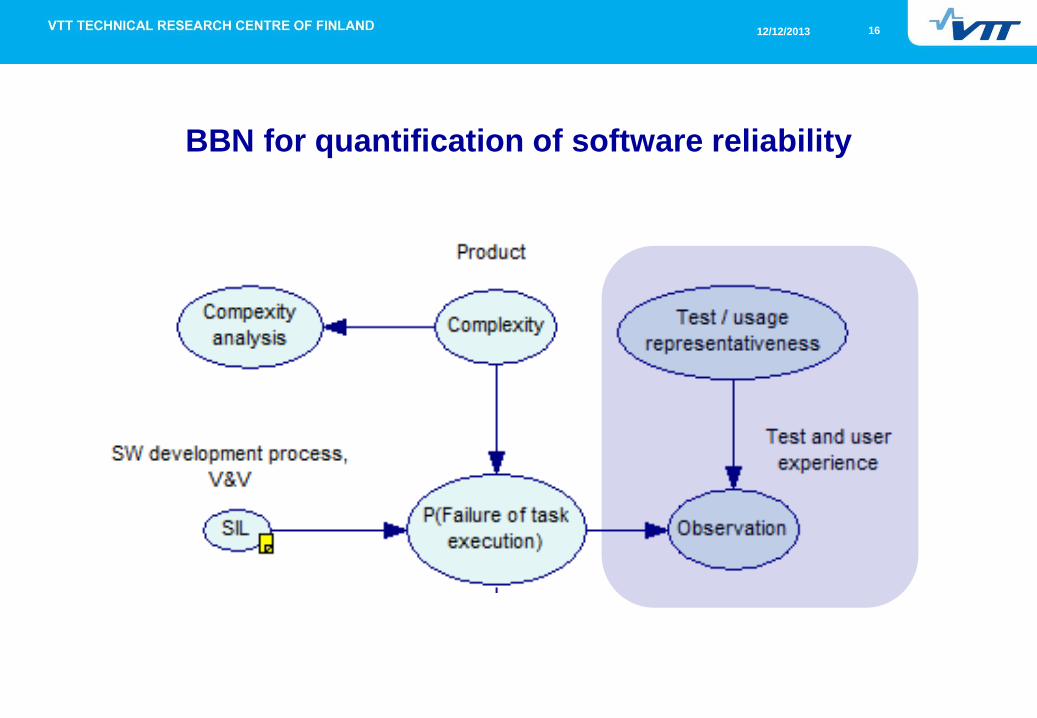
16 12/12/2013
BBN for quantification of software reliability
17 12/12/2013
Operating experience
Experience from normal operation and periodical tests
Usually no failures observed
Known faults corrected
The value of the observations depends on the representativeness
of the data
Usually demand for safety functions very low
A safety system may have been “in use” at stand-by without
demand for actuation for years, which does not tell anything
about its reliability (pfd)
18 12/12/2013
Plan for 2014
Clarification of details of the quantification approach
Application software
Cat. “A+”, A, B systems (A+ vs. A?)
Complexity metric in relation to the quantification
CCF between application software and functional
requirement specification
How to take user experience into account (is it relevant?)
Operating system
How to estimate fatal system vs. sub-system failure
probability due to OS failure
Prepare guidelines with example

19 12/12/2013
Conclusions
An approach for estimating failure probability of application
software using
complexity analysis
SIL classification
operating experience
… as evidence
BBN is a potential approach
Different types of evidence can be combined in the same model
The aim is to develop a practical model using available evidence

20 12/12/2013
VTT creates business from technology

DISCUSSION
• PSA model complexity wrt digital I&C
• Data for hardware failures, data for software failures
• ICDE collection of data – which data to collect (definition of failure modes)
• The nodes of the BBN: roles of the complexity and V&V (SIL). More nodes to be added?
• How much effort are you willing to put into the analysis of the software, e.g. analysis of
complexity?
• Other comments or questions
1