guidelines for sample collecting and analytical methods ... · guidelines for sample collecting and...
TRANSCRIPT

GEOLOGICAL SURVEY CIRCULAR 735
Guidelines for Sample Collecting
and Analytical Methods Used in
the U.S. Geological Survey for
Determining Chemical Composition
of Coal

Guidelines for Sample Collecting
and Analytical Methods Used in
the U.S. Geological Survey for
Determining Chemical Composition
of CoalBy Vernon E. Swanson and Claude Huffman, Jr.
GEOLOGICAL SURVEY CIRCULAR 735
1976

United States Department of the InteriorTHOMAS S. KLEPPE, Secretary
Geological SurveyV. E. McKelvey, Director
Library of Congress Cataloging in Publication Data: Swanson, Vernon Emanuel, 1922
Guidelines for sample collecting and analytical methods used in the U.S. Geological Survey for deter mining chemical composition of coal.
(Geological Survey Circular; 735)Bibliography: p.Supt. of Docs. I 19.4/2:7351. Coal Analysis. I. Huffman, Claude,
1922- joint author. II. Title: Guidelines for sample collecting and analytical methods used in the U.S. Geological Survey . . . III. Series: United States Geological Survey Circular 735. QE75.C5 no. 735 [TP325] 557.3'08s [662'.662'028] 76-20627
Free on application to Branch of Distribution, U.S. Geological Survey, 1200 South Eads Street, Arlington, VA 22202

CONTENTS
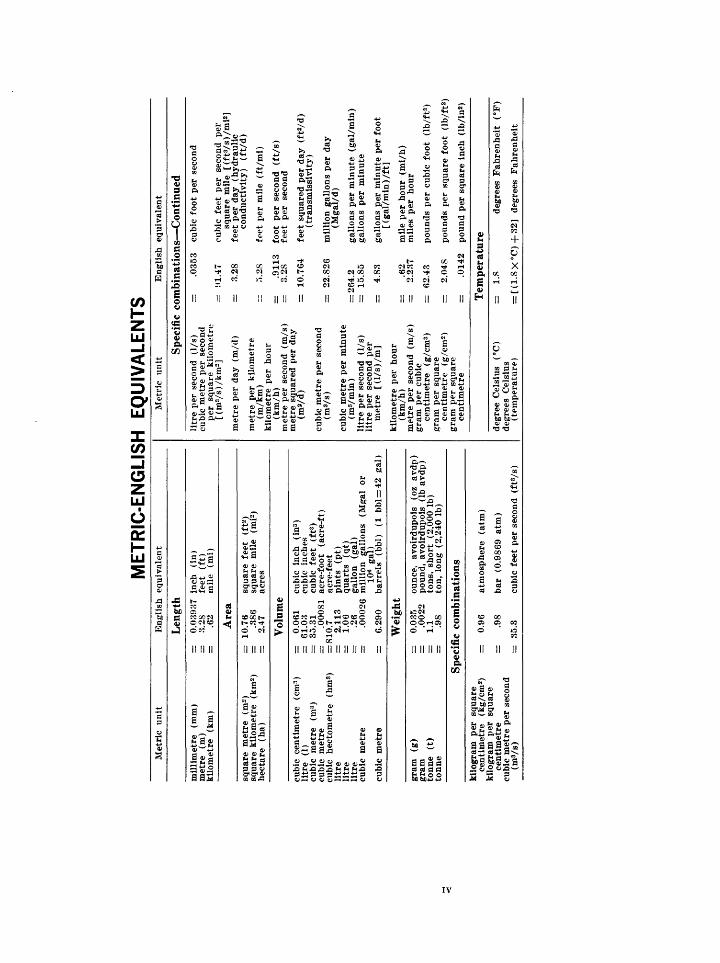
Metric-English equivalents...................................Abstract.................................................................Introduction..........................................................Guidelines on collecting coal samples.................Submitting samples..............................................Analytical methods for determination of major,
minor, and trace elements in coal.............Sample preparation......................................Individual analytical methods......................
Analysis of coal ash...............................Ashing............................................Atmoic absorption spectroscopy....X-ray fluorescence..........................Emission spectroscopy...................
IV1113
34444466
Analytical methods for determination of major,minor, and trace elements in coal Continued
Individual analylical methods ContinuedAnalysis of raw coal........................................
Mercury.....................................................Antimony..................................................Arsenic......................................................Fluorine....................................................Selenium...................................................Uranium and thorium.............................
Accuracy of analytical methods ......................Comments and recommendations.................................References cited..............................................................
Page
10
10
ILLUSTRATION
FIGURE 1. Flow chart showing sequence of sample preparation and chemical analysisPage
.. 5
TABLES
Page
TABLE 1. Lower limits of determination, six-step spectrographic method........................................................................................ 72. Comparative results, trace elements in EPA-NBS standard sample of coal...................................................................... 83. Comparison of U.S. Geological Survey analyses with Illinois State Geological Survey analyses..................................... 9
ME
TRIC
-EN
GLI
SH
E
QU
IVA
LEN
TSM
etri
c u
nit
Eng
lish
eq
uiva
lent
Len
gth
mil
lim
etre
(m
m)
met
re
(m)
kilo
met
re
(km
)
=
0.08
987
inch
(I
n)
=
3.28
fe
et
(ft)
=
.6
2 m
ile
(mi)
Are
a
squa
re
met
re
(m2)
=
10
.76
squa
re f
eet
(ft2
) sq
uar
e ki
lom
etre
(k
m2)
=
.3
86
squa
re m
ile
(mi2
) h
ecta
re
(ha)
=
2.
47
acre
s
Vol
ume
cubi
c ce
nti
met
re
(cm
3)
litr
e (1
) cu
bic
met
re
(m3)
cu
bic
met
re
cubi
c hec
tom
etre
(h
ms
litr
e li
tre
litr
e cu
bic
met
re
cubi
c m
etre
=
0.06
1 cu
bic
inch
(i
n3)
=
61
.03
cubi
c in
ches
=
35
.31
cubi
c fe
et
(ft3
) =
.0
0081
ac
re-f
oot
(acr
e-ft
) )
=8
10
.7
acre
-fee
t =
2,
113
pin
ts
(pt)
=
1.
06
quar
ts
(qt)
=
.2
6 ga
llon
(g
al)
=
.000
26
mil
lion
ga
llon
s (M
gal
or
10«
gal)
=
6.
290
bar
rels
(b
bl)
(1
bbl =
42
gal)
Wei
ght
gram
(g
) gr
am
tonn
e (t
) to
nne
=
0.03
5 ou
nce,
av
oird
upoi
s (o
z av
dp)
=
.002
2 po
und,
avo
irdu
pois
(I
b av
dp)
=
1.1
tons
, sh
ort
(2
,000
Ib)
=
.9
8 to
n, l
ong
(2,2
40 I
b)
Spec
ific
com
bina
tion
s
kilo
gram
pe
r sq
uare
ce
nti
met
re
(kg/
cm2)
ki
logr
am
per
squa
re
cen
tim
etre
cu
bic
met
re p
er s
econ
d (m
Vs)
=
0.96
at
mo
sph
ere
(atm
)
=
.98
bar
(0
.986
9 at
m)
=
35.3
cu
bic
feet
per
sec
ond
(fts
/s)
Met
ric
unit
Spe
cifi
c
litr
e pe
r se
cond
(1
/s)
cubi
c m
etre
per
sec
ond
per
squ
are
kilo
met
re
[(m
3/s)
/km
2]
met
re p
er d
ay
(m/d
)
met
re p
er k
ilom
etre
(m
/km
) ki
lom
etre
per
hour
(km
/h)
met
re p
er s
econ
d (m
/s)
met
re s
quar
ed p
er d
ay
<m«/
d)
cubi
c m
etre
per
sec
ond
(mV
s)
cubi
c m
etre
per
min
ute
(ms/
min
) li
tre
per
sec
ond
(1/s
) li
tre
per
seco
nd p
er
met
re
[(l/
s)/m
]
kilo
met
re p
er h
our
(km
/h)
met
re p
er s
econ
d (m
/s)
gram
per
cub
ic
cen
tim
etre
(g
/cm
3)
gram
per
squ
are
cen
tim
etre
(g
/cm
2)
gram
per
squ
are
centi
met
re
Eng
lish
eq
uiva
lent
com
bina
tion
s C
onti
nued
=
.035
3 cu
bic
foot
per
sec
ond
squa
re m
ile
[(ft
3/s)
/mi2
]
conduct
ivit
y)
(ft/
d)
=
5.28
fe
et p
er m
ile
(ft/
mi)
=
.911
3 fo
ot
per
seco
nd
(ft/
s)
3. 2
8 fe
et p
er
seco
nd
=
10.7
64
feet
squ
ared
per
day
(f
t2/d
) (t
ran
smis
siv
ity
)
=
22.8
26
mil
lion
gal
lons
per
day
(M
gal/
d)
= 2
64.2
ga
llon
s pe
r m
inute
(g
al/m
in)
=
15.8
5 ga
llon
s pe
r m
inu
te
=
4.83
ga
llon
s pe
r m
inut
e pe
r fo
ot
[(gal
/min
) /ft
]
.62
mil
e pe
r ho
ur
(mi/
h)
=
2.23
7 m
iles
per
ho
ur
=
62.4
3 po
unds
per
cub
ic f
oot
(lb/f
t3)
=
.014
2 po
und
per
squar
e in
ch (l
b/i
n2)
Tem
pera
ture
degr
ee C
elsi
us
(°C
) de
gree
s C
elsi
us
(tem
per
atu
re)
=
1.8
degr
ees
Fah
renhei
t (°
F)
= [
(1.8
x°C
)+32]
degr
ees
Fah
renhei
t

Guidelines for Sample Collecting and Analytical MethodsUsed in the U.S. Geological Survey for
Determining Chemical Composition of Coal
By Vernon E. Swanson and Claude Huffman, Jr.
ABSTRACT
This report is intended to meet the many requests for informa tion on current U.S. Geological Survey procedures in handling coal samples.
In general, the exact type and number of samples of coal and associated rock to be collected are left to the best judgement of the geologist. Samples should be of unweathered coal or rock and rep resentative of the bed or beds sampled; it is recommended that two channel samples, separated by 10 to 100 yards (10 to 100 metres) and weighing 4 to 5 pounds (1.8 to 2.3 kilograms) each, be collec ted of each 5 feet (1.5 metres) of vertical section. Care must be taken to avoid any sample contamination, and to record the exact local ity, thickness, and stratigraphic information for each sample.
" Analytical methods are described for the determination of major, minor, and trace elements in coal. Hg, As, Sb, F, Se, U, and Th are determined in the raw coal, and the following 34 elements are determined after ashing the coal: Si, Al, Ca, Mg, Na, K, Fe (total), Cl, Ti, Mn, P, S (total), Cd, Li, Cu, Zn, Pb, B, Ba, Be, Co, Cr, Ga, La, Mo, Nb, Ni, Sc, Sr, Ti, V, Y, Yb, andZr. The methods used to determine these elements include atomic absorption spec- troscopy, X-ray fluorescence spectroscopy, optical emission spec- troscopy, spectrophotometry, selective-ion electrode, and neutron activation analysis. A split of representative coal samples is sub mitted to the U.S. Buriau of Mines for proximate, ultimate, forms of sulfur, and Btu determinations.
INTRODUCTIONFrequent requests for information from industry,
university, and government groups for our coal geo- chemical methods have prompted the preparation of this report. The demand for high-quality complete chemical data on coal can only become greater with increased coal use; in order to establish reliability and comparability of analytical data, some stan dards and guidelines are required. The data are fundamental in determining the economic value of the coal, in evaluating environmental effects of coal mining and of coal use, and in determining poten tial byproduct recovery and the adaptability of the coal to beneficiation, gasification, liquefaction, and
other technologic processes of coal treatment. The data also can be used to correlate coal beds, to indi cate the bog, marsh, or lagoonal environments of peat accumulation, and to determine postdeposi- tional processes of preservation and alteration of the coal.
Most of the guidelines and methods described here were adopted during the comprehensive Southwest Energy Study conducted by the U.S. Department of the Interior in late 1971. The resulting report (Swan- son, 1972), which included analyses of 71 coal samples and 16 powerplant ash samples, marked the beginning of a new period of modern coal analyses. Since then, more than 3,000 samples of coal and asso ciated rock have been analyzed by the U.S. Geologi cal Survey; most of the analyses have been made publically available in several reports (Swanson, 1972; U.S. Geological Survey and Montana Bureau of Mines and Geology, 1973, 1974; Swanson, Huff man, and Hamilton, 1974; Swanson and others, 1976). Major segments of the data have also been summarized in a series of papers presented at national scientific meetings (Medlin and others, 1975a, b; Coleman and others, 1975; Millard and Swanson, 1975; Hatch and Swanson, 1976), and pre pared by the State Geological Surveys (Glass (Wyo.), 1975; Conwell (Alaska), 1976). Pertinent data have also been incorporated into several environmental impact statements and in many published reports on local areas by geologists of the U.S. Geological Survey.
GUIDELINES ON COLLECTINGCOAL SAMPLES
Specific instructions on the exact type, number, and distribution of samples to be collected cannot
1

be given, but some general guidelines should be followed:
1. The judgment of the geologist must be applied toward obtaining samples which will be most representative of the coal bed.
2. Only samples of fresh or unweathered coal should be submitted for analysis, preferably collected from a newly exposed mine face or from a drill core. The samples should be shipped to the laboratory within a few days after collection to minimize the effect of oxi dation and exposure to air on the moisture content and on the forms of sulfur.
3. The objective should be to obtain a complete channel sample or core of the minable bed; if the coal bed is more than 5 feet (1.5 m) thick, a good rule-of-thumb is to collect one sample of each 5-foot (1.5-m) interval of coal (for example, four samples of a bed 20 ft, or 6 m, thick). Special-type samples (prominent fusain band or pyrite lens, for example) will also be analyzed at the discretion of the geol ogist.
4. Generally, 4 to 5 pounds (1.8 to 2.3 kg) of coal should be included in each sample; for rock samples, 2 pounds (0.9 kg) is sufficient.
5. A satisfactory channel sample, for example, can be obtained from a coal bed in a mine by first exposing a new, fresh face of the coal, then chipping an approximately 3-inch by 3-inch (7.5 cm by 7.5 cm) channel downward from the top of the bed with a chisel or pick-point hammer, producing coal fragments 2 inches (5 cm) or less across. Positioning a horizontal plastic sheet below the level of channel cutting is sometimes helpful, particularly if coal accumulates in excess of the desired sam ple size, and cone-and-quartering separation of the coal is needed to obtain the representa tive sample.
6. Plastic bags (10 x 15 in., or 25.4 x 38 cm, or larger; thickness 0.006 in. or 0.15 mm) should be used for the sample, and care should be taken to avoid contact of the coal with metal during and after collecting sam ple (the use of a geologic hammer, of course, cannot be avoided); sample number, date of collection, and key description should be written with a felt-tipped marker pen (per manent ink) on each bag, and on a label at tached to the tie on the bag.
7. A rule-of-thumb should be never to collect just
a single sample from one locality always collect two samples, or, if a mine face is sev eral hundred yards (metres) long, collect three channel samples. The main reasons for collecting two or three samples are that short- distance compositional changes can be as sessed and that possible analytical errors can be spotted.
8. Core samples of coal are better than samples of weathered coal, but contamination by drill ing fluids generally makes trace-element analysis unreliable. Name and composition of drilling fluids used should accompany list of core samples submitted for analysis.
9. Shale splits, siltstone partings, or bone coal less than a few inches (5-10 cm) thick gen erally should be included in a channel sam ple if it is probable that this material will be included in mined coal. Special samples of these non-coal materials should also be col lected, based on the judgment of the geol ogist, to determine their possible contribu tion to abnormal element concentrations.
10. If project objectives include the obtaining of knowledge of coal shipped or of plant feed, extra care should be taken to collect at least two representative raw coal, cleaned coal, blend-pile, and conveyor-belt samples. Such sample sets should include, where possible, representative samples of the sink-fraction of washed coal, and of furnace-bottom ash and fly ash from precipitator and scrubber units.
11. Where geochemical data on seatrock or under- clay and overburden rock are desired, repre sentative samples should be collected, ac cording to the preceding guidelines. In col lecting overburden samples, one of two methods may be preferable, depending on local conditions: (a) Channel samples of 5- or 10-foot (1.5- or 3-m) intervals; or (b) two samples of each lithology, which can be re lated to measured sections and assigned weighted values.
12. If permission to sample is obtained from a com pany, the offer should be made, and the promise kept, to provide the company with a copy of the analytical results as soon as they are completed; where possible, obtain avail able analytical data from the company for comparison with your analyses. It should be made clear to the company or landowner that the analyses of your samples will be part of

the public record; the collection of samples which requires a promise to withhold analy ses on a "company confidential" basis should be done only for compelling scientific pur poses.
SUBMITTING SAMPLES
After the samples have been collected and are ready to be shipped, a simple list of sample-description in formation should be prepared. The samples should be listed by number, each sample number followed by the name and thickness of the coal bed (or thick ness of unit sampled, related to top of bed), the name and age of the formation and member which include the coal bed, the precise location of the sampled locality (preferably by latitude and longitude to the nearest second, or by quarter section, township and range), the name of mine and company owner, the date the sample was collected, and the name of the collector. (Use of the metric system for units of measurement is encouraged.) For example:
Sample No. Sample description
HC-21 -72.... Channel sample of Waynesburg coal bed, 1.24 m thick, lower member of Waynesburg Formation, Upper Penn- sylvanian; 40°13'20", 80°11'10" [1.6 km ENE. of McGovern], Washington County, Pa.; Zonk mine, Southwest Consolidated Co.; coll. by John Smith, Oct. 16, 1976.
Any additional information considered useful con cerning the unit sampled can be included in the sample description; for example, the distribution and thickness of visible pyrite or partings, the degree of weathering, or even a sketch showing relations of stratigraphic units and lithologies.
A copy of the list of sample descriptions should be enclosed with the samples and, to assure this in formation arrives, another copy should also be sent by mail in another envelope.
Samples to be shipped should be sent by the com mercial carrier most conveniently available to the geologist. In most places, packing the samples in small cartons and sending by mail is the easiest pro cedure. Because the coal and, especially, rock samples can cut through the plastic bag while jostled during mail handling, care should be taken to cushion the sample bags in the cartons with wadded newspapers or other packing material.
We recognize that the sampling procedures out lined above do not adhere to the details of the much more extensive and time-consuming procedures pro posed and used by others (for example Burrows,
1907; Holmes, 1911; Fieldner and Selvig, 1938; Schopf, 1960). Rather, the individual geologist must use good judgement in selecting representative and quality samples. So many variable factors are involved such as time available to collect a large number of samples, natural coal-bed alteration, time of sample exposure during laboratory preparation, and continued improvement of analytical techniques that rather loose, general guidelines seem the most appropriate to encourage the collec tion of many samples of the different kinds of coal from the different areas of the United States.
ANALYTICAL METHODS FORDETERMINATION OF MAJOR,
MINOR, AND TRACE ELEMENTSIN COAL
The analytical work performed on coal samples received in the U.S. Geological Survey laboratories is outlined in figure 1. An undried 600 g (about 1 qt) split of samples representative of the set col lected is sent to the U.S. Bureau of Mines at Pitts burgh, Pa., for the routine coal analysis. This analy sis sequence includes (1) proximate analysis (percent ash, moisture, fixed carbon, and volatile matter), (2) ultimate analysis (percent carbon, hydrogen, oxygen, nitrogen, and sulfur), (3) Btu determina tion, and (4) sulfur analysis (percent organic sul fur, pyrite sulfur, and sulfate sulfur). The analytical methods used by the Bureau of Mines have been described in U.S. Bureau of Mines Bulletin 638 (Staff Office of the Director of Coal Research 1967) and will not be described in this report. The re mainder of all analytical work and sample pre paration shown in the analysis sequence flow diagram (fig. 1) is performed by the U.S. Geological Survey laboratories.
The Geological Survey laboratories routinely provide the following analytical determinations on coal samples:
1. Percent ash.2. Major composition of the coal ash: SiOz,
A12O3 , NaaO, K2O, CaO, MgO, total Feas Fe2O3 , P2O5 , MnO, TiO2 , Cl and total S as SO3 .
3. Trace element composition of the coal ash:(a) Individual quantitative determina
tions Cd, Cu, Li, Pb, and Zn.(b) Semiquantitative spectrographic an
alysis 15 to 30 elements detec ted by this method.

4. Trace element composition ot raw coal quantitative determinations for As, F, Hg, Sb, Se, U, and Th.
5. In addition, individual quantitative chem ical determinations may be made if ab normal amounts of certain elements are indicated by semiquantitative spectro- graphic analysis, or on a spot-check basis Ag, Au, Be, Ge, Mo, Ni, and V.
Except for the specialized analyses run by the U.S. Bureau of Mines, all the analyses indicated for coal (fig. 1) are those routinely run on rock and soil sam ples. The forms of sulfur in rocks and soils are deter mined in our laboratory, and the organic carbon, carbonate, and total carbon contents are also deter mined.
SAMPLE PREPARATION
Each coal sample is poured, as received, into a cone-shaped pile on kraft paper, flattened, and por tions separated and collected with a scoop or spatula from random locations in the sample. A 600-g (about 1 qt) sample of each coal sample is thus collected in a plastic bag, placed in a 1-quart ice cream container, and transmitted to the U.S. Bureau of Mines, Pitts burgh, Pa., for ultimate and proximate analysis, and for Btu and forms of sulfur determinations. The re mainder of the sample is placed in disposable alumi num pie pans and dried at 25° to 32°C and at about 30 percent relative humidity in an air-circulating oven. Some coal samples take as long as 82 hours to dry thoroughly.
The dried coal sample is crushed, and a 300-g (about 1-pint) reserve is split out for storage to be used for future petrographic, mineralogic, or chemi cal studies. The balance of crushed coal is ground in a vertical Braun 1 pulverizer equipped with ceramic plates set to pass about 80 mesh, and mixed. The ground coal sample (analytical split) is distributed to the analytical laboratories.
INDIVIDUAL ANALYTICAL METHODS
ANALYSIS OF COAL ASH
Atomic absorption spectrometry methods are used for the determination of Mg, Na, Cd, Cu, Li, Mn, Pb, and Zn in the ash of coal, and X-ray fluorescence spectroscopy methods are employed for Al, Ca, total Fe, K, P, Si, total S, Ti, and Cl. In addition, 63 ele ments are looked for by a semiquantitive six-step
'Use of a specific trade name does not necessarily constitute endorsement of the pro duct by the U.S. Geological Survey.
emission spectrographic method. Of these, 17 are generally found to be of interest in the coal ash: B, Ba, Be, Co, Cr, Ga, Ge, La, Mo, Nb, Ni, Sc, Sr, V, Yb, Y, and Zr. The other 46 elements are also reported when detected by the spectrographic method (table 1), even though 18 of these elements are quantita tively determined by other methods.
ASHINGA portion of the ground raw coal (25 to 75 g) is
weighed and transferred to a 100-ml fused silica dish. The dish is placed in a cold muffle furnace and, with the furnace door partly open, the temperature is gradually elevated over a 4-hour period to 450°C. The temperature is then increased to 525°C and maintained until the sample is completely ashed. An occasional stirring or mixing of the sample during ashing is desirable. The ash is weighed, and the per centage of ash calculated. The ash is mixed thor oughly with a spatula and transferred to a suitable container. About 3 g of coal ash is required for the analyses by six-step spectrographic, X-ray fluores cence, and atomic absorption methods.
ATOMIC ABSORPTION SPECTROSCOPY A short description of the atomic absorption
methods for the determination of MgO, Na2O, Cu, Li, Mn, and Zn follows: 0.500 g of coal ash is weighed into a 100-ml platinum dish. Ten millilitres of de- mineralized water, 10ml HNO3 , and 10 ml of HFare added to the dish. The dish is covered and allowed to stand overnight. Seven millilitres of HC1O4 is added to the dish. The dish is placed on a steam bath for 1 hour and then placed on a hot plate to fume off the acids to near dryness. The dish is removed from the hot plate and the sides of the dish are washed down with water. Five millitres of HC1O4 is added and the dish is returned to the hot plate. The dish is heated until all acids are evaported. Twenty-five millilitres of water and 5 ml of HC1 are added to the dish. The dish is covered, placed on a steam bath, and digested for 30 minutes. The solution is transferred to a 100- ml volumetric flask and diluted to volume with water. Aliquots or dilutions of this sample are then aspirated into the air-acetylene flame of an atomic absorption spectrometer to determine the elements listed. The sample aliquot used for the determina tion of Mg was made to contain 1 percent La. The in strumental parameters used for the listed elements are those recommended by the Perkin-Elmer Corp.
Cd and Pb are also determined by atomic absorp tion spectroscopy on a separate split. In this method 1.000 g of coal ash is weighed and transferred to a

One
quar
t (about 60
0 g) of
co
al sp
lit
out
for
U.S. Bureau of
Mines
anal
ysis
Raw
coal as
received (about
5 po
unds
, or
2.
3 kg
, broken to 3
cm)
Air
dry
in oven at
32°C
Ulti
mate
and
proximate
anal
yses
(p
roce
dures
desc
ribe
d in
U.
S.
Bur. Mines
Bull.
638,
19
67,
p. 3-
12)
Sample crushed
and
then ground
in ve
rtic
al Braun
pulverizer
usin
g ceramic
plates se
t to
pa
ss 80
mesh,
and
mixe
d
Ulti
mate
an
alys
is
and
sulf
urs
Percent
ash
C H 0 N S (total)
S (sulfate)
S (pyritic)
S (o
rgan
ic)
Proximate
anal
ysis
Percent
mois
ture
, volatile m
atte
r,
fixe
d ca
rbon
, an
d as
h
Ground coal (2
5 to
75 g) as
hed
at
525°
C an
d percent
ash
calculated,
ash
then mixed
Heat va
lue
Btu
per
pound
(cal
per
kg)
Six-
step
sp
ectr
ogra
phic
anal
ysis
(6
3 el
emen
ts looked for)
Elem
ents
generally
repo
rted
:
B Ba Be Co Cr Ga Ge La Mo
Nb Ni Sc Sr V Y Yb Zr
One
pint
(about 300
g)
crushed
coal sp
lit
out
for
storage
Wet
chem
ical
an
alys
is
Hg (flameless at
omic
absorption
Sb (colorimetric)
As (colorimetric)
F (s
elec
tive
ion
elec
trod
e)
X-ra
y fl
uore
scen
ce
anal
ysis
Al Ca Fe K P Si S Ti Cl
FIG
URE
1.
Flo
w c
hart
sho
win
g se
quen
ce o
f sa
mpl
e pr
epar
atio
n an
d ch
emic
al a
naly
sis.

150-ml beaker. Ten millilitres of water and 10 ml HNO3 are added to the beaker. The beaker is covered with a watch glass, placed on a shaking hot plate, and boiled until the volume of the solution is re duced to about 5 ml. The beaker is removed from the hot plate and the sides of the beaker and lid are washed down with about 20 ml water. The beaker is placed on a steam bath and the contents digested for 1 hour. The contents of the beaker are transferred to a 50-ml volumetric flask, cooled, and diluted to volume with water. The solids are allowed to settle overnight. A portion of the clear sample solution is aspirated into the air-acetylene flame of the atomic absorption instrument using deuterium background correction to determine both Cd and Pb. The instrumental parameters used are those re commended by the Perkin-Elmer Corp.
The sample weights and the lower limits of deter mination by atomic absorption methods for each of the elements in coal ash are as follows:
instrument parameters used are given in the follow ing tabular form:
Element Sample wt. (g) Lower limit
Mg. ..........................Na. ...........................Cd. ...........................Cu. ...........................
Li.............................Mn. ..........................Pb............................Zn. ...........................
.................. 0.5
.................. .5
.................. 1.0
.................. .5
5.................. .5.................. 1.0.................. .5
0.01 percent.01 percent
1 ppm10 ppm
25 ppm25 ppm10 ppm
The concentration of each element determined in the coal ash is normally converted to the whole-coal basis using the percent ash value in this calculation. A coal that contains 10 percent ash would lower the above limits of determination by a factor of 10 for the converted values.
X-RAY FLUORESCENCE SPECTROSCOPY X-ray fluorescence methods developed in our lab
oratory by James S. Wahlberg are employed for the determination of Al, Ca, total Fe, K, P, Si, total S, Ti, and Cl in the coal ash. In this method 0.800 g of coal ash is fused with 6 g of flux (mixture of 43 percent Li2B 4O?, 55 percent NagB-iO?, and 2 percent NaBr) in a 20-ml platinum crucible. The NaBr is added to the fusion mixture to facilitate easy re moval of the solidified button from the platinum crucible. This fused button is X-rayed and counted to determine the listed elements.
An Automated General Electric 1 vacuum spectro meter is used to determine the listed elements. The
Element
Al. ..............
Total Fe.....K....... .........pSi...............Total S ......Ti.. .............Cl. ..............
Crystal 1
. PET. ...........
. LiF..............
. LiF..............
. PET............
. PET. ...........PET
. NaCl..........., LiF............... NaCl .........
MA2 on X-ray tube
602020606060606060
X-ray tube target
CrCrWCrCrCrCrCrCr
2$ angle (degrees)
144.67113.0857.5250.6489.40
109.06144.5386.13
113.91
'PET, pentaerythritol. 2MA, megaamperes.
Most of these elements are conventionally re ported as oxides. The lower limits of determination in the ash are:
Element1 Sample Weight (g) Lower limit (percent)
AlzOs .................................... 0CaO ......................................
K20 .P2Os... ............................. ......
SiOz ......................................Total S (as SOS). ................ ..TiOz .....................................Cl.. ........................................
88888
8888
0.2.02.02.02.1
.2
.04
.02
.1
'Use of a specific trade name does not necessarily constitute endorsement of the product by the U.S. Geological Survey.
'MgO, Na2 O, and MnO, as determined by atomic absorption method, are also included in tables showing major-oxide composition of ash.
EMISSION SPECTROSCOPY
A six-step semiquantitative optical emission spectrographic method developed in our laboratory by Myers, Havens, and Dunton (1961) and Myers and Havens (1970) is used to look for 63 elements; the trace elements generally found to be of interest are B, Ba, Be, Co, Cr, Ga, Ge, La, Mo, Nb, Ni, Sc, Sr, V, Y, Yb, and Zr. In this method, 1 part coal ash is mixed with 1.15 parts of a mixture of 9 parts quartz (SiO2) and 1 part Na2CO3 . Ten milligrams of the resulting mixture is in turn mixed with 20 mg of pure gra phite powder, and this final mixture is burned in a d- c arc for 120 seconds, collecting the spectra on photo graphic plates. The resulting spectra are visually compared with reference standards. The element de terminations are identified with geometric brackets whose boundaries are 1.2, 0.83, 0.56, 0.38, 0.26,0.18, 0.12, and so forth, but are reported as midpoints of these brackets, 1., 0.7, 0.5, 0.3, 0.2, 0.15, 0.1, and so forth; there are thus 6 brackets to the decade. The pre cision of a reported value is approximately plus-or- minus one bracket at the 68-percent confidence level, or two brackets at the 95-percent confidence level.

The approximate lower limits of determination for the elements analyzed by the six-step spectro- graphic method in the ash of coal samples are shown in table 1.
TABLE 1. Approximate visual lower limits of determination in ash for the elements in coals analyzed by the six-step spectra- graphic method
[Si and Na not reported because quartz and sodium carbonate are added as part of method. Some combinations of elements raise or lower the limits of determination]
Element
Fe....... .............MeCa. ..................Ti.. ..................
Element
Mn. .................Ag...................As....................Au...... .............B. ....................
Ba. ..................Be....................Bi....... .............Cd. ..................Co...................
Cr.... ................Cu. ..................La...................Mo ................ ..Nb..... ..............
Ni. ..................Pb. ..................Pd. ..................Pt. ...................Sb.. ..................
Sc.............. ......Sn. ...................Sr. ...................Te. ..................U... ...................
V.....................W... ..................Y-............... ......Zn. ...................Zr....................
Percent
.. 0.002
.. .005
.. .005
.. .0005
ppm
21
.. 2,0005050
53
2010010
22
1007
20
1020
5100500
102010
.. 5,000
.. 1,000
15200
2070020
Element
Si....................Al.....................Na. ...................K.....................P.....................
Element
CeGa. ...................Ge. ......... ..........Hf. ...................In.....................
Li.....................Re....................Ta.. ..................Th...... ..............Tl.....................
Yb. ...................Pr. ......... ...........Nd.... ................
Eu
Gd....... .............Tb. ...................Dy....................Ho...................Er
Tm.... ...............Lu.... ................Ir......................Os. ...................Rh....................
Ru.. ..................
Percent
0.02
1 55
ppm
5001020
90020
200inn
.. 1,000500100
2900150200200
inn?nninn50
inn
5070
100100
5
20
ANALYSIS OF RAW COAL
The more volatile elements As, F, Hg, Sb, and Se are determined in the ground raw coal sample. U and Th are also determined on the raw coal sample.
MERCURY
The flameless atomic absorption spectrocopy method (Huffman and others, 1972) is used to deter mine mercury. In this method, 0.200 g of ground coal is digested under oxidizing conditions using the
HNO3-H2SO4-HC1O4 digestion procedure devel oped by V. E. Shaw (oral commun., 1973). Mercury in the sample solution is reduced to its elemental state with stannous chloride and then aerated from solution onto a silver screen placed in the vapor train. This silver screen is subsequently heated, and the mercury vapor is carried by an airstream to an ab sorption cell, where its concentration is determined by atomic absorption spectrometry. The lower limit of the determination is 0.01 ppm.
ANTIMONY
The Rhodamine-B spectrophotometric method of Ward and Lakin (1954) is used to determine anti mony. D. R. Norton (oral commun., 1973) of our laboratory has modified this method for coal samples to obtain a lower limit of determination. In this method 1.0 g of raw coal is mixed with a slurry of magnesium oxide and magnesium nitrate. The slurry is dried at 110°C and then ashed in a muffle furnace gradually raising the temperature to 550°C. This ashing technique takes 4 to 5 hours. The ashed sample and magnesium salts are fused with 3.0 g po tassium pyrosulfate and leached with 6 N HC1 con taining glycerol. Sodium sulfate is added to reduce antimony to Sb+3 . The solution is filtered into a 125- ml extraction flask and the residue washed. After cooling to 15°C, the antimony is oxidized to Sb+5 with eerie sulfate and the excess oxidant reduced with hydroxylamine hydrochloride. After dilution with water to an acid concentration of 1.5 N, the solution is cooled to 15°C and the antimony chloride complex is extracted with isopropyl ether. The extract is washed and then reacted with an acidic solution of Rhodamine-B to form a red-violet dis persion whose absorption at 560 mm is measured with a spectrophotometer. The limit of determina tion of this method is 0.1 ppm Sb.
ARSENIC
The heteropoly blue spectrophotometric method described by Rader and Grimaldi (1961) is used to determine arsenic. Sample decomposition (1 to 2 g) and sample solution is made with HNO3, HC1O4, and H2SO4 acids. In this method, As is distilled as arsenious chloride after reduction with bromide and hydrazine sulfate and is determined spectrophoto- metrically. The limit of determination on raw coal is 1.0 ppm.
FLUORINE
A fluoride specific-ion electrode is used to deter mine fluorine. In this procedure 0.250 g of ground

coal is mixed in a zirconium crucible with a slurry of MgO and MgNO3 . The mixture is dried at 110°C, then ashed in a muffle furnace which is gradually raised to 525°C. The ashed mixture is fused with 1.0 g NaOH over an open burner with the zirconium cru cible covered. The crucible and lid are placed in a plastic beaker, water is added to dissolve the fused mass, and then filtered into a 100-ml volumetric flask. The residue is washed with about 5 ml of a 1 percent w/v solution of NaOH, diluted to volume with water, and mixed. A 50-ml aliquot of the sample solution is transferred to a 100-ml volu metric flask, diluted to volume with 1 M ammonium citrate solution, and mixed. Fifty millilitres of this solution is poured into a plastic beaker and the potential is measured by the fluoride-ion electrode. In some cases, about 10 minutes is required for equilibrium to be reached. The lower limit of deter mination of the method is about 20 ppm.
SELENIUM
An X-ray fluorescence method developed by J. S. Wahlberg (written communication, 1972) is followed in the determination of selenium. In this method 2.000 g of raw coal is decomposed with a sodium peroxide fusion. Selenium is then reduced and precipitated with hydrazine sulfate, potassium iodide, and sodium sulfite, with Te added as carrier. The precipitate is collected on a millipore filter for X- ray determination. The lower limit of determina tion is 0.1 ppm Se.
URANIUM AND THORIUM
A delayed neutron activation method described by Amiel (1962) is used to determine these two ele ments. The raw coal sample of 5.000 g is irradiated in a neutron flux of 2 x 10¹² n/cmVs (neutrons per square centimetre per second) for 1 minute, and within seconds after irradiation is counted for 2 min utes with a ring of 6 boron trifluoride detectors. The lower limit of the determination is 0.1 ppm U and 2.0 ppm Th.
ACCURACY OF ANALYTICAL METHODS
The accuracy of analytical methods as applied to coal samples is rather difficult to evaluate because of the lack of standard samples of coal. Only two National Bureau of Standards standard coal samples are available, NBS Standard Reference Material 1632 and NBS Standard Reference Material 1630. Of these, the NBS-1630 coal has been certified only for its mer cury content. The EPA-NBS coal sample (NBS-1632) has been analyzed for selected trace ele ments by the National Bureau of Standards and also by an interlaboratory roundrobin comparison initia ted by the U.S. Environmental Protection Agency. Elements determined in the roundrobin included: As, Be, Cd, Cr, Cu, F, Fe, Hg, Mn, Ni, Pb, S, Se, Tl Th, U, V, and Zn. The U.S. Geological Survey laboratory was one of the many participating labor atories. Table 2 compares our results with those obtained by the National Bureau of Standards and
TABLE 2. Comparative results for EPA-NBS interlaboratory trace element study[All values in parts per million in moisture-free coal (NBS-1632), except sulfur, in percent. Values in
parentheses given for information only. Leaders (...) indicate no data available]
U.S. Geological Survey
Element
As Cd. .............Cr...............Cu.. ............
Hg. ............Mn. ............Ni. .............Pb. .............
Se. ..............Th.. ............U........ ........V................
Zn ..............Be...............S...... ...........F ................
NBS certified value
5.9 ±0.6 ........ 0.19+0.03........ 20.2 +0.5........ 18.0 +2
........ 0.12+0.02
........ 40 +3
........ 15 +1
........ 30 +9
29+03f%)
........ 1.4 +0.1
........ 35 +3
........ 37 +4fl 5)
All labs, grand mean
6.24 g
22.7
0.2241 319 030.4
4.6
1.734 9
igg 51 751.28
'83 5
Quantitative methods described s
5.3 <1
17
.13421528.3
294.71.43
38
1.1985
Six-step emission ipectrographic method
1515
301020
20
1
'Questionable mean; wide scatter or limited data.

TABLE 3. Comparison of USGS analyses with Illinois State Geological Survey analyses[Col. 1, USGS values (As, Cu, Mn, Pb, Cd, F, Sb, and Zn by wet chemical methods, all others by six-step spectrographic method); col. 2, Illinois values]
Sample Ca Mg Ti
Major elements (percent)
15278.16264.16408.16317.15263.
0.68.73.10.90.04
0.82.56.23.73.10
1.112.313.711.352.25
1.652.053.511.572.65
0.18.17.14.15.11
0.17.15.13.17.14
0.06.05.04.05.04
0.05.04.03.05.04
0.031.040.014.017.013
0.048.051.007.017.014
0.05.04.03.04.05
0.06.05.05.06.05
Sample As Be Cd Co Cr
Trace elements (ppm)
15278..16264..16408..16317..15263..
3.69.5
552579
5.69.6
572473
15015030100150
1394985
1.52.7
22
1.53.0.9
2.83.0
0.47.0<.3214.4
0.32.7<.4283.8
21755
52179
11
101010207
9167267
Sample Ga Hg
Trace elements (ppm) continued
15278....16264....16408....16317....15263....
69131432
810162044
6064915355
6069835241
33235
2.44.32.74.73.5
1520<32020
91521222
0.80.32.29.18.28
0.39.24.30.10.22
1007015
1507
7881136712
Sample Ni Pb Sb Zn
Trace elements (ppm) continued
15278.......16264.......16408.......16317.......15263.......
1
1 51
5 5 6 9 2
5 7
10 20 50
8 22 26 30 40
557 4466 76
9 51 40 72 96
0.4 .7 .5
2.9 5.4
0.2 .8
2.0 4.3 5.7
15 10 15 30 20
27 22 31 32 23
162 305
24 2,420
340
137 159 26
2,668 425
with the grand mean of all participating labora tories. Our quantitative values for As, Cu, Hg, Mn, Ni, Pb, Se, Th, and U agreed well with the NBS values. Our F and S values agreed with the grand mean of the few laboratories reporting. Our six-step spectrographic values for Be, Cr, Cu, Mn, Ni, Pb, and V are acceptable but appear to be somewhat low.
Five previously analyzed coal samples obtained from Dr. Harold J. Gluskoter of the Illinois Geo logical Survey were analyzed in our laboratory for selected major and trace elements. All values are reported on a whole-coal basis, even though many determinations were made on ash. The results obtained in our laboratory are compared with those obtained by the Illinois Survey laboratories in table
3. Our results for the major elements Ca, Fe, K, Mg, Na, and Ti agreed well with theirs. The agreement between laboratories is generally good for the trace elements As, B, Be, Cd, Cr, Cu, F, Ga, Ge, Hg, Mn, Pb, Sb, V, and Zn. The agreement for Co, Mo and Ni is poor enough to suggest need for further study. The analytical methods used by the Illinois Geological Survey on these samples have been described by Ruch, Gluskoter, and Shimp (1974).
National Bureau of Standards coal sample 1630 has been certified to contain 0.13 ppm Hg. This sample has been analyzed in this laboratory many times and our values range from 0.12 ppm to 0.15 ppm Hg, with a standard deviation of about 0.01 ppm.

COMMENTS AND RECOMMENDATIONS
The guidelines for collecting coal samples and the analytical methods described here are those cur rently used by the U.S. Geological Survey. The analytical methods are periodically modified to im prove efficiency and accuracy, and, as new and better methods and instruments become available, they are adopted and used. For example, new polarographic methods are now being tested for analysis of Cd and Pb in coal ash; and research continues in the appli cation of neutron activation analysis (Millard and Swanson, 1975) and X-ray fluorescence analysis for a suite of other elements.
Similarly, the need and emphasis for data on dif ferent elements change. Thus, Cl analysis has been added to, and Te and Tl analyses have been dropped from, the list of elements included in the coal analyses routinely reported by the U.S. Geological Survey.
Copies of all analyses of coal samples are sent to the geologist who collected the samples; extra copies of the analyses are, if requested, also sent to the geol ogist to give to, for example, owners of property from which samples were collected.
All analyses are reported by the laboratory either as percent or as parts per million (ppm). Further, it is recommended that all analytical data, when in cluded in the geologist's written report, should be reported as percent or parts per million:
1. Proximate and ultimate analyses and forms of sulfur analyses, in percent, on an as- received, moisture-free, and moisture- and ash-free basis.
2. Major-oxide composition of ash, in per cent of ash.
3. Trace-element composition, in parts per million, as analyzed on ash of coal, or raw coal, and, when desirable, all trace ele ments on ash of coal may be converted to "whole coal" on an air-dried basis.
4. Btu values (British thermal units per pound of coal) are, of course, not shown in per cent or parts per million, simply as Btu/ Ib or Btu.
All of the locality, stratigraphic, and analytical data are stored in and are retrievable from the U.S. Geological Survey's computer system.
REFERENCES CITEDAmiel, Saadia, 1962, Analytical applications of delayed neutron
emission in fissionable elements: Anal. Chemistry, v. 34, no. 13, p. 1683-1692.
Burrows, J. S., 1907, The importance of uniform and systematic coal-mine sampling: U.S. Geol. Survey Bull. 316-G, p. 486-517.
Coleman, S. L., Medlin, J. H., Meissner, C. R., Trent, V.A., Windolph, J. F., and Englund, K. J., 1975, Environmental consideration of the distribution of trace elements in sel ected low-sulfur bituminous coal and anthracite beds of the Appalachian basin: Geol. Soc. America Abs. with Pro grams, v. 7, no. 7, p. 1032-1033.
Conwell, C. N., 1976, Samples from Healy coal field analyzed: Alaska Dept. Nat. Res. Mines and Geol. Bull., v. 25, no. 1, p. 1-4.
Fieldner, A. C., and Selvig, W. A., 1938, Notes on the sampling and analysis of coal: U.S. Bur. Mines Tech. Paper 586, 48 p.
Glass, G. B., 1975, Analyses and measured sections of 54 Wyo ming coal samples: Wyoming Geol. Survey Rept. Inv. 11, 219 p.
Hatch, J. R., and Swanson, V. E., 1976, Trace elements in Rocky Mountain coals [abs.]: Colorado Geol. Survey, Proc., Sym posium on Geology of Rocky Mountain Coals. (In press.)
Holmes, J. A., 1911, The sampling of coal in the mine: U.S. Bur. Mines Tech. Paper 1, 22 p.
Huffman, Claude, Jr., Rahill, R. L., Shaw, V. E., and Norton, D. R., 1972, Determination of mercury in geologic materials by flameless atomic absorption spectrometry, in Geological Survey research, 1972: U.S. Geol. Survey Prof. Paper 800-C, p. C203-C207.
Medlin, J. H., Coleman, S. L., Englund, K. J., and Huffman, C., Jr., 1975a, Inorganic geochemistry of low- to medium- sulfur coal beds in southwestern Virginia-southeastern West Virginia [abs.]: Am. Geophys. Union Trans., v. 56, no. 6, p. 458.
Medlin, J. H., Coleman, S. L., Wood, G. H., Jr., and Rait, N., 1975b, Differences in minor and trace element geo chemistry of anthracite in the Appalachian basin: Geol. Soc. America Abs. with Programs, v. 7, no. 7, p. 1198.
Millard, H. T., and Swanson, V. E., 1975, Neutron activation analysis of coals using instrumental techniques [abs.], in Prelim. Program, Am. Nuclear Soc., Ann. Mtg., New Orleans, La., June 8-13, 1975: Nuclear News, v. 18, no. 6, p. 35.
Myers, A. T., and Havens, R. G., 1970, Spectrochemistry applied to geology and geochemistry by the U.S. Geological Survey in the Rocky Mountain Region Proceedings of the Second Seminar on Geochemical Prospecting Methods and Tech niques Applicable in the Humid Tropic Environment: UN ECAFE, Mineral Resources Development Series 38, New York, p. 286-291.
Myers, A. T., Havens, R. G., and Dunton, P. J., 1961, A spectro- chemical method for the semiquantitative analysis of rocks, minerals, and ores: U.S. Geol. Survey Bull. 1084-1, p. 207-229.
Rader, L. F., and Grimaldi, F. S. 1961, Chemical analyses for selected minor elements in Pierre shale: U.S. Geol. Survey Prof. Paper 391-A, 45 p. .
10

Ruch, R. R., Gluskoter, H. J., and Shimp, N. F., 1974, Occur rence and distribution of potentially volatile trace elements in coal: Illinois State Geol. Survey, Env. Geol. Notes, no. 72, 96 p.
Schopf, J. M., 1960, Field description and sampling of coal beds: U.S. Geol. Survey Bull. 1111-B, p. 25-70.
Staff, Office of the Director of Coal Research, 1967, Methods of analyzing and testing coal and coke: U.S. Bur. Mines Bull. 638, 85 p.
Swanson, V. E., 1972, Composition and trace element content of coal and power-plant ash; in Southwest Energy Study, Report of Coal Resources Work Group: U.S. Dept. Interior Open-File Rept., Feb. 15, 1972, Appendix J, pt. II, 61 p.
Swanson, V. E., Huffman, Claude, Jr., and Hamilton, J. C., 1974, Composition and trace element content of coal, Northern Great Plains area; in Northern Great Plains Re
source Program, Mineral Resources Work Group Rept., Feb. 1976: U.S. Dept. of Interior Open-File Rept., p. 52-83.
Swanson, V. E., Medlin, J. H., Hatch, J. R., Coleman, S. L., Woodruff, S. D., and Hildebrand, R. T., 1976, Collection, chemical analysis, and evaluation of 799 coal samples in 1975: U.S. Geol. Survey Open-File Rept. 76-468, 503 p.
U.S. Geological Survey and Montana Bureau of Mines and Geology, 1973, Preliminary report of coal drill-hole data and chemical analyses of coal beds in Sheridan and Camp bell Counties, Wyoming, and Big Horn County, Montana:
U.S. Geol. Survey Open-File Rept., 57 p.____1974, Preliminary report of coal drill-hole data and chem
ical analyses of coal beds in Campbell County, Wyoming: U.S. Geol. Survey Open-File Rept. 74-97, 241 p.
Ward, F. N., and Lakin, H. W., 1954, Determination of traces of antimony in soils and rocks: Anal. Chemistry, v. 26, no. 7, p. 1168-1173.
11 6U.S. GOVERNMENT PRINTING OFFICE: 1976-677-340/106