guidelines for selecting proper valve characteristics
TRANSCRIPT

© 2003 Valve Manufacturers Association. Reprinted with permission.
for Selecting the Proper Valve CharacteristicGUIDELINES
by Michael C. Headley
M A G A Z I N E
A S S E E N I N
SPRING 2003 Volume 15, No. 2
© 2003 Valve Manufacturers Association. Reprinted with permission.
Figure 1
Figure 3
Figure 2
“The tank is overflowing!” Not a nice thought, but that
could be a result of a system out of control due to a poor
choice of the valve characteristic. Selecting the proper
valve characteristic is the easiest way to ensure process
stability at all loads. So what valve characteristic to use?
This article makes recommendations for the four basic
process controlling variables: liquid level, pressure,
flow, and temperature. These recommendations are
based on a complete dynamic analysis of the process
and serve as “rules of thumb” to be used as part of
valve selection. The “valve characteristic” refers to the
relationship between the position of its flow-controlling
element (e.g. valve plug) and its resulting flow. Graphi-
cally, this is normally plotted with the valve’s resulting
flow on the vertical axis vs. the valve plug’s travel on
the horizontal axis. The shape of the resulting output vs.
input curve describes the type of valve characteristic.
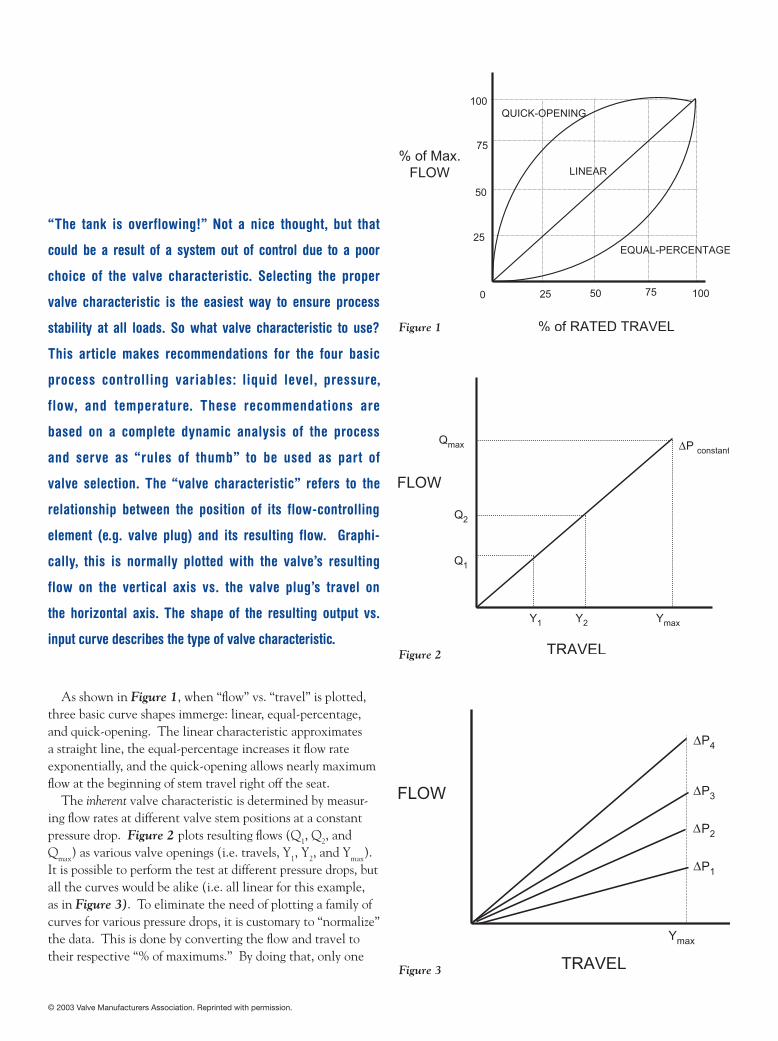
As shown in Figure 1, when “flow” vs. “travel” is plotted, three basic curve shapes immerge: linear, equal-percentage, and quick-opening. The linear characteristic approximates a straight line, the equal-percentage increases it flow rate exponentially, and the quick-opening allows nearly maximum flow at the beginning of stem travel right off the seat.
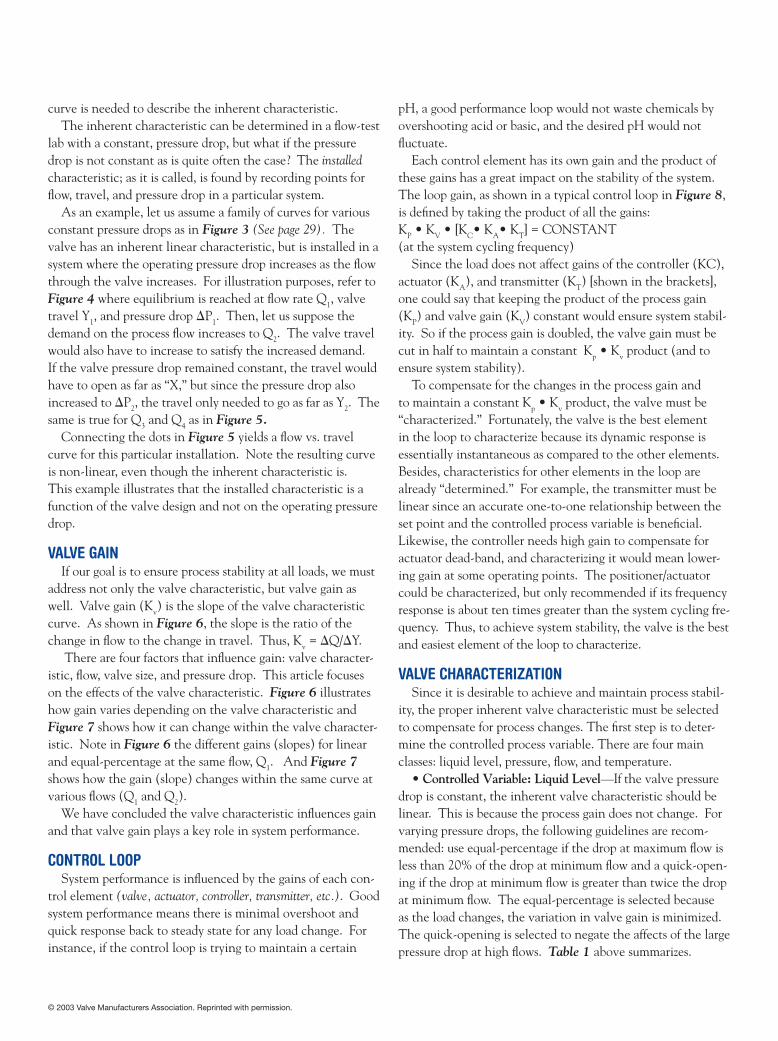
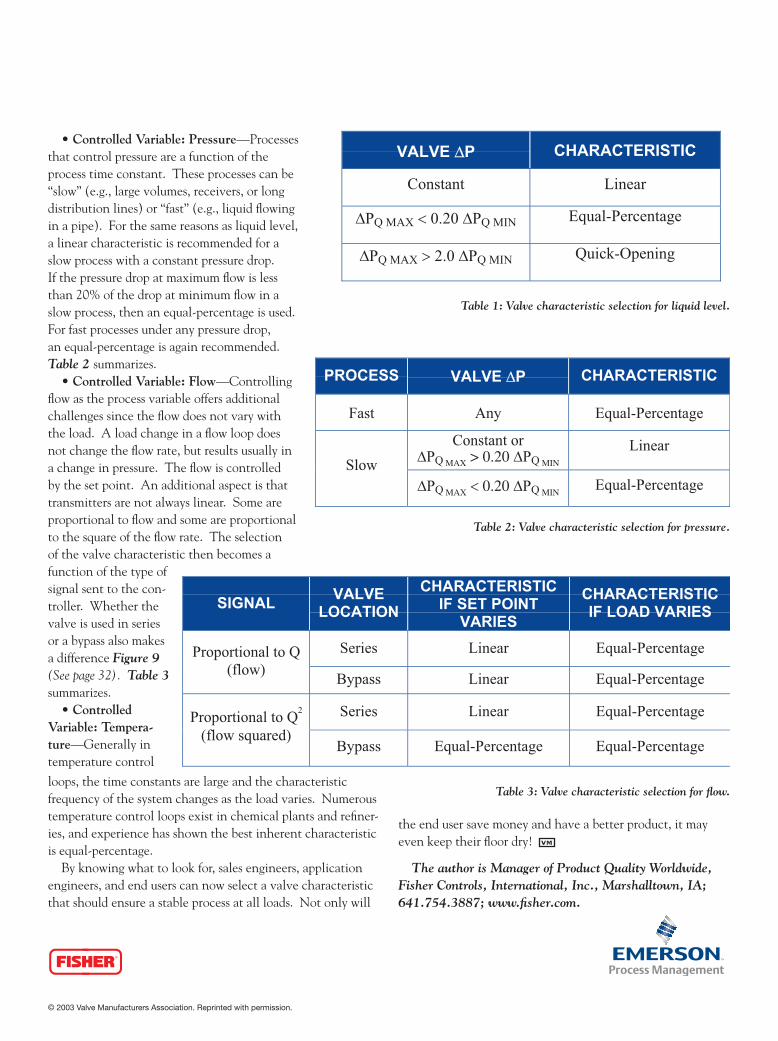
The inherent valve characteristic is determined by measur-ing flow rates at different valve stem positions at a constant pressure drop. Figure 2 plots resulting flows (Q1, Q2, and Qmax) as various valve openings (i.e. travels, Y1, Y2, and Ymax). It is possible to perform the test at different pressure drops, but all the curves would be alike (i.e. all linear for this example, as in Figure 3). To eliminate the need of plotting a family of curves for various pressure drops, it is customary to “normalize” the data. This is done by converting the flow and travel to their respective “% of maximums.” By doing that, only one

© 2003 Valve Manufacturers Association. Reprinted with permission.
Figure 5Figure 4
Figure 6Figure 7
Figure 8
© 2003 Valve Manufacturers Association. Reprinted with permission.
curve is needed to describe the inherent characteristic. The inherent characteristic can be determined in a flow-test
lab with a constant, pressure drop, but what if the pressure drop is not constant as is quite often the case? The installed characteristic; as it is called, is found by recording points for flow, travel, and pressure drop in a particular system.
As an example, let us assume a family of curves for various constant pressure drops as in Figure 3 (See page 29). The valve has an inherent linear characteristic, but is installed in a system where the operating pressure drop increases as the flow through the valve increases. For illustration purposes, refer to Figure 4 where equilibrium is reached at flow rate Q1, valve travel Y1, and pressure drop P1. Then, let us suppose the demand on the process flow increases to Q2. The valve travel would also have to increase to satisfy the increased demand. If the valve pressure drop remained constant, the travel would have to open as far as “X,” but since the pressure drop also increased to P2, the travel only needed to go as far as Y2. The same is true for Q3 and Q4 as in Figure 5.
Connecting the dots in Figure 5 yields a flow vs. travel curve for this particular installation. Note the resulting curve is non-linear, even though the inherent characteristic is. This example illustrates that the installed characteristic is a function of the valve design and not on the operating pressure drop.
VALVE GAIN If our goal is to ensure process stability at all loads, we must
address not only the valve characteristic, but valve gain as well. Valve gain (Kv) is the slope of the valve characteristic curve. As shown in Figure 6, the slope is the ratio of the change in flow to the change in travel. Thus, Kv = Q/Y.
There are four factors that influence gain: valve character-istic, flow, valve size, and pressure drop. This article focuses on the effects of the valve characteristic. Figure 6 illustrates how gain varies depending on the valve characteristic and Figure 7 shows how it can change within the valve character-istic. Note in Figure 6 the different gains (slopes) for linear and equal-percentage at the same flow, Q1. And Figure 7 shows how the gain (slope) changes within the same curve at various flows (Q1 and Q2).
We have concluded the valve characteristic influences gain and that valve gain plays a key role in system performance.
CONTROL LOOP System performance is influenced by the gains of each con-
trol element (valve, actuator, controller, transmitter, etc.). Good system performance means there is minimal overshoot and quick response back to steady state for any load change. For instance, if the control loop is trying to maintain a certain
pH, a good performance loop would not waste chemicals by overshooting acid or basic, and the desired pH would not fluctuate.
Each control element has its own gain and the product of these gains has a great impact on the stability of the system. The loop gain, as shown in a typical control loop in Figure 8, is defined by taking the product of all the gains: KP • KV • [KC• KA• KT] = CONSTANT (at the system cycling frequency)
Since the load does not affect gains of the controller (KC), actuator (KA), and transmitter (KT) [shown in the brackets], one could say that keeping the product of the process gain (KP) and valve gain (KV) constant would ensure system stabil-ity. So if the process gain is doubled, the valve gain must be cut in half to maintain a constant Kp • Kv product (and to ensure system stability).
To compensate for the changes in the process gain and to maintain a constant Kp • Kv product, the valve must be “characterized.” Fortunately, the valve is the best element in the loop to characterize because its dynamic response is essentially instantaneous as compared to the other elements. Besides, characteristics for other elements in the loop are already “determined.” For example, the transmitter must be linear since an accurate one-to-one relationship between the set point and the controlled process variable is beneficial. Likewise, the controller needs high gain to compensate for actuator dead-band, and characterizing it would mean lower-ing gain at some operating points. The positioner/actuator could be characterized, but only recommended if its frequency response is about ten times greater than the system cycling fre-quency. Thus, to achieve system stability, the valve is the best and easiest element of the loop to characterize.
VALVE CHARACTERIZATION Since it is desirable to achieve and maintain process stabil-
ity, the proper inherent valve characteristic must be selected to compensate for process changes. The first step is to deter-mine the controlled process variable. There are four main classes: liquid level, pressure, flow, and temperature.
• Controlled Variable: Liquid Level—If the valve pressure drop is constant, the inherent valve characteristic should be linear. This is because the process gain does not change. For varying pressure drops, the following guidelines are recom-mended: use equal-percentage if the drop at maximum flow is less than 20% of the drop at minimum flow and a quick-open-ing if the drop at minimum flow is greater than twice the drop at minimum flow. The equal-percentage is selected because as the load changes, the variation in valve gain is minimized. The quick-opening is selected to negate the affects of the large pressure drop at high flows. Table 1 above summarizes.

© 2003 Valve Manufacturers Association. Reprinted with permission.
Figure 9
© 2003 Valve Manufacturers Association. Reprinted with permission.
• Controlled Variable: Pressure—Processes that control pressure are a function of the process time constant. These processes can be “slow” (e.g., large volumes, receivers, or long distribution lines) or “fast” (e.g., liquid flowing in a pipe). For the same reasons as liquid level, a linear characteristic is recommended for a slow process with a constant pressure drop. If the pressure drop at maximum flow is less than 20% of the drop at minimum flow in a slow process, then an equal-percentage is used. For fast processes under any pressure drop, an equal-percentage is again recommended. Table 2 summarizes.
• Controlled Variable: Flow—Controlling flow as the process variable offers additional challenges since the flow does not vary with the load. A load change in a flow loop does not change the flow rate, but results usually in a change in pressure. The flow is controlled by the set point. An additional aspect is that transmitters are not always linear. Some are proportional to flow and some are proportional to the square of the flow rate. The selection of the valve characteristic then becomes a function of the type of signal sent to the con-troller. Whether the valve is used in series or a bypass also makes a difference Figure 9 (See page 32). Table 3 summarizes.
• Controlled Variable: Tempera-ture—Generally in temperature control
Table 1: Valve characteristic selection for liquid level.
VM
Table 2: Valve characteristic selection for pressure.
Table 3: Valve characteristic selection for flow.
the end user save money and have a better product, it may even keep their floor dry!
The author is Manager of Product Quality Worldwide, Fisher Controls, International, Inc., Marshalltown, IA; 641.754.3887; www.fisher.com.
loops, the time constants are large and the characteristic frequency of the system changes as the load varies. Numerous temperature control loops exist in chemical plants and refiner-ies, and experience has shown the best inherent characteristic is equal-percentage.
By knowing what to look for, sales engineers, application engineers, and end users can now select a valve characteristic that should ensure a stable process at all loads. Not only will