gulf economic update
TRANSCRIPT
COVID-19 Pandemic
and the Road to Diversification
A World Bank Group Publication for the Gulf Cooperation Council Economies
Gulf Economic Update
ISSUE 6/AUG 2021
Pub
lic D
iscl
osur
e A
utho
rized
Pub
lic D
iscl
osur
e A
utho
rized
Pub
lic D
iscl
osur
e A
utho
rized
Pub
lic D
iscl
osur
e A
utho
rized

© This report was created by The World Bank Group1818 H Street, NW, Washington, DC 20433

Gulf Economic Update
COVID-19 Pandemic and the Road to Diversification
ACRONYMS
3G Third-Generation Mobile Technology ISP Internet Service Provider 4G Fourth-Generation Mobile Technology ITU International Telecommunications Union 4K 4,000 Horizontal Pixel Count Resolution JODI Joint Organizations Data Initiative 5G Fifth-Generation Mobile Technology KNOMAD Global Knowledge Partnership on Migration and Development AI Artificial Intelligence LNG Liquefied Natural Gas Batelco Bahrain Telecommunications Company LTE Long-Term Evolution CBK Central Bank of Kuwait MCIT Saudi Arabia Ministry of Communications and Information
Technology CD Certificate of Deposit MOC Ministry of Communication CDC United States Centers for Disease Control and Prevention MVNO Mobile Virtual Network Operator CITC Saudi Arabia Communication and Information Technology
Company OBC Oman Broadband Company
CITRA Kuwait Communication and Information Technology Regulatory Authority
OECD Organisation for Economic Co-operation and Development
COVID-19 Coronavirus Disease Omantel Oman Telecommunications Company CPI Consumer Price Index OPEC Organization of the Petroleum Exporting Countries CRA Communications Regulatory Authority PIF Public Investment Fund DMO Debt Management Office PMI Purchasing Managers’ Index du Emirates Integrated Telecommunications Company PPP Public-Private Partnership Etisalat Emirates Telecommunications Group Company Qnbn Qatar National Broadband Network FBP Fiscal Balance Program R0 Basic Reproduction Number FDI Foreign Direct Investment S&P Standard and Poor’s FGF Future Generations Fund SAMA Saudi Central Bank FIFA Federation Internationale de Football Association SEZAD Special Economic Zone at Duqm GCC Gulf Cooperation Council SMEs Small and Medium Enterprises GDP Gross Domestic Product SOE State-Owned Enterprise GECF Gas Exporting Countries Forum STC Saudi Telecom Co. GFSM Government Financial Statistics Manual TCP/IP Transmission Control Protocol/Internet Protocol GNFS Goods and Nonfactor Services TEU Twenty-Foot Equivalent Unit GPON Gigabit Passive Optical Network TRA Telecommunications Regulatory Authority GRE Government-Related Enterprise UAE United Arab Emirates GRF General Reserve Fund UNCTAD United Nations Conference on Trade and Development ICT Information and Communication Technology VAT Value Added Tax ictQatar Qatar Supreme Council on Information and Communication
Technology VoIP Voice over Internet Protocol
IEA International Energy Agency WBL Women, Business and Law ILO International Labour Organization WHO World Health Organization IMF International Monetary Fund WiMax Worldwide Interoperability for Microwave Access IPO Initial Public Offering WITS World Integrated Trade Solution ISP Internet Service Provider WTO World Tourism Organization ITU International Telecommunications Union xDSL Digital Subscriber Line Technology
ACKNOWLEDGMENTS This report is the product of the Middle East and North Africa unit in the Macroeconomics, Trade, and Investment (MTI) Global Practice at the World Bank
Group. It was led by Kevin Carey (Practice Manager, EMNM2) and composed of Khaled Alhmoud (Senior Economist, EMNM2), Sahar Sajjad Hussain (Senior
Economist, EMNM2), Jaime de Pinies Bianchi (Senior Economist, EMNM2), Naoko Kojo (Senior Economist, EMNM2), and Ashwaq Maseeh (Research
Analyst, EMNM1). Several authors have contributed to this report. The principal authors are Antonio M. Ollero (Senior Consultant), Khaled Alhmoud
(Senior Economist, EMNM2), and Jaime de Pinies Bianchi (Senior Economist, EMNM2), with contributions from Alexander Haider (Research Analyst,
EMFMD). John Tapia (EMNF2) provided assistance with the publication process.
The report was prepared under the direction of Issam Abousleiman (Regional Director, GCC) and Kevin Carey (Practice Manager, EMNM2).
Editorial Services by Priya Susan Thomas, Akashee Medhi, Susi Victor, and Tabrez Altaf Ahmed.
Translation Services by Global Corporate Solutions - Translation and Interpretation (GCSTI).
Cover Photography by Alya S I S Alaskari and Ashraf Saad Allah-al-Saeed.
Alya S I S Alaskari and Ashraf Saad Allah-al-Saeed managed media relations and dissemination.

Gulf Economic Update • Issue 6
3
TABLE OF CONTENTS
Foreword 5
Executive Summary 7
The Pulse of the Region 11
Recent Developments 11
Near-Term Prospects 31
Diversification: Horizontal and Vertical Reforms in the GCC 42
Economic Diversification is Multidimensional 42
Tracking Diversification and Structural Reforms 42
Strategic Investment 48
Bibliography 56
The Pulse of the Region 56
Diversification: Horizontal and Vertical Reforms in the GCC 57
Key Economic Indicators 58
Country Summary Tables 58
Commodity Prices Tables 64
Crude Oil Production 65


Gulf Economic Update • Issue 6
5
From the Regional Director, GCC Countries
Middle East and North Africa Region, World Bank Group
ISSAM ABOUSLEIMAN
Foreword
Unfortunate as the health and economic consequences have been, the battle with the coronavirus disease (COVID-19) has brought to the
fore of the Gulf Cooperation Council (GCC) countries vital lessons about policy and governance that will help shape the state’s relationship
with citizens and diversification moving forward. Although many parts of the world are still mired in the contest between the mutation of
the disease and the vaccination of the population, progress with the health response, including a recent commitment by the rich nations to
donate vaccine supplies to the developing world, and advances with economic relief and recovery, including an expected revival of global
growth to 5.6 percent in 2021, offer encouraging prospects for a favorable way forward.
The policy responses of the GCC countries to COVID-19 generally aimed for containment but not elimination, instead emphasizing bridging
to vaccination. The governments adopted containment measures early during the onset of the disease, including activity lockdowns and
mobility restrictions, albeit at the cost of lost working hours and foregone economic production. They also launched aggressive testing
regimens that helped contain the spread of the disease and keep cases under controllable range. And importantly, they secured vaccine
supplies early and started inoculations in December 2020, when many countries were still searching for supply contracts, aiming to cover
the majority of their populations by end-2021.
In a region where foreign nationals account for a significant proportion of the total population, and foreign workers for an even larger
percentage of the employed population, the GCC governments have also preserved the welfare of their in situ non-nationals. Relief
measures targeted at both national and foreign workers have included wage subsidies, unemployment insurance, and support for health
insurance, as well as various forms of social assistance like cash-based transfers, in-kind assistance, and utility and financial support. Social
protection responses helped ameliorate the effect of an 11 percent loss of working hours in 2020, the equivalent loss of 3.3 million full-
time jobs across the six economies.
The GCC should be able to continue to protect and promote the health and welfare of their populations if they can strengthen their
economies after a year of global and national economic distress. The aggregate GCC economy contracted 4.8 percent in 2020 from the
combination of the COVID-19 pandemic and countermeasures and the decline in global oil demand and prices. The Organization of the
Petroleum Exporting Countries (OPEC) producers in the GCC cut their crude oil production by 1.3 million barrels per day in 2020 and
slashed their capital spending on many oil and gas upstream projects. The group’s aggregate current account balance turned from a surplus
to a deficit in 2020 and the aggregate fiscal deficit worsened.
Altogether, the GCC states launched a sizable policy response to the health and economic crisis in 2020. Monetary and macro-financial
support packages dominated the policy mix, ranging from roughly 5 percent to 35 percent of gross domestic product (GDP), with the
central banks cutting policy rates and launching new liquidity facilities to support bank liquidity and private sector credit. Fiscal support
packages were less dramatic in size, ranging from roughly 0.5 percent to 6.5 percent of GDP, and focused on additional spending and
foregone revenues. Reduced oil receipts constrained the size of discretionary fiscal spending and led many governments to both draw on
liquidity buffers and to revert to the international bond markets.
Although a larger non-hydrocarbon sector could not have escaped last year’s global downturn, economic diversification remains vital to the
future of the GCC. Non-oil GDP is proportionately larger now in all the GCC countries than it was 10 or 20 years ago, but much work

Gulf Economic Update • Issue 6
6
remains to be done. Many are still highly reliant on oil exports, which remains over 70 percent of total goods exports in Kuwait, Qatar,
Saudi Arabia, and Oman, and on oil revenues, which exceed 70 percent of total government revenues in Kuwait, Qatar, Oman, and Bahrain.
National Vision strategies articulate credible paths of policy and structural reforms that should lead to more diversified and sustainable
economies in the long run, albeit under a starkly changed global framework that now puts greater value on adaptation to climate change,
the digitalization of economic activity, and the pursuit of social equity.
At a minimum, the GCC states must continue to reform their public sectors and their public finances. Oman has finally implemented the
harmonized value added tax agreed upon by the GCC states in 2016, and Kuwait and Qatar are expected to do the same in 2021 or 2022.
Saudi Arabia and Bahrain have recommitted to their fiscal balance programs, albeit at an adjusted schedule. Meanwhile, all the GCC
governments have established debt management offices to better manage government debt issuance and stocks which have grown by 1.7
times to 8.8 times from a decade ago. But much work remains to be done on the fiscal front to broaden the revenue base, control the
public wage bill, and rationalize government subsidies and transfers.
Promoting private sector development remains at the core of national and regional economic diversification efforts. The GCC managed to
complete only two state-owned enterprise privatization transactions and only two public-private partnership (PPP) agreements in 2020,
but it was a difficult year for commerce and investment anywhere. The GCC, however, made strides with improving the legal and
regulatory framework for private enterprise, including for foreign direct investment, with the United Arab Emirates (UAE) passing an
amended Commercial Corporations Law to allow full foreign ownership of onshore companies starting in June 2021 and Kuwait passing a
new competition law to secure the independence of the Kuwait Competition Agency. Saudi Arabia approved a new Private Sector
Participation Law, and Qatar enacted a new Public-Private Partnership Law, both to modernize the legal framework for privatizations and
PPPs. Additionally, Saudi Arabia and Qatar introduced reforms to their Kafala system to give expatriate workers greater job mobility,
effectively affording their labor markets greater flexibility.
As with legal and regulatory reform, strategic investments both by the private sector and by the states, through their sovereign wealth
funds, help advance the diversification objective, where the investments are made in the non-oil sectors. The GCC countries have poured
significant investments into their telecommunications sector in recent years such that mobile broadband subscriptions per 100 people are
now at par with the advanced country average while internet users per 100 people and the percentage of households with a computer
exceed the advanced country average. The comparatively advanced state of the telecommunications sector has been fortuitous during the
COVID-19 pandemic when online retail, virtual schooling, and remote work emerged as viable solutions to lockdowns. Apart from greater
investment in more advanced infrastructure, including in 5G, the GCC countries must endeavor to improve their legal frameworks and
strengthen their competition policies to harness the benefits of telecommunications and the digitalization of economic activity and services
that the sector supports.
With recent progress made with the rollout of the COVID-19 vaccine globally and with the revival of production and trade worldwide, the
prospects for an economic recovery are firmer now than at the end of last year. Although downside risks remain, the forecast stands for an
aggregate GCC economic turnaround of 2.2 percent in 2021 and an annual average growth of 3.3 percent in 2022–23. The prospects are
driven not only by an expected rebound of global oil demand and international oil prices, as can be gleaned from favorable developments
through the first half of 2021, but also by continuing and enduring efforts by the GCC countries to reform and diversify their economies.
Gulf Economic Update • Issue 6
7
Executive Summary
The coronavirus disease (COVID-19) pandemic and the decline in
global oil demand and prices dealt the Gulf Cooperation Council
(GCC) countries a health crisis and a commodity market shock.
COVID-19, which caused about 175 million infections and 3.7
million deaths globally, affected the GCC states with around 1.7
million cases but under 12,600 deaths through mid-April 2021 in
a population of 58.7 million. Oil demand, which contracted 5
percent globally in 2020 as world economic activity slumped, and
oil prices, which fell 29 percent, forced the GCC’s Organization
of the Petroleum Exporting Countries (OPEC) producers to cut
crude oil output by 1.3 million barrels per day in 2020 from 17.5
million barrels per day in 2019.
The GCC’s aggregate gross domestic product (GDP) contracted
by 4.8 percent in 2020 from 2019, with the growth outturns
ranging from −3.7 in Qatar to an estimated −6.3 percent in Oman.
The oil supply cutbacks and the four-year-low average oil price of
US$41.30 per barrel slashed the group’s goods and services
exports by 8.1 percent in real terms and turned the current account
surplus of 6.8 percent of GDP in 2019 into a deficit of 2.9 percent
of GDP in 2020. Government revenues dropped 22.2 percent in
nominal terms for the group and worsened the aggregate fiscal
deficit from 3.9 percent of GDP in 2019 to 11.6 percent of GDP
in 2020.
As elsewhere globally, the authorities responded to the pandemic
with stringent health measures including area quarantines, activity
lockdowns, and mobility restrictions, affecting both regional
residents and foreign visitors. The measures helped contain the
spread of the disease and saved lives but hurt economic activity.
Retail sales dropped 4–8 percent between Saudi Arabi and the
United Arab Emirates (UAE), the high-frequency Purchasing
Managers’ Index (PMI) was stuck in contractionary territory until
August in Saudi Arabia and the UAE, working hours decreased
by 11 percent across the six countries, electricity consumption fell
by over 5 percent in Saudi Arabia and Oman, and tourist arrivals
to the region sunk 73 percent from 42.8 million to 11.7 million.
The early health measures were augmented with extensive testing.
Around 36.8 million tests were administered in 2020, and 64.9
million in January to mid-April 2021. The GCC began
vaccinations early, starting in December 2020. By mid-April
2021, around 19.1 million doses had been administered, or 32.5
per 100 people, headlined by the UAE at 95 per 100 people and
Bahrain at 60 per 100 people. By the time reopening moves were
under way in the second half of 2020, the basic reproductive rate
for COVID-19 had dropped to around 1.0 in the GCC compared
to 2.0–4.0 worldwide as estimated by the World Health
Organization (WHO). The rate remained under 1.5 for all six
countries through end-April 2021.
Economic policy measures were sizable overall, although tilted
toward monetary and macro-financial rather than fiscal support.
Central banks cut policy rates in tandem with the US Federal
Reserve which slashed the target for the Federal Funds rate twice
in the year to 0.125 percent beginning in April 2020. The central
banks launched new liquidity facilities to provide liquidity to
banks and to support credit to the private sector. The sum of
monetary and macro-financial measures topped 33 percent of
GDP for Oman, 30.3 percent of GDP for Bahrain, and 20.2
percent of GDP for the UAE. The monetary measures helped
backstop bank capital buffers and sustain credit to existing
borrowers.
Fiscal support focused on additional spending and foregone
revenues. The size of fiscal mitigation measures ranged from 0.4
percent of GDP for Qatar to 6.6 percent of GDP for Bahrain.
Lower oil revenues and rising debt constrained the size of
discretionary spending. The size of the fiscal response in the GCC
was significantly lower than in most advanced economies, but the
combination of fiscal mitigation measures and monetary and

Gulf Economic Update • Issue 6
8
macro-financial support still made for a sizable economic package
ranging from 6.8 percent of GDP for Saudi Arabia to 14.5 percent
of GDP for Qatar and 36.9 percent of GDP for Bahrain.
In addition to health and economic policy measures, the GCC
authorities launched social protection responses to COVID-19
consisting of labor market measures, social insurance, and social
assistance. Saudi Arabia, the UAE, Qatar, and Bahrain offered
wage subsidies. All six countries provided unemployment
insurance, and five (with the exception of Kuwait) extended
support for health insurance. Social assistance consisted of cash
transfers, in-kind support like school feeding, and support for
household utility bills. The social protection measures helped
ameliorate the effects of working hour losses, which at 11 percent
was equivalent to the loss of 3.3 million full-time jobs according
to modeling by the International Labour Organization (ILO). The
GCC governments also offered relief measures targeted at their
migrant workers who were especially at risk to labor market
disruptions and migration reversals.
Following a year of economic distress, the GCC economies are
expected to return to growth in 2021, buoyed by the global
economic recovery, projected at 5.6 percent (upgraded by 1.5
percentage points from the projection in January 2021); the
revival of global oil demand, expected at 96.5 billion barrels per
day (from 91 billion barrels per day in 2020); and the rebound in
international oil prices to an annual forecast average of US$56 per
barrel (now outpaced by an actual average US$61.45 in January–
May 2021). The forecast is for an aggregate GCC GDP growth of
2.2 percent in 2021, roughly tracking the turnaround in high-
income countries, with the outcomes ranging from 1.2 percent for
the UAE to 2.4 percent for Saudi Arabia and Kuwait. Thereafter,
economic growth in the GCC is expected to firm up to an annual
average of 3.3 percent for 2022–23. With rising oil prices in the
first half of 2021, a potential upside scenario for the second half
of the year sees improved current account balances being
channeled directly to public sector savings.
Fiscal deficits are projected to persist for most countries over the
forecast period, however. The three countries with the largest
deficits in 2020—Kuwait, Bahrain, and Oman—are projected to
remain in deficit throughout 2021–23, but at narrower ratios to
GDP in 2023 than during the economic downturn in 2020.
Meanwhile, current account balances are expected to gradually
recover, with Saudi Arabia, the UAE, Qatar, and Kuwait
projected to post current account surpluses throughout 2021–23.
They would improve further should oil prices remain above
US$65 per barrel in the second half of 2021.
Because of the exposure to global oil demand and personal
service industries, downside risks to the outlook are extremely
high. The overriding uncertainty to the global and regional
outlook pertains to the path of the pandemic, with fresh outbreaks
triggering activity lockdowns and dampening economic
production and exchange. Mobility restrictions including for
international travel may hurt attendance at future high-profile
events in the GCC—the 2020 (rescheduled to 2021) World Expo
in the UAE and the 2022 Federation Internationale de Football
Association (FIFA) World Cup in Qatar.
Apart from the global turnaround, the prospects for a recovery in
the GCC are also underpinned by expectations that the GCC
states will strive to diversify their economies, which should
reinvigorate non-oil growth, and will pursue policy and structural
reforms, which should help strengthen their fiscal and external
positions.
Different aspects of diversification affect GCC countries. First,
diversification of fiscal revenues is important to stabilize
government revenues over time. Second, diversification of
exports matters because it affects macroeconomic volatility via
volatility of the terms of trade. Third, monetary and fiscal policies
matter for diversification via their effects on the fundamentals
affecting the real effective exchange rate and price
competitiveness. Structural reforms are a fourth area that can
influence the pace of non-oil economic diversification.
In this issue of the Gulf Economic Update, the focus is on fiscal
revenues and structural reforms including strategic investments in
digitalization and telecommunications which, in addition to being
potent enablers of activity, also represent new and hence more
diversified economic activity. Future editions of this report will
address the question of export diversification, the importance of
real effective exchange rates for diversification, and the proper
mix of policies, especially monetary and fiscal, to promote
diversification.
Despite a difficult year, the governments managed to advance
vital aspects of their fiscal reform agenda. Oman adopted the
value added tax (VAT) in April 2021, emerging as the fourth after
Saudi Arabia, the UAE, and Bahrain to implement the
harmonized 5 percent VAT rate agreed upon by the GCC in 2016.
Kuwait and Qatar are expected to implement the VAT in 2021 or
2022. Saudi Arabia and Bahrain reiterated their commitments to
their fiscal balance programs which aim to balance their budgets,
albeit at dates later than originally planned following changed
economic conditions. To strengthen their fiscal institutions and to
improve debt issuance, all six states have now established debt
management offices tasked with the responsibility of developing
the legal, governance, and risk management frameworks for debt
management; developing medium-term debt strategies to assess
the trade-offs of alternative debt strategies over the medium term;
Gulf Economic Update • Issue 6
9
and promoting debt management policies and practices that
facilitate local debt market development.
The GCC countries also continued with private sector
development initiatives that should help support their economic
diversification objectives over time. The UAE passed an amended
Commercial Corporations Law, allowing full foreign ownership
of onshore companies starting in June 2021. Kuwait enacted a
new competition law to enhance the independence of the Kuwait
Competition Agency. Saudi Arabia approved a new Private
Sector Participation Law to modernize the legal framework for
privatizations and public-private partnerships (PPPs). Qatar
enacted a new Public-Private Partnership Law, governing PPPs.
Saudi Arabia and Qatar introduced reforms to their Kafala system
to give expatriate workers greater job mobility, allowing
expatriate workers to transfer to other jobs upon the expiry of
their work contract without obtaining the approval of their
former employer.
Advancing the telecommunications frontier as a strategic
investment sector for diversification and post-COVID-19
recovery will serve the GCC well. Past investments in the sector
accorded the GCC sizable benefits during the pandemic as
quarantines, lockdowns, and restrictions forced public health
surveillance, wholesale and retail commerce, public and private
education, banking and financial services, and private and
government office work onto digital channels. Strategic
investment in advanced telecommunications technologies,
including fifth-generation mobile technology (5G), is under way
in the GCC. But beyond capital spending on infrastructure, the
telecommunications sector would benefit greatly from
improvements in the legal, regulatory, and competition
frameworks under which service providers operate.


Gulf Economic Update • Issue 6
11
The Pulse of the Region
Recent Developments
Hit by twin shocks—the compound shock of the spread of COVID-19 and countermeasures and the decline in global oil prices—the GCC economies contracted sharply in 2020.
Aggregate gross domestic product (GDP) for the Gulf
Cooperation Council (GCC) states fell steeply by 4.8 percent
in 2020. For the group and for most of the individual countries,
the economic downturn triggered by the coronavirus disease
(COVID-19)—which has caused 3.1 million deaths in 148 million
confirmed cases worldwide and produced an unprecedented
global recession—exceeded the outcomes in the worst years of
the global financial crisis in 2008–09 and the oil price plunge of
2014–17 (FIGURE 1). The economic contraction bottomed in the
second quarter of 2020, but all GCC economies remain smaller
than they were in the fourth quarter of 2019 (Figure 2) and still
face substantial risks from resurgences of the disease and its
economic consequences.
The non-oil sectors led the decline in most of the regional
group’s economies. Activity lockdowns—stoppage of work,
closure of schools, cancellation of public events, restrictions on
gatherings, shutdown of public transport systems, stay-at-home
requirements, curtailment of internal movement, and controls on
international travel—dragged down the services sector, the
mainstay of the non-oil economies (60–70 percent of non-oil
GDP) (Figure 3). Meanwhile, supply chain disruptions and
increases in prices of materials and shipment costs, driven by a
downshift in global trade, added impediments to industrial
activity, affecting manufacturing, construction, and utilities.The
oil and gas sector shrank from a drop in global oil demand
and international oil prices. Global oil demand slipped 10
percent from 99.7 million barrels per day in 2019 to 94.7 million
barrels per day in 2020, and the average oil price plunged 33
percent from US$61.41 per barrel in 2019 to US$41.26 per barrel
in 2020. For the GCC which remains highly reliant on
hydrocarbons—an average 40 percent of GDP, 70 percent of
government revenues, and 75 percent of exports—the decline in
global oil demand and prices exacerbated the economic downturn
in 2020, trimming resources available for government spending
and downgrading the priorities for capital spending on upstream
oil and gas projects.
On the expenditure side, fixed investment plunged 8.4
percent. The decline in investment contributed 2.3 percentage
points to the 4.8 percent contraction in the group GDP in 2020
(Figure 4). Private consumption dropped 4.9 percent, adding
another 2.1 percentage points to the GDP contraction. Driven by
fiscal support measures, government consumption managed to
contribute half a percentage point to growth, slightly offsetting
the drop in private consumption. Additional on-budget spending,
foregone revenues, extra-budgetary measures, guarantees, and
quasi-fiscal operations came at a cost, however, of substantial
increments to government debt, withdrawals from foreign
reserves (current account deficits reflected fiscal deficits), and
drawdowns on liquid assets at sovereign wealth funds.

Gulf Economic Update • Issue 6
12
FIGURE 1
GDP growth, 2020 compared to 2009 and 2017 Percent
Sources: Haver Analytics and World Bank, Macro Poverty Outlook, Spring 2021.
FIGURE 2
GDP growth, by quarter in 2020 Index, Q4-2109 = 1.0
Sources: Haver Analytics and World Bank.
.
After barely growing 0.4 percent in 2019, Saudi Arabia’s
economy contracted 4.1 percent in 2020. The oil sector drove
the decline, as the world’s third-largest crude oil and condensate
producer (after the United States and the Russian Federation, in
2020) and the largest exporter (16 percent of global crude oil
exports, in 2019) bore the brunt of production cuts by the OPEC+
coalition of 10 Organization of the Petroleum Exporting
Countries (OPEC) members and their 13 non-OPEC partners.
Fixed investment collapsed in 2020, accounting for more than
three-fourths of the decline in aggregate demand. The contraction
in private consumption was partly offset by a rise in government
consumption as the authorities unveiled a fiscal mitigation
program of over 2 percent of GDP in on-budget spending and
almost 1 percent of GDP in extra-budgetary measures. Imports
compressed with the fall in capital investment and private
consumption—capital goods account for under one-fourth and
consumer goods for over one-fourth of goods imports, matching
the decline in exports, dominated by oil and gas shipments (80
percent of total exports).
Featuring a comparatively large non-oil economy, the UAE
posted a negative 6.1 percent GDP growth in 2020, dragged
down by a sizable decline in non-oil activity. For a sector that
comprises 70 percent of the economy, the non-oil sector
contributed almost two-thirds of the drop in growth in the year—
strict lockdowns, travel bans, and supply chain disruptions
constricted construction, tourism, and domestic trade. The oil
economy also shrank, with the third-largest OPEC crude oil and
condensate producer (after Saudi Arabia and Iraq), backing the
OPEC+ decision with its own sizable cutback of 300,000 barrels a
day in 2020, most of it concentrated in the third and fourth
quarters of the year. A less-than-proportionate reduction in
imports allowed international trade (net exports) to drive the
economic contraction, viewed on the demand side. Private
consumption also declined significantly, accounting for one-third
of the overall economic downturn.
The world’s largest natural gas exporter, Qatar leaned on
higher natural gas production to moderate the contraction of
its hydrocarbon sector. GDP growth fell 3.7 percent in 2020,
largely driven by the non-oil sector, more than half the economy.
The hydrocarbon sector still shrank, however, accounting for a
more than one-third of the negative outturn, as a fall in natural gas
prices, normally tracking oil prices, offset the effect of higher gas
production and exports. Private consumption fell more than the
overall economy. Qatar, which quit the OPEC in December 2018
ostensibly to concentrate on gas development in the giant North
Field, led a meeting of the Gas Exporting Countries Forum
(GECF), the 11-member inter-governmental organization of the
world’s largest gas exporters, in February 2020. Headlined at the
Doha meeting, Global Gas Outlook 2050 forecasts gas to
overtake oil as the world’s largest energy source by 2050 (27
percent of the total). More importantly, a diplomatic breakthrough
appeared to have been achieved in January 2021 after Saudi
Arabia, the UAE, Bahrain, and the Arab Republic of Egypt signed
a ‘solidarity and stability’ deal with Qatar—the Al Ula
Agreement—to end the diplomatic rift that started in June 2017.
Saudi Arabia reopened land, sea, and air borders with Qatar ahead
of the deal.
-4.1-6.1
-3.7-5.4 -6.3 -5.8-8
-4
0
4
8
12
SaudiArabia UAE Qatar Kuwait Oman Bahrain
Global financial crisis - 2009 Oil price decline - 2017
COVID-19 shock - 2020
0.7
0.8
0.9
1.0
1.1
Q4-2019 Q1-2020 Q2-2020 Q3-2020 Q4-2020
Saudi Arabia UAE - Dubai Qatar
Kuwait Oman Bahrain

Gulf Economic Update • Issue 6
13
FIGURE 3
Contribution to GDP growth, oil and non-oil Percentage points
Sources: Haver Analytics and World Bank, Macro Poverty Outlook, Spring 2021.
FIGURE 4
Contribution to GDP growth, final demand Percentage points
Sources: Haver Analytics and World Bank, Macro Poverty Outlook, Spring 2021
.
The most reliant of the GCC economies on hydrocarbons,
Kuwait reversed a modest growth in 2019 with an estimated
5.4 percent downturn in 2020. The oil sector drove the
economic contraction, as the third GCC member of the OPEC cut
oil output by one-tenth from 2019. On the demand side, private
consumption and fixed investment accounted for under 60 percent
of the economic decline. With the government managing to offer
only a modest discretionary fiscal mitigation, public consumption
fell as well. And consistent with reduction in oil production and
the decline in oil prices, net exports (oil exports are more than 90
percent of good exports) dropped, accounting for one-third of the
decline in GDP.
GDP growth was an estimated negative 6.3 percent in Oman
in 2020. The non-oil economy posted a steep decline of 9 percent
from 2019. Activity in the services sector, the mainstay of the
non-oil economy (over 60 percent of the non-oil economy, and
under 40 percent of the total economy), contracted across the
board, dragged down by lockdowns, travel bans, and supply chain
disruptions. The oil economy declined a less dramatic 2 percent
from 2019. One of three GCC states that are not members of the
OPEC, Oman has not been bound by the series of the OPEC+
production cutback agreements since 2017 and managed to keep
its 2020 crude oil output at roughly the level in 2019. Moreover,
Oman was able to increase oil condensate production in the year,
an item not covered by the OPEC+ pact. On the expenditure side,
private consumption, government consumption, and fixed
investment accounted for one-third each of the reduction in GDP.
Weighed down by a 7 percent contraction of the non-oil
sector, Bahrain’s economy shrank by 5.8 percent in 2020.
Services, the mainstay of the non-oil economy (80 percent of
GDP), declined significantly across the board, led by the tourism
and retail trade industries. Fixed investment fell by almost 7
percent and accounted for the largest part of the economic
downturn on the demand side. A large fiscal mitigation program,
estimated at around 6 percent of GDP in on-budget spending and
another 1 percent of GDP in guarantees and quasi-fiscal
operations, boosted government consumption, largely almost
offsetting the drop in private consumption. The decline in oil and
gas exports (around 70 percent of goods exports) was matched by
a proportionate decline in capital and consumer goods imports
(over 50 percent of merchandise imports).
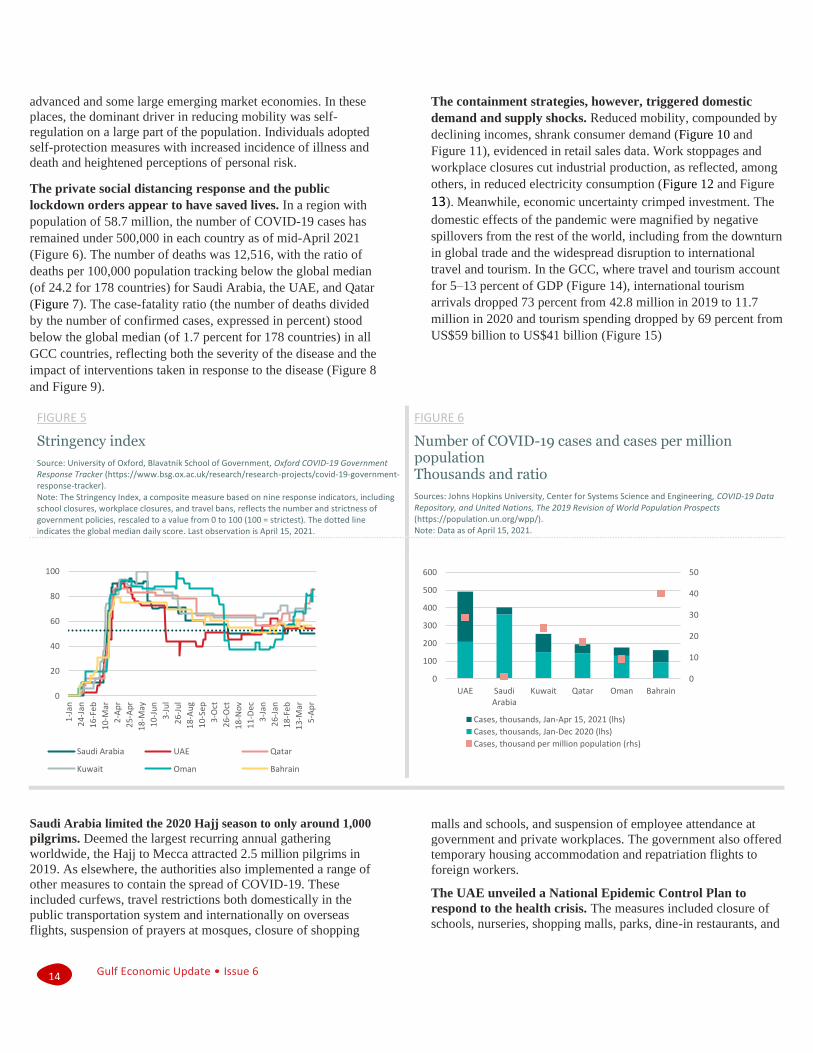
Early measures to contain the pandemic saved lives, but hurt economic activity …
As elsewhere globally, the GCC authorities quickly launched
health, containment, and economic measures to address the
COVID-19 pandemic at similar times, but there was much
more variance in the exit strategy. The public health measures
consisted of emergency spending on health care, including on
quarantine facilities, public health information campaigns, health
advisories for social distancing and facial covering, testing for the
virus, contact tracing, and, beginning in December 2020,
vaccinations. Governments combined these with many other
policy measures to contain the spread of the disease, including
restrictions on domestic mobility and international travel—the
stringency of these measures exceeded the global median daily
score (51) throughout most of 2020 (Figure 5).
It was likely the case that private citizens and residents in the
GCC socially distanced or quarantined themselves
voluntarily, with or without mandatory lockdowns. Recent
studies reveal that mandatory policies mattered less than
voluntary social distancing in reducing mobility in several
-8
-6
-4
-2
0
2
4
20
19
20
20e
20
19
20
20e
20
19
20
20e
20
19
20
20e
20
19
20
20e
20
19
20
20e
Saudi Arabia UAE Qatar Kuwait Oman Bahrain
Oil Non-oil GDP growth
-8
-4
0
4
8
20
19
20
20e
20
19
20
20e
20
19
20
20e
20
19
20
20e
20
19
20
20e
20
19
20
20e
Saudi Arabia UAE Qatar Kuwait Oman Bahrain
Private consumption Public consumption Fixed investment
Net exports GDP growth
Gulf Economic Update • Issue 6
14
advanced and some large emerging market economies. In these
places, the dominant driver in reducing mobility was self-
regulation on a large part of the population. Individuals adopted
self-protection measures with increased incidence of illness and
death and heightened perceptions of personal risk.
The private social distancing response and the public
lockdown orders appear to have saved lives. In a region with
population of 58.7 million, the number of COVID-19 cases has
remained under 500,000 in each country as of mid-April 2021
(Figure 6). The number of deaths was 12,516, with the ratio of
deaths per 100,000 population tracking below the global median
(of 24.2 for 178 countries) for Saudi Arabia, the UAE, and Qatar
(Figure 7). The case-fatality ratio (the number of deaths divided
by the number of confirmed cases, expressed in percent) stood
below the global median (of 1.7 percent for 178 countries) in all
GCC countries, reflecting both the severity of the disease and the
impact of interventions taken in response to the disease (Figure 8
and Figure 9).
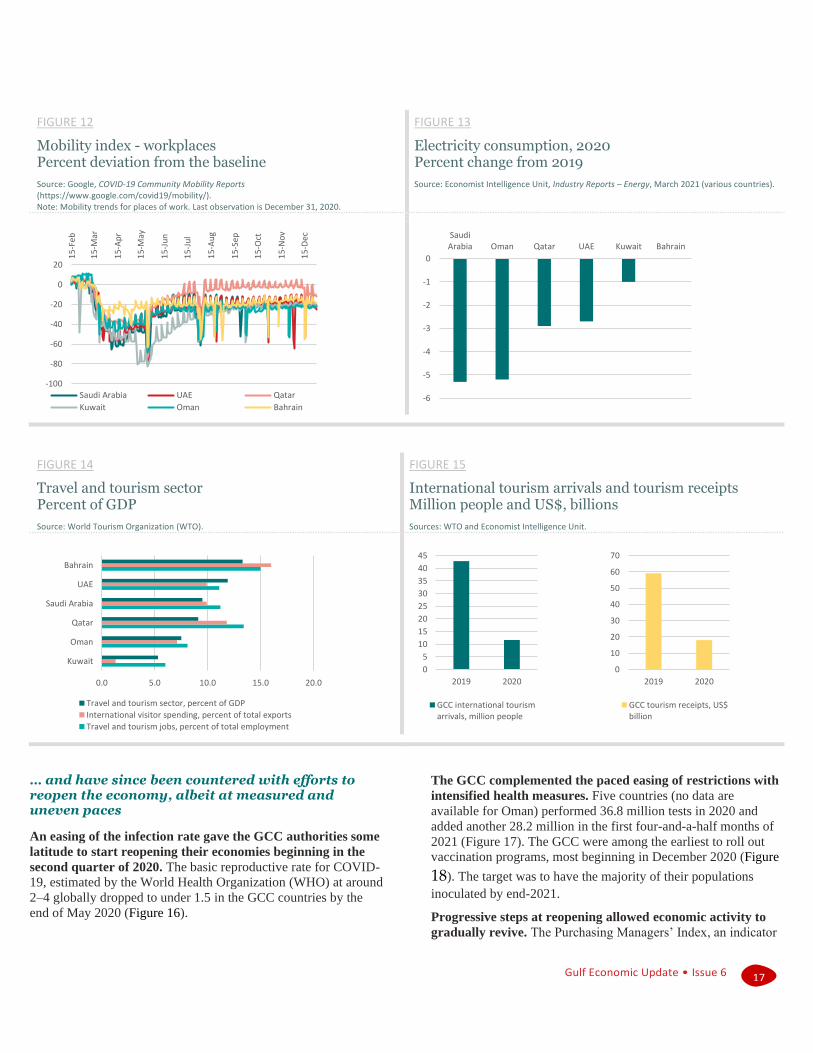
The containment strategies, however, triggered domestic
demand and supply shocks. Reduced mobility, compounded by
declining incomes, shrank consumer demand (Figure 10 and
Figure 11), evidenced in retail sales data. Work stoppages and
workplace closures cut industrial production, as reflected, among
others, in reduced electricity consumption (Figure 12 and Figure 13). Meanwhile, economic uncertainty crimped investment. The
domestic effects of the pandemic were magnified by negative
spillovers from the rest of the world, including from the downturn
in global trade and the widespread disruption to international
travel and tourism. In the GCC, where travel and tourism account
for 5–13 percent of GDP (Figure 14), international tourism
arrivals dropped 73 percent from 42.8 million in 2019 to 11.7
million in 2020 and tourism spending dropped by 69 percent from
US$59 billion to US$41 billion (Figure 15)
FIGURE 5
Stringency index
Source: University of Oxford, Blavatnik School of Government, Oxford COVID-19 Government Response Tracker (https://www.bsg.ox.ac.uk/research/research-projects/covid-19-government-response-tracker). Note: The Stringency Index, a composite measure based on nine response indicators, including school closures, workplace closures, and travel bans, reflects the number and strictness of government policies, rescaled to a value from 0 to 100 (100 = strictest). The dotted line indicates the global median daily score. Last observation is April 15, 2021.
FIGURE 6
Number of COVID-19 cases and cases per million population Thousands and ratio
Sources: Johns Hopkins University, Center for Systems Science and Engineering, COVID-19 Data Repository, and United Nations, The 2019 Revision of World Population Prospects (https://population.un.org/wpp/). Note: Data as of April 15, 2021.
Saudi Arabia limited the 2020 Hajj season to only around 1,000
pilgrims. Deemed the largest recurring annual gathering
worldwide, the Hajj to Mecca attracted 2.5 million pilgrims in
2019. As elsewhere, the authorities also implemented a range of
other measures to contain the spread of COVID-19. These
included curfews, travel restrictions both domestically in the
public transportation system and internationally on overseas
flights, suspension of prayers at mosques, closure of shopping
malls and schools, and suspension of employee attendance at
government and private workplaces. The government also offered
temporary housing accommodation and repatriation flights to
foreign workers.
The UAE unveiled a National Epidemic Control Plan to
respond to the health crisis. The measures included closure of
schools, nurseries, shopping malls, parks, dine-in restaurants, and
0
20
40
60
80
100
1-J
an
24-
Jan
16
-Feb
10-
Mar
2-A
pr
25-
Ap
r
18-
May
10-
Jun
3-J
ul
26-
Jul
18-
Au
g
10
-Sep
3-O
ct
26-
Oct
18
-No
v
11-
Dec
3-J
an
26-
Jan
18
-Feb
13-
Mar
5-A
pr
Saudi Arabia UAE Qatar
Kuwait Oman Bahrain
0
10
20
30
40
50
0
100
200
300
400
500
600
UAE SaudiArabia
Kuwait Qatar Oman Bahrain
Cases, thousands, Jan-Apr 15, 2021 (lhs)
Cases, thousands, Jan-Dec 2020 (lhs)
Cases, thousand per million population (rhs)

Gulf Economic Update • Issue 6
15
various tourist attractions. The authorities also grounded flights,
halted visa issuance, suspended prayers at mosques, and ordered
teleworking arrangements at government offices. A dedicated task
force worked to ensure an uninterrupted supply of consumer
goods, prevent manipulative pricing practices, and launch a
remote learning initiative to ensure the continuity of education
services. The country reported a drop in retail sales of more than
8 percent in volume terms and more than 10 percent in US dollar
value terms in 2020.
FIGURE 7
Number of COVID-19 deaths and deaths per 100,000 population Thousands and ratio
Source: Johns Hopkins University, Center for Systems Science and Engineering, COVID-19 Data Repository. Note: Data as of April 15, 2021.
FIGURE 8
Number of COVID-19 cases and deaths
Source: Johns Hopkins University, Center for Systems Science and Engineering, COVID-19 Data Repository. Note: Axes are presented in logarithmic scale.
FIGURE 9
Number of COVID-19 deaths and case-fatality ratio Thousands and percent
Source: Johns Hopkins University, Center for Systems Science and Engineering, COVID-19 Data Repository. Note: The case-fatality ratio is the number of deaths divided by the number of confirmed cases. Data as of April 15, 2021.
0
10
20
30
40
0
2
4
6
8
SaudiArabia
Oman UAE Kuwait Bahrain Qatar
Deaths, thousands, Jan-Apr 15, 2021 (lhs)Deaths, thousands, Jan-Dec 2020 (lhs)Deaths per 100,000 population (rhs)Deaths per 100,000 population, global median (rhs)
1
10
100
1,000
10,000
100,000
1,000,000
10,000,000
100 1,000 10,000 100,000 1,000,000 10,000,000
Dea
ths
CasesSaudi Arabia UAE Qatar Kuwait Oman Bahrain Other
0.0
0.5
1.0
1.5
2.0
0
2
4
6
8
SaudiArabia
Oman UAE Kuwait Bahrain Qatar
Deaths, thousands, Jan-Apr 15, 2021 (lhs)Deaths, thousands, Jan-Dec 2020Case-fatality ratio, percent (rhs)Case-fatality ratio, percent, global median (rhs)

Gulf Economic Update • Issue 6
16
Qatar ordered remote working for 80 percent of private
employees. Meanwhile, working hours in the public sector were
greatly reduced. In-school attendance was replaced with distance
learning in all public and private schools. Health measures
included the building of a dedicated hospital for quarantined
workers, drive-through COVID-19 testing, home delivery of
medical services, cancellation of routine medical and dental
appointments, mandates for face masks, mandates for the
installation of the Ehteraz App on mobile phones for contact
tracing, intensive cleaning of public places, and even food
inspections. The measures were supported with extensive public
awareness campaigns.
Kuwait recorded relatively sharp declines in mobility over
lengthy periods in 2020. The government progressively
tightened measures to control the spread of the virus throughout
the year. The measures included suspension of inbound
commercial flights, closure of universities and schools, banning
of public gatherings and celebrations, suspension of nonessential
work in government, and most notably, imposition of 24-hour
curfew.
FIGURE 10
Mobility index - retail and recreation Percent deviation from the baseline
Source: Google, COVID-19 Community Mobility Reports (https://www.google.com/covid19/mobility/). Note: The index measures mobility trends for places like restaurants, cafes, shopping centers, theme parks, museums, libraries, and movie theaters. Last observation date is December 31, 2020.
FIGURE 11
Retail sales, 2020 Percent change from 2019
Source: Economist Intelligence Unit, Industry Reports – Consumer Goods, March 2021 (Saudi Arabia and the UAE).
Oman organized its pandemic response through a Supreme
Committee headed by the Minister of Interior. In March 2020,
the body banned the issuance of tourist visas, ordered the
shutdown of schools, stopped the passage of non-citizens through
its borders, quarantined new arrivals, and prohibited its citizens
from traveling overseas. It shut down most public places and
public transport and allowed only food and medical retail outlets
to operate. Notably, the army declared a state of emergency. The
army also began sterilizing roads and public places. Together with
Saudi Arabia, Oman reported the largest drop in electricity
consumption in 2020 in the GCC—over 5 percent, from 35 GWh
in 2019 to 33.2 GWh.
Initial efforts in Bahrain to stem contagion were focused on
travels from particular destinations and risks related to
migrant living conditions. In February 2020, the Bahrain Civil
Aviation Authority suspended flights from Sharjah and Dubai in
the UAE, the routes used by Shia pilgrims returning from the
Islamic Republic of Iran, an early epicenter of the disease. In
March, the authorities restricted traffic on the causeway
connecting the country to Saudi Arabia (used by 50,000
commuters daily) to commercial vehicles only. The government
initially aimed to control the return of Bahrainis from overseas as
the pandemic worsened but eventually repatriated some 60
percent of its nationals abroad, mostly stranded in the Islamic
Republic of Iran, in early May. To address clusters of infections
at shared housing facilities, Bahrain relocated many of its foreign
workers to unused buildings and also established quarantine
facilities.
-100
-80
-60
-40
-20
0
20
15-
Feb
15-
Mar
15-
Ap
r
15-
May
15-
Jun
15-
Jul
15-
Au
g
15-
Sep
15-
Oct
15-
No
v
15-
Dec
Saudi Arabia UAE Qatar
Kuwait Oman Bahrain
-12
-10
-8
-6
-4
-2
0
Saudi Arabia UAE
Volume Value (US$)
Gulf Economic Update • Issue 6
17
FIGURE 12
Mobility index - workplaces Percent deviation from the baseline
Source: Google, COVID-19 Community Mobility Reports (https://www.google.com/covid19/mobility/). Note: Mobility trends for places of work. Last observation is December 31, 2020.
FIGURE 13
Electricity consumption, 2020 Percent change from 2019
Source: Economist Intelligence Unit, Industry Reports – Energy, March 2021 (various countries).
FIGURE 14
Travel and tourism sector Percent of GDP
Source: World Tourism Organization (WTO).
FIGURE 15
International tourism arrivals and tourism receipts Million people and US$, billions
Sources: WTO and Economist Intelligence Unit.
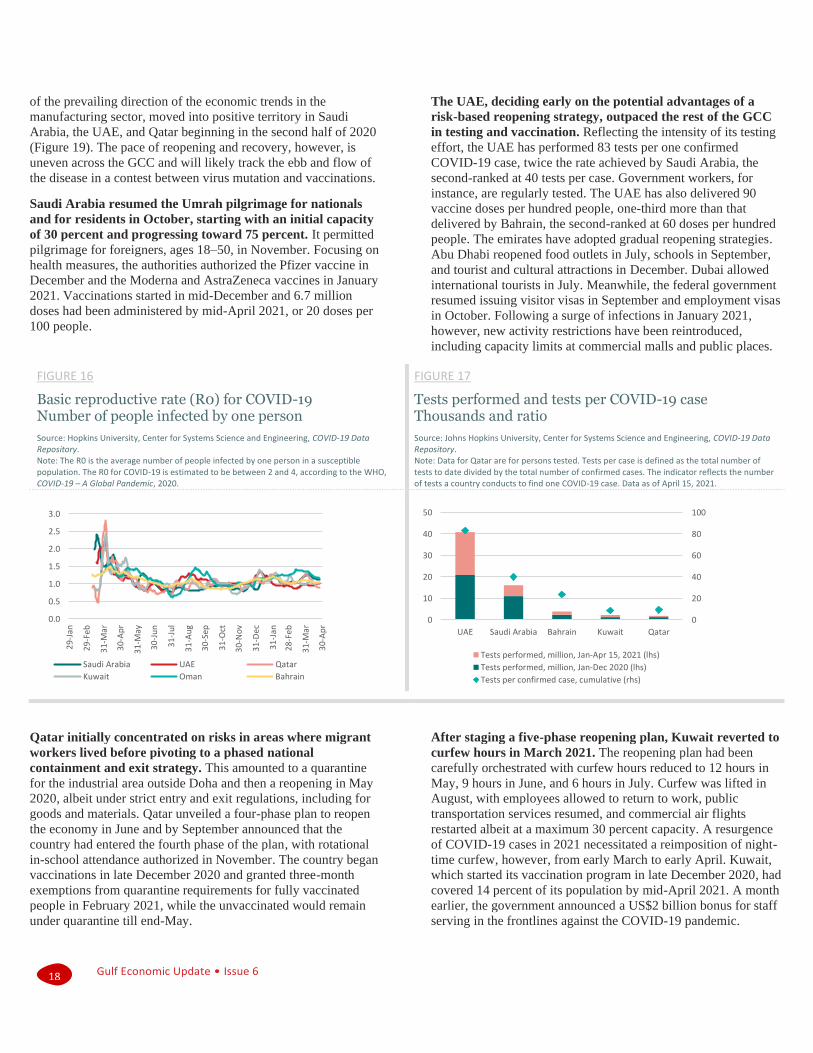
… and have since been countered with efforts to reopen the economy, albeit at measured and uneven paces
An easing of the infection rate gave the GCC authorities some
latitude to start reopening their economies beginning in the
second quarter of 2020. The basic reproductive rate for COVID-
19, estimated by the World Health Organization (WHO) at around
2–4 globally dropped to under 1.5 in the GCC countries by the
end of May 2020 (Figure 16).
The GCC complemented the paced easing of restrictions with
intensified health measures. Five countries (no data are
available for Oman) performed 36.8 million tests in 2020 and
added another 28.2 million in the first four-and-a-half months of
2021 (Figure 17). The GCC were among the earliest to roll out
vaccination programs, most beginning in December 2020 (Figure 18). The target was to have the majority of their populations
inoculated by end-2021.
Progressive steps at reopening allowed economic activity to
gradually revive. The Purchasing Managers’ Index, an indicator
-100
-80
-60
-40
-20
0
20
15
-Feb
15
-Mar
15
-Ap
r
15
-May
15
-Ju
n
15
-Ju
l
15
-Au
g
15
-Sep
15
-Oct
15
-No
v
15
-Dec
Saudi Arabia UAE Qatar
Kuwait Oman Bahrain-6
-5
-4
-3
-2
-1
0
SaudiArabia Oman Qatar UAE Kuwait Bahrain
0.0 5.0 10.0 15.0 20.0
Kuwait
Oman
Qatar
Saudi Arabia
UAE
Bahrain
Travel and tourism sector, percent of GDP
International visitor spending, percent of total exports
Travel and tourism jobs, percent of total employment
0
5
10
15
20
25
30
35
40
45
2019 2020
GCC international tourismarrivals, million people
0
10
20
30
40
50
60
70
2019 2020
GCC tourism receipts, US$billion
Gulf Economic Update • Issue 6
18
of the prevailing direction of the economic trends in the
manufacturing sector, moved into positive territory in Saudi
Arabia, the UAE, and Qatar beginning in the second half of 2020
(Figure 19). The pace of reopening and recovery, however, is
uneven across the GCC and will likely track the ebb and flow of
the disease in a contest between virus mutation and vaccinations.
Saudi Arabia resumed the Umrah pilgrimage for nationals
and for residents in October, starting with an initial capacity
of 30 percent and progressing toward 75 percent. It permitted
pilgrimage for foreigners, ages 18–50, in November. Focusing on
health measures, the authorities authorized the Pfizer vaccine in
December and the Moderna and AstraZeneca vaccines in January
2021. Vaccinations started in mid-December and 6.7 million
doses had been administered by mid-April 2021, or 20 doses per
100 people.
The UAE, deciding early on the potential advantages of a
risk-based reopening strategy, outpaced the rest of the GCC
in testing and vaccination. Reflecting the intensity of its testing
effort, the UAE has performed 83 tests per one confirmed
COVID-19 case, twice the rate achieved by Saudi Arabia, the
second-ranked at 40 tests per case. Government workers, for
instance, are regularly tested. The UAE has also delivered 90
vaccine doses per hundred people, one-third more than that
delivered by Bahrain, the second-ranked at 60 doses per hundred
people. The emirates have adopted gradual reopening strategies.
Abu Dhabi reopened food outlets in July, schools in September,
and tourist and cultural attractions in December. Dubai allowed
international tourists in July. Meanwhile, the federal government
resumed issuing visitor visas in September and employment visas
in October. Following a surge of infections in January 2021,
however, new activity restrictions have been reintroduced,
including capacity limits at commercial malls and public places.
FIGURE 16
Basic reproductive rate (R0) for COVID-19 Number of people infected by one person
Source: Hopkins University, Center for Systems Science and Engineering, COVID-19 Data Repository. Note: The R0 is the average number of people infected by one person in a susceptible population. The R0 for COVID-19 is estimated to be between 2 and 4, according to the WHO, COVID-19 – A Global Pandemic, 2020.
FIGURE 17
Tests performed and tests per COVID-19 case Thousands and ratio
Source: Johns Hopkins University, Center for Systems Science and Engineering, COVID-19 Data Repository. Note: Data for Qatar are for persons tested. Tests per case is defined as the total number of tests to date divided by the total number of confirmed cases. The indicator reflects the number of tests a country conducts to find one COVID-19 case. Data as of April 15, 2021.
Qatar initially concentrated on risks in areas where migrant
workers lived before pivoting to a phased national
containment and exit strategy. This amounted to a quarantine
for the industrial area outside Doha and then a reopening in May
2020, albeit under strict entry and exit regulations, including for
goods and materials. Qatar unveiled a four-phase plan to reopen
the economy in June and by September announced that the
country had entered the fourth phase of the plan, with rotational
in-school attendance authorized in November. The country began
vaccinations in late December 2020 and granted three-month
exemptions from quarantine requirements for fully vaccinated
people in February 2021, while the unvaccinated would remain
under quarantine till end-May.
After staging a five-phase reopening plan, Kuwait reverted to
curfew hours in March 2021. The reopening plan had been
carefully orchestrated with curfew hours reduced to 12 hours in
May, 9 hours in June, and 6 hours in July. Curfew was lifted in
August, with employees allowed to return to work, public
transportation services resumed, and commercial air flights
restarted albeit at a maximum 30 percent capacity. A resurgence
of COVID-19 cases in 2021 necessitated a reimposition of night-
time curfew, however, from early March to early April. Kuwait,
which started its vaccination program in late December 2020, had
covered 14 percent of its population by mid-April 2021. A month
earlier, the government announced a US$2 billion bonus for staff
serving in the frontlines against the COVID-19 pandemic.
0.0
0.5
1.0
1.5
2.0
2.5
3.0
29-
Jan
29-
Feb
31-
Mar
30-
Ap
r
31-
May
30-
Jun
31-
Jul
31-
Au
g
30-
Sep
31-
Oct
30-
No
v
31-
Dec
31-
Jan
28-
Feb
31-
Mar
30-
Ap
r
Saudi Arabia UAE Qatar
Kuwait Oman Bahrain
0
20
40
60
80
100
0
10
20
30
40
50
UAE Saudi Arabia Bahrain Kuwait Qatar
Tests performed, million, Jan-Apr 15, 2021 (lhs)
Tests performed, million, Jan-Dec 2020 (lhs)
Tests per confirmed case, cumulative (rhs)

Gulf Economic Update • Issue 6
19
FIGURE 18
Total vaccinations and vaccinations per hundred people Millions and ratio
Source: Johns Hopkins University, Center for Systems Science and Engineering, COVID-19 Data Repository. Note: A vaccination is defined as a single dose administered and does not equal the number of people vaccinated. Data as of April 15, 2021.
FIGURE 19
Global Purchasing Managers’ Index Index value, seasonally adjusted, 50+ = expansion
Source: IHS Markit.
Oman alternated between opening and closing its service
economy. Selected business activities, including at money
exchanges, electronic stores, and car rentals, were allowed in
April. Office work in the private sector and in the government
was regularized in May, as the lockdown in Muscat governorate
was lifted. Industrial activity restarted and foreign travel was
authorized in July even as the lockdown in Dhofar governorate
was extended. But the government had to order national
lockdowns twice, July and again in October. A second wave in
the first quarter of 2021 drew more restrictive measures—land
borders were closed in mid-January, public parks and leisure
spaces in late February, and night-time activities in March. So far,
Oman has implemented the slowest vaccination program among
the GCC; only 296,000 doses were administered by early June, a
ratio of 3.8 vaccinations per 100 people.
Avoiding strict lockdowns altogether, Bahrain began easing
containment measures in April. Vaccinations began in
December and 1 million doses were cumulatively administered by
mid-April, or 60 doses per 100 people, topped only by the UAE.
Despite the rapid vaccine rollout, a second wave of infections hit
Bahrain in the first quarter of 2021, with the number of daily
cases in March surpassing the monthly peak in 2020. The
authorities have since reintroduced some containment measures,
including by halting in-person education, banning social
gatherings, reinstating remote work arrangements for the public
sector, and restricting selected indoor activities.
The fall in global oil demand squeezed oil prices, forcing a return to production cuts …
Facing a downshift in global oil demand, Saudi Arabia and
Russia ended their price war in May 2020 with an OPEC+
agreement to reduce production by 10 million barrels per day
over two months. The coalition would remain flexible with their
joint production decisions in the remainder of the year—in June
and September, as well as in January 2021. With the supply cuts,
oil prices began to recover in May–June, supported as well by an
easing of lockdown measures, some pickup in travel and
transport, and a modest recovery in global consumption. Overall,
global oil demand contracted by 5 percent in 2020, or 5 million
barrels per day, while supply was cut by 8 percent, or 8.1 million
barrels per day (Figure 20). The three GCC OPEC members—
Saudi Arabia, the UAE, and Kuwait—led the OPEC+ cutbacks,
reducing output by a combined 1.3 million barrels per day from
2019 (Figure 21).
0102030405060708090100
0123456789
10
UAE SaudiArabia
Qatar Bahrain Kuwait Oman
Vaccinations, million (lhs) Vaccinations per hundred people (rhs)
30
35
40
45
50
55
60
65
Jan
-201
9
Mar
-20
19
May
-201
9
Jul-
201
9
Sep
-20
19
No
v-20
19
Jan
-202
0
Mar
-20
20
May
-202
0
Jul-
202
0
Sep
-20
20
No
v-20
20
Jan
-202
1
Mar
-20
21
May
-202
1
Saudi Arabia UAE Qatar
50+ = expansion
<50 = contraction

Gulf Economic Update • Issue 6
20
FIGURE 20
Global demand and supply and average oil price Million barrels per day and US$ per barrel
Sources: International Energy Agency (IEA), Oil 2021, and World Bank, Commodity Price Data.
FIGURE 21
Oil output cutbacks, from 2019 production volumes Million barrels per day
Sources: OPEC, Monthly Oil Market Report, January 2020–March 2021; IEA, Oil Market Report, January 2020–March 2021; and Joint Organizations Data Initiative (JODI), The JODI World Oil Database. Note: Qatar, Oman, and Bahrain are not members of OPEC.
… and prompting a pause in capital projects
The destruction of demand and the overall economic
uncertainty cut upstream investment in the oil and gas
industry in 2020. Globally, capital expenditures fell to their
lowest since 2006, as operators spent one-third less than they
planned at the beginning of the year (Figure 22).
FIGURE 22
Global oil and gas upstream capital spending US$, billions
Source: IEA, Oil 2021.
In Saudi Arabia, the Marjan and the Berri oil field expansion
projects were delayed because of lower oil prices. Sanctioned
in 2019, the two offshore projects were part of Saudi Aramco’s
US$18 billion plan to boost production capacity by 550,000
barrels per day of crude oil and 2.5 billion cubic feet per day of
natural gas. The Marjan project involved the development of a
fourth offshore gas and oil separator plant and two dozen oil,
water, and gas injection platforms to produce an additional
300,000 barrels per day of crude and 360,000 barrels per day of
ethane and natural gas liquids and to process an additional 1.5
billion cubic feet per day of gas by 2022. The Berri project
involved the construction of a new gas and oil separator plant at
the Abu Ali facility, new gas facilities at the Khursaniyah plant,
two drilling islands to the north and south of the King Fahad
industrial port causeway, 11 oil and water offshore platforms,
nine onshore oil and water supply drill sites, and one water
injection facility to produce an additional 250,000 barrels per day
of crude and 40,000 barrels per day of hydrocarbon condensate
and to process 370 million standard cubic feet per day of sour gas
by 2023.
In the UAE, the Belbazem greenfield, Upper Zakum
expansion, and Lower Zakum expansion projects were all
delayed as the industry grappled with idled production
capacity. The Belbazem offshore gas field off Zirku Island, to be
developed by Al Yasat Petroleum Operations Ltd., would produce
45,000 barrels per day of crude and 765,000 cubic meters per day
of gas by 2024. Owned by a joint venture of Abu Dhabi National
Oil Company, Exxon Mobil, and Japan Oil Development
Company, the expansion at Upper Zakum, the second-largest
offshore oilfield in the world with an estimated 50 billion barrels
of oil reserves, would add 750,000 barrels per day to the current
20
30
40
50
60
70
60
70
80
90
100
110
2019 Q1-2020 Q2-2020 Q3-2020 Q4-2020 Q1-2021
Global oil demand (lhs)Global oil supply (lhs)Crude oil price, average spot (rhs)
-1.4
-1.2
-1.0
-0.8
-0.6
-0.4
-0.2
0.0
0.2
Q1-2020 Q2-2020 Q3-2020 Q4-2020 Q1-2021
Saudi Arabia UAE Kuwait Oman Bahrain Qatar
0
100
200
300
400
500
600
2016 2017 2018 2019 2020
Planned Actual
Gulf Economic Update • Issue 6
21
production of 640,000 barrels per day and be sustainable for 25
years. Meanwhile, the expansion of Lower Zakum, majority
owned by the Abu Dhabi National Oil Company and counting on
China National Petroleum Corp. and China National Offshore Oil
Corp. as concession partners, would add 300,000 barrels per day
to the current production.
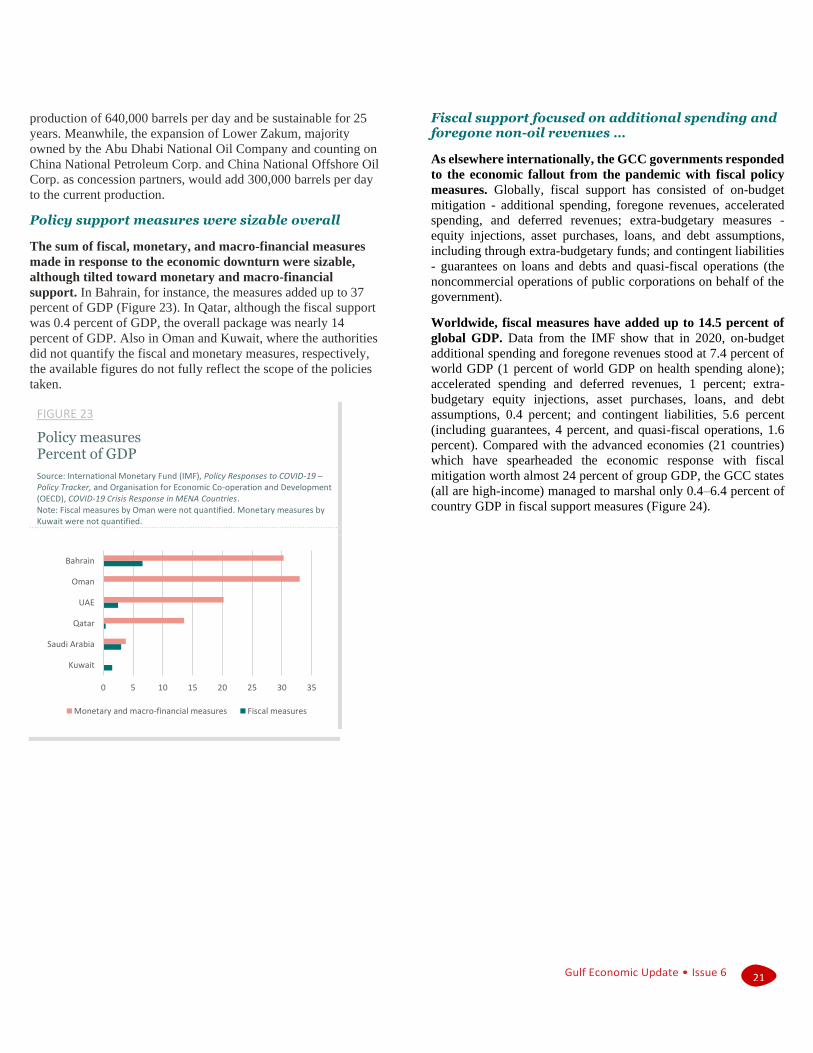
Policy support measures were sizable overall
The sum of fiscal, monetary, and macro-financial measures
made in response to the economic downturn were sizable,
although tilted toward monetary and macro-financial
support. In Bahrain, for instance, the measures added up to 37
percent of GDP (Figure 23). In Qatar, although the fiscal support
was 0.4 percent of GDP, the overall package was nearly 14
percent of GDP. Also in Oman and Kuwait, where the authorities
did not quantify the fiscal and monetary measures, respectively,
the available figures do not fully reflect the scope of the policies
taken.
FIGURE 23
Policy measures Percent of GDP
Source: International Monetary Fund (IMF), Policy Responses to COVID-19 – Policy Tracker, and Organisation for Economic Co-operation and Development (OECD), COVID-19 Crisis Response in MENA Countries. Note: Fiscal measures by Oman were not quantified. Monetary measures by Kuwait were not quantified.
Fiscal support focused on additional spending and foregone non-oil revenues …
As elsewhere internationally, the GCC governments responded
to the economic fallout from the pandemic with fiscal policy
measures. Globally, fiscal support has consisted of on-budget
mitigation - additional spending, foregone revenues, accelerated
spending, and deferred revenues; extra-budgetary measures -
equity injections, asset purchases, loans, and debt assumptions,
including through extra-budgetary funds; and contingent liabilities
- guarantees on loans and debts and quasi-fiscal operations (the
noncommercial operations of public corporations on behalf of the
government).
Worldwide, fiscal measures have added up to 14.5 percent of
global GDP. Data from the IMF show that in 2020, on-budget
additional spending and foregone revenues stood at 7.4 percent of
world GDP (1 percent of world GDP on health spending alone);
accelerated spending and deferred revenues, 1 percent; extra-
budgetary equity injections, asset purchases, loans, and debt
assumptions, 0.4 percent; and contingent liabilities, 5.6 percent
(including guarantees, 4 percent, and quasi-fiscal operations, 1.6
percent). Compared with the advanced economies (21 countries)
which have spearheaded the economic response with fiscal
mitigation worth almost 24 percent of group GDP, the GCC states
(all are high-income) managed to marshal only 0.4–6.4 percent of
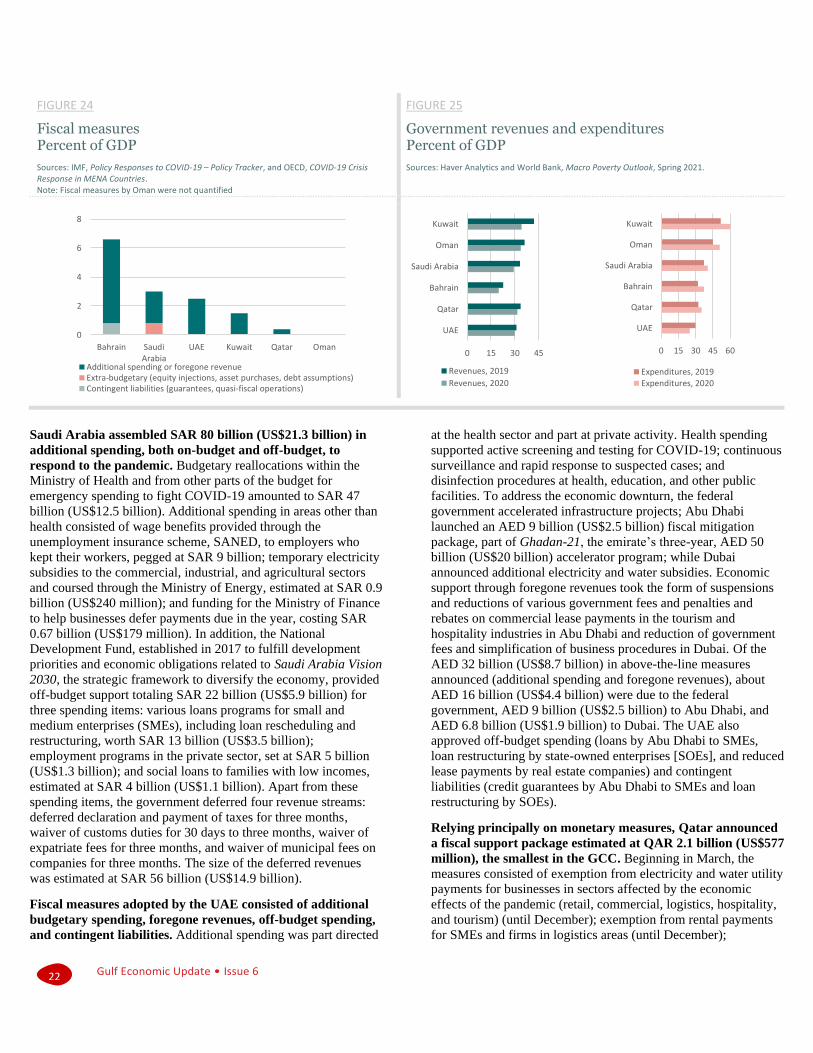
country GDP in fiscal support measures (Figure 24).
0 5 10 15 20 25 30 35
Kuwait
Saudi Arabia
Qatar
UAE
Oman
Bahrain
Monetary and macro-financial measures Fiscal measures
Gulf Economic Update • Issue 6
22
FIGURE 24
Fiscal measures Percent of GDP
Sources: IMF, Policy Responses to COVID-19 – Policy Tracker, and OECD, COVID-19 Crisis Response in MENA Countries. Note: Fiscal measures by Oman were not quantified
FIGURE 25
Government revenues and expenditures Percent of GDP
Sources: Haver Analytics and World Bank, Macro Poverty Outlook, Spring 2021.
Saudi Arabia assembled SAR 80 billion (US$21.3 billion) in
additional spending, both on-budget and off-budget, to
respond to the pandemic. Budgetary reallocations within the
Ministry of Health and from other parts of the budget for
emergency spending to fight COVID-19 amounted to SAR 47
billion (US$12.5 billion). Additional spending in areas other than
health consisted of wage benefits provided through the
unemployment insurance scheme, SANED, to employers who
kept their workers, pegged at SAR 9 billion; temporary electricity
subsidies to the commercial, industrial, and agricultural sectors
and coursed through the Ministry of Energy, estimated at SAR 0.9
billion (US$240 million); and funding for the Ministry of Finance
to help businesses defer payments due in the year, costing SAR
0.67 billion (US$179 million). In addition, the National
Development Fund, established in 2017 to fulfill development
priorities and economic obligations related to Saudi Arabia Vision
2030, the strategic framework to diversify the economy, provided
off-budget support totaling SAR 22 billion (US$5.9 billion) for
three spending items: various loans programs for small and
medium enterprises (SMEs), including loan rescheduling and
restructuring, worth SAR 13 billion (US$3.5 billion);
employment programs in the private sector, set at SAR 5 billion
(US$1.3 billion); and social loans to families with low incomes,
estimated at SAR 4 billion (US$1.1 billion). Apart from these
spending items, the government deferred four revenue streams:
deferred declaration and payment of taxes for three months,
waiver of customs duties for 30 days to three months, waiver of
expatriate fees for three months, and waiver of municipal fees on
companies for three months. The size of the deferred revenues
was estimated at SAR 56 billion (US$14.9 billion).
Fiscal measures adopted by the UAE consisted of additional
budgetary spending, foregone revenues, off-budget spending,
and contingent liabilities. Additional spending was part directed
at the health sector and part at private activity. Health spending
supported active screening and testing for COVID-19; continuous
surveillance and rapid response to suspected cases; and
disinfection procedures at health, education, and other public
facilities. To address the economic downturn, the federal
government accelerated infrastructure projects; Abu Dhabi
launched an AED 9 billion (US$2.5 billion) fiscal mitigation
package, part of Ghadan-21, the emirate’s three-year, AED 50
billion (US$20 billion) accelerator program; while Dubai
announced additional electricity and water subsidies. Economic
support through foregone revenues took the form of suspensions
and reductions of various government fees and penalties and
rebates on commercial lease payments in the tourism and
hospitality industries in Abu Dhabi and reduction of government
fees and simplification of business procedures in Dubai. Of the
AED 32 billion (US$8.7 billion) in above-the-line measures
announced (additional spending and foregone revenues), about
AED 16 billion (US$4.4 billion) were due to the federal
government, AED 9 billion (US$2.5 billion) to Abu Dhabi, and
AED 6.8 billion (US$1.9 billion) to Dubai. The UAE also
approved off-budget spending (loans by Abu Dhabi to SMEs,
loan restructuring by state-owned enterprises [SOEs], and reduced
lease payments by real estate companies) and contingent
liabilities (credit guarantees by Abu Dhabi to SMEs and loan
restructuring by SOEs).
Relying principally on monetary measures, Qatar announced
a fiscal support package estimated at QAR 2.1 billion (US$577
million), the smallest in the GCC. Beginning in March, the
measures consisted of exemption from electricity and water utility
payments for businesses in sectors affected by the economic
effects of the pandemic (retail, commercial, logistics, hospitality,
and tourism) (until December); exemption from rental payments
for SMEs and firms in logistics areas (until December);
0
2
4
6
8
Bahrain SaudiArabia
UAE Kuwait Qatar Oman
Additional spending or foregone revenueExtra-budgetary (equity injections, asset purchases, debt assumptions)Contingent liabilities (guarantees, quasi-fiscal operations)
0 15 30 45
UAE
Qatar
Bahrain
Saudi Arabia
Oman
Kuwait
Revenues, 2019
Revenues, 2020
0 15 30 45 60
UAE
Qatar
Bahrain
Saudi Arabia
Oman
Kuwait
Expenditures, 2019Expenditures, 2020
Gulf Economic Update • Issue 6
23
exemption of food and medical goods from customs duties (until
December); waiver of utility fees due from households and
businesses (until February 2021); and payment of the full salaries
of migrant workers undergoing medical treatment or under
quarantine.
Kuwait allocated KWD 500 million (US$1.6 billion) for four
fiscal mitigation measures. The government committed to
provide full unemployment benefits to nationals; deferred social
security contributions for private companies for six months;
removed government fees levied on firms in selected sectors,
provided the savings were passed on to customers; and, as an off-
budget initiative, authorized concessional, long-term loans to
SMEs that would be financed jointly by the National Fund for
Small and Medium Enterprise Development and private banks.
Most of the fiscal measures activated by Oman consisted of
foregone and deferred revenues. In March 2020, the
government suspended rent payments by companies in industrial
zones (until June), waived municipal taxes and some government
fees (until August), reduced port and air freight charges, and
postponed loan payments due from borrowers of the Oman
Development Bank and the SME Development Fund Oman (until
September). In April, the Sultanate of Oman Tax Authority
allowed the payment of taxes in installments, waived fines and
penalties for late disclosures, and authorized the tax deduction of
donations made to combat COVID-19 (until December). In June,
the government authorized a program of interest-free emergency
loans for enterprises that suffered from the economic effects of
the COVID-19 pandemic and to clients of the Oman
Development Bank and the Al Raffd Fund, organized in 2013 to
promote entrepreneurship. In October, the tax authority
suspended the collection of additional taxes imposed for the
failure to settle overdue income tax payments and suspended the
enforcement of fines and penalties charged for the failure to
submit tax reports (until December).
Bahrain rolled out a sizable fiscal mitigation effort. Some
BHD 177 million (US$0.5 billion) was appropriated for
additional health spending, while BHD 560 million (US$1.5
billion) was allotted for financial support to sectors most affected
by the crisis. The original spending measures included the
payment of salaries of nationals working in the private sector;
subsidies for electricity and water for companies and households
of nationals; a national employment program to train the
workforce and to create jobs in the private sector; and support for
workers in the education and the transportation sectors. A more
targeted package later in the year provided for the payment of half
of salaries of nationals in the most affected sectors of the
economy. Revenue measures included exemptions from
government fees for industrial and commercial enterprises,
exemption from tourism fees for tourist facilities, and exemption
from business fees for the establishment and operation of e-stores.
In addition, the government doubled the size of the Liquidity
Support Fund, the credit facility created in 2019 to reinvigorate
businesses and revitalize the national economy, to US$530
million and directed the Tamkeen, the public authority created in
2006 to promote private sector employment (the agency funds its
activities from fees collected from employers of foreign workers),
to provide loans and assistance to SMEs.
… and weighed on fiscal balances and public debt
Part of the fiscal support measures, foregone and deferred
revenues deducted from government revenue streams in 2020
were already depressed by the recession. Government revenues
in the GCC dropped 22.2 percent in 2020 (Figure 25), topped
only in 2015 when revenues declined steeply by 39 percent during
the oil price plunge of 2014–17. Government expenditures fell
less dramatically, by 2.5 percent in 2020, supported by spending
to provide relief from the pandemic and to spur a recovery from
the recession.
Deficits in 2020 added markedly to deficits incurred in 2019.
The cumulative fiscal deficits over the two years exceeded 25
percent of GDP in the region’s three smaller economies, Bahrain,
Oman, and Kuwait (Figure 26). Facing fiscal strains ahead of the
outbreak of the COVID-19 pandemic, Bahrain and Oman found
fiscal adjustment programs difficult to implement under
drastically changed conditions but benefited from financial aid
from their GCC partners—Bahrain from Saudi Arabia, the UAE,
and Kuwait (part of the US$10 billion aid package approved in
2018) and Oman from Qatar (US$1 billion in aid extended in
October).
Bond issuances by the GCC rose significantly in 2020. The
total debt securities issued in the international bond market were
US$42.1 billion, up 25 percent from US$33.5 billion in 2019,
according to data from Capital Economics. Gross general
government debt exceeded 100 percent of GDP in Bahrain and 60
percent of GDP in Oman and Qatar (Figure 27).
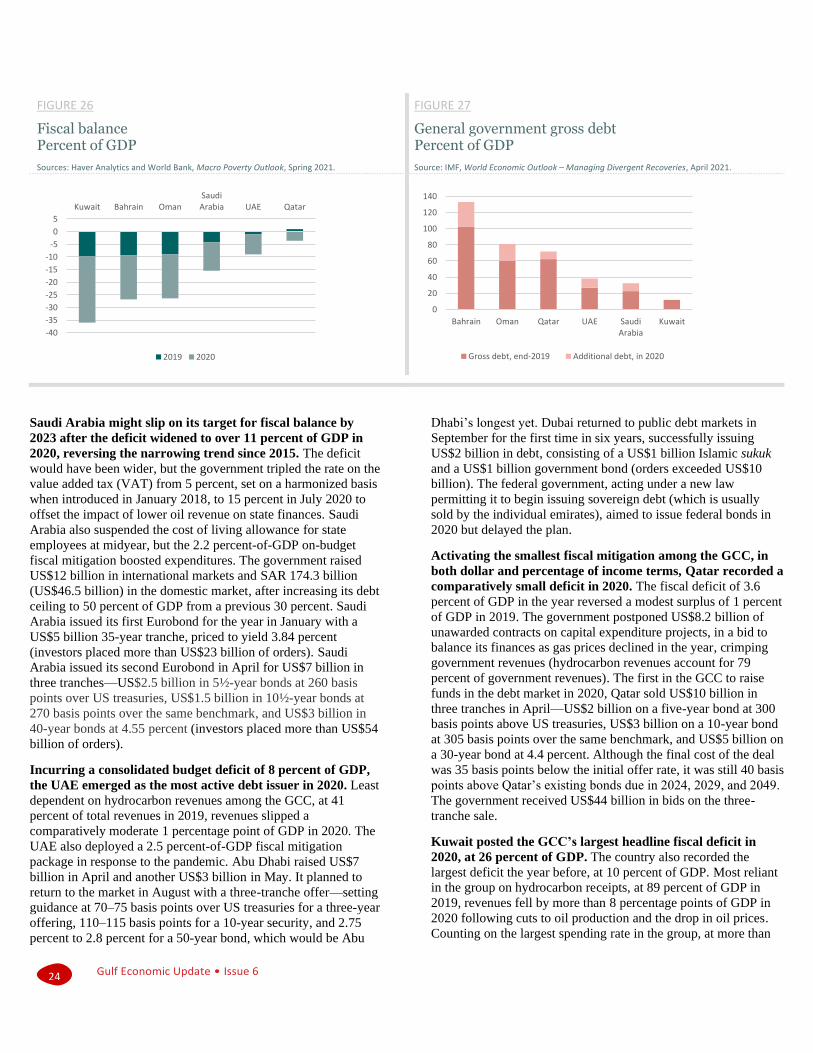
Gulf Economic Update • Issue 6
24
FIGURE 26
Fiscal balance Percent of GDP
Sources: Haver Analytics and World Bank, Macro Poverty Outlook, Spring 2021.
FIGURE 27
General government gross debt Percent of GDP
Source: IMF, World Economic Outlook – Managing Divergent Recoveries, April 2021.
Saudi Arabia might slip on its target for fiscal balance by
2023 after the deficit widened to over 11 percent of GDP in
2020, reversing the narrowing trend since 2015. The deficit
would have been wider, but the government tripled the rate on the
value added tax (VAT) from 5 percent, set on a harmonized basis
when introduced in January 2018, to 15 percent in July 2020 to
offset the impact of lower oil revenue on state finances. Saudi
Arabia also suspended the cost of living allowance for state
employees at midyear, but the 2.2 percent-of-GDP on-budget
fiscal mitigation boosted expenditures. The government raised
US$12 billion in international markets and SAR 174.3 billion
(US$46.5 billion) in the domestic market, after increasing its debt
ceiling to 50 percent of GDP from a previous 30 percent. Saudi
Arabia issued its first Eurobond for the year in January with a
US$5 billion 35-year tranche, priced to yield 3.84 percent
(investors placed more than US$23 billion of orders). Saudi
Arabia issued its second Eurobond in April for US$7 billion in
three tranches—US$2.5 billion in 5½-year bonds at 260 basis
points over US treasuries, US$1.5 billion in 10½-year bonds at
270 basis points over the same benchmark, and US$3 billion in
40-year bonds at 4.55 percent (investors placed more than US$54
billion of orders).
Incurring a consolidated budget deficit of 8 percent of GDP,
the UAE emerged as the most active debt issuer in 2020. Least
dependent on hydrocarbon revenues among the GCC, at 41
percent of total revenues in 2019, revenues slipped a
comparatively moderate 1 percentage point of GDP in 2020. The
UAE also deployed a 2.5 percent-of-GDP fiscal mitigation
package in response to the pandemic. Abu Dhabi raised US$7
billion in April and another US$3 billion in May. It planned to
return to the market in August with a three-tranche offer—setting
guidance at 70–75 basis points over US treasuries for a three-year
offering, 110–115 basis points for a 10-year security, and 2.75
percent to 2.8 percent for a 50-year bond, which would be Abu
Dhabi’s longest yet. Dubai returned to public debt markets in
September for the first time in six years, successfully issuing
US$2 billion in debt, consisting of a US$1 billion Islamic sukuk
and a US$1 billion government bond (orders exceeded US$10
billion). The federal government, acting under a new law
permitting it to begin issuing sovereign debt (which is usually
sold by the individual emirates), aimed to issue federal bonds in
2020 but delayed the plan.
Activating the smallest fiscal mitigation among the GCC, in
both dollar and percentage of income terms, Qatar recorded a
comparatively small deficit in 2020. The fiscal deficit of 3.6
percent of GDP in the year reversed a modest surplus of 1 percent
of GDP in 2019. The government postponed US$8.2 billion of
unawarded contracts on capital expenditure projects, in a bid to
balance its finances as gas prices declined in the year, crimping
government revenues (hydrocarbon revenues account for 79
percent of government revenues). The first in the GCC to raise
funds in the debt market in 2020, Qatar sold US$10 billion in
three tranches in April—US$2 billion on a five-year bond at 300
basis points above US treasuries, US$3 billion on a 10-year bond
at 305 basis points over the same benchmark, and US$5 billion on
a 30-year bond at 4.4 percent. Although the final cost of the deal
was 35 basis points below the initial offer rate, it was still 40 basis
points above Qatar’s existing bonds due in 2024, 2029, and 2049.
The government received US$44 billion in bids on the three-
tranche sale.
Kuwait posted the GCC’s largest headline fiscal deficit in
2020, at 26 percent of GDP. The country also recorded the
largest deficit the year before, at 10 percent of GDP. Most reliant
in the group on hydrocarbon receipts, at 89 percent of GDP in
2019, revenues fell by more than 8 percentage points of GDP in
2020 following cuts to oil production and the drop in oil prices.
Counting on the largest spending rate in the group, at more than
-40
-35
-30
-25
-20
-15
-10
-5
0
5
Kuwait Bahrain OmanSaudiArabia UAE Qatar
2019 2020
0
20
40
60
80
100
120
140
Bahrain Oman Qatar UAE SaudiArabia
Kuwait
Gross debt, end-2019 Additional debt, in 2020

Gulf Economic Update • Issue 6
25
half of GDP since 2015, government expenditures rose by 8
percentage points of GDP in 2020 on the strength of additional
spending in response to the pandemic. Unable to raise financing
overseas under statutory borrowing limits—the Parliament has
continually resisted proposals to raise the cap—Kuwait has been
dipping into the liquid assets of the General Reserve Fund (GRF),
the sovereign wealth fund that covers any deficit the country
suffers. The reserve fund was recently replenished with KWD 6–7
billion (US$19.9–23.2 billion) in a swap of assets with the Future
Generations Fund (FGF), after a law in 2020 halted the
mandatory transfer of 10 percent of annual state revenues to the
FGF. The Kuwait Petroleum Corporation also agreed to pay
accrued dividends owed to GRF of about KWD 8.25 billion
(US$27.4 billion), including fees, in annual installments over the
next 15 years.
Oman’s fiscal deficit nearly doubled from 2019 to 2020. A
sharp fall in hydrocarbon revenues (over 75 percent of
government revenues for this small crude oil producer) and an
expansion in expenditures to provide economic relief to
businesses and households widened the fiscal deficit to over 17
percent of GDP in 2020. Oman managed to secure a US$2 billion
one-year bridge loan from a group of international and regional
banks in August before a US$2 billion bond issue in October.
Following a decline in yields of more than 70 basis points, Oman
returned to the market in November in a tap of the bonds
originally issued in October, selling US$200 million in bonds due
in 2027 at a yield of 6.3 percent (against an initial guidance of
6.45 percent) and US$300 million in bonds due in 2032 at a yield
of 6.9 percent (against an initial guidance of 7.05 percent).
Government debt topped 80 percent of GDP in end-2020 for the
GCC’s second most-indebted government (after Bahrain).
Standard and Poor’s (S&P), Moody’s, and Fitch downgraded the
country’s sovereign rating twice in the year, with the S&P’s
second downgrade to B+ (four levels into the non-investment
grade) settling one grade lower than either Moody’s or Fitch’s.
Deploying the largest fiscal mitigation in the GCC relative to
the size of the national economy, Bahrain widened its fiscal
deficit to over 17 percent of GDP in 2020. The outturn reversed
the narrowing path achieved in 2019, after the country received a
US$10 billion financial support package from Saudi Arabia, the
UAE, and Kuwait in return for a fiscal consolidation plan, the
Fiscal Balance Program (FBP), that would balance the budget by
2023. Facing budgetary financing needs of US$4.3 billion in 2020
alone, not including a US$1.25 billion bond repayment due in
March, Bahrain went to the market twice in 2020. In May, it sold
a US$1 billion 4½-year sukuk at 6 percent and a US$1 billion 10-
year conventional bond at 8 percent. In September, it sold a US$1
billion 7-year sukuk at 3.95 percent and a US$1 billion 12-year
conventional bond at 5.45 percent, receiving more than US$7.6
billion in combined offers for the two-tranche paper. Bahrain
added the most—31 percentage points of GDP—to government
debt in 2020, taking the general government gross debt ratio to
133 percent of GDP in end-2020 in an exceptionally rapid buildup
of public debt from 120 percent of GDP in 2019 and 45 percent of
GDP in 2014.
Monetary policy and macro-financial measures aimed to ease financial conditions …
In addition to lowering policy rates, the GCC central banks
opened new liquidity facilities to support bank liquidity and
private sector credit. The rate reductions were made in March and
April 2020 (Figure 28) and followed cuts by the US Federal
Reserve to the federal funds rate, by 50 basis points from 1.625
percent to 1.125 percent (target range of 1.0–1.25 percent) on
March 3 and by 100 basis points from 1.125 percent to 0.125
percent (target range of 0–0.25 percent) on March 15. The GCC
central banks have regularly tracked policy decisions by the US
Federal Reserve to maintain the peg of the GCC currencies to the
US dollar, and the rate reductions in 2020 were not unexpected.
Separately, the monetary authorities launched various measures to
support credit and economic activity, headlined by the opening of
new facilities to boost bank liquidity. The size of the packages
ranged from 4 percent of GDP in Saudi Arabia to 33 percent of
GDP in Oman (Figure 29).

Gulf Economic Update • Issue 6
26
FIGURE 28
Policy rates Percent per year
Source: Haver Analytics.
FIGURE 29
Bank liquidity and private credit measures US$, billions and percent of GDP
Sources: IMF, Policy Responses to COVID-19 – Policy Tracker, and OECD, COVID-19 Crisis Response in MENA Countries. Note: Monetary measures by Kuwait were not quantified.
The Saudi Central Bank (SAMA) launched two packages of
SAR 50 billion (US$13.3 billion) each to support private
activity. The first measure, announced in March 2020, provided
funding to banks to allow them to increase lending to businesses
and to defer payments on existing loans. It also covered fees for
point-of-sale and e-commerce transactions for three months.
Moreover, the central bank instructed banks to delay payments of
loans extended to Saudi employees by three months, provide
financing to bank customers who lose their jobs, and exempt
customers from various banking fees. The second measure,
unveiled in June, involved the injection of another SAR 50 billion
(US$13.3 billion) into the banking system through deposit
placements to support bank liquidity and private sector credit. A
total SAR 100 billion (US$26.6 billion) has been used under these
support programs. Meanwhile, the deferred payments and
guaranteed facility programs are effective until June 2021. The
support package followed policy decisions to reduce benchmark
interest rates twice in March, taking the reverse repo and repo
rates lower by a combined 125 basis points to 0.5 percent and 1
percent, respectively.
The Central Bank of the United Arab Emirates launched an
AED 256 billion (US$70 billion) monetary mitigation,
headlined by AED 50 billion in zero-interest-rate
collateralized loans to banks. The package of measures also
included reductions in bank reserve requirements from 14 percent
to 7 percent; authorizations in the use of bank’s excess capital
buffers, estimated at AED 50 billion; reductions in provisioning
for loans to SMEs by 15–25 percent; increases in the loan-to-
value ratio for first-time home buyers by 5 percentage points;
limits on bank fees for SMEs; waivers on all payment services
fees charged by the central bank for a period of six months;
increases in the limit on banks’ exposure to real estate from 20
percent to 30 percent of risk-weighted assets, subject to adequate
provisioning; permission for banks to defer loan repayments until
end-2020; extension of the support measures until June 2021; and
relaxation of the net-stable-funding ratio and the advances-to-
stable-resources ratio until end-2021. Earlier, the central bank
reduced policy rates twice, by a combined 125 basis points, taking
the central bank certificate of deposit (CD) rate from 2.5 percent
to 1.25 percent and the repo rate on CDs with the central bank
from 2 percent to 0.75 percent.
The Qatar Central Bank introduced a zero interest rate
special repo window of QAR 50 billion (US$14.6 billion) to
provide liquidity to banks. The window would allow banks to
grant new loans and to postpone loan installments. The central
bank repo window was separate from, and additional to, other
facilities opened by government-owned financial institutions to
support credit during the pandemic. Administering the National
Guarantee Program, the Qatar Development Bank allocated QAR
5 billion (US$1.46 billion) in government guarantees for a period
of 12 months to local banks for loans granted to private
companies for paying wages and rental fees. The development
bank also postponed loan payments due from all borrowers for a
period of six months. Both measures expire in June 2021. The
Qatar Islamic Bank, the country’s largest Shari’a-compliant
lender and partly owned by the Qatar Investment Authority,
offered interest-free loans to private companies under the same
guarantee program. Meanwhile, the Qatar Financial Centre, the
country’s onshore international financial center with 960
registered firms, extended the deadline for paying taxes until
August 2020, cut the rate on late tax payments to zero until
September 2020, and further extended the deadline on tax
payments to June 2021. Lowering interest rates twice in March,
the central bank reduced the repo rate by 100 basis points from 2
0.0
1.0
2.0
3.0
4.0
5.0
Jan
-20
16
Ap
r-2
01
6
Jul-
20
16
Oct
-20
16
Jan
-20
17
Ap
r-2
01
7
Jul-
20
17
Oct
-20
17
Jan
-20
18
Ap
r-2
01
8
Jul-
20
18
Oct
-20
18
Jan
-20
19
Ap
r-2
01
9
Jul-
20
19
Oct
-20
19
Jan
-20
20
Ap
r-2
02
0
Jul-
20
20
Oct
-20
20
Jan
-20
21
Ap
r-2
02
1
Saudi Arabia UAE Qatar
Kuwait Oman Bahrain
U.S.
0
5
10
15
20
25
30
35
0
10
20
30
40
50
60
70
80
SaudiArabia
UAE Qatar Kuwait Oman Bahrain
US$ billion Percent of GDP (rhs)

Gulf Economic Update • Issue 6
27
percent to 1 percent, the deposit rate by 100 basis points from 2
percent to 1 percent, and the lending rate by 175 basis points from
4.25 percent to 2.5 percent.
The Central Bank of Kuwait (CBK) committed to provide
liquidity to banks as needed. The authorities did not report
opening new facilities, and the support measures were not
quantified for their liquidity impact in gross financial terms. They
included guarantees for bank loans to businesses affected by the
pandemic (covered by a parliamentary act); delays in loan
payments by companies and households to banks (since extended
for loans to nationals, until September 2021); provision by banks
of loans to SMEs at a maximum interest rate of 2.5 percent; a
decrease in the risk weights used in calculating capital adequacy
ratios for bank loans to SMEs from 75 percent to 25 percent of
risk-weighted assets; reduction in capital adequacy requirements
at banks from 13 percent to 10.5 percent; reduction in the
regulatory net-stable-funding ratio from 100 percent to 85 percent
and the liquidity ratio from 18 percent to 15 percent; and increase
in the loan-to-value limit on land purchases for residential
projects from 50 percent to 60 percent, on purchases of existing
homes from 60 percent to 70 percent, and on home construction
from 70 percent to 80 percent. The central bank had cut the
discount rate by 100 basis points from 2.75 percent to 1.5 percent
in March 2020. It followed up with cuts of 125 basis points on
other monetary policy instruments—the repo, CBK bonds, the
term-deposit system, direct intervention instruments, and public
debt instruments—over the entire yield curve (up to the 10-year
term) in October 2020.
The Central Bank of Oman estimated the impact of its macro-
financial support measures at OMR 8 billion (US$20.8 billion)
of additional liquidity. The first package in March consisted of a
reduction in the capital conservation buffer at banks by 50
percent; an increase in the net credit-to-deposit-base from 87.5
percent to 92.5 percent; the immediate approval of requests by
borrowers for deferral of loan installment payments for the next
six months, without adverse impact on the risk classification of
the loans; and the postponement by six months of the risk
classification of loans to the government for projects. The central
bank added to these measures with a second package in
September consisting of an extension of the loan deferment
scheme to March 2021; the increase in the limit of the foreign
exchange swap facility of up to 100 percent of a bank’s net worth;
the extension of the tenor of the facility for up to one year; the
reduction in the loan-to-value ratio on housing loans for first-time
buyers from 20 percent to 10 percent; and a scheme allowing
banks to temporarily operate below the 100 percent liquidity
coverage ratio to a minimum 75 percent, in cases of liquidity
stress and subject to the approval by the central bank. Executing a
two-step reduction in its policy rate, the Central Bank of Oman
cut its repo rate by a cumulative 165 basis points to 0.5 percent
over March–April 2020. The repo rate had stood at 2.15 percent
in February. The central bank also extended the period of repo
operations to three months and reduced the interest rates for other
money market instruments.
The Central Bank of Bahrain expanded its lending facilities to
banks by up to BHD 3.7 billion (US$10 billion) in March
2020. The support measures would facilitate additional bank
credit to the private sector and allow for deferred debt payments.
Other support measures included a reduction in the cash reserve
ratio for retail banks from 5 percent to 3 percent, a relaxation of
the loan-to-value ratios for new residential mortgages, a cap on
fees for debit cards, automatic deferrals on loan principal and
interest payments from March to August 2020, and optional
deferrals on interest payments from September 2020 to June
2021. In line with policy moves by the US Federal Reserve, the
central bank also cut its one-week deposit facility rate by 125
basis points from 2.25 percent to 1 percent, the overnight deposit
rate by 125 basis points from 2 percent to 0.75 percent, and the
overnight lending rate by 155 basis points from 4 percent to 2.45
percent.
… helping to backstop bank capital buffers and sustain exposure to existing borrowers
Credit to the private sector held up as a percentage of
national income in 2020. Bank credit to private borrowers
declined in nominal terms in four of the GCC countries last year
but by less than the reduction in the national output.
Consequently, credit to the private sector remained stable, in
percentage of GDP terms, in all GCC economies (Figure 30).
Meanwhile, buffers and liquidity at banks remained generally
healthy. The capital adequacy ratio (the ratio of regulatory tier 1
capital to risk-weighted assets) posted above the global median
for all five GCC countries for which data were available (Figure 31). Banks in Qatar, Bahrain, and Kuwait scored above the
median on bank liquidity (the ratio of liquid assets to short-term
liabilities) while banks in Saudi Arabia ranked above the 25th
percentile. Only banks in the UAE scored below the 25th
percentile.
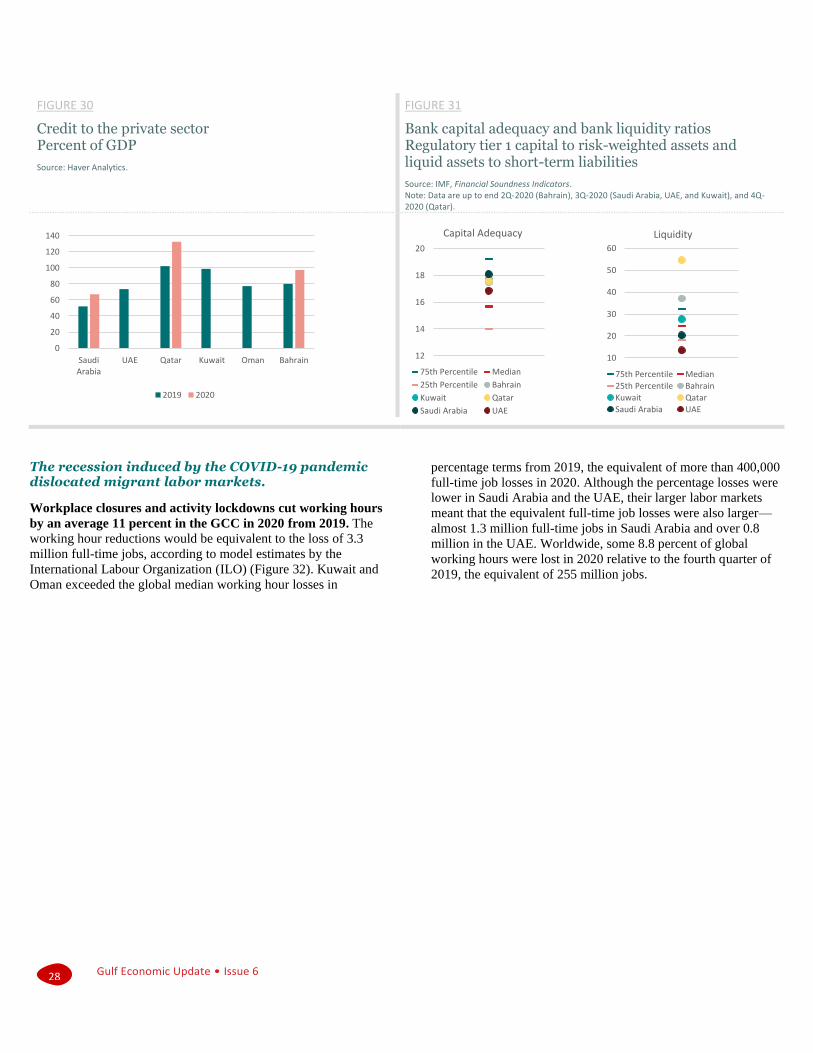
Gulf Economic Update • Issue 6
28
FIGURE 30
Credit to the private sector Percent of GDP
Source: Haver Analytics.
FIGURE 31
Bank capital adequacy and bank liquidity ratios Regulatory tier 1 capital to risk-weighted assets and liquid assets to short-term liabilities
Source: IMF, Financial Soundness Indicators. Note: Data are up to end 2Q-2020 (Bahrain), 3Q-2020 (Saudi Arabia, UAE, and Kuwait), and 4Q-2020 (Qatar).
The recession induced by the COVID-19 pandemic dislocated migrant labor markets.
Workplace closures and activity lockdowns cut working hours
by an average 11 percent in the GCC in 2020 from 2019. The
working hour reductions would be equivalent to the loss of 3.3
million full-time jobs, according to model estimates by the
International Labour Organization (ILO) (Figure 32). Kuwait and
Oman exceeded the global median working hour losses in
percentage terms from 2019, the equivalent of more than 400,000
full-time job losses in 2020. Although the percentage losses were
lower in Saudi Arabia and the UAE, their larger labor markets
meant that the equivalent full-time job losses were also larger—
almost 1.3 million full-time jobs in Saudi Arabia and over 0.8
million in the UAE. Worldwide, some 8.8 percent of global
working hours were lost in 2020 relative to the fourth quarter of
2019, the equivalent of 255 million jobs.
0
20
40
60
80
100
120
140
SaudiArabia
UAE Qatar Kuwait Oman Bahrain
2019 2020
12
14
16
18
20
Capital Adequacy
75th Percentile Median
25th Percentile Bahrain
Kuwait Qatar
Saudi Arabia UAE
10
20
30
40
50
60
Liquidity
75th Percentile Median
25th Percentile Bahrain
Kuwait Qatar
Saudi Arabia UAE

Gulf Economic Update • Issue 6
29
FIGURE 32
Change in working hours and change in working hours in full-time equivalent jobs Percent and thousands
Source: ILO, COVID-19 and the World of Work – Statistical Appendix, January 2021.
FIGURE 33
Social protection responses to COVID-19
Source: ILO, Global Database on Social Protection Responses to COVID-19, December 2020.
Sau
di A
rab
ia
UA
E
Qat
ar
Ku
wai
t
Om
an
Bah
rain
Labor market
Wage subsidy
Activation (training)
Labor regulation adjustment
Reduced work time subsidy
Social insurance
Paid leave/unemployment
Health insurance support
Pensions and disability benefits Social security contributions (waiver/subsidy)
Social assistance
Cash-based transfers
Public works
In-kind (in-kind/school feeding)
Utility and financial support
The authorities responded with relief measures to ameliorate
the effects of the job losses. The assistance included wage
subsidies, unemployment insurance, support for health insurance,
waivers on social security contributions, cash transfers, in-kind
assistance, and utility and financial support (Figure 33).
In the GCC, where foreign labor dominates private sector
employment (Figure 34), migrant workers would have been
specially at risk to labor market disruptions. Spurred by job
losses and anticipated lockdowns, migrant workers rushed to
return home, reversing migration patterns that had taken root over
the past decades. Globally, outward remittances may have
slumped by 20 percent or US$11 billion in 2020, according to the
Global Knowledge Partnership on Migration and Development
(KNOMAD). Preliminary data on the GCC depict a mixed
picture, however. While outward remittances dropped 10 percent
in Qatar and 3 percent in the UAE, they remained resilient and
rose 8 percent in Saudi Arabia (Figure 35).
-20
-15
-10
-5
0
Kuwait Oman Qatar UAE BahrainSaudiArabia
Change in working hours in 2020 from 2019, percent
Median, 185 countries
-1400
-1200
-1000
-800
-600
-400
-200
0
Kuwait Oman Qatar UAE BahrainSaudiArabia
Change in working hours in 2020 from 2019, in full-timeequivalent jobs, thousands
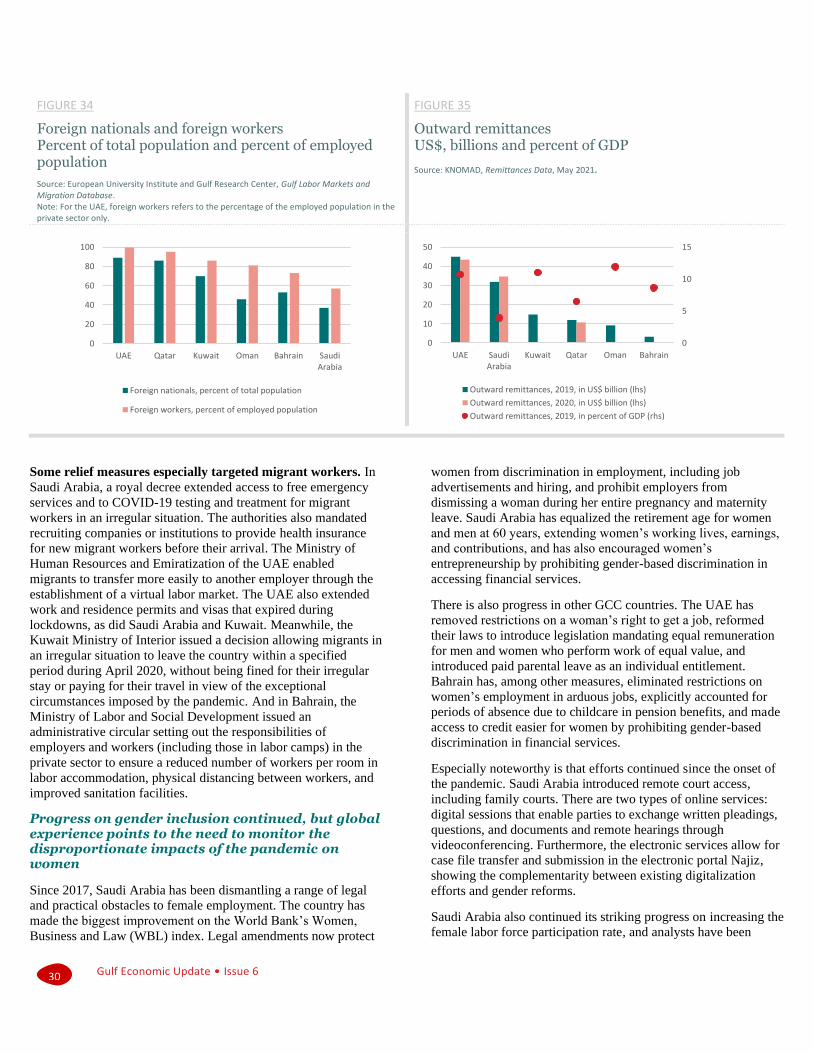
Gulf Economic Update • Issue 6
30
FIGURE 34
Foreign nationals and foreign workers Percent of total population and percent of employed population
Source: European University Institute and Gulf Research Center, Gulf Labor Markets and Migration Database. Note: For the UAE, foreign workers refers to the percentage of the employed population in the private sector only.
FIGURE 35
Outward remittances US$, billions and percent of GDP
Source: KNOMAD, Remittances Data, May 2021.
Some relief measures especially targeted migrant workers. In
Saudi Arabia, a royal decree extended access to free emergency
services and to COVID-19 testing and treatment for migrant
workers in an irregular situation. The authorities also mandated
recruiting companies or institutions to provide health insurance
for new migrant workers before their arrival. The Ministry of
Human Resources and Emiratization of the UAE enabled
migrants to transfer more easily to another employer through the
establishment of a virtual labor market. The UAE also extended
work and residence permits and visas that expired during
lockdowns, as did Saudi Arabia and Kuwait. Meanwhile, the
Kuwait Ministry of Interior issued a decision allowing migrants in
an irregular situation to leave the country within a specified
period during April 2020, without being fined for their irregular
stay or paying for their travel in view of the exceptional
circumstances imposed by the pandemic. And in Bahrain, the
Ministry of Labor and Social Development issued an
administrative circular setting out the responsibilities of
employers and workers (including those in labor camps) in the
private sector to ensure a reduced number of workers per room in
labor accommodation, physical distancing between workers, and
improved sanitation facilities.
Progress on gender inclusion continued, but global experience points to the need to monitor the disproportionate impacts of the pandemic on women
Since 2017, Saudi Arabia has been dismantling a range of legal
and practical obstacles to female employment. The country has
made the biggest improvement on the World Bank’s Women,
Business and Law (WBL) index. Legal amendments now protect
women from discrimination in employment, including job
advertisements and hiring, and prohibit employers from
dismissing a woman during her entire pregnancy and maternity
leave. Saudi Arabia has equalized the retirement age for women
and men at 60 years, extending women’s working lives, earnings,
and contributions, and has also encouraged women’s
entrepreneurship by prohibiting gender-based discrimination in
accessing financial services.
There is also progress in other GCC countries. The UAE has
removed restrictions on a woman’s right to get a job, reformed
their laws to introduce legislation mandating equal remuneration
for men and women who perform work of equal value, and
introduced paid parental leave as an individual entitlement.
Bahrain has, among other measures, eliminated restrictions on
women’s employment in arduous jobs, explicitly accounted for
periods of absence due to childcare in pension benefits, and made
access to credit easier for women by prohibiting gender-based
discrimination in financial services.
Especially noteworthy is that efforts continued since the onset of
the pandemic. Saudi Arabia introduced remote court access,
including family courts. There are two types of online services:
digital sessions that enable parties to exchange written pleadings,
questions, and documents and remote hearings through
videoconferencing. Furthermore, the electronic services allow for
case file transfer and submission in the electronic portal Najiz,
showing the complementarity between existing digitalization
efforts and gender reforms.
Saudi Arabia also continued its striking progress on increasing the
female labor force participation rate, and analysts have been
0
20
40
60
80
100
UAE Qatar Kuwait Oman Bahrain SaudiArabia
Foreign nationals, percent of total population
Foreign workers, percent of employed population
0
5
10
15
0
10
20
30
40
50
UAE SaudiArabia
Kuwait Qatar Oman Bahrain
Outward remittances, 2019, in US$ billion (lhs)
Outward remittances, 2020, in US$ billion (lhs)
Outward remittances, 2019, in percent of GDP (rhs)
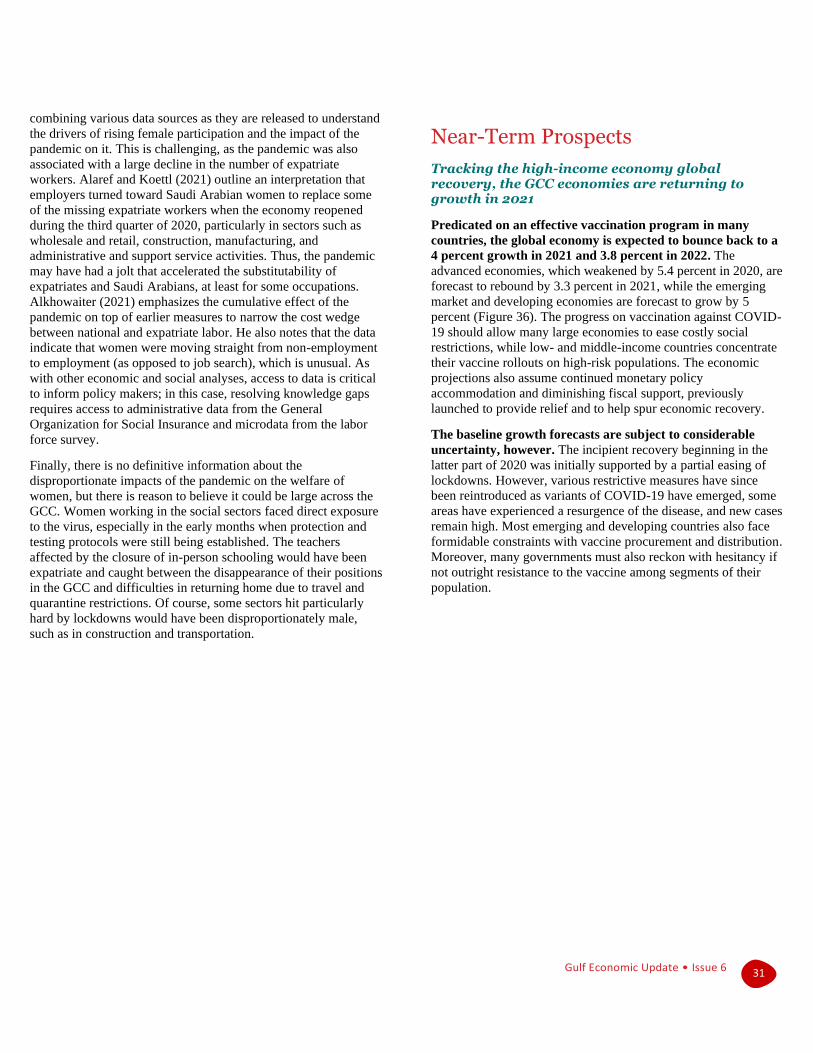
Gulf Economic Update • Issue 6
31
combining various data sources as they are released to understand
the drivers of rising female participation and the impact of the
pandemic on it. This is challenging, as the pandemic was also
associated with a large decline in the number of expatriate
workers. Alaref and Koettl (2021) outline an interpretation that
employers turned toward Saudi Arabian women to replace some
of the missing expatriate workers when the economy reopened
during the third quarter of 2020, particularly in sectors such as
wholesale and retail, construction, manufacturing, and
administrative and support service activities. Thus, the pandemic
may have had a jolt that accelerated the substitutability of
expatriates and Saudi Arabians, at least for some occupations.
Alkhowaiter (2021) emphasizes the cumulative effect of the
pandemic on top of earlier measures to narrow the cost wedge
between national and expatriate labor. He also notes that the data
indicate that women were moving straight from non-employment
to employment (as opposed to job search), which is unusual. As
with other economic and social analyses, access to data is critical
to inform policy makers; in this case, resolving knowledge gaps
requires access to administrative data from the General
Organization for Social Insurance and microdata from the labor
force survey.
Finally, there is no definitive information about the
disproportionate impacts of the pandemic on the welfare of
women, but there is reason to believe it could be large across the
GCC. Women working in the social sectors faced direct exposure
to the virus, especially in the early months when protection and
testing protocols were still being established. The teachers
affected by the closure of in-person schooling would have been
expatriate and caught between the disappearance of their positions
in the GCC and difficulties in returning home due to travel and
quarantine restrictions. Of course, some sectors hit particularly
hard by lockdowns would have been disproportionately male,
such as in construction and transportation.
Near-Term Prospects
Tracking the high-income economy global recovery, the GCC economies are returning to growth in 2021
Predicated on an effective vaccination program in many
countries, the global economy is expected to bounce back to a
4 percent growth in 2021 and 3.8 percent in 2022. The
advanced economies, which weakened by 5.4 percent in 2020, are
forecast to rebound by 3.3 percent in 2021, while the emerging
market and developing economies are forecast to grow by 5
percent (Figure 36). The progress on vaccination against COVID-
19 should allow many large economies to ease costly social
restrictions, while low- and middle-income countries concentrate
their vaccine rollouts on high-risk populations. The economic
projections also assume continued monetary policy
accommodation and diminishing fiscal support, previously
launched to provide relief and to help spur economic recovery.
The baseline growth forecasts are subject to considerable
uncertainty, however. The incipient recovery beginning in the
latter part of 2020 was initially supported by a partial easing of
lockdowns. However, various restrictive measures have since
been reintroduced as variants of COVID-19 have emerged, some
areas have experienced a resurgence of the disease, and new cases
remain high. Most emerging and developing countries also face
formidable constraints with vaccine procurement and distribution.
Moreover, many governments must also reckon with hesitancy if
not outright resistance to the vaccine among segments of their
population.

Gulf Economic Update • Issue 6
32
FIGURE 36
GDP growth projections Percent
Source: World Bank, Global Economic Prospects – January 2021.
FIGURE 37
Energy price projections Percent
Source: World Bank, Commodity Markets Outlook – April 2021.
Oil demand is expected to firm with the global economic
recovery. Oil prices are projected to average US$56 per barrel in
2021 and US$61 per barrel in 2022 in the baseline (Figure 37) as
oil demand will likely approach around 97 percent of the 2019
volume in 2021 before returning to pre-pandemic levels by 2023.
Meanwhile, global oil supply is set to increase as Saudi Arabia is
anticipated to gradually unwind its voluntary production cut in the
second half of 2021. Thereafter, global output will likely pick up
by under 1 million barrels per day in 2022. As with crude oil
prices, natural gas prices are expected to gradually increase over
the forecast period.
The baseline energy projections are subject to risks on both
the demand and the supply sides. The evolution of the
pandemic poses the principal risk to oil demand. A more rapid
pace of vaccination and a more effective control of the pandemic
will likely lift oil demand especially in the advanced economies
where weakness in demand is currently concentrated. However,
the continued spread of the disease with the emergence of new
variants and renewed lockdowns could extend the weakness in
global oil demand. The stability of the OPEC+ production
agreement poses the principal risk to oil supply. A breakdown of
the OPEC+ production restraint agreement could result in a
sudden increase in global oil output, sending oil prices materially
lower than currently expected. Pressure on the OPEC+ agreement
could come from a pandemic-driven deterioration in oil demand
or a sharper-than-expected increase in US shale output.
Growth in the GCC will restart moderately in 2021, before
picking up to an average 3.3 percent in 2021–23. The gradual
uptick (Table 1) reflects the lingering economic damage from the
pandemic and the deep decline in oil prices in 2020. Still highly
reliant on hydrocarbon output, exports, and revenues despite
diversification efforts, the GCC economies will benefit from the
recovery in global oil demand and oil prices. GDP for the group
would top US$1.7 trillion by 2023 (Figure 38).
-6
-4
-2
0
2
4
6
2018 2019 2020e 2021f 2022f
World
Advanced economies
Emerging market and developing economies
0
2
4
6
8
10
30
40
50
60
70
2019 2020 2021f 2022f 2023f
Crude oil, US$ per barrel (lhs)Natural gas, Europe, US$ mmbtu (rhs)Natural gas, U.S., US$ mmbtu (rhs)Liquefied natural gas, Japan, US$ mmbtu (rhs)

Gulf Economic Update • Issue 6
33
TABLE 1
MENA GCC forecast summary (Annual percentage change unless otherwise specified)
Source: World Bank, Macro and Poverty Outlook, April 2021. Note: e = estimate; f = forecast. GDP at market prices measured in constant 2010 US dollars. a. Exports less imports of goods and nonfactor services (GNFS).
2019 2020e 2021f 2022f 2023f
Aggregate GCC countries:
GCC at market prices 0.7 −4.8 2.2 3.4 3.2
Contributions to growth
Private consumption 2.5 −2.1 1.1 1.2 1.1
Government consumption 0.6 0.5 0.5 0.4 0.3
Fixed investment 0.7 −2.3 0.7 0.9 0.9
Net exports, GNFSa −2.6 −0.7 0.3 0.5 0.5
Current account balance (% of GDP) 6.8 −2.9 2.6 5.0 6.9
Fiscal balance (% of GDP) −3.9 −11.6 −6.3 −3.3 −2.3
Terms of trade −4.7 0.0 0.0 0.3 0.2
Individual GCC countries:
Bahrain 2.0 −5.1 3.3 3.2 3.2
Kuwait 0.4 −5.4 2.4 3.6 2.8
Oman −0.8 −6.3 2.5 6.5 4.2
Qatar 0.8 −3.7 3.0 4.1 4.5
Saudi Arabia 0.3 −4.1 2.4 3.3 3.2
United Arab Emirates 1.7 −6.1 1.2 2.5 2.5
The recovery is expected to be driven by private consumption
and fixed investment. A resumption of oil and gas projects
delayed by the recession in 2020 and the implementation of
capital projects associated with economic diversification
programs will help revive investment (Figure 39). Contributions
to growth from public consumption will likely be constrained by
the requirements for fiscal adjustment in the smaller economies
facing high external debt burdens. Meanwhile, gains from oil and
gas exports will be trimmed by deficits in services trade and
debits to primary and secondary income accounts associated with
interest on debt and workers’ outward remittances.
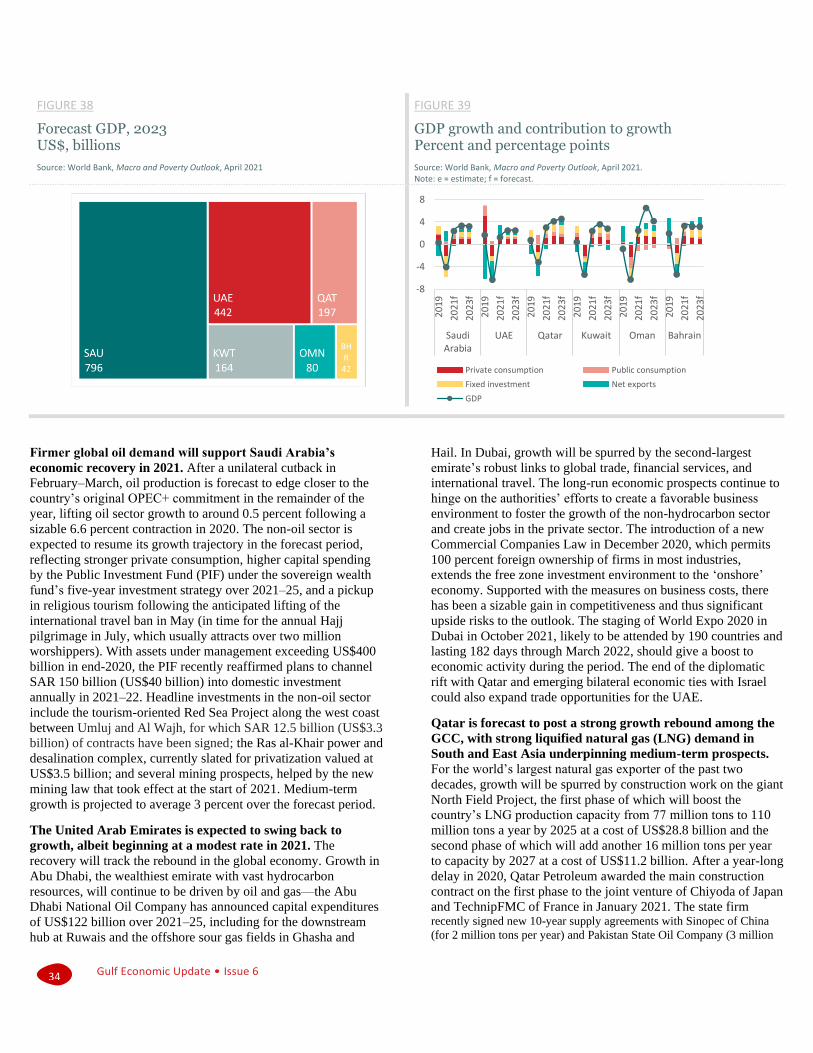
Gulf Economic Update • Issue 6
34
FIGURE 38
Forecast GDP, 2023 US$, billions
Source: World Bank, Macro and Poverty Outlook, April 2021
FIGURE 39
GDP growth and contribution to growth Percent and percentage points
Source: World Bank, Macro and Poverty Outlook, April 2021. Note: e = estimate; f = forecast.
Firmer global oil demand will support Saudi Arabia’s
economic recovery in 2021. After a unilateral cutback in
February–March, oil production is forecast to edge closer to the
country’s original OPEC+ commitment in the remainder of the
year, lifting oil sector growth to around 0.5 percent following a
sizable 6.6 percent contraction in 2020. The non-oil sector is
expected to resume its growth trajectory in the forecast period,
reflecting stronger private consumption, higher capital spending
by the Public Investment Fund (PIF) under the sovereign wealth
fund’s five-year investment strategy over 2021–25, and a pickup
in religious tourism following the anticipated lifting of the
international travel ban in May (in time for the annual Hajj
pilgrimage in July, which usually attracts over two million
worshippers). With assets under management exceeding US$400
billion in end-2020, the PIF recently reaffirmed plans to channel
SAR 150 billion (US$40 billion) into domestic investment
annually in 2021–22. Headline investments in the non-oil sector
include the tourism-oriented Red Sea Project along the west coast
between Umluj and Al Wajh, for which SAR 12.5 billion (US$3.3
billion) of contracts have been signed; the Ras al-Khair power and
desalination complex, currently slated for privatization valued at
US$3.5 billion; and several mining prospects, helped by the new
mining law that took effect at the start of 2021. Medium-term
growth is projected to average 3 percent over the forecast period.
The United Arab Emirates is expected to swing back to
growth, albeit beginning at a modest rate in 2021. The
recovery will track the rebound in the global economy. Growth in
Abu Dhabi, the wealthiest emirate with vast hydrocarbon
resources, will continue to be driven by oil and gas—the Abu
Dhabi National Oil Company has announced capital expenditures
of US$122 billion over 2021–25, including for the downstream
hub at Ruwais and the offshore sour gas fields in Ghasha and
Hail. In Dubai, growth will be spurred by the second-largest
emirate’s robust links to global trade, financial services, and
international travel. The long-run economic prospects continue to
hinge on the authorities’ efforts to create a favorable business
environment to foster the growth of the non-hydrocarbon sector
and create jobs in the private sector. The introduction of a new
Commercial Companies Law in December 2020, which permits
100 percent foreign ownership of firms in most industries,
extends the free zone investment environment to the ‘onshore’
economy. Supported with the measures on business costs, there
has been a sizable gain in competitiveness and thus significant
upside risks to the outlook. The staging of World Expo 2020 in
Dubai in October 2021, likely to be attended by 190 countries and
lasting 182 days through March 2022, should give a boost to
economic activity during the period. The end of the diplomatic
rift with Qatar and emerging bilateral economic ties with Israel
could also expand trade opportunities for the UAE.
Qatar is forecast to post a strong growth rebound among the
GCC, with strong liquified natural gas (LNG) demand in
South and East Asia underpinning medium-term prospects.
For the world’s largest natural gas exporter of the past two
decades, growth will be spurred by construction work on the giant
North Field Project, the first phase of which will boost the
country’s LNG production capacity from 77 million tons to 110
million tons a year by 2025 at a cost of US$28.8 billion and the
second phase of which will add another 16 million tons per year
to capacity by 2027 at a cost of US$11.2 billion. After a year-long
delay in 2020, Qatar Petroleum awarded the main construction
contract on the first phase to the joint venture of Chiyoda of Japan
and TechnipFMC of France in January 2021. The state firm recently signed new 10-year supply agreements with Sinopec of China
(for 2 million tons per year) and Pakistan State Oil Company (3 million
-8
-4
0
4
8
20
19
20
21f
20
23f
20
19
20
21f
20
23f
20
19
20
21f
20
23f
20
19
20
21f
20
23f
20
19
20
21f
20
23f
20
19
20
21f
20
23f
SaudiArabia
UAE Qatar Kuwait Oman Bahrain
Private consumption Public consumption
Fixed investment Net exports
GDP
Gulf Economic Update • Issue 6
35
tons) and another ‘long-term’ supply agreement with Vitol of
Switzerland for delivery to Bangladesh (1.25 million tons). Meanwhile,
the reconciliation with the Arab quarter should boost Qatar’s airline
industry (Qatar Airways lost its largest markets and re-routed flights with
the diplomatic rift), tourism (half the foreign visitors to Qatar are Saudi
Arabians), logistics (connectivity with Dubai will be critical to Qatar’s
hosting the Federation Internationale de Football Association (FIFA)
World Cup in 2022), and banking (Qatari banks suffered massive foreign
deposit withdrawals at the height of the crisis).
Oil exports and gas for domestic use will continue to drive Kuwait’s
growth dynamics during the forecast period. Economic growth is
forecast to rebound to a moderate 2.5 percent in 2021, before ramping up
to an average 3.2 percent in 2022–23. The country remains heavily
reliant on the oil and gas sector—more than half the economy, 90 percent
of fiscal revenues, and more than 90 percent of merchandise exports (on
all counts, the most extreme among the GCC states). After a two-year
delay, bids were finally submitted in April 2020 for the development of
the fourth and fifth production facilities for Jurassic gas reserves that
should produce 150 million cubic feet per day of gas (as well as 50,000
barrels per day of light oil) and double the production capacity to 1
billion cubic feet per day by 2023, alleviating a supply shortage that has
forced Kuwait to depend on LNG imports for the past 15 years. Tenders
are also expected during the period on the implementation of the US$2.9
billion Kuwait Environmental Remediation Program, using reparations
paid by Iraq to repair damages from the 1990–91 Gulf War. A lethargic
bureaucracy and long-running standoffs between the executive and
legislative branches pose significant risks to the economic outlook.
Public-private partnership (PPP) deals, for instance, a core feature of the
country’s non-oil development strategy—the government wants one-third
of the capital requirements of US$112.4 billion of strategic projects to be
drawn from the private sector—may slow owing to administrative red
tape and parliamentary opposition.
After a deep decline in 2020, Oman’s economy is forecast to
recover in 2021, albeit at a moderate 2.5 percent growth rate
as a sizable infrastructure investment program gains
momentum. Oman’s reexports (reexports are exports of foreign
goods in the same state as previously imported), which revived
last year after a long-term decline, are expected to pick up during
the forecast period following the recent heavy investment in
logistics facilities in the Special Economic Zone at Duqm
(SEZAD), the strategic port of Duqm, and the Duqm Jaaluni
airport. New multimodal facilities at the airport, an 80 ha
commercial quay, 5 million ton dry bulk terminal, 1 million TEU1
container terminal, 9 ha vehicle terminal, 1 million ton
multipurpose terminal, and a naval terminal at the port are set to
make Oman a major transshipment hub for containerized, dry
bulk, liquid bulk, and automotive cargoes and a major regional
facility for the US, UK, and Indian navies. Meanwhile, operations
are to start in 2022 at the first oil refinery in SEZAD, a joint
venture of Oman Oil Company and Kuwait Petroleum
International, that will process 230,000 barrels of crude oil per
day and provide feedstock to many heavy industrial plants. These
and other industrial projects expected to come onstream in
2022—a 326 MW power station, a 36,000 m3 per day desalination
plant, and the 25 million barrel Ras Markaz oil storage facility—
and will boost growth to a back-loaded 6.5 percent in 2022,
before slowing down to 4 percent in 2023, strained by necessary
fiscal adjustment measures.
Bahrain will continue to rely on fiscal support measures in 2021 to overcome the economic contraction in 2020. GDP growth is
expected to reach 3.3 percent in 2021, following the downturn in 2020.
Support measures have focused on SMEs, which suffered most severely
during the pandemic but have since benefited from numerous tenders and
contracts reserved by the government for the sector. Growth will likely
remain moderate in 2022–23, however, as the government must address
debt sustainability issues through an aggressive fiscal consolidation
program. Projects supported by financial aid from Saudi Arabia, the
UAE, and Kuwait will help support growth as will two major oil
projects—the US$6.5 billion Sitra oil refinery expansion, which will
produce 260,000 barrels per day of crude oil and 40,000 barrels per day
of low-sulfur diesel by 2022 and link Bahrain Petroleum Company to
Saudi Aramco through a new pipeline to Saudi Arabia’s eastern province,
and the Khaleej al-Bahrain field development, which will double
Bahrain’s current crude production to 200,000 barrels per day by 2025
from the country’s largest find in nine decades and which holds an
estimated 82 billion barrels of oil and 360 billion m3 of associated gas.
Bahrain must strive to address pressing debt sustainability problems,
however, and difficult tax mobilization and expenditure reduction
measures associated with fiscal adjustment may affect private and
government consumption during the period.
Fiscal deficits are projected to persist over the forecast period
Following record deficits in 2020, government finances in the GCC
are expected to recover only slowly over 2021–23. A rebound
in revenues, spurred by larger oil and gas production and higher
oil and gas prices—the GCC countries remain largely reliant on
hydrocarbon for 73 percent of fiscal revenues—will help
narrowly trim persistent fiscal deficits (Figure 40 and Figure 41).
Three states will complete the implementation of the harmonized
VAT agreed upon by the regional group in 2016—in addition to
Oman which recently adopted the VAT in April 2021, Kuwait is
expected to implement the tax sometime in 2021 and Qatar in
2022. Meanwhile, expenditures are expected to bounce back from
2020, before declining in 2023 as the improving economic
environment will allow most GCC states to refocus on adjustment
measures associated with high wage bills, costly and untargeted
subsidies, and inefficient spending. The regional bloc’s most-
indebted economies, Bahrain and Oman, will find it relatively
more difficult to address these fiscal issues and will require
continuing financial support from their partner states.
1 TEU = twenty-foot equivalent unit.
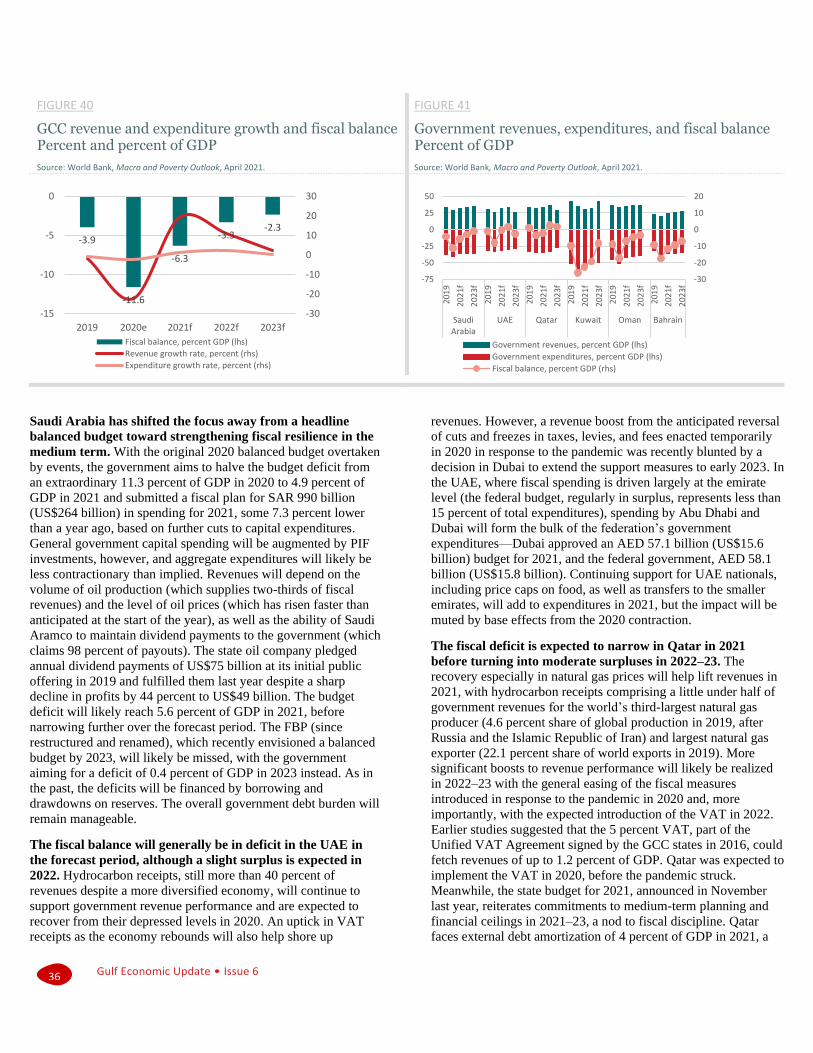
Gulf Economic Update • Issue 6
36
FIGURE 40
GCC revenue and expenditure growth and fiscal balance Percent and percent of GDP
Source: World Bank, Macro and Poverty Outlook, April 2021.
FIGURE 41
Government revenues, expenditures, and fiscal balance Percent of GDP
Source: World Bank, Macro and Poverty Outlook, April 2021.
Saudi Arabia has shifted the focus away from a headline
balanced budget toward strengthening fiscal resilience in the
medium term. With the original 2020 balanced budget overtaken
by events, the government aims to halve the budget deficit from
an extraordinary 11.3 percent of GDP in 2020 to 4.9 percent of
GDP in 2021 and submitted a fiscal plan for SAR 990 billion
(US$264 billion) in spending for 2021, some 7.3 percent lower
than a year ago, based on further cuts to capital expenditures.
General government capital spending will be augmented by PIF
investments, however, and aggregate expenditures will likely be
less contractionary than implied. Revenues will depend on the
volume of oil production (which supplies two-thirds of fiscal
revenues) and the level of oil prices (which has risen faster than
anticipated at the start of the year), as well as the ability of Saudi
Aramco to maintain dividend payments to the government (which
claims 98 percent of payouts). The state oil company pledged
annual dividend payments of US$75 billion at its initial public
offering in 2019 and fulfilled them last year despite a sharp
decline in profits by 44 percent to US$49 billion. The budget
deficit will likely reach 5.6 percent of GDP in 2021, before
narrowing further over the forecast period. The FBP (since
restructured and renamed), which recently envisioned a balanced
budget by 2023, will likely be missed, with the government
aiming for a deficit of 0.4 percent of GDP in 2023 instead. As in
the past, the deficits will be financed by borrowing and
drawdowns on reserves. The overall government debt burden will
remain manageable.
The fiscal balance will generally be in deficit in the UAE in
the forecast period, although a slight surplus is expected in
2022. Hydrocarbon receipts, still more than 40 percent of
revenues despite a more diversified economy, will continue to
support government revenue performance and are expected to
recover from their depressed levels in 2020. An uptick in VAT
receipts as the economy rebounds will also help shore up
revenues. However, a revenue boost from the anticipated reversal
of cuts and freezes in taxes, levies, and fees enacted temporarily
in 2020 in response to the pandemic was recently blunted by a
decision in Dubai to extend the support measures to early 2023. In
the UAE, where fiscal spending is driven largely at the emirate
level (the federal budget, regularly in surplus, represents less than
15 percent of total expenditures), spending by Abu Dhabi and
Dubai will form the bulk of the federation’s government
expenditures—Dubai approved an AED 57.1 billion (US$15.6
billion) budget for 2021, and the federal government, AED 58.1
billion (US$15.8 billion). Continuing support for UAE nationals,
including price caps on food, as well as transfers to the smaller
emirates, will add to expenditures in 2021, but the impact will be
muted by base effects from the 2020 contraction.
The fiscal deficit is expected to narrow in Qatar in 2021
before turning into moderate surpluses in 2022–23. The
recovery especially in natural gas prices will help lift revenues in
2021, with hydrocarbon receipts comprising a little under half of
government revenues for the world’s third-largest natural gas
producer (4.6 percent share of global production in 2019, after
Russia and the Islamic Republic of Iran) and largest natural gas
exporter (22.1 percent share of world exports in 2019). More
significant boosts to revenue performance will likely be realized
in 2022–23 with the general easing of the fiscal measures
introduced in response to the pandemic in 2020 and, more
importantly, with the expected introduction of the VAT in 2022.
Earlier studies suggested that the 5 percent VAT, part of the
Unified VAT Agreement signed by the GCC states in 2016, could
fetch revenues of up to 1.2 percent of GDP. Qatar was expected to
implement the VAT in 2020, before the pandemic struck.
Meanwhile, the state budget for 2021, announced in November
last year, reiterates commitments to medium-term planning and
financial ceilings in 2021–23, a nod to fiscal discipline. Qatar
faces external debt amortization of 4 percent of GDP in 2021, a
-3.9
-11.6
-6.3
-3.3-2.3
-30
-20
-10
0
10
20
30
-15
-10
-5
0
2019 2020e 2021f 2022f 2023f
Fiscal balance, percent GDP (lhs)
Revenue growth rate, percent (rhs)
Expenditure growth rate, percent (rhs)
-30
-20
-10
0
10
20
-75
-50
-25
0
25
50
20
19
20
21
f
20
23
f
20
19
20
21
f
20
23
f
20
19
20
21
f
20
23
f
20
19
20
21
f
20
23
f
20
19
20
21
f
20
23
f
20
19
20
21
f
20
23
f
SaudiArabia
UAE Qatar Kuwait Oman Bahrain
Government revenues, percent GDP (lhs)
Government expenditures, percent GDP (lhs)
Fiscal balance, percent GDP (rhs)

Gulf Economic Update • Issue 6
37
level of which, however, appears manageable. The external debt
stock is projected to taper down to around 49 percent of GDP by
2023 (from 72 percent of GDP in 2020), according to estimates
by the IMF, helped as well by the anticipated improvements in the
fiscal balance in 2022–23.
Although targeted to gradually narrow, the fiscal deficit will
likely remain high in Kuwait over 2021–23. The recovery in oil
prices bodes well for government finances, considering that the
country is most reliant on hydrocarbon receipts among the GCC
(89 percent of total government revenues and 53 percent of GDP
in 2019). Kuwait is scheduled to implement the VAT in 2021, and
expectations are that the plan will be upheld—Kuwait would reap
a larger offtake on the tax than Qatar, estimated at 2.1 percent of
GDP. While revenues will likely improve, the government may
have less scope to control expenditures, however. Structurally, the
wage bill remains large, subsidies and transfers are not targeted,
and spending efficiency is low. The deficit, usually reckoned after
mandatory annual transfers of 10 percent of state oil revenues to
the FGF, but excluding investment income, is projected to top
22.6 percent of GDP in 2021 and 8.3 percent of GDP in 2023.
Financing options, however, remain constrained. Lacking
borrowing authority since October 2017 (the Parliament remains
opposed to the draft debt law), the authorities have resorted to
drawdowns from the GRF for financing. So far, general
government debt of 11.5 percent of GDP in end-2020 is the
lowest in the GCC but may rise quickly with the deficits, if new
borrowing is allowed. Meanwhile, liquid balances at the GRF
have fallen fast, with Fitch Ratings, which downgraded the
sovereign debt outlook from ‘stable’ to ‘negative’ in February
2021, warning that liquid assets will be depleted soon without
compensating measures.
The gradual implementation of reforms under the Medium-
Term Fiscal Plan for 2020–24 should help Oman narrow the
fiscal deficit over the forecast period. The implementation of
the 5 percent VAT in April 2021 (the VAT Law was published in
October 2020) is expected to boost revenues beginning in 2021—
previous studies estimated revenues from the tax at 2 percent of
GDP. Revenues will also be supported by higher oil prices and
higher gas production expected over the forecast period and
augmented by the proceeds from planned privatizations of some
oil and utility assets. Following the recent restructuring of the oil
and gas sector and the creation of the new state energy company,
Energy Development Oman, the exclusion from the state budget
of expenditures related to the Petroleum Development
Corporation (last estimated at OMR 2.3 billion [US$6 billion])
should help rationalize general government expenditures. Other
than this specific measure, however, more general efforts to
reduce expenditures might prove difficult, given concerns over
implied reductions in government jobs. The budget for 2021
targets a cut in expenditures by OMR 2.9 billion (US$7.5 billion)
from 2020 but still allocates up to 80 percent of spending for
wages and other entitlements. Overall, the deficit is forecast to be
reduced to 3.3 percent of GDP by 2023. The deficits, however,
imply that Oman’s debt ratio will remain elevated, at around 70
percent of GDP over the forecast period, and its debt servicing
costs will remain high.
Likewise, the reduction of the fiscal deficit in Bahrain will
depend on the implementation of reforms advanced under the
country’s FBP. Designed in 2018 as a fiscal consolidation effort
to eliminate the country’s long-running deficit by 2022, the
program was linked to US$10 billion in financial aid from Saudi
Arabia, the UAE, and Kuwait for the GCC’s smallest economy
that lacked the vast oil resources of the other Gulf states but
remained highly reliant on hydrocarbon revenues nonetheless
(hydrocarbon receipts were 72 percent of government revenues in
2019). Reiterating its commitment to the objectives of the
program, the government announced a budget for 2021 that
provides for spending of BHD 3.57 billion (US$9.5 billion) and
targets a deficit of BHD 1.1 billion (US$2.9 billion), or around
7.9 percent of GDP (on real economic growth of 3.3 percent). The
plan appears optimistic, however, and the deficit might be higher,
as much as 11.6 percent of GDP, considering that the fiscal
portion of the BHD 4.3 billion (US$11.4 billion) mitigation
package in 2020 will spill into 2021—the authorities are bound to
continue paying half the salaries of nationals in the private sector
and all the electricity and water bills of residential and
commercial consumers well into the current year. A gradual
economic recovery will allow the government to return to the
tighter standards of the FBP. Counting on higher oil prices and
better targeted subsidies, the government could reduce the deficit
to 7 percent of GDP by 2023. The debt ratio, already the highest
among the GCC economies at 132.9 percent of GDP in 2020, will
rise further with the deficits. Bahrain is also counting on
additional grants from Saudi Arabia and the UAE over the
forecast period after the US$10 billion GCC Development Fund
expires in 2021.
Current account balances are expected to gradually recover over the forecast period
With hydrocarbons continuing to dominate the GCC’s export
basket, the recovery in global oil and gas demand and prices
will drive the region’s trade performance. Both goods exports
and imports are expected to quickly recover in 2021 (Figure 42),
although current account balances will only gradually pick up
over the forecast period. Services trade will remain in deficit
across the GCC, except in Bahrain, while deficits in the primary
and secondary income accounts will persist, except in Saudi
Arabia (Figure 43).
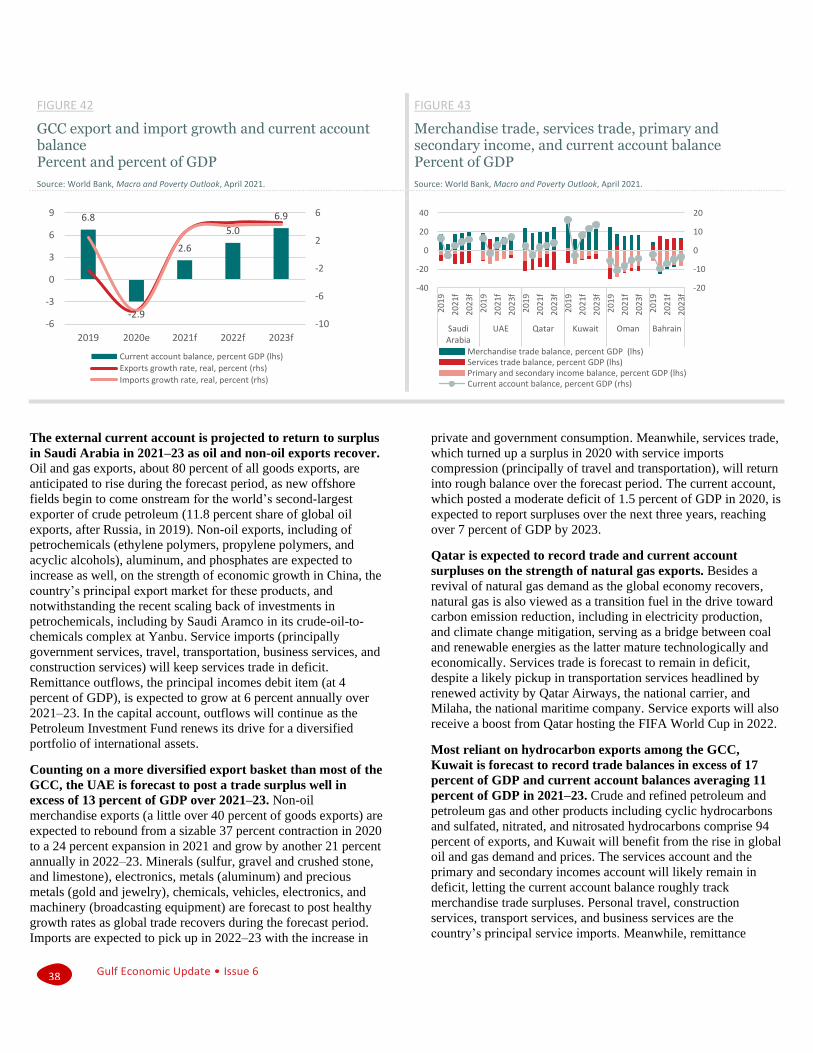
Gulf Economic Update • Issue 6
38
FIGURE 42
GCC export and import growth and current account balance Percent and percent of GDP
Source: World Bank, Macro and Poverty Outlook, April 2021.
FIGURE 43
Merchandise trade, services trade, primary and secondary income, and current account balance Percent of GDP
Source: World Bank, Macro and Poverty Outlook, April 2021.
The external current account is projected to return to surplus
in Saudi Arabia in 2021–23 as oil and non-oil exports recover.
Oil and gas exports, about 80 percent of all goods exports, are
anticipated to rise during the forecast period, as new offshore
fields begin to come onstream for the world’s second-largest
exporter of crude petroleum (11.8 percent share of global oil
exports, after Russia, in 2019). Non-oil exports, including of
petrochemicals (ethylene polymers, propylene polymers, and
acyclic alcohols), aluminum, and phosphates are expected to
increase as well, on the strength of economic growth in China, the
country’s principal export market for these products, and
notwithstanding the recent scaling back of investments in
petrochemicals, including by Saudi Aramco in its crude-oil-to-
chemicals complex at Yanbu. Service imports (principally
government services, travel, transportation, business services, and
construction services) will keep services trade in deficit.
Remittance outflows, the principal incomes debit item (at 4
percent of GDP), is expected to grow at 6 percent annually over
2021–23. In the capital account, outflows will continue as the
Petroleum Investment Fund renews its drive for a diversified
portfolio of international assets.
Counting on a more diversified export basket than most of the
GCC, the UAE is forecast to post a trade surplus well in
excess of 13 percent of GDP over 2021–23. Non-oil
merchandise exports (a little over 40 percent of goods exports) are
expected to rebound from a sizable 37 percent contraction in 2020
to a 24 percent expansion in 2021 and grow by another 21 percent
annually in 2022–23. Minerals (sulfur, gravel and crushed stone,
and limestone), electronics, metals (aluminum) and precious
metals (gold and jewelry), chemicals, vehicles, electronics, and
machinery (broadcasting equipment) are forecast to post healthy
growth rates as global trade recovers during the forecast period.
Imports are expected to pick up in 2022–23 with the increase in
private and government consumption. Meanwhile, services trade,
which turned up a surplus in 2020 with service imports
compression (principally of travel and transportation), will return
into rough balance over the forecast period. The current account,
which posted a moderate deficit of 1.5 percent of GDP in 2020, is
expected to report surpluses over the next three years, reaching
over 7 percent of GDP by 2023.
Qatar is expected to record trade and current account
surpluses on the strength of natural gas exports. Besides a
revival of natural gas demand as the global economy recovers,
natural gas is also viewed as a transition fuel in the drive toward
carbon emission reduction, including in electricity production,
and climate change mitigation, serving as a bridge between coal
and renewable energies as the latter mature technologically and
economically. Services trade is forecast to remain in deficit,
despite a likely pickup in transportation services headlined by
renewed activity by Qatar Airways, the national carrier, and
Milaha, the national maritime company. Service exports will also
receive a boost from Qatar hosting the FIFA World Cup in 2022.
Most reliant on hydrocarbon exports among the GCC,
Kuwait is forecast to record trade balances in excess of 17
percent of GDP and current account balances averaging 11
percent of GDP in 2021–23. Crude and refined petroleum and
petroleum gas and other products including cyclic hydrocarbons
and sulfated, nitrated, and nitrosated hydrocarbons comprise 94
percent of exports, and Kuwait will benefit from the rise in global
oil and gas demand and prices. The services account and the
primary and secondary incomes account will likely remain in
deficit, letting the current account balance roughly track
merchandise trade surpluses. Personal travel, construction
services, transport services, and business services are the
country’s principal service imports. Meanwhile, remittance
6.8
-2.9
2.6
5.0
6.9
-10
-6
-2
2
6
-6
-3
0
3
6
9
2019 2020e 2021f 2022f 2023f
Current account balance, percent GDP (lhs)
Exports growth rate, real, percent (rhs)
Imports growth rate, real, percent (rhs)
-20
-10
0
10
20
-40
-20
0
20
40
20
19
20
21
f
20
23
f
20
19
20
21
f
20
23
f
20
19
20
21
f
20
23
f
20
19
20
21
f
20
23
f
20
19
20
21
f
20
23
f
20
19
20
21
f
20
23
f
SaudiArabia
UAE Qatar Kuwait Oman Bahrain
Merchandise trade balance, percent GDP (lhs)Services trade balance, percent GDP (lhs)Primary and secondary income balance, percent GDP (lhs)Current account balance, percent GDP (rhs)

Gulf Economic Update • Issue 6
39
outflows, the largest item in the primary and secondary incomes
account at 15 percent of GDP in 2019–20, are expected to remain
elevated at an average 12 percent of GDP in 2021–23, reflecting
Kuwait’s heavy dependence on foreign labor—non-nationals
comprise 86 percent of the employed population (non-nationals
comprise 70 percent of the total population). The capital account
is forecast to stay roughly in balance over the period, although
outward foreign direct investment (FDI) will outpace inward FDI
by more than 5 percent of GDP on average.
Oman is projected to incur current account deficits in 2021–
23, as it has since 2015, albeit at a declining rate. Hydrocarbon
exports account for 74 percent of goods exports and, as in
Kuwait, Qatar, and Saudi Arabia, oil and gas will principally
drive the country’s export performance. Expectations of higher oil
and gas production volumes and prices will strengthen Oman’s
trade surplus to an average 14 percent of GDP over the forecast
period. Services trade (transportation, business services, and
personal travel) will likely slip into a moderate deficit, however.
More significantly, primary and secondary income debits,
averaging 20 percent of GDP over the past decade, are expected
to remain as large over the forecast period and drive the current
account balance to deficits. The deficits will, however, taper from
an estimated 10 percent of GDP in 2020 to around 4 percent of
GDP by 2023.
Bahrain is anticipated to maintain trade surpluses but incur
current account deficits over 2021–23. The small economy is
the least dependent among the GCC on hydrocarbon exports—it
exports principally refined petroleum (42 percent of goods
exports) rather than crude petroleum (5 percent of exports), albeit
on small refining capacity of 260,000 barrels per day (the smallest
in the GCC). Bahrain is expected see renewed demand for metals
(raw aluminum and aluminum plating and iron reductions,
structures, and blocks), precious metals (gold and jewelry), and
petrochemicals (nitrogenous fertilizers), its principal non-oil
exports, as the global economy recovers. Imports are forecast to
rise with the rebound in private consumption by 2022 and with
the need for new capital equipment, associated with future
production from the Khaleej al-Bahrain oilfield, beginning in
2023. A gradual easing of curbs on travel should help lift receipts
from travel and tourism, which, together with transportation and
insurance services, should strengthen the surplus on services
trade. Primary and secondary incomes will remain in deficit,
however, at 16–18 percent of GDP, keeping the current account in
deficit at 4–7 percent of GDP. Large financing needs and
substantial external debt will likely continue to exert pressure on
the balance of payments.
Risks to the outlook are balanced on the upside and the downside
Higher-than-forecast oil prices would improve fiscal and
external balances across the GCC in 2021. Crude oil prices
have raced ahead of the baseline forecast of US$56 per barrel for
2021 to average US$63 per barrel in the first half of the year.
After topping US$72 per barrel in June, oil prices are now
anticipated to average US$65 per barrel for the full-year 2021,
barring any unraveling of the current OPEC+ production
agreement under which producers would gradually lift supply
restraints in a bid to support an orderly rise in oil prices. With
fiscal and external outturns in the GCC roughly tracking
international oil price changes, a higher-than-forecast oil price for
2021 would narrow projected deficits or improve projected
surpluses in the fiscal (Figure 44) and current accounts (Figure 45).
FIGURE 44
Forecast fiscal balance, baseline and upside, 2021 Percent of GDP
Source: World Bank staff estimates.
FIGURE 45
Forecast current account balance, baseline and upside, 2021 Percent of GDP
Source: World Bank staff estimates.
-25
-20
-15
-10
-5
0
5
At US$56 per barrel At US$65 per barrel
Saudi Arabia UAE Qatar
Kuwait Oman Bahrain
-10
-5
0
5
10
15
At US$56 per barrel At US$65 per barrel
Saudi Arabia UAE Qatar
Kuwait Oman Bahrain
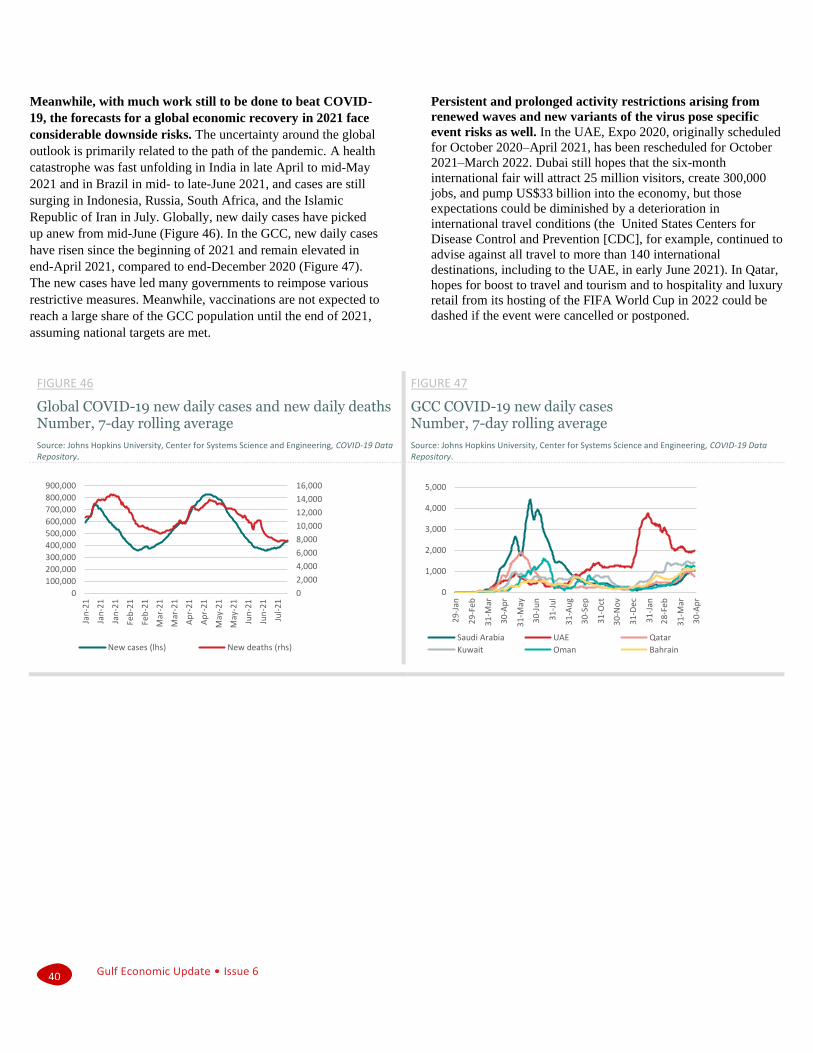
Gulf Economic Update • Issue 6
40
Meanwhile, with much work still to be done to beat COVID-
19, the forecasts for a global economic recovery in 2021 face
considerable downside risks. The uncertainty around the global
outlook is primarily related to the path of the pandemic. A health
catastrophe was fast unfolding in India in late April to mid-May
2021 and in Brazil in mid- to late-June 2021, and cases are still
surging in Indonesia, Russia, South Africa, and the Islamic
Republic of Iran in July. Globally, new daily cases have picked
up anew from mid-June (Figure 46). In the GCC, new daily cases
have risen since the beginning of 2021 and remain elevated in
end-April 2021, compared to end-December 2020 (Figure 47).
The new cases have led many governments to reimpose various
restrictive measures. Meanwhile, vaccinations are not expected to
reach a large share of the GCC population until the end of 2021,
assuming national targets are met.
Persistent and prolonged activity restrictions arising from
renewed waves and new variants of the virus pose specific
event risks as well. In the UAE, Expo 2020, originally scheduled
for October 2020–April 2021, has been rescheduled for October
2021–March 2022. Dubai still hopes that the six-month
international fair will attract 25 million visitors, create 300,000
jobs, and pump US$33 billion into the economy, but those
expectations could be diminished by a deterioration in
international travel conditions (the United States Centers for
Disease Control and Prevention [CDC], for example, continued to
advise against all travel to more than 140 international
destinations, including to the UAE, in early June 2021). In Qatar,
hopes for boost to travel and tourism and to hospitality and luxury
retail from its hosting of the FIFA World Cup in 2022 could be
dashed if the event were cancelled or postponed.
FIGURE 46
Global COVID-19 new daily cases and new daily deaths Number, 7-day rolling average
Source: Johns Hopkins University, Center for Systems Science and Engineering, COVID-19 Data Repository.
FIGURE 47
GCC COVID-19 new daily cases Number, 7-day rolling average
Source: Johns Hopkins University, Center for Systems Science and Engineering, COVID-19 Data Repository.
0
2,000
4,000
6,000
8,000
10,000
12,000
14,000
16,000
0
100,000
200,000
300,000
400,000
500,000
600,000
700,000
800,000
900,000
Jan
-21
Jan
-21
Jan
-21
Feb
-21
Feb
-21
Mar
-21
Mar
-21
Ap
r-21
Ap
r-21
May
-21
May
-21
Jun
-21
Jun
-21
Jul-
21
New cases (lhs) New deaths (rhs)
0
1,000
2,000
3,000
4,000
5,000
29-
Jan
29-
Feb
31-
Mar
30-
Ap
r
31-
May
30-
Jun
31-
Jul
31-
Au
g
30-
Sep
31-
Oct
30-
No
v
31-
Dec
31-
Jan
28-
Feb
31-
Mar
30-
Ap
r
Saudi Arabia UAE Qatar
Kuwait Oman Bahrain

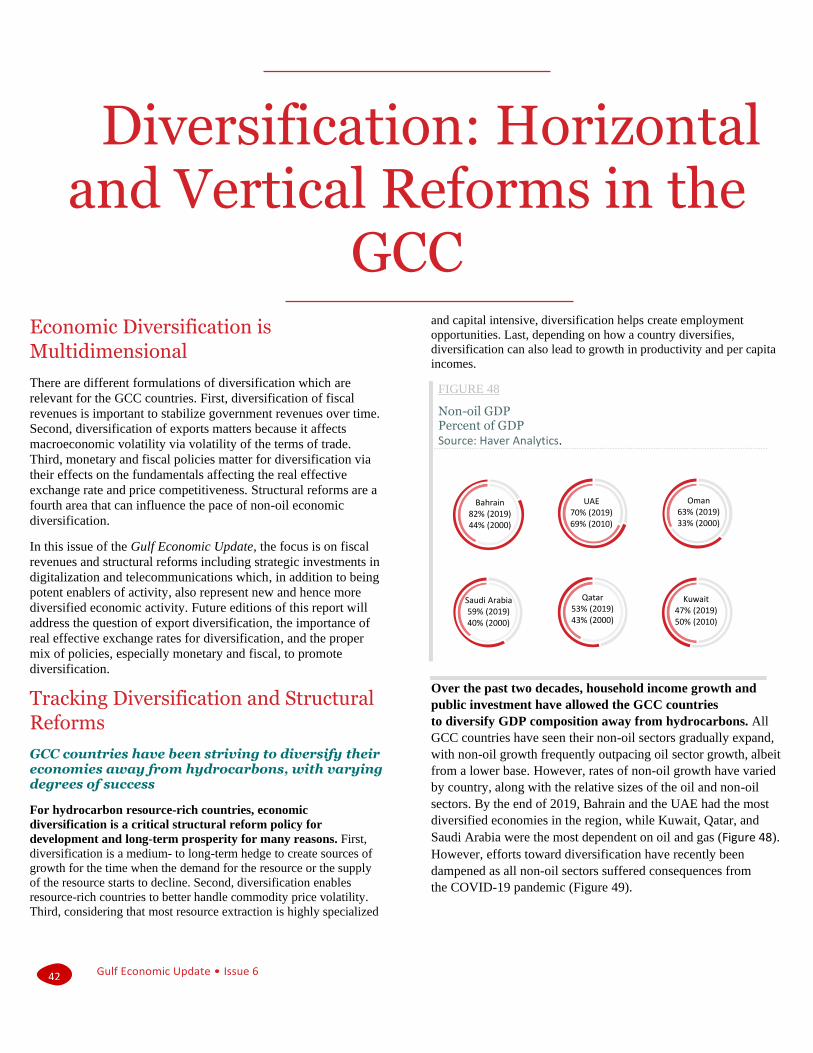
Gulf Economic Update • Issue 6
42
Diversification: Horizontal and Vertical Reforms in the
GCC
Economic Diversification is
Multidimensional
There are different formulations of diversification which are
relevant for the GCC countries. First, diversification of fiscal
revenues is important to stabilize government revenues over time.
Second, diversification of exports matters because it affects
macroeconomic volatility via volatility of the terms of trade.
Third, monetary and fiscal policies matter for diversification via
their effects on the fundamentals affecting the real effective
exchange rate and price competitiveness. Structural reforms are a
fourth area that can influence the pace of non-oil economic
diversification.
In this issue of the Gulf Economic Update, the focus is on fiscal
revenues and structural reforms including strategic investments in
digitalization and telecommunications which, in addition to being
potent enablers of activity, also represent new and hence more
diversified economic activity. Future editions of this report will
address the question of export diversification, the importance of
real effective exchange rates for diversification, and the proper
mix of policies, especially monetary and fiscal, to promote
diversification.
Tracking Diversification and Structural
Reforms
GCC countries have been striving to diversify their economies away from hydrocarbons, with varying degrees of success
For hydrocarbon resource-rich countries, economic
diversification is a critical structural reform policy for
development and long-term prosperity for many reasons. First,
diversification is a medium- to long-term hedge to create sources of
growth for the time when the demand for the resource or the supply
of the resource starts to decline. Second, diversification enables
resource-rich countries to better handle commodity price volatility.
Third, considering that most resource extraction is highly specialized
and capital intensive, diversification helps create employment
opportunities. Last, depending on how a country diversifies,
diversification can also lead to growth in productivity and per capita
incomes.
FIGURE 48
Non-oil GDP Percent of GDP Source: Haver Analytics.
Over the past two decades, household income growth and
public investment have allowed the GCC countries
to diversify GDP composition away from hydrocarbons. All
GCC countries have seen their non-oil sectors gradually expand,
with non-oil growth frequently outpacing oil sector growth, albeit
from a lower base. However, rates of non-oil growth have varied
by country, along with the relative sizes of the oil and non-oil
sectors. By the end of 2019, Bahrain and the UAE had the most
diversified economies in the region, while Kuwait, Qatar, and
Saudi Arabia were the most dependent on oil and gas (Figure 48).
However, efforts toward diversification have recently been
dampened as all non-oil sectors suffered consequences from
the COVID-19 pandemic (Figure 49).
Bahrain82% (2019)44% (2000)
UAE70% (2019)69% (2010)
Oman63% (2019)33% (2000)
Saudi Arabia59% (2019)40% (2000)
Qatar53% (2019)43% (2000)
Kuwait47% (2019)50% (2010)
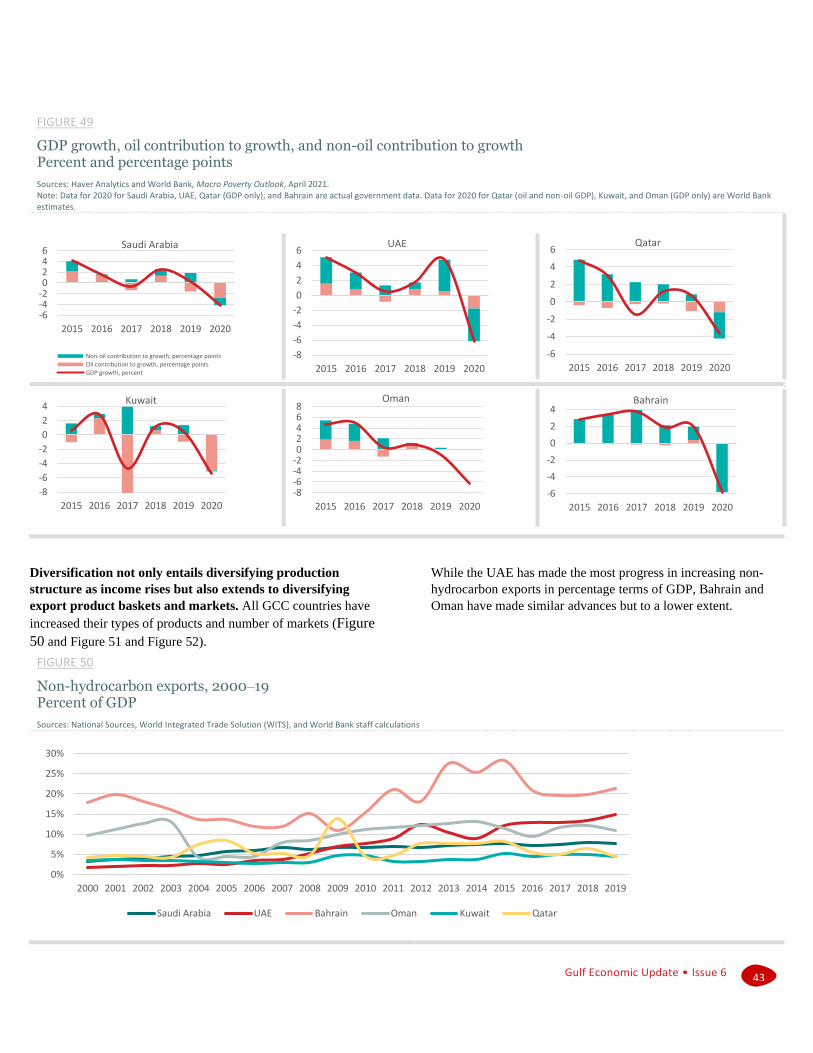
Gulf Economic Update • Issue 6
43
FIGURE 49
GDP growth, oil contribution to growth, and non-oil contribution to growth Percent and percentage points
Sources: Haver Analytics and World Bank, Macro Poverty Outlook, April 2021. Note: Data for 2020 for Saudi Arabia, UAE, Qatar (GDP only), and Bahrain are actual government data. Data for 2020 for Qatar (oil and non-oil GDP), Kuwait, and Oman (GDP only) are World Bank estimates.
Diversification not only entails diversifying production
structure as income rises but also extends to diversifying
export product baskets and markets. All GCC countries have
increased their types of products and number of markets (Figure
50 and Figure 51 and Figure 52).
While the UAE has made the most progress in increasing non-
hydrocarbon exports in percentage terms of GDP, Bahrain and
Oman have made similar advances but to a lower extent.
FIGURE 50
Non-hydrocarbon exports, 2000–19 Percent of GDP
Sources: National Sources, World Integrated Trade Solution (WITS), and World Bank staff calculations
-6-4-20246
2015 2016 2017 2018 2019 2020
Saudi Arabia
Non-oil contribution to growth, percentage pointsOil contribution to growth, percentage pointsGDP growth, percent
-8
-6
-4
-2
0
2
4
6
2015 2016 2017 2018 2019 2020
UAE
-6
-4
-2
0
2
4
6
2015 2016 2017 2018 2019 2020
Qatar
-8
-6
-4
-2
0
2
4
2015 2016 2017 2018 2019 2020
Kuwait
-8-6-4-202468
2015 2016 2017 2018 2019 2020
Oman
-6
-4
-2
0
2
4
2015 2016 2017 2018 2019 2020
Bahrain
0%
5%
10%
15%
20%
25%
30%
2000 2001 2002 2003 2004 2005 2006 2007 2008 2009 2010 2011 2012 2013 2014 2015 2016 2017 2018 2019
Saudi Arabia UAE Bahrain Oman Kuwait Qatar

Gulf Economic Update • Issue 6
44
FIGURE 51
Diversification of exports Number of products
Sources: World Bank and United Nations Conference on Trade and Development (UNCTAD), WITS.
FIGURE 52
Diversification of exports Number of markets
Sources: World Bank and UNCTAD, WITS.
Hit by the twin shocks of coronavirus and
weakening global oil demand in 2020, the GCC
economies went into deep contraction,
necessitating general support to the private sector
and challenging the services-based successful
diversification model
The pandemic accelerated the urgency of reducing oil
dependency and enhancing private sector competitiveness and
reemphasizing their adverse impacts if kept unattended or
reforms delayed. But it also rechanneled policy focus to the
short-term COVID-19 relief with health and economic measures
taking priority. All GCC countries have introduced sizable
stimulus packages in support of their ailing economies and
adopted different measures to support their private sector and
SMEs. These measures can be generally classified in the
following groups: enhancing the business climate, reducing
business costs, enhancing debt financing instruments, providing
employment support, and finally, providing measures that came in
the form of tax payment deferrals. The following lists the key
private sector and SME-supporting measures adopted by GCC
countries to dampen the adverse impacts of the pandemic.
Saudi Arabia provided support to the private sector,
including postponement of taxes and Zakat payments,
estimated at SAR 120 billion (US$32 billion). The government
also pledged to help businesses struggling with wage payments to
Saudi Arabian employees, with the government compensating 60
percent of the employee’s salary. The Saudi Human Resources
Development Fund announced the allocation of SAR 2 billion
(US$0.5 billion) to support 100,000 job seekers in the private
sector in addition to offering and activating remote work tools as
available and alternative options for regular work. As for debt
financing, SAMA launched an SAR 50 billion (US$13.3 billion)
package to help SMEs cope with the economic impacts of the
coronavirus outbreak. The measures are aimed at granting SMEs
six-month deferrals on bank payments, concessional financing,
and exemptions from the costs of a loan guarantee program. Other
business-related initiatives were also launched, targeting reducing
businesses costs, adhering to compliance requirements, improving
business climate, and strengthening business advice and
operations.
The UAE announced an AED 100 billion (US$27.2 billion)
stimulus to facilitate temporary relief on private sector loans
and promote SME lending. The Central Bank of the UAE also
requested banks to implement measures to counteract the effects
of COVID-19 including rescheduling loans, offering temporary
deferrals on monthly loan payments and reducing fees and
commissions. Further support was delivered to businesses
affected by COVID-19 in the form of tax concessions, reduction
in utilities bills, and rebates on rental values, especially, for
hospitality and entertainment sectors.
The Qatar Central Bank encouraged banks to postpone loan
installments and obligations of the private sector with a grace
period of six months. Meanwhile, the Qatar Development Bank
postponed installments of all borrowers for six months. Moreover,
and in an effort to support equity and capital markets, government
funds have been directed to increase investments in the stock
market by QAR 10 billion (US$2.8 billion). Authorities exempted
businesses from rent for government-owned properties.
Kuwait provided exemptions to the affected economic and
productive sectors, including the cooperative societies, from
accrued fees and dues. The authorities also directed the
postponement of monthly social security contributions for a
period of six months to reduce liquidity pressures on business
0
500
1000
1500
2000
2500
3000
3500
UnitedArab
Emirates
SaudiArabia
Oman Kuwait Bahrain Qatar
1996 2017
Nu
mb
ero
f P
rod
uct
s
0
20
40
60
80
100
120
UnitedArab
Emirates
SaudiArabia
Oman Kuwait Bahrain Qatar
1996 2017
Nu
mb
er o
f M
arke
ts
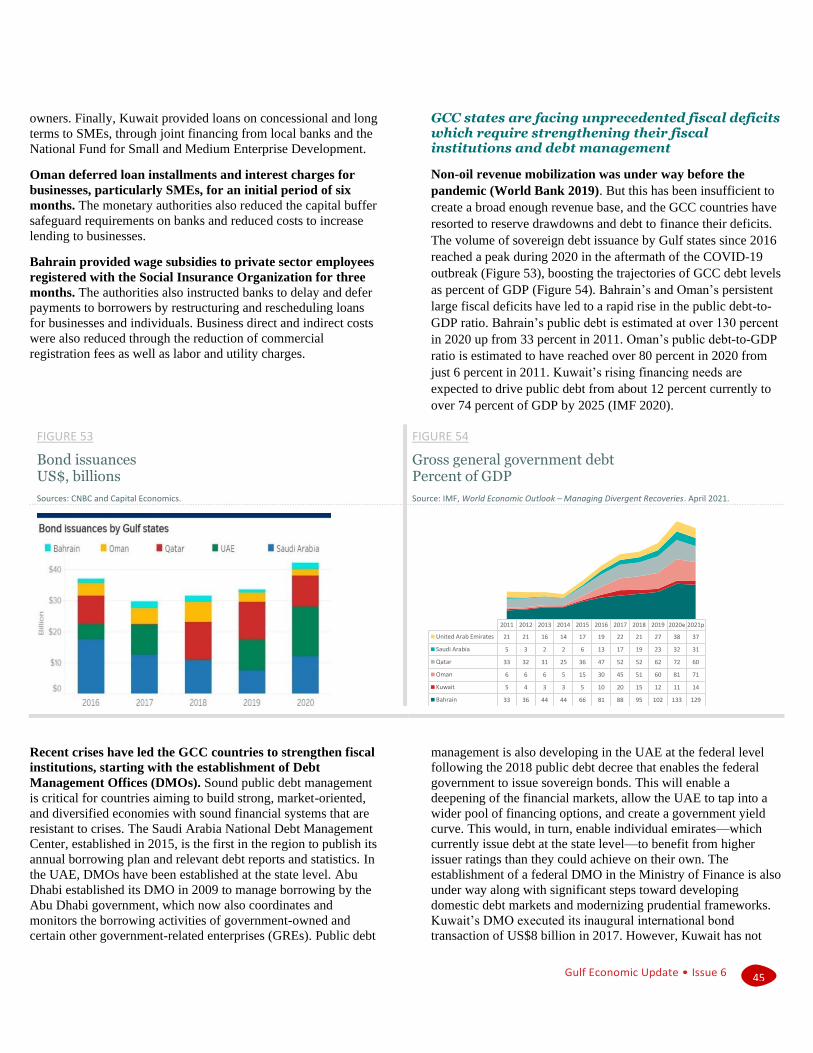
Gulf Economic Update • Issue 6
45
owners. Finally, Kuwait provided loans on concessional and long
terms to SMEs, through joint financing from local banks and the
National Fund for Small and Medium Enterprise Development.
Oman deferred loan installments and interest charges for
businesses, particularly SMEs, for an initial period of six
months. The monetary authorities also reduced the capital buffer
safeguard requirements on banks and reduced costs to increase
lending to businesses.
Bahrain provided wage subsidies to private sector employees
registered with the Social Insurance Organization for three
months. The authorities also instructed banks to delay and defer
payments to borrowers by restructuring and rescheduling loans
for businesses and individuals. Business direct and indirect costs
were also reduced through the reduction of commercial
registration fees as well as labor and utility charges.
GCC states are facing unprecedented fiscal deficits which require strengthening their fiscal institutions and debt management
Non-oil revenue mobilization was under way before the
pandemic (World Bank 2019). But this has been insufficient to
create a broad enough revenue base, and the GCC countries have
resorted to reserve drawdowns and debt to finance their deficits.
The volume of sovereign debt issuance by Gulf states since 2016
reached a peak during 2020 in the aftermath of the COVID-19
outbreak (Figure 53), boosting the trajectories of GCC debt levels
as percent of GDP (Figure 54). Bahrain’s and Oman’s persistent
large fiscal deficits have led to a rapid rise in the public debt-to-
GDP ratio. Bahrain’s public debt is estimated at over 130 percent
in 2020 up from 33 percent in 2011. Oman’s public debt-to-GDP
ratio is estimated to have reached over 80 percent in 2020 from
just 6 percent in 2011. Kuwait’s rising financing needs are
expected to drive public debt from about 12 percent currently to
over 74 percent of GDP by 2025 (IMF 2020).
FIGURE 53
Bond issuances US$, billions
Sources: CNBC and Capital Economics.
FIGURE 54
Gross general government debt Percent of GDP
Source: IMF, World Economic Outlook – Managing Divergent Recoveries. April 2021.
Recent crises have led the GCC countries to strengthen fiscal
institutions, starting with the establishment of Debt
Management Offices (DMOs). Sound public debt management
is critical for countries aiming to build strong, market-oriented,
and diversified economies with sound financial systems that are
resistant to crises. The Saudi Arabia National Debt Management
Center, established in 2015, is the first in the region to publish its
annual borrowing plan and relevant debt reports and statistics. In
the UAE, DMOs have been established at the state level. Abu
Dhabi established its DMO in 2009 to manage borrowing by the
Abu Dhabi government, which now also coordinates and
monitors the borrowing activities of government-owned and
certain other government-related enterprises (GREs). Public debt
management is also developing in the UAE at the federal level
following the 2018 public debt decree that enables the federal
government to issue sovereign bonds. This will enable a
deepening of the financial markets, allow the UAE to tap into a
wider pool of financing options, and create a government yield
curve. This would, in turn, enable individual emirates—which
currently issue debt at the state level—to benefit from higher
issuer ratings than they could achieve on their own. The
establishment of a federal DMO in the Ministry of Finance is also
under way along with significant steps toward developing
domestic debt markets and modernizing prudential frameworks.
Kuwait’s DMO executed its inaugural international bond
transaction of US$8 billion in 2017. However, Kuwait has not
2011 2012 2013 2014 2015 2016 2017 2018 2019 2020e 2021p
United Arab Emirates 21 21 16 14 17 19 22 21 27 38 37
Saudi Arabia 5 3 2 2 6 13 17 19 23 32 31
Qatar 33 32 31 25 36 47 52 52 62 72 60
Oman 6 6 6 5 15 30 45 51 60 81 71
Kuwait 5 4 3 3 5 10 20 15 12 11 14
Bahrain 33 36 44 44 66 81 88 95 102 133 129

Gulf Economic Update • Issue 6
46
issued debt since 2017 as the Parliament has not yet approved the
new Public Borrowing Law that would raise the debt ceiling and
allow longer maturities. Oman’s Tanfeedh initiative established
the DMO in 2017 which closely monitors borrowing by GREs.
The GCC governments have taken some steps toward fiscal
sustainability and transparency. This is particularly important
for countries facing fiscal vulnerabilities from contingent
liabilities, which will be exacerbated by higher debt servicing in
the future. Saudi Arabia’s efforts toward transparency began in
2017 with its publication of more comprehensive budget
statements and audited financial statements. The UAE has made
notable progress in strengthening the fiscal framework over the
past several years, including transitioning to Government
Financial Statistics Manual (GFSM) reporting and medium-term
budgeting by the federal government and some emirates. In Abu
Dhabi, fiscal sustainability is anchored by a medium-term
balanced budget rule, whereas Dubai restricts the growth of
government debt through a range of key performance indicators,
such as a ceiling on the debt stock, amortization in a single year,
average maturity, and average interest rates. Measures to increase
financial discipline of GREs and to monitor and manage fiscal
risks from them have also been introduced in Abu Dhabi and
Dubai. However, consolidated fiscal management at the UAE
level is still lacking. Saudi Arabia and Bahrain both committed to
FBPs, but these are now likely to go off track as financing needs
increase due to the coronavirus pandemic.
Going forward, the GCC would benefit from enhancing
transparency and accountability of fiscal institutions to
reduce fiscal vulnerabilities. This involves enhancing
mechanisms to improve control over contingent liabilities,
institutionalizing formal reporting requirements for GREs,
collecting relevant data for fiscal risk analysis, establishing clear
criteria (based on credit risk assessments) for the issuance of
guarantees, and setting up a framework with guidelines for PPPs.
In addition, continuing to commit to the diversification agenda is
key as heavy borrowing now without growing the capacity to
generate non-oil (and non-state) income in the future will put the
economies at risk—as fiscal space gets captured by high debt
servicing costs.
Despite the pandemic focus and attention, the GCC
states managed to implement several structural
reforms over the past year advancing private
sector development …
Throughout 2020 and early 2021, the GCC governments
continued with reforms to diversify their economies and
promote private sector activity. The structural reforms, ranging
from new laws fostering greater private sector participation in the
economy to new measures introducing greater flexibility in labor
markets, will support the private enterprise development
momentum going forward and provide optimism for a more
robust post-COVID economic recovery.
As part of its new labor strategy, Saudi Arabia amended its
Kafala system to give expatriate workers greater job mobility.
The revised Kafala system—the system of fixed-term sponsorship
of migrant workers—now allows migrant workers to transfer to
other jobs upon the expiry of their work contract without the
need for their former employer’s approval. The government
also raised the monthly minimum wage for full-time Saudi
Arabian workers in the private sector to encourage more Saudi
Arabian nationals to seek employment in private enterprise.
Saudi Arabia approved a new mining law that aims to
accelerate investment in the sector in line with diversification
objectives—the new investment law supports exploration and
geological surveys (untapped mineral resources are reportedly
valued at US$1.3 trillion) and facilitates investor access to capital
for mining and quarrying. Saudi Arabia modernized its legal
framework for privatizations and PPPs, approving a new Private
Sector Participation Law that will govern the relationship between
the public and private sectors in new contracts for infrastructure
and public services, including the resort to performance-based
returns. The government organized a new state-owned Water
Transmission and Technologies Company that will manage the
transmission, distribution, and storage of desalinated water across
the country. On social assistance, the government issued new
regulations to enhance social spending efficiency including with
the use of minimum transfer payments for eligible households.
Also on women’s empowerment, the government followed up on
earlier high-profile reforms enabling women to drive with new
laws allowing women to get their own passports and change their
names without a guardian’s consent.
The UAE introduced reforms allowing the full foreign
ownership of onshore companies and annulling the
requirement that commercial enterprises have a major
Emirati shareholder. The amended Commercial Companies
Law, allowing foreign investors and entrepreneurs to establish
and fully own onshore companies, will come into effect in June
2021. The government also issued a new Consumer Protection
Law to safeguard consumer rights in the federation, including in
transactions occurring in free zones as well as those conducted
using e-commerce channels registered in the country. The
government also enacted legal reforms easing laws against
cohabitation, which had constrained long-term expatriate
residency, and strengthened the status of women in relation to the
settlement of intra-family disputes.
Similar to Saudi Arabia, Qatar made significant reforms to its
Kafala system by allowing migrant workers to change jobs
without their employers’ permission. The authorities also set a
higher minimum wage for all workers regardless of their
nationality. Furthermore, and in an effort to boost
competitiveness, Qatar enacted a new Public-Private Partnership
Law to support Vision 2030 infrastructure projects and eased the
rules on foreign ownership of property.
Kuwait improved its business environment by approving a
new competition law and a new bankruptcy law. The

Gulf Economic Update • Issue 6
47
competition law secures the independence to the Kuwait
Competition Agency, converting the agency into a technical and
professional body, thereby reducing political pressures
threatening the performance of its mission. Meanwhile, the
bankruptcy law offers greater flexibility in structuring bankruptcy
solutions for financially distressed companies.
Oman’s economy is still highly undiversified and heavily
susceptible to oil price fluctuations. Structural reforms are key
to enhance the business climate, improve the functioning of the
labor market, and foster economic diversification. Economic
diversification is vital to promote fiscal stability, reduce
procyclicality, and mitigate expenditure volatility. Meanwhile, in
an effort to reduce the budget deficit and enforce fiscal discipline,
Oman made a number of reforms aimed at regaining fiscal
stability and sustainability. Key fiscal reforms implemented
during this period are enhancing revenue mobilization by
implementing VAT at 5 percent rate starting in April 2021,
improving subsidy targeting to vulnerable groups in society by
rationalizing utilities subsidies, and controlling the public wage
bill and reducing public employment.
Structural reforms in Bahrain remain key to supporting
diversification and inclusive private sector-led growth. The
reform agenda focuses on enhancing the business environment,
attracting foreign investment, and increasing employment
opportunities. In January 2021, Bahrain launched the second
edition of its National Employment Program, which aims to
create 25,000 new private sector jobs in 2021, provide 10,000
training opportunities annually, and upskill the labor force.
Moreover, a more active privatization plan and a PPP law could
encourage additional private investment. Targeted education and
labor market reforms would help promote opportunities and
improve productivity. As part of its private sector development
initiative, Bahrain established an Al-Amal (Hope) Fund to
support young entrepreneurs and businesses. The fund aims to
provide start-up investment for young Bahrainis’ business ideas.
The country also made progress with its women empowerment
agenda by supporting women’s entrepreneurship as well as
enhancing their physical and psychological well-being through
stricter protection from domestic violence.
… including through privatization of some SOEs
Some GCC states have made more progress toward
privatization and PPPs. For Saudi Arabia, its most high-profile
transaction was the Saudi Aramco 5 percent initial public offering
(IPO) in December 2019. In February 2020, Saudi Arabia
completed the first privatization of a state-owned health care
entity with the acquisition by the Dr. Soliman Abdel Kader
Fakeeh Hospital Company of a majority stake in Saudia Medical
Services Company. Other SOEs planned for corporatization (the
restructuring or transformation of a state-owned asset or
organization into a corporation) and partial privatization include
the Ras al-Khair desalination and power plant, the production
sector at the Saudi Saline Water Conversion Corporation, several
flour mills, some ports, and the Saudi Professional Football
League (Atlantic Council 2020).
In the UAE, the Abu Dhabi National Oil Company completed
the placement to institutional investors of 10 percent of its
distribution business in September 2020. Earlier, the company
sold a 49 percent stake in its national gas pipelines for US$10.1
billion in February 2020. The buyer was a consortium led by
Global Infrastructure Partners. Before these transactions, the last
privatization in the UAE was the merger and acquisition in May
2019 of the Abu Dhabi Commercial Bank, Union National Bank,
and Al Hilal Bank creating the third-largest financial institution in
the country, the ADCB Group with US$115 billion in assets.
Under Oman’s Tanfeedh program, several government-
related entities were planned to be restructured under holding
companies in the logistics, aviation, mining, tourism,
electricity, and food sectors. In December 2019, Oman
Electricity Holding Company sold a 49 percent stake in its
electricity transmission company to the Chinese State Grid
Corporation. In 2018, Qatar held an IPO for a minority share of
Qatar Aluminum Manufacturing Company. Some countries are
pushing forward with more PPPs, but the associated fiscal risks
related to PPP transactions may not be well monitored.
Gulf Economic Update • Issue 6
48
Strategic Investment
Advancing the telecommunications frontier as a
strategic investment sector for diversification and post-
COVID-19 recovery
In addition to structural reforms which enhance the business
environment, the GCC authorities have directed investment
in sectors critical for the economic diversification agenda. The
telecommunications sector played a significant role in
overcoming many of the challenges that were imposed by the
COVID-19 pandemic—containment measures, social distancing,
home-based work, and online schooling—and should play an
even more vital role in a post-COVID-19 economy. This section
traces recent developments in the telecommunications sector in
the GCC and discusses areas for further improvement.
The COVID-19 pandemic has highlighted the fundamental
value of the telecommunications industry2 to states,
economies, and societies globally. Telecommunications
companies have reported massive increases in voice calls and
network usage worldwide since the outbreak of COVID-19. As
the health crisis has escalated and nations have mandated travel
restrictions, work stoppages, school closures, community
quarantines, and social distancing, communications service
providers have responded to maintain connectivity among states,
institutions, and individuals. The industry is supporting
governments with data on population movements, hospitals with
the connectivity of equipment and devices, businesses with
technologies for remote working and online commerce, schools
with arrangements for virtual learning, homes with connectivity
2 Telecommunications in this section refers to telecommunications services only,
part of the larger information and communications technology (ICT) sector, which is typically defined as consisting of three broad industry groups: ICT
manufacturing (manufacture of electronic components and boards, manufacture of
computers and peripheral equipment, manufacture of communications equipment, manufacture of consumer electronics, and manufacture of magnetic and optical
to media stations, and citizens with access to health and other
vital information.
The telecommunications sector will become even more vital to
a digital economy in a post-pandemic world. The migration to
digital technologies that had been driven by the COVID-19
pandemic will likely continue into the recovery, with retailers
shifting to online ordering, schools pivoting to virtual classrooms,
doctors delivering telemedicine, banks transitioning to remote
credit servicing, manufacturers developing lights-out supply
chains, and offices deploying more remote work (McKinsey and
Company 2020). To service an expanding digital universe,
telecommunications companies will likely have to reinvent
themselves as platform businesses, enabling rather than simply
providing digital services; accelerate the deployment of fifth-
generation (5G) mobile technology; shift to hybrid cloud
information technology and network architectures; accelerate
their own digital transformation, including by using artificial
intelligence (AI) to provide customers with real-time decisions;
and focus on cybersecurity (IBM 2020).
Telecommunications markets in the GCC have evolved
rapidly in the past two decades, tracking developments in the
global telecommunications industry. Globally, fixed-line
telephone subscriptions have been on a downtrend, falling from a
low at under 20 per 100 people in 2001 to even lower, to roughly
12 per 100 people in 2019. In sharp contrast, mobile cellular
telephone subscriptions have risen rapidly (Figure 55) to
penetration rates greater than 100 (more than one subscription per
media); ICT trade (wholesale of computers, computer peripheral equipment, and
software and wholesale of electronic and telecommunication equipment and parts); and ICT services (software publishing, telecommunications services,
computer programming, data processing and hosting and related services, web portals, and repair of computers and communications equipment). OECD 2010; European Commission 2012; and ITU 2018a, 2018b.
BOX 1 Strategic investments in sectors other than oil and gas enable the GCC states
to diversify their economies consistent with their Vision objectives
Past issues of the Gulf Economic Update have described and analyzed strategic investments in selected sectors: (a) renewable energy -
rising domestic electricity consumption, the high opportunity cost of using oil and gas for power generation, and declining prices for solar
panels and wind turbines are driving the hydrocarbon-rich GCC countries to accelerate the development of their renewable energy
industries and (b) fintech - the innovative technologies and platforms that either compete with or augment traditional financial services
offer a wide range of possibilities for deepening and enhancing the efficiency of the GCC financial sectors which contribute 5–16 percent
to national GDP.
In this issue, we continue with the analytic series and highlight private and public investments in the telecommunications sector which
has provided the underlying infrastructure for digital services that proved their economic utility during the COVID-19 pandemic,
including public health surveillance, online commerce, virtual education, remote working, and personal telemedicine.
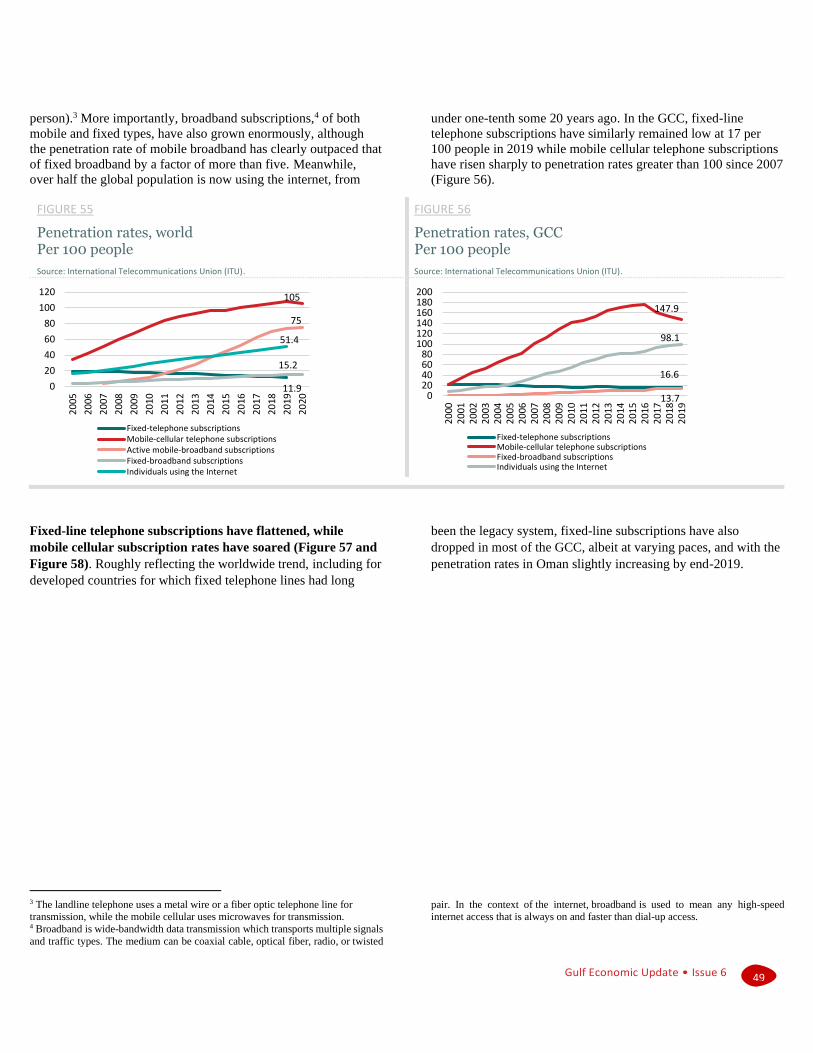
Gulf Economic Update • Issue 6
49
person).3 More importantly, broadband subscriptions,4 of both
mobile and fixed types, have also grown enormously, although
the penetration rate of mobile broadband has clearly outpaced that
of fixed broadband by a factor of more than five. Meanwhile,
over half the global population is now using the internet, from
under one-tenth some 20 years ago. In the GCC, fixed-line
telephone subscriptions have similarly remained low at 17 per
100 people in 2019 while mobile cellular telephone subscriptions
have risen sharply to penetration rates greater than 100 since 2007
(Figure 56).
FIGURE 55
Penetration rates, world Per 100 people
Source: International Telecommunications Union (ITU).
FIGURE 56
Penetration rates, GCC Per 100 people
Source: International Telecommunications Union (ITU).
Fixed-line telephone subscriptions have flattened, while
mobile cellular subscription rates have soared (Figure 57 and
Figure 58). Roughly reflecting the worldwide trend, including for
developed countries for which fixed telephone lines had long
3 The landline telephone uses a metal wire or a fiber optic telephone line for transmission, while the mobile cellular uses microwaves for transmission. 4 Broadband is wide-bandwidth data transmission which transports multiple signals
and traffic types. The medium can be coaxial cable, optical fiber, radio, or twisted
been the legacy system, fixed-line subscriptions have also
dropped in most of the GCC, albeit at varying paces, and with the
penetration rates in Oman slightly increasing by end-2019.
pair. In the context of the internet, broadband is used to mean any high-speed internet access that is always on and faster than dial-up access.
0
20
40
60
80
100
120
20
05
20
06
20
07
20
08
20
09
20
10
20
11
20
12
20
13
20
14
20
15
20
16
20
17
20
18
20
19
20
20
Fixed-telephone subscriptionsMobile-cellular telephone subscriptionsActive mobile-broadband subscriptionsFixed-broadband subscriptionsIndividuals using the Internet
105
75
51.4
15.2
11.90
20406080
100120140160180200
20
002
001
20
022
003
20
042
005
20
062
007
20
082
009
20
102
011
20
122
013
20
142
015
20
162
017
20
182
019
Fixed-telephone subscriptionsMobile-cellular telephone subscriptionsFixed-broadband subscriptionsIndividuals using the Internet
147.9
98.1
16.6
13.7
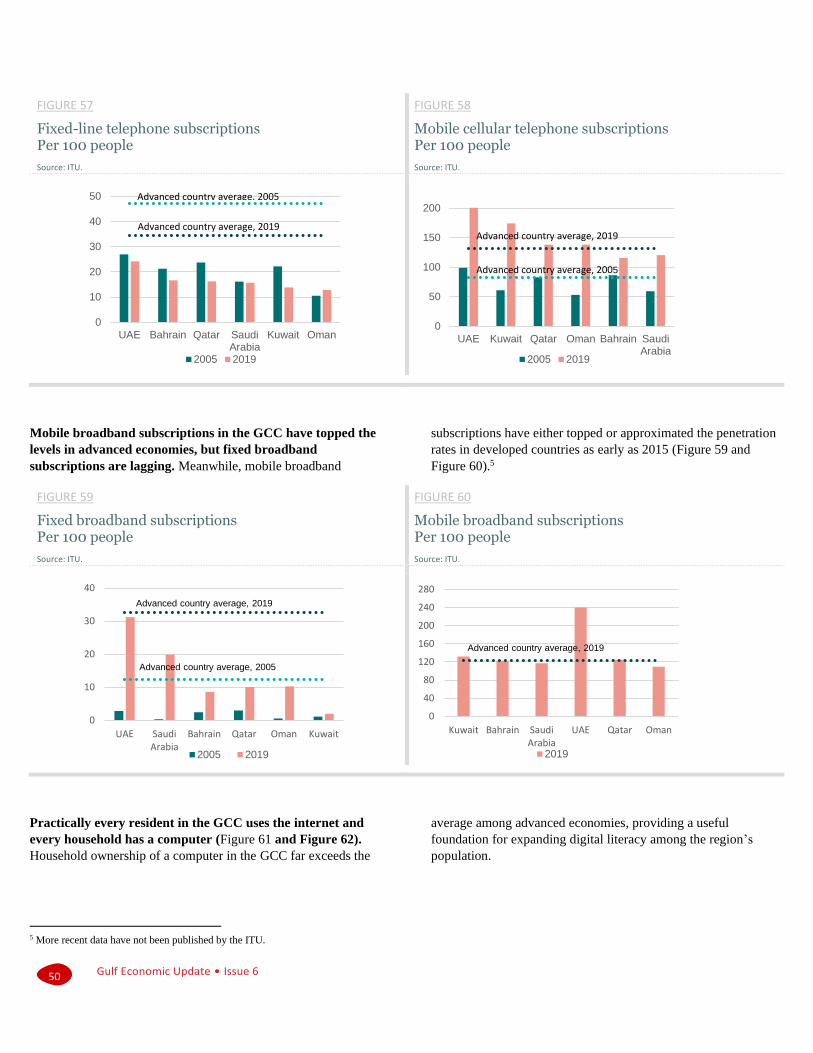
Gulf Economic Update • Issue 6
50
FIGURE 57
Fixed-line telephone subscriptions Per 100 people
Source: ITU.
FIGURE 58
Mobile cellular telephone subscriptions Per 100 people
Source: ITU.
Mobile broadband subscriptions in the GCC have topped the
levels in advanced economies, but fixed broadband
subscriptions are lagging. Meanwhile, mobile broadband
subscriptions have either topped or approximated the penetration
rates in developed countries as early as 2015 (Figure 59 and
Figure 60).5
FIGURE 59
Fixed broadband subscriptions Per 100 people
Source: ITU.
FIGURE 60
Mobile broadband subscriptions Per 100 people
Source: ITU.
Practically every resident in the GCC uses the internet and
every household has a computer (Figure 61 and Figure 62).
Household ownership of a computer in the GCC far exceeds the
5 More recent data have not been published by the ITU.
average among advanced economies, providing a useful
foundation for expanding digital literacy among the region’s
population.
0
10
20
30
40
50
UAE Bahrain Qatar SaudiArabia
Kuwait Oman
2005 2019
Advanced country average, 2005
Advanced country average, 2019
0
50
100
150
200
UAE Kuwait Qatar Oman Bahrain SaudiArabia
2005 2019
Advanced country average, 2019
Advanced country average, 2005
0
10
20
30
40
UAE SaudiArabia
Bahrain Qatar Oman Kuwait
2005 2019
Advanced country average, 2005
Advanced country average, 2019
0
40
80
120
160
200
240
280
Kuwait Bahrain SaudiArabia
UAE Qatar Oman
2019
Advanced country average, 2019

Gulf Economic Update • Issue 6
51
FIGURE 61
Internet users, Per 100 people
Source: ITU.
FIGURE 62
Households with a computer Percent
Source: ITU.
Plans to grow the telecommunications sector in the medium to
long term are inspired by ambitious visions of a dynamic
digital economy. In the UAE, which so far leads the GCC in the
adoption of ICT, Abu Dhabi’s Vision 2030 aims for a ‘world-
class telecommunications infrastructure’ and a ‘population skilled
in ICT techniques’ in which the emirate ‘acts as a
telecommunications service center for the Middle East’. Saudi
Arabia’s own Vision 2030 emphasizes a ‘sophisticated digital
infrastructure’ and commits the state to partner with the private
sector to develop the country’s ICT infrastructure. Kuwait’s New
Kuwait Vision 2035 cites four projects, headlined by a fiber optic
network, that will ‘modernize and develop its ICT infrastructure’,
‘provide an advanced technological environment capable of
leading the transition to the knowledge economy’, and ‘develop
human resources and accelerate the pace of access to new
technologies’. Bahrain’s Vision 2030 sees the country ‘fully
linked to the global trade and information highways by 2030’,
with telecommunications services being readily accessible, being
competitively priced, and providing a stable base for businesses.
ICT and broadband strategy documents offer more concrete
plans and targets. The UAE’s Fourth Industrial Revolution
Strategy, launched in 2017, lists eight strategic areas for a digital
economy of the future: augmented learning, personalized
medicine, RoboCare, connected care, bioengineering for food and
water security, blockchain for the financial system, space data,
and advanced defense manufacturing. Saudi Arabia’s Vision 2030
cites the specific goal to cover over 90 percent of housing in
densely populated cities and 66 percent in other urban areas with
high-speed broadband by 2030. The National Transformation
Program targets a digital economy of 3 percent of GDP by 2020.
The ICT Sector Strategy 2023 lists 24 strategic initiatives
headlined by the goal to raise the sector’s contribution to GDP by
US$50 billion by 2023, including by enabling the adoption of 5G.
To achieve the national objective of providing all residents and
enterprises with access to high-speed broadband services at
affordable prices, Oman’s National Broadband Strategy,
approved in 2013, plans to strengthen the regulatory framework
for telecommunications, stimulate the demand for broadband
through the Oman Digital Society and e-Government initiatives,
and upgrade and expand the country’s broadband infrastructure.
Bahrain’s Fourth National Telecommunications Plan, approved in
2016, aims to provide 95 percent of all households and 100
percent of all businesses and public radio communication stations
with access to affordable, reliable, and secure ultra-fast broadband
services, with a downstream data rate of at least 100 Mbps for
households and 1 Gbps for businesses and radio sites.
To continue building their telecommunications infrastructure,
the GCC will tap greater amounts of private and public
capital for facilities investment. The telecommunications
infrastructure can be understood as consisting of three parts (BOX
2).
0
20
40
60
80
100
Qatar Kuwait Bahrain UAE SaudiArabia
Oman2005 2019
Advanced country average, 2005
Advanced country average, 2019
0
20
40
60
80
100
Oman UAE Bahrain SaudiArabia
Kuwait Qatar
2019
Advanced country average, 2019

Gulf Economic Update • Issue 6
52
BOX 2 The telecommunications infrastructure consists of three network
elements, providing different levels of connectivity (Figure B2.1)
The international (and regional) infrastructure provides connection to the rest of the world. In the Middle East and North
Africa region, there is good international connectivity, with the vast majority of data traffic transferred internationally through
submarine cables (Figure B2.2), with terrestrial fiber, microwave, and satellite transmission accounting for smaller amounts. The
remaining investment challenge is setting up a coherent terrestrial infrastructure, where needed, to cater to expanding regional
broadband traffic and ensuring redundant and competitive access to international cables.
FIGURE B2.1
Broadband infrastructure Principal network elements
Source: Adapted from World Bank (2014).
FIGURE B2.2
Submarine cable map GCC countries
Source: PriMetrica Inc. (2020).
The backbone (and backhaul) network infrastructure carries traffic from the landing point of the international
communications infrastructure, or from the nearest point in the border of a landlocked country, to different regions of the country.
In the Middle East and North Africa region, an increasing share of data traffic is transferred nationally through terrestrial fiber,
with microwave and satellite transmission accounting for a steadily decreasing amount. The key investment challenge is to supply
sufficient national fiber capacity for the backbone, including backhaul connectivity to base stations. Accelerating the rollout of the
backbone and promoting affordability requires combining active infrastructure sharing (leasing of capacity from backbone
infrastructure provider), passive infrastructure sharing (leasing of ducts or leasing of dark fiber), and the deployment of own
infrastructure (civil works to lay down infrastructure).
Access network infrastructure links the backbone network to the customer, using two main groups of access technologies. With
fixed broadband technologies, the end user remains in the same physical location and can be connected by (a) wireline
connection (the traditional copper line with a digital subscriber line technology (xDSL); (b) the traditional cable television
network upgraded to broadband internet or newly built fiber network; (c) wireless connection, based on Worldwide
Interoperability for Microwave Access (WiMax) technologies; and (d) satellite connection. With mobile broadband technologies,
the end user can use the broadband service while on the move and from any physical location (based on coverage), using third
(3G), fourth (4G), or fifth (5G) generation mobile technology. Mobile broadband is generally considered to have the greatest
potential to ensure quick availability of services.
Source: World Bank 2014.
Backbone Infrastructure
First-mile connectivity
Access Network
Access Network
Submarine cable
Terrestrial fiber
Microwave
Sattelite
Middle-mile connectivity
Last-mileconnectivity

Gulf Economic Update • Issue 6
53
International connectivity is principally served by undersea
cables. In the GCC, the UAE is connected internationally by 19
submarine cable landings, Saudi Arabia by 17, Oman by 14,
Qatar by 7, Kuwait by 6, and Bahrain by 5. The Gulf Cooperation
Council Interconnection Authority, a joint stock company owned
by the GCC states which links power grids across the GCC and
operates and maintains the interconnection grid, provides regional
connectivity by leasing its fiber optic cable network along its
regional power line network to telecommunications operators.
Among the GCC, the governments of Qatar, Oman, and
Saudi Arabia have taken the lead in developing their national
backbone infrastructure. In many countries where governments
have taken the lead in developing the national backbone
infrastructure, the predominant argument is that the state can
leverage the benefits of broadband ‘sooner than the private sector
could ensure it by itself’ (World Bank 2014). In Qatar, the
Supreme Council for Communications and Information
Technology created the Qatar National Broadband Network
(Qnbn) in 2011 as an SOE to build the country’s fiber optic
broadband network. Operating under a 25-year license, Qnbn
would provide open and equal access to the fiber optic
infrastructure to telecom services providers on a wholesale basis
and to owners and operators of private networks on a retail basis.
In Oman, the government established the Oman Broadband
Company (OBC) in 2013 as an SOE to build the country’s high-
speed broadband infrastructure, providing access to the
infrastructure to service providers with the goal of covering 50
percent of urban areas by 2020 and 95 percent by 2030, as well as
closing the rural connectivity gap by 2020. In Saudi Arabia, the
Ministry of Communications and Information Technology
(MCIT) signed agreements with two state-owned firms in 2017 to
build the country’s fiber optic broadband network. Saudi Telecom
Co. (STC) would be paid SAR 2.7 billion (US$723 million) in
‘financial support’ to roll out the network to 1.3 million locations,
and Saudi Electric Company, SAR 1.6 billion (US$417 million),
for 745,000 locations.
Access networks are built by telecommunications operators,
which need spectrum bands6 licensed by governments. The
UAE Telecommunications Regulatory Authority issued
frequencies in the 3.3–3.8 GHz spectrum band for its two mobile
operators to introduce 5G services in 2018. The agency plans to
auction frequencies in the 1.5–2.4 GHZ and 24–25 GHz range for
5G. Saudi Arabia’s Communication and Information Technology
Company (CITC) awarded new spectrum licenses in the 2,300
MHz and 2,600 MHz bands to its three incumbent mobile
operators in January 2019. Earlier, in December 2018, the three
operators signed an agreement with the MCIT and the CITC to
invest to upgrade their mobile infrastructure by 2022. Kuwait’s
6 Spectrum relates to the radio frequencies allocated to the mobile
telecommunications industry and to other sectors (for example, broadcasters and defense institutions) for communication over the airwaves. Because spectrum is a
sovereign asset, the use of airwaves in each country is overseen by the respective
government. Governments manage the spectrum and issue licenses for its use.
Ministry of Communication (MOC) granted 3G frequencies in the
2,100 MHz band and 4G long-term evolution (LTE) frequencies
in the 1,800 MHz band to its three competing operators in 2016.
Oman reorganized its 900 MHz and 1,800 MHz frequency bands
for its operators to establish 200 sites to cover rural villages on a
technology-neutral basis. Oman subsequently granted its two
operators the right to use the 2,100 MHz frequency band for 3G
services in 2012 and the 2,600 MHz band for 4G in 2015. Bahrain
granted spectrum licenses in the 900 MHz, 1,800 MHz, and 2,100
MHz bands to its three mobile operators in 2013. Commercial
services were launched in the same year based on 4G LTE
networks, which now cover 100 percent of the population.
The GCC countries are on the road to 5G.7 Emirates
Telecommunications Group Company (Etisalat) launched the first
commercial 5G network in the UAE in 2018, becoming the first
in the region and the fourth in the world to introduce the service.
The company exhibited an advanced 5G-based drone, equipped
with a 360-degree virtual reality camera and 4K8 streaming, and
announced that it would provide indoor 5G coverage to selected
buildings in the UAE. Emirates Integrated Telecommunications
Company (du) completed a 5G call and launched its 5G services
at a speed of 1.2 Gbps in 2019. The company had planned to have
500 5G base stations in service by the end of the year, awarding
5G contracts to Ericsson of Sweden and Huawei of China. Saudi
Arabia’s CITC issued licenses on a temporary basis to start 5G
trials using the 3.4–3.8 GHz and the 3.8–4.2 GHZ bands in 2018.
STC collaborated with Nokia to launch the 5G networks. Mobily
signed a memorandum of understanding with Nokia to develop
5G operations. Zain claimed to have completed its first 5G call in
May 2019.
Beyond infrastructure, the GCC states will need to strengthen
their legal, regulatory, and competition frameworks.
Competition policy is predicated on the idea
that competitive markets are central to investment, efficiency, and
innovation. In the GCC, the policy agenda is loaded for
promoting and implementing pro-competition rules in the
telecommunications sector, deterring anticompetitive business
practices, and minimizing government interventions in markets.
The GCC’s telecommunications industries are governed by a
robust framework of basic laws and implementing rules and
regulations (DLA Piper 2020). Saudi Arabia’s
Telecommunications Act, approved pursuant to Royal Decree No.
M/12, went into force in June 2001 and is implemented by the
Telecommunications Bylaws, issued by Ministerial Resolution
No. 11, which became effective in July 2002. The UAE’s Federal
Law No. 3 of 2003 Regarding the Organization of the
Telecommunications Sector, the governing law, is supplemented
7 5G, the fifth and newest generation of mobile network technology, is superior to
4G, the current standard of cellular networks, in terms of peak capacity (Gbps versus Mbps), latency (faster upload and download speeds), and bandwidth size
(number of supported devices). 8 4K = 4,000 horizontal pixel count resolution.
Gulf Economic Update • Issue 6
54
by other federal laws including on electronic commerce and
cybercrime. Qatar’s Decree Law No. 34 on the Promulgation of
the Telecommunications Law, issued in 2004, is implemented by
Executive By-Law No. 1 for the Telecommunications Law, issued
in 2009. Oman’s Royal Decree No. 30 of 2002 Promulgating the
Telecommunications Regulation Law is the primary legislation
governing the telecommunications sector in Oman; Fixed and
Mobile Licenses, issued by the Royal Decree No. 20/2004; Mobile
Licenses, issued by the Royal Decree No 17/2005; and Ministerial
Resolution No. 10 of 2007 implement the basic law. In Bahrain,
Legislative Decree No. 48 of 2002 Promulgating the
Telecommunications Law is the primary legislation governing the
telecommunications sector.
Many agencies that administer the legal framework under
which the domestic telecommunications industries operate
have had decades-long histories in regulatory work. Kuwait
was the last country in the GCC to establish an independent
telecommunications regulatory agency, creating the
Communication and Information Technology Regulatory
Authority (CITRA) in 2014 to regulate the landline, mobile, and
broadband sectors, taking over the functions previously exercised
by the MOC. The CITRA had announced in 2014 that its
priorities would be on competition policy and universal service
policy, apart from spectrum management, licensing, and
interconnection regulation. The agency also cited plans to
liberalize Kuwait’s telecommunications sector by privatizing post
services, the fixed telephony infrastructure, and international
gateways. Qatar replaced its regulator, the Supreme Council on
Information and Communication Technology (ictQatar),
established in 2004, with the Communications Regulatory
Authority (CRA), created in 2014. The CRA has a broader
mandate to include the postal services, telecommunications,
information technology, and digital media. Other regulators in the
GCC have a much longer history. The UAE’s
Telecommunications Regulatory Authority (TRA) was
established in 2003; Oman’s TRA, in 2002; Bahrain’s TRA, also
in 2002; and Saudi Arabia’s CITC, in 2001.
Except in Kuwait, there are at least two competing fixed-line
operators in each GCC country. The STC’s monopoly of the
fixed-line market in Saudi Arabia ended in 2007 with the
awarding of three fixed-line licenses to three consortia led by
Verizon of the United States, PCCW of Hong Kong SAR, China,
and Bahrain Telecommunications Company (Batelco). The
Batelco consortium, which operates under the name GO Telecom,
includes two Saudi Arabian companies, Atheeb Trading and Al
Nahla. Competition in the Saudi Arabian fixed-line telephone
market is expected to increase further with the awarding of
universal licenses to two secondary mobile operators, Mobily and
Zain. In the UAE, where the rising take-up of Voice over Internet
Protocol (VoIP) is compensating for the decline of fixed-line
telephone usage, Etisalat and du are both licensed to provide
VoIP services. The two operators introduced unlimited voice
calling via the Botim app in 2017 (use of VoIP services via the
Skype, WhatsApp, Snapchat, FaceTime, and Viber apps are
illegal in the UAE).
In Qatar, Vodafone Qatar was awarded a fixed license in
2010. Meanwhile, Ooredoo, based in Doha, has rolled out its fiber
optic broadband infrastructure to nearly 100 percent of
households across the country with speeds up to 10 Gbps for both
consumers and businesses. In Oman, the Oman
Telecommunications Company (Omantel) and Ooredoo are the
major fixed-line service providers. The Oman TRA granted the
country’s third fixed-line license in 2012 to Awasr, an Omani
company. Bahrain introduced full competition in the fixed
domestic and international gateways in 2004. Three operators
compete in the fixed-line market—Batelco; STC Bahrain, owned
by the Saudi Telecom Co.; and Zain Bahrain, part of the Zain
Group, a Kuwaiti company.
The fixed-line and international long-distance services remain
a state-owned monopoly in Kuwait. The MOC operates the
country’s fixed-line network. In 2007, the MOC commenced the
deployment of the network using the Gigabit Passive Optical
Network (GPON), a point-to-multipoint access mechanism that
aims to renew the telecommunication infrastructure in Kuwait.
The infrastructure is owned by the MOC, while five Internet
Service Providers (ISPs)—Qualitynet, Fastelco, Gulfnet, KEMS,
and MADA—manage network subscriptions, offering services to
end users using fiber ducts owned by the MOC.
Similarly, mobile markets in the GCC are served by more
than two competing operators. The UAE, which has the highest
mobile penetration rate in the GCC (often attributed to the large
number of tourists, business persons, and temporary residents in
the country), is serviced by two mobile operators, Etisalat, which
reported forming 4G LTE roaming partnerships with 200
operators in more than 100 countries in 2016, and du, which
launched its own 4G LTE-A services in 2015 and began offering
VoLTE services in 2018. There are three main mobile phone
operators in Saudi Arabia. STC has the largest market share,
followed by Mobily, owned by the Etihad-Etisalat consortium,
based in the UAE, and Zain Saudi Arabia, a consortium led by the
Zain Group, a Kuwaiti company. Saudi Arabia has one mobile
virtual network operator (MVNO), Virgin Mobile, which started
operations in the country in 2014.


Gulf Economic Update • Issue 6
56
Bibliography
The Pulse of the Region
Alaref, Jumana, and Johannes Koettl. 2021. “Why Are Saudi Women Suddenly Starting to Take Jobs?” Future Development blog (Brookings Institution). https://www.brookings.edu/blog/future-development/2021/05/19/why-are-saudi-women-suddenly-starting-to-take-jobs/.
Alkhowaiter, Meshal. 2021. “Exploring the Rising Workforce Participation among Saudi Women.” Middle East Institute. https://www.mei.edu/publications/exploring-rising-workforce-participation-among-saudi-women.
British Petroleum. 2020. Statistical Review of World Energy 2020.
European University Institute and Gulf Research Center. 2020. Gulf Labor Markets and Migration Database.
GECF (Gas Exporting Countries Forum). 2020. Annual Statistical Bulletin 2020. Doha: GECF Secretariat.
GECF. 2021. Global Gas Outlook 2050 Synopsis. Doha: GECF Secretariat.
Gentilini, Ugo, et al. 2020a. “Social Protection and Jobs Responses to COVID-19: A Real-Time Review of Country Measures.” World Bank, Washington, DC.
Gentilini, Ugo, et al. 2020b. Global Database on Social Protection Responses to COVID-19.
Google. 2021. COVID-19 Community Mobility Reports. https://www.google.com/covid19/mobility/.
Hale, Thomas, et al. 2021. “A Global Panel Database of Pandemic Policies (Oxford COVID-19 Government Response Tracker).” Nature Human Behavior 5: 529–38.
IEA (International Energy Agency). 2020. Oil 2021. Paris: International Energy Agency.
IEA. 2021. Oil Market Report: January 2020–March 2021. Paris: International Energy Agency.
ILO (International Labour Organization). 2020. Global Database on Social Protection Responses to COVID-19.
ILO. 2021. ILO Monitor: COVID-19 and the World of Work. 7th Edition.
IMF (International Monetary Fund). 2021a. Financial Soundness Indicators. Washington, DC: International Monetary Fund.
IMF. 2021b. International Financial Statistics. Washington, DC: International Monetary Fund.
IMF. 2021c. Policy Responses to COVID-19. Washington, DC: International Monetary Fund. https://www.imf.org/en/Topics/imf-and-covid19/Policy-Responses-to-COVID-19.
IMF. 2021d. Regional Economic Outlook Middle East and Central Asia - Arising from the Pandemic: Building Forward Better. Washington, DC: International Monetary Fund.
IMF. 2021e. World Economic Outlook, April 2021: Managing Divergent Recoveries. Washington, DC: International Monetary Fund.
JODI (Joint Organizations Data Initiative). 2021a. The JODI Oil World Database. https://www.jodidata.org/oil/.
JODI. 2021b. The JODI Gas World Database. https://www.jodidata.org/gas/.
Johns Hopkins University, Center for Systems Science and Engineering. 2021. COVID-19 Data Repository.
Maloney, William, and Temel Taskin. 2020. “Voluntary vs Mandated Social Distancing and Economic Activity during COVID-19.” Economics in the Time of COVID-19 - Columns. VoxEU and CEPR.
OECD (Organisation for Economic Co-operation and Development). 2020. COVID-19 Crisis Response in MENA Countries.
OPEC (Organization of the Petroleum Exporting Countries). 2020a. Annual Statistical Bulletin 2020. Vienna: OPEC Secretariat. https://asb.opec.org/data/ASB_Data.php.
OPEC. 2020b. World Oil Outlook – 2045. Vienna: OPEC Secretariat.
OPEC. 2021. Monthly Oil Market Report, January 2020–March 2021. Vienna: OPEC Secretariat.
KNOMAD (Global Knowledge Partnership on Migration and Development). 2021 Remittances Data.
UNCCSA (United Nations Committee for the Coordination of Statistical Activities). 2020-2021. How COVID-19 Is Changing the World: A Statistical Perspective, Volumes I–III. New York: United Nations.
Gulf Economic Update • Issue 6
57
University of Oxford, Blavatnik School of Government. 2021. Oxford COVID-19 Government Response Tracker. https://www.bsg.ox.ac.uk/research/research-projects/covid-19-government-response-tracker.
World Bank. 2021a. Commodity Markets Outlook, April 2021: Causes and Consequences of Metal Price Shocks. Washington, DC: World Bank.
World Bank. 2021b. Global Economic Prospects, January 2021. Washington, DC: World Bank.
World Bank. 2021c. Macro Poverty Outlook - Spring Meetings 2021. Washington, DC: World Bank.
World Bank. 2021d. MENA Economic Update –Living with Debt: How Institutions Can Chart a Path to Recovery in the Middle East and North Africa. Washington, DC: World Bank.
World Tourism Organization. 2021. UNWTO Tourism Data Dashboard. https://www.unwto.org/unwto-tourism-dashboard.
Diversification: Horizontal and Vertical Reforms in the GCC
Atlantic Council. 2020. “Assessing Saudi Vision 2030: A 2020 Review.” https://www.atlanticcouncil.org/in-depth-research-reports/report/assessing-saudi-vision-2030-a-2020-review/.
Deloitte. 2020. “Understanding the Sector Impact of COVID-19 - Telecommunications.”
DLA Piper. 2020. “Telecommunications Laws of the World.” https://www.dlapiperintelligence.com/telecoms/index.html?c=SA&c2=&t=laws.
Economist Intelligence Unit. 2019. World Industry Outlook - Telecommunications. London: The Economist Intelligence Unit.
Economist Intelligence Unit. 2020a. Industry Report - Telecommunications - Saudi Arabia. London: The Economist Intelligence Unit.
Economist Intelligence Unit. 2020b. Industry Report - Telecommunications - United Arab Emirates. London: The Economist Intelligence Unit.
European Commission. 2012. ICT Sector Definition. Transition from NACE Rev. 1.1 to NACE Rev. 2: A Methodological Note.
EY (Ernst & Young). 2020. “COVID-19: How the Telecoms Industry is Pursuing a Renewed Purpose.”
Gelvanovska, Natalija, Michel Rogy, and Carlo Maria Rossotto. 2014. Broadband Networks in the Middle East and North Africa: Accelerating High-Speed Internet Access. Washington, DC: World Bank.
IBM. 2020. “The Telecom Industry Is Proving Essential in the COVID-19 Response.”
IMF. 2020. Kuwait – Staff Report for the 2020 Article IV Consultation.
ITU (International Telecommunication Union). 2018a. Measuring the Information Society - Volume 1. Geneva: International Telecommunication Union.
ITU. 2018b. Measuring the Information Society - Volume 2. Geneva: International Telecommunication Union.
ITU. 2019. Measuring Digital Development: Facts and Figures 2020. Geneva: International Telecommunication Union.
ITU and UNESCO (United Nations Educational, Scientific and Cultural Organization). 2019. The State of Broadband: Broadband as a Foundation for Sustainable Development. Geneva: International Telecommunication Union and United Nations Educational, Scientific and Cultural Organization.
McKinsey & Company. 2020. “The Next Normal: The Recovery Will Be Digital: Digitizing at Speed and Scale.”
Minges, Michael. 2015. “Exploring the Relationship between Broadband and Economic Growth.” Background Paper for the World Development Report 2016 - Digital Dividends. World Bank, Washington, DC.
OECD. 2010. “Revision of the Methodology for Constructing Telecommunication Price Baskets.”
PricewaterhouseCoopers. “COVID-19 and the Telecommunications Industry.” PowerPoint Presentation.
PriMetrica, Inc. 2020. “TeleGeography Submarine Cable Map.” https://www.submarinecablemap.com/.
World Bank. 2014.
World Bank. 2016. World Development Report 2016: Digital Dividends. Washington, DC: World Bank.
World Bank. 2019. Gulf Economic Update – Economic Diversification for a Sustainable and Resilient GCC. Washington, DC: World Bank.

Gulf Economic Update • Issue 6
58
Key Economic Indicators
Country Summary Tables
BAHRAIN
SELECTED ECONOMIC INDICATORS 2014 2015 2016 2017 2018 2019 2020e 2021f 2022f 2023f
Nominal GDP, US$, billions 33 31 32 35 38 38 33 37 39 42
Real GDP, % change 4.4 2.5 3.6 4.3 1.8 2.0 −5.1 3.3 3.2 3.2
Hydrocarbona 3.0 −0.1 −0.1 −0.8 −1.3 2.2 −0.1 .. .. ..
Non-hydrocarbona 4.7 3.2 4.5 5.5 2.4 2.0 −6.2 .. .. ..
CPI Inflation Rate, average, % 2.6 1.8 2.8 1.4 2.1 1.0 −2.6 2.5 2.3 2.2
Government Revenues, % GDP 26.8 18.2 17.5 18.2 21.8 22.7 19.9 24.4 26.2 27.2
Government Expenditures, % GDP 28.4 36.6 35.1 32.4 33.7 32.0 37.4 36.0 35.6 34.2
Fiscal Balance, % GDP −1.6 −18.4 −17.6 −14.2 −11.9 −9.3 −17.5 −11.6 −9.4 −7.0
General Government Gross Debt, % GDPb 44.4 66.2 81.3 88.1 95.0 102.1 132.9 129.4 134.2 138.8
General Government Net Debt, % GDP .. .. .. .. .. .. .. .. .. ..
Merchandise Exports, % nominal change −8.2 −29.6 −22.7 21.4 16.2 0.4 −29.0 1.1 15.3 7.1
Merchandise Imports, % nominal change −7.0 −20.6 −13.5 18.3 18.9 −9.1 −20.7 −2.5 14.1 4.4
Current Account, % GDP 4.6 −2.4 −4.6 −4.1 −6.5 −2.1 −9.5 −6.9 −4.6 −3.4
Official Reserves, US$, billionsc 6.0 3.4 2.4 2.6 2.1 3.7 2.2 .. .. ..
Memorandum Items
Hydrocarbon sector, % GDPa 20.4 19.8 19.2 18.3 17.7 17.8 18.9 .. .. ..
Hydrocarbon revenue, % total revenuea 86.2 78.1 75.7 75.1 82.4 72.0 .. .. .. ..
Hydrocarbon exports, % total exportsd 43.6 33.7 33.6 40.3 46.4 48.8 38.3 .. .. ..
Source: World Bank (2021c). a. Haver Analytics. b. IMF (2021e). c. IMF (2021b). d. UN Comtrade.

Gulf Economic Update • Issue 6
59
KUWAIT
SELECTED ECONOMIC INDICATORS 2014 2015 2016 2017 2018 2019 2020e 2021f 2022f 2023f
Nominal GDP, US$, billions 163 115 109 121 141 135 118 143 155 164
Real GDP, % change 0.5 0.6 2.9 −4.7 1.2 0.4 −5.4 2.4 3.6 2.8
Hydrocarbona −2.1 −1.7 4.0 −9.0 0.2 −1.7 −9.4 .. .. ..
Non-hydrocarbona 4.8 0.4 1.6 2.6 2.3 3.0 −0.3 .. .. ..
CPI Inflation Rate, average, % 2.9 3.3 3.2 2.2 0.6 1.1 0.9 2.0 2.3 2.5
Government Revenues, % GDPb 53.9 39.5 39.6 43.7 48.4 42.1 34.2 29.8 31.7 42.1
Government Expenditures, % GDP 46.3 52.9 53.6 52.6 51.4 51.9 60.4 52.5 51.0 50.4
Fiscal Balance, % GDPb 7.6 −13.4 −13.9 −8.9 −3.0 −9.8 −26.2 −22.6 −19.3 −8.3
General Government Gross Debt, % GDPc 3.4 4.7 10.0 20.5 14.8 11.8 11.5 13.7 27.3 44.1
General Government Net Debt, % GDP .. .. .. .. .. .. .. .. .. ..
Merchandise Exports, % nominal change −9.5 −48.1 −14.5 18.4 30.0 −9.6 −41.0 47.9 20.0 14.5
Merchandise Imports, % nominal change 7.1 −3.2 1.8 9.1 4.9 −4.8 −7.0 12.9 15.0 15.0
Current Account, % GDP 33.2 3.5 −4.6 8.0 14.1 16.4 −2.7 8.2 11.7 13.8
Official Reserves, US$, billionsd 32.1 28.3 31.0 33.6 37.0 39.8 48.1 .. .. ..
Memorandum Items
Hydrocarbon sector, % GDPa 61.0 59.7 60.3 54.2 54.1 53.0 .. .. .. ..
Hydrocarbon revenue, % total revenuea 90.3 88.6 89.2 89.3 89.6 89.3 .. .. .. ..
Hydrocarbon exports, % total exportse 92.9 90.2 89.6 90.5 91.8 88.9 91.3 .. .. ..
Source: World Bank (2021c). a. Haver Analytics. b. Excluding investment income. c. IMF (2021e). d. IMF (2021b). e. UN Comtrade.
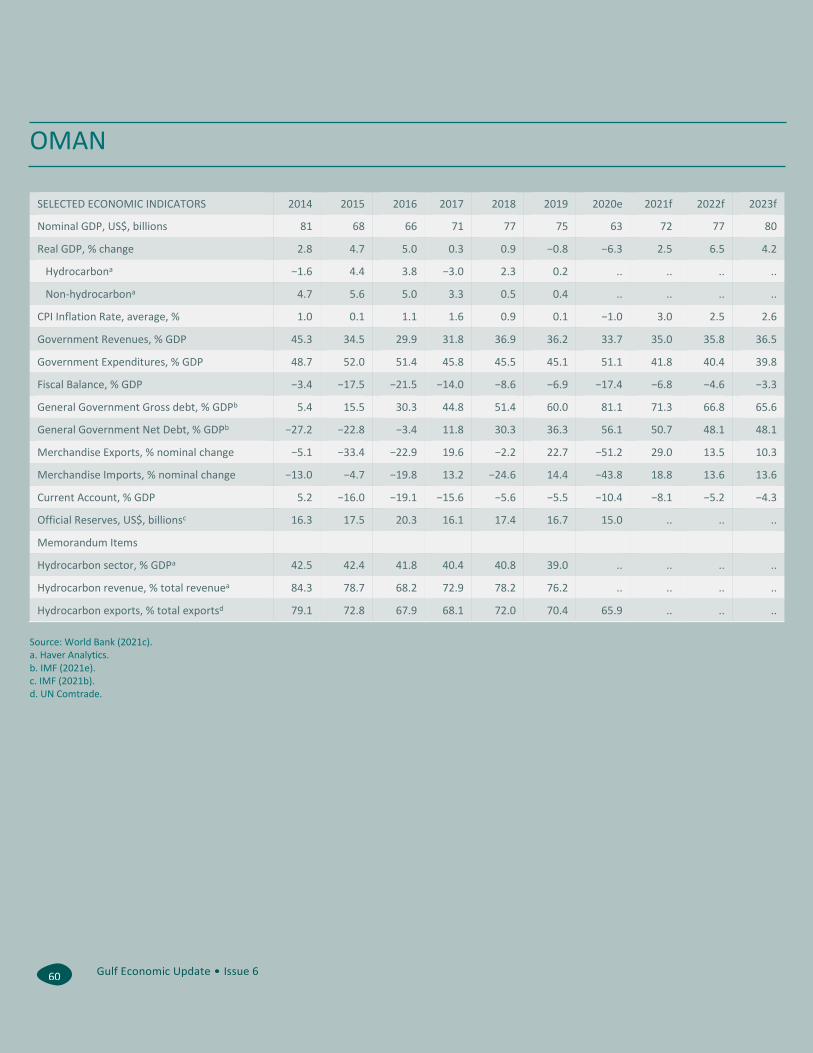
Gulf Economic Update • Issue 6
60
OMAN
SELECTED ECONOMIC INDICATORS 2014 2015 2016 2017 2018 2019 2020e 2021f 2022f 2023f
Nominal GDP, US$, billions 81 68 66 71 77 75 63 72 77 80
Real GDP, % change 2.8 4.7 5.0 0.3 0.9 −0.8 −6.3 2.5 6.5 4.2
Hydrocarbona −1.6 4.4 3.8 −3.0 2.3 0.2 .. .. .. ..
Non-hydrocarbona 4.7 5.6 5.0 3.3 0.5 0.4 .. .. .. ..
CPI Inflation Rate, average, % 1.0 0.1 1.1 1.6 0.9 0.1 −1.0 3.0 2.5 2.6
Government Revenues, % GDP 45.3 34.5 29.9 31.8 36.9 36.2 33.7 35.0 35.8 36.5
Government Expenditures, % GDP 48.7 52.0 51.4 45.8 45.5 45.1 51.1 41.8 40.4 39.8
Fiscal Balance, % GDP −3.4 −17.5 −21.5 −14.0 −8.6 −6.9 −17.4 −6.8 −4.6 −3.3
General Government Gross debt, % GDPb 5.4 15.5 30.3 44.8 51.4 60.0 81.1 71.3 66.8 65.6
General Government Net Debt, % GDPb −27.2 −22.8 −3.4 11.8 30.3 36.3 56.1 50.7 48.1 48.1
Merchandise Exports, % nominal change −5.1 −33.4 −22.9 19.6 −2.2 22.7 −51.2 29.0 13.5 10.3
Merchandise Imports, % nominal change −13.0 −4.7 −19.8 13.2 −24.6 14.4 −43.8 18.8 13.6 13.6
Current Account, % GDP 5.2 −16.0 −19.1 −15.6 −5.6 −5.5 −10.4 −8.1 −5.2 −4.3
Official Reserves, US$, billionsc 16.3 17.5 20.3 16.1 17.4 16.7 15.0 .. .. ..
Memorandum Items
Hydrocarbon sector, % GDPa 42.5 42.4 41.8 40.4 40.8 39.0 .. .. .. ..
Hydrocarbon revenue, % total revenuea 84.3 78.7 68.2 72.9 78.2 76.2 .. .. .. ..
Hydrocarbon exports, % total exportsd 79.1 72.8 67.9 68.1 72.0 70.4 65.9 .. .. ..
Source: World Bank (2021c). a. Haver Analytics. b. IMF (2021e). c. IMF (2021b). d. UN Comtrade.

Gulf Economic Update • Issue 6
61
QATAR
SELECTED ECONOMIC INDICATORS 2014 2015 2016 2017 2018 2019 2020e 2021f 2022f 2023f
Nominal GDP, US$, billions 206 162 152 161 183 176 157 167 178 197
Real GDP, % change 5.3 4.8 3.1 −1.5 1.2 0.8 −3.7 3.0 4.1 4.5
Hydrocarbona −0.7 −0.8 −1.2 −0.5 −0.3 −1.9 −2.1 .. .. ..
Non-hydrocarbona 10.6 9.1 5.9 −0.1 2.3 2.5 −4.6 .. .. ..
CPI Inflation Rate, average, % 3.4 3.0 2.3 0.3 0.1 −0.9 −2.6 1.0 3.0 2.5
Government Revenues, % GDP 44.7 31.8 30.9 27.8 31.2 33.6 31.6 32.5 35.6 29.2
Government Expenditures, % GDP 29.5 32.5 40.1 34.6 28.9 32.5 35.2 34.8 32.9 27.4
Fiscal Balance, % GDP 15.2 −0.7 −9.2 −6.8 2.3 1.0 −3.6 −2.3 2.7 1.8
General Government Gross Debt, % GDPb 24.9 35.5 46.7 51.6 52.2 62.3 71.8 59.8 53.9 49.1
General Government Net Debt, % GDP .. .. .. .. .. .. .. .. .. ..
Merchandise Exports, % nominal change −5.0 −39.0 −25.9 17.8 24.9 −13.5 −26.8 16.5 13.0 12.0
Merchandise Imports, % nominal change −1.0 −8.5 12.1 −3.7 8.3 −5.9 −17.4 16.2 18.4 −12.5
Current Account, % GDP 24.0 8.5 −5.5 4.0 9.1 2.4 −2.5 1.7 2.7 4.1
Official Reserves, US$, billionsc 42.7 36.5 30.8 13.8 29.1 34.7 37.5 .. .. ..
Memorandum Items
Hydrocarbon sector, % GDPa 53.2 51.1 49.5 48.4 47.4 46.8 .. .. .. ..
Hydrocarbon revenue, % total revenuea 82.2 81.9 82.4 81.5 83.3 79.2 .. .. .. ..
Hydrocarbon exports, % total exportsd 90.1 86.6 84.0 84.6 86.5 85.8 84.0 .. .. ..
Source: World Bank (2021c). a. Haver Analytics. b. IMF (2021e). c. IMF (2021b). d. UN Comtrade.
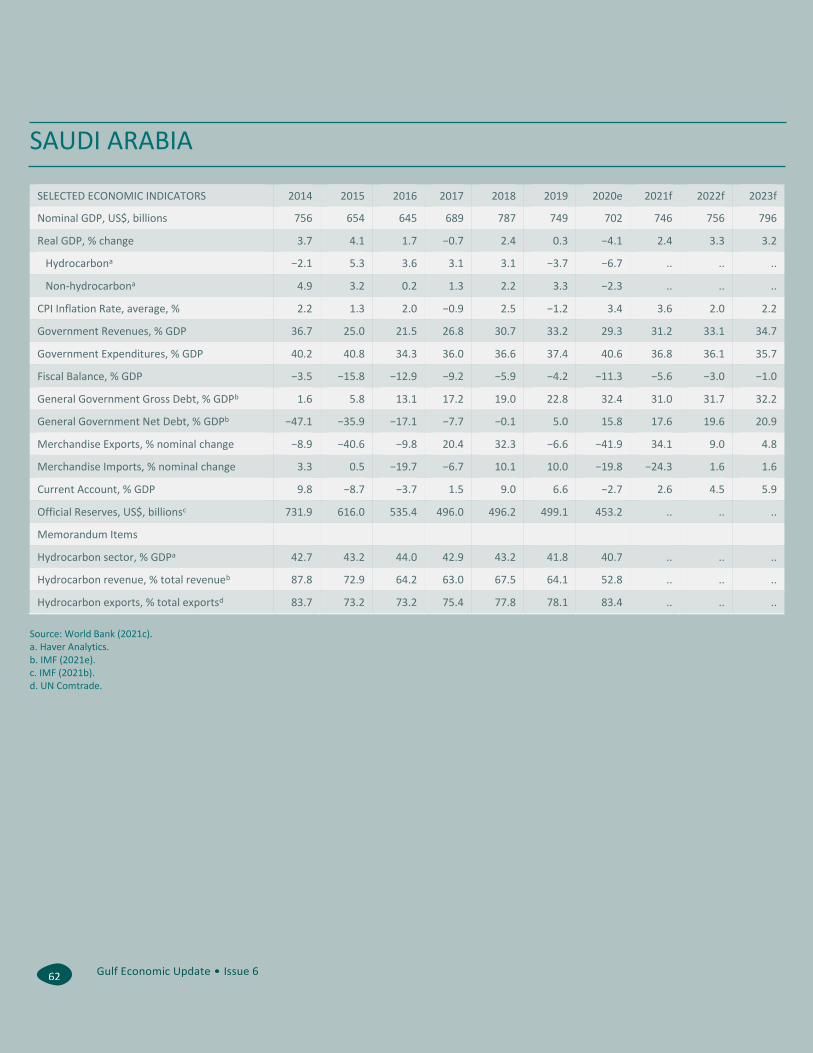
Gulf Economic Update • Issue 6
62
SAUDI ARABIA
SELECTED ECONOMIC INDICATORS 2014 2015 2016 2017 2018 2019 2020e 2021f 2022f 2023f
Nominal GDP, US$, billions 756 654 645 689 787 749 702 746 756 796
Real GDP, % change 3.7 4.1 1.7 −0.7 2.4 0.3 −4.1 2.4 3.3 3.2
Hydrocarbona −2.1 5.3 3.6 3.1 3.1 −3.7 −6.7 .. .. ..
Non-hydrocarbona 4.9 3.2 0.2 1.3 2.2 3.3 −2.3 .. .. ..
CPI Inflation Rate, average, % 2.2 1.3 2.0 −0.9 2.5 −1.2 3.4 3.6 2.0 2.2
Government Revenues, % GDP 36.7 25.0 21.5 26.8 30.7 33.2 29.3 31.2 33.1 34.7
Government Expenditures, % GDP 40.2 40.8 34.3 36.0 36.6 37.4 40.6 36.8 36.1 35.7
Fiscal Balance, % GDP −3.5 −15.8 −12.9 −9.2 −5.9 −4.2 −11.3 −5.6 −3.0 −1.0
General Government Gross Debt, % GDPb 1.6 5.8 13.1 17.2 19.0 22.8 32.4 31.0 31.7 32.2
General Government Net Debt, % GDPb −47.1 −35.9 −17.1 −7.7 −0.1 5.0 15.8 17.6 19.6 20.9
Merchandise Exports, % nominal change −8.9 −40.6 −9.8 20.4 32.3 −6.6 −41.9 34.1 9.0 4.8
Merchandise Imports, % nominal change 3.3 0.5 −19.7 −6.7 10.1 10.0 −19.8 −24.3 1.6 1.6
Current Account, % GDP 9.8 −8.7 −3.7 1.5 9.0 6.6 −2.7 2.6 4.5 5.9
Official Reserves, US$, billionsc 731.9 616.0 535.4 496.0 496.2 499.1 453.2 .. .. ..
Memorandum Items
Hydrocarbon sector, % GDPa 42.7 43.2 44.0 42.9 43.2 41.8 40.7 .. .. ..
Hydrocarbon revenue, % total revenueb 87.8 72.9 64.2 63.0 67.5 64.1 52.8 .. .. ..
Hydrocarbon exports, % total exportsd 83.7 73.2 73.2 75.4 77.8 78.1 83.4 .. .. ..
Source: World Bank (2021c). a. Haver Analytics. b. IMF (2021e). c. IMF (2021b). d. UN Comtrade.
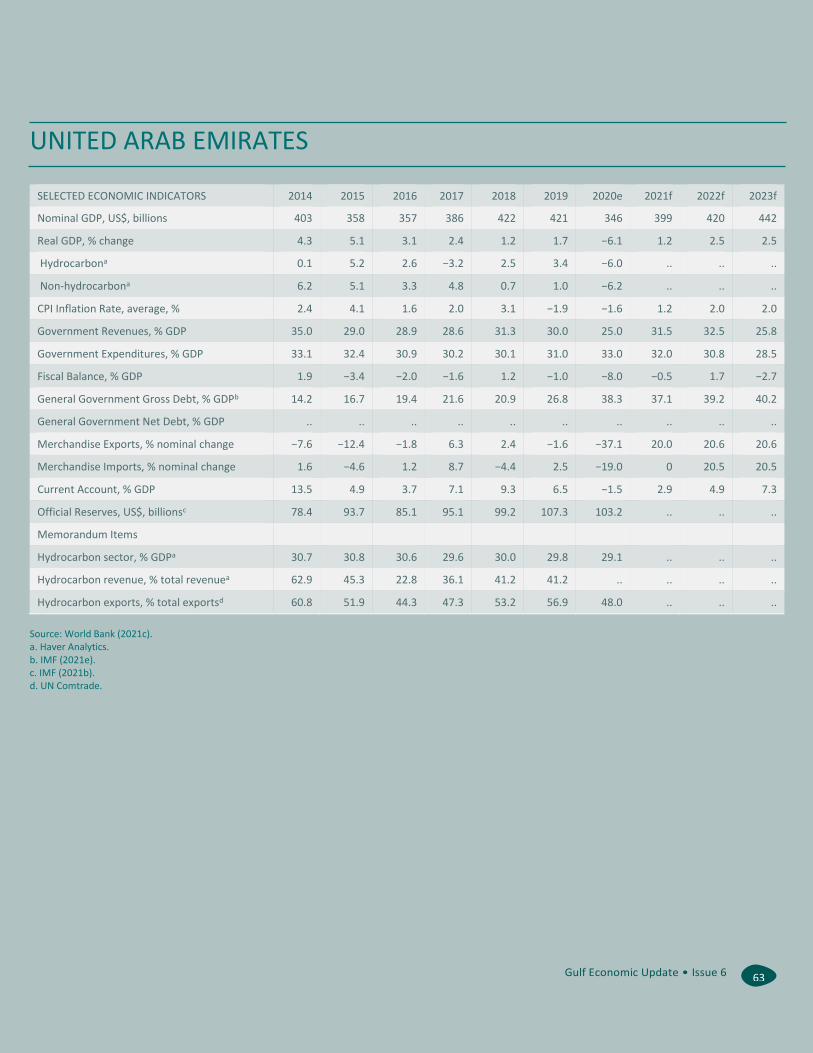
Gulf Economic Update • Issue 6
63
UNITED ARAB EMIRATES
SELECTED ECONOMIC INDICATORS 2014 2015 2016 2017 2018 2019 2020e 2021f 2022f 2023f
Nominal GDP, US$, billions 403 358 357 386 422 421 346 399 420 442
Real GDP, % change 4.3 5.1 3.1 2.4 1.2 1.7 −6.1 1.2 2.5 2.5
Hydrocarbona 0.1 5.2 2.6 −3.2 2.5 3.4 −6.0 .. .. ..
Non-hydrocarbona 6.2 5.1 3.3 4.8 0.7 1.0 −6.2 .. .. ..
CPI Inflation Rate, average, % 2.4 4.1 1.6 2.0 3.1 −1.9 −1.6 1.2 2.0 2.0
Government Revenues, % GDP 35.0 29.0 28.9 28.6 31.3 30.0 25.0 31.5 32.5 25.8
Government Expenditures, % GDP 33.1 32.4 30.9 30.2 30.1 31.0 33.0 32.0 30.8 28.5
Fiscal Balance, % GDP 1.9 −3.4 −2.0 −1.6 1.2 −1.0 −8.0 −0.5 1.7 −2.7
General Government Gross Debt, % GDPb 14.2 16.7 19.4 21.6 20.9 26.8 38.3 37.1 39.2 40.2
General Government Net Debt, % GDP .. .. .. .. .. .. .. .. .. ..
Merchandise Exports, % nominal change −7.6 −12.4 −1.8 6.3 2.4 −1.6 −37.1 20.0 20.6 20.6
Merchandise Imports, % nominal change 1.6 −4.6 1.2 8.7 −4.4 2.5 −19.0 0 20.5 20.5
Current Account, % GDP 13.5 4.9 3.7 7.1 9.3 6.5 −1.5 2.9 4.9 7.3
Official Reserves, US$, billionsc 78.4 93.7 85.1 95.1 99.2 107.3 103.2 .. .. ..
Memorandum Items
Hydrocarbon sector, % GDPa 30.7 30.8 30.6 29.6 30.0 29.8 29.1 .. .. ..
Hydrocarbon revenue, % total revenuea 62.9 45.3 22.8 36.1 41.2 41.2 .. .. .. ..
Hydrocarbon exports, % total exportsd 60.8 51.9 44.3 47.3 53.2 56.9 48.0 .. .. ..
Source: World Bank (2021c). a. Haver Analytics. b. IMF (2021e). c. IMF (2021b). d. UN Comtrade.

Gulf Economic Update • Issue 6
64
Commodity Prices Tables
NOMINAL US DOLLARS
ENERGY UNIT 2016 2017 2018 2019 2020 2021f 2022f 2023f 2025f 2030f
Coal, Australia US$/mt 66.1 88.5 107.0 77.9 60.8 78.0 76.1 74.2 70.6 62.3
Crude oil, average US$/bbl 42.8 52.8 68.3 61.4 41.3 56.0 60.0 61.0 62.9 68.2
Natural gas, Europe US$/mmbtu 4.6 5.7 7.7 4.8 3.2 5.5 5.6 5.6 5.8 6.1
Natural gas, US US$/mmbtu 2.5 3.0 3.2 2.6 2.0 2.8 2.9 2.9 3.1 3.5
Liquefied natural gas, Japan US$/mmbtu 7.4 8.6 10.7 10.6 8.3 8.0 8.0 7.9 7.9 7.7
Source: World Bank (2021c).
CONSTANT US DOLLARS, 2010 = 100
ENERGY UNIT 2016 2017 2018 2019 2020 2021f 2022f 2023f 2025f 2030f
Coal, Australia US$/mt 70.3 91.0 105.1 78.3 61.4 77.6 74.4 71.3 65.0 52.6
Crude oil, average US$/bbl 45.5 54.3 67.1 61.7 41.7 55.7 58.7 58.6 58.4 57.5
Natural gas, Europe US$/mmbtu 4.9 5.9 7.5 4.8 3.3 5.5 5.4 5.4 5.4 5.2
Natural gas, US US$/mmbtu 2.7 3.0 3.1 2.6 2.0 2.8 2.8 2.9 2.9 3.0
Liquefied natural gas, Japan US$/mmbtu 7.8 8.8 10.5 10.6 8.4 8.0 7.8 7.6 7.3 6.5
Source: World Bank (2021c).

Gulf Economic Update • Issue 6
65
Crude Oil Production
In million barrels per day 2012 2013 2014 2015 2016 2017 2018 2019 2020 Q1-2021
Bahrain 0.17 0.20 0.20 0.20 0.20 0.20 0.19 0.19 0.20 0.18
Kuwait 2.98 2.93 2.87 2.86 3.00 2.70 2.74 2.68 2.44 2.33
Oman 0.81 0.84 0.86 0.89 0.91 0.88 0.87 0.84 0.95
Qatar 0.73 0.72 0.71 0.66 0.65 0.60 0.60 0.61 0.61 0.61
Saudi Arabia 9.76 9.64 9.71 10.19 10.46 9.96 10.32 9.81 9.21 8.47
UAE 2.65 2.80 2.79 2.99 3.09 2.97 3.01 3.06 2.78 2.61
Source: OPEC (2020a, 2021); IEA (2021); and JODI (2021a). Note: Qatar, Oman, and Bahrain are not member states of the OPEC.

Gulf Economic Update • Issue 6
66
Natural Gas Gross Production Table
In billion m3 2012 2013 2014 2015 2016 2017 2018 2019 2020 Q1-2021
Bahrain 13.1 14.0 14.7 14.8 14.4 14.5 14.6 16.9
Kuwait 14.7 15.5 14.3 16.1 16.4 16.2 16.9 18.4
Oman 14.7 16.0 16.4 18.7 17.2 18.4 17.1 18.1
Qatar 150.0 163.0 171.1 175.9 172.2 171.4 175.4 181.3
Saudi Arabia 94.4 95.0 97.3 99.2 105.3 109.3 112.1 113.6
UAE 82.4 83.2 84.3 84.3 91.4 91.6 95.4 93.7
Sources: GECF (2020) (data for Qatar, UAE, and Oman) and British Petroleum (2020) (data for Saudi Arabia, Kuwait, and Bahrain). Note: Saudi Arabia, Kuwait, and Bahrain are not member or observer states of the GECF.