gulf of mexico dissolved oxygen quality assurance project plan … · gulf of mexico dissolved...
TRANSCRIPT

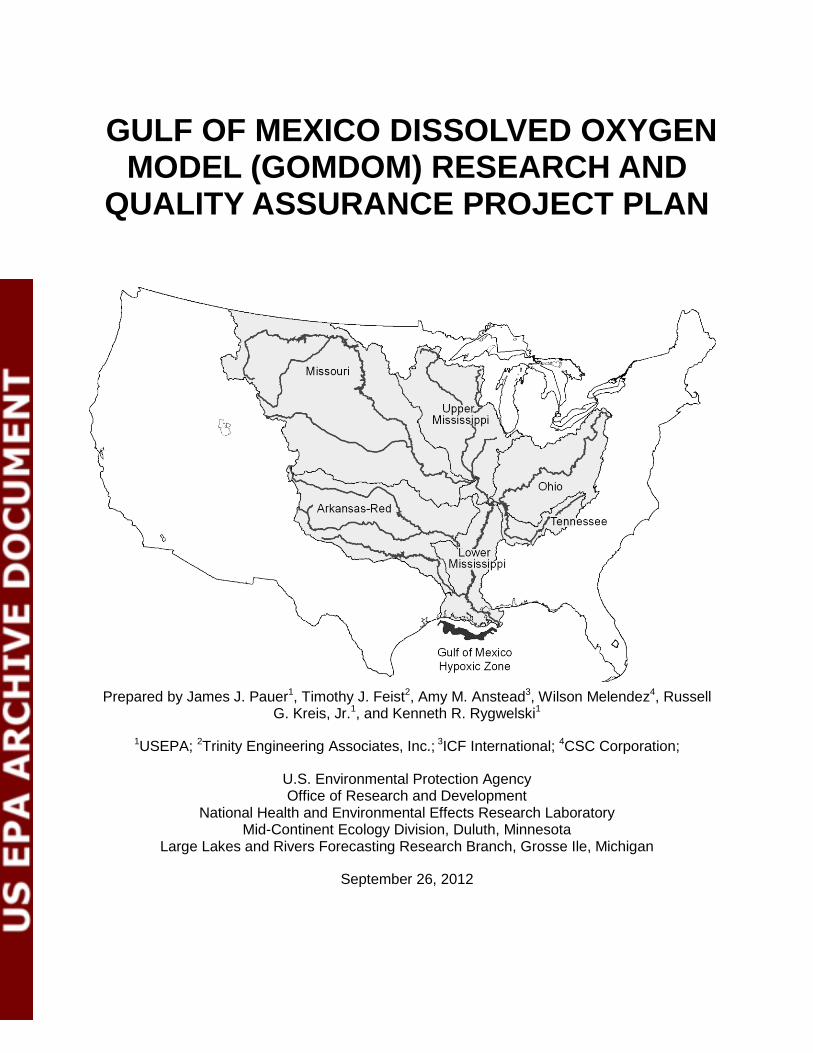
GULF OF MEXICO DISSOLVED OXYGEN MODEL (GOMDOM) RESEARCH AND
QUALITY ASSURANCE PROJECT PLAN
Prepared by James J. Pauer1, Timothy J. Feist2, Amy M. Anstead3, Wilson Melendez4, Russell G. Kreis, Jr.1, and Kenneth R. Rygwelski1
1USEPA; 2Trinity Engineering Associates, Inc.; 3ICF International; 4CSC Corporation;
U.S. Environmental Protection Agency Office of Research and Development
National Health and Environmental Effects Research Laboratory Mid-Continent Ecology Division, Duluth, Minnesota
Large Lakes and Rivers Forecasting Research Branch, Grosse Ile, Michigan
September 26, 2012
Gulf of Mexico Hypoxia Modeling RQAPP
September 26, 2012 Revision 1 ii

Gulf of Mexico Hypoxia Modeling RQAPP
September 26, 2012 Revision 1 iii
FOREWORD
Over-enrichment of waterways by nutrients is a national and global issue and has subsequent effects on freshwater, brackish, and marine systems. One of the symptoms of nutrient enrichment is hypoxia, such as that observed in the Gulf of Mexico and is one of the largest hypoxia zones observed on a worldwide basis. It is incumbent on water quality managers to protect and to identify appropriate management strategies to mitigate the impacts of nutrient stressors. In the following research and quality assurance project plan, we provide a modeling and forecasting approach which will aid managers in the decision-making process for abating hypoxia impacts to the Gulf of Mexico.
This document has been developed following the U.S. Environmental Protection Agency (USEPA) Guidance for Quality Assurance Project Plans, EPA QA/G-5 (USEPA, 2002a) and USEPA Guidance for Quality Assurance Project Plans for Modeling, EPA QA/G-5M (USEPA, 2002b). However, the document is a joint research plan and quality assurance project plan that also incorporates elements of the USEPA, Office of Research and Development, National Health and Environmental Effects Research Laboratory, Mid-Continent Ecology Division (MED), Guidelines for the Preparation of MED Research Plans (USEPA, 2000). Additionally, other modeling quality assurance guidance documents have been consulted (USEPA, 1991; ASTM, 1992; Richardson et al., 2004; National Research Council, 2007; USEPA, 2008a, 2009). Beyond being a prototypical, combined research plan and quality assurance project plan, the emphasis is on mathematical modeling.

Gulf of Mexico Hypoxia Modeling RQAPP
September 26, 2012 Revision 1 iv
NOTICE
The information in this document has been obtained primarily through funding by the United States Environmental Protection Agency (USEPA) under the auspices of the Office of Research and Development (ORD). The report has been subjected to the Agency’s peer and administrative review, and it has been approved for publication as a USEPA document. Mention of trade names or commercial products does not constitute endorsement or recommendation for use.
Gulf of Mexico Hypoxia Modeling RQAPP
September 26, 2012 Revision 1 v
ABSTRACT
An integrated high resolution mathematical modeling framework is being developed that will link hydrodynamic, atmospheric, and water quality models for the northern Gulf of Mexico. This Research and Quality Assurance Project Plan primarily focuses on the deterministic Gulf of Mexico Dissolved Oxygen Model (GoMDOM). The GoMDOM models are similar in that they all are derived from the LM3 Eutrophication model developed for Lake Michigan, but they differ in spatial resolution and/or application. The other models are described only for the purposes of understanding their inputs and linkages to the GoMDOM models. The GoMDOM models are based on mass-balance principles and integrates multimedia nutrient inputs (primarily from the atmosphere and the Mississippi and Atchafalaya Rivers) and ecosystem dynamics to establish a forecasting capability for exploring management options to reduce the hypoxia zone. The GoMDOM models consist of a coupled (eutrophication/dissolved oxygen (DO) and sediment) water quality model that is linked to an atmospheric model (Community Multi-scale Air Quality (CMAQ)) model and are driven by a linked hydrodynamics model (EPACOM). The GoMDOM model framework will be calibrated and confirmed using cruise data (2003 – 2007) specifically collected for the modeling effort along with other evaluated project and non-project data. Uncertainty, sensitivity, and other statistical analyses will be performed to estimate the accuracy of the water quality model predictions. Finally, the 6km x 6 km gridded GoMDOM model will be applied to estimate the impact of several nutrient reduction scenarios on Gulf hypoxia, including the allowable nutrient loads that would reduce the five-year running average areal extent of the hypoxic zone to less than 5,000 km2 by 2015. This effort will assist managers in formulating a strategy to achieve the goals specified in the Gulf of Mexico Action Plan.

Gulf of Mexico Hypoxia Modeling RQAPP
September 26, 2012 Revision 1 vi
ACKNOWLEDGMENTS
The USEPA, Mid-Continent Ecology Division, Large Lakes and Rivers Forecasting Research Branch wishes to acknowledge its partners and collaborators.
We are grateful to Bryon O. Griffith and Melanie Magee of the USEPA Gulf of Mexico Program Office for encouragement and support during the planning phases of this project. We thank the USEPA Office of Water/ Office of Wetlands, Oceans, and Watersheds for shipboard sampling allocations aboard the OSV Peter W. Anderson and the OSV Bold; as well as the crews of both vessels. Instrumental in project sampling, project planning, data analysis and interpretation have been the staff of the USEPA, ORD Gulf Ecology Division including Richard M. Greene, James Hagy, Janis Kurtz, John Lehrter, Michael Murrell, and Diane Yates. We also wish to thank staff from the USEPA Office of Water, USEPA Regions, and State personnel, as well as Leroy Anderson and Samuel Miller of the USEPA, ORD, Mid-Continent Ecology Division for their support during shipboard activities.
We would like to thank Robin Dennis and Ellen Cooter of the USEPA, ORD, National Exposure Research Laboratory for their contributions in atmospheric modeling. We wish to acknowledge Robert Arnone and Dong-Shan Ko of the US Navy, Naval Research Laboratory for their efforts in hydrodynamic modeling. We wish to posthumously recognize the contributions of Peter M. Eldridge of the USEPA, ORD, Western Ecology Division in advancing our understanding of Gulf of Mexico hypoxia and process modeling research. Also, we wish to thank the EPA staff and their support contractor (Lockheed Martin) at the USEPA Environmental Modeling and Visualization Laboratory for their contributions to model development and visualization.
We also wish to show our appreciation for other staff at the USEPA, ORD, MED, Large Lakes Research Station who have supported the project in numerous ways including: David Miller (USEPA), Ronald Rossmann (USEPA), Mark Rowe (USEPA), Xiaomi Zhang (TEA), David Griesmer (CSC), Kay Morrison (CSC), and Debra Caudill (ASRC).

Gulf of Mexico Hypoxia Modeling RQAPP
September 26, 2012 Revision 1 vii
EXECUTIVE SUMMARY
Hypoxia and anoxia (low oxygen and oxygen depletion, respectively) are observed worldwide in freshwater, brackish, and saltwater systems. These so called “dead zones” have been observed and studied for well over one-half of a century. They are primarily attributed to human activity and land use which have increased nutrient inputs and advanced the onset of eutrophication. Nutrient stimulation of algal and plant growth produces large quantities of organic matter, and it is the subsequent bacterial decomposition of the organic carbon that imposes oxygen demand and depletion on the water column and underlying sediment interface. When hypoxia becomes extensive, vital socio-economic factors such as recreation, food, energy, transportation and industry can become impaired.
Hypoxia in the northern Gulf of Mexico is the largest such zone in the U.S. and second largest in the world. Concern regarding the hypoxic zone size, duration and frequency centers around habitat alteration and impacts to various Gulf fisheries. Since the mid-1980s, hypoxia has been documented and tracked in the Gulf, where it has been seasonally observed to be as large as 22,000 km2. Approximately 40% of the contiguous U.S., encompassing 31 States, is drained through the Mississippi River basin and enters the Gulf of Mexico through the Mississippi-Atchafalaya complex. Point and non-point sources contribute to high nutrient loads originating from population centers, farms, and industry. To encourage nutrient loads reduction, the Mississippi River Watershed/Gulf of Mexico Nutrient Task Force, through the Gulf Hypoxia Action Plan, has promoted an adaptive management approach together with a dual approach for nitrogen and phosphorus reductions. However, with the many steps taken by Federal, State, and local agencies, as well as landowners, these activities have not resulted in a significant reduction in the hypoxic zone.
The Gulf hypoxia modeling framework is designed to integrate monitoring, condition assessment, diagnosis, and experimentation within a mathematical modeling construct that incorporates multimedia inputs, environmental data, and ecosystem dynamics to establish a forecasting capability. The goal of this collaborative effort is to develop a state-of-the-science, mathematical modeling framework that will aid water resource managers in making scientifically defensible nutrient restoration decisions. Specifically, the model will be applied to estimate several nutrient load reduction scenarios, including the nutrient loads that decrease the 5-year year running average size of the zone to less than 5,000 km2 by the year 2015, a target specified in the Gulf of Mexico Action Plan. With nutrient caps established through an integrated, multimedia modeling approach, it is anticipated that the size of the hypoxic zone can be reduced and associated improvements will be realized in habitat and toward biological resources that are balanced and productive.
This Research and Quality Assurance Project Plan focuses on the following components of the modeling project:
• Project management, objectives, and description; quality objectives; special training needs; and documents and records management;
• Data generation and acquisition;
• Model construct, coding, inputs, confirmation and corroboration, sensitivity/uncertainty analysis, and application;

Gulf of Mexico Hypoxia Modeling RQAPP
September 26, 2012 Revision 1 viii
• Assessment and oversight;
• Data validation and usability.

Gulf of Mexico Hypoxia Modeling RQAPP
September 26, 2012 Revision 1 ix
LIST OF ABBREVIATIONS
ASRC ASTM
Artic Slope Regional Corporation American Society for Testing and Materials
CDF Common Data Format CE-QUAL-ICM US Army Corps of Engineers Three-Dimensional Water Quality model CMAQ CSC
Community Multi-scale Air Quality Computer Sciences Corporation
CREM CTM 1-D 3-D
Council for Regulatory Environmental Modeling Chemical Transport Model (a global atmospheric chemical transport model) One Dimensional Three Dimensional
DO Dissolved Oxygen DQO ECOM
Data Quality Objective Estuarine, Coastal, and Ocean Model
EPA Environmental Protection Agency
EPACOM Coastal Ocean Model for the Northern Gulf of Mexico developed for EPA EMVL USEPA Environmental Modeling and Visualization Laboratory
FIPS Federal Information Processing Standards FOIA Freedom of Information Act FRA GIS
Federal Records Act Geographical Information System
FRC GoMDOM
Federal Records Center Gulf of Mexico Dissolved Oxygen Model
GED Gulf Ecology Division IAS Intra-Americas Sea Model IASNFS Intra-Americas Sea Ocean Nowcast/Forecast System LLRFRB Large Lakes and Rivers Forecasting Research Branch LLRS Large Lakes Research Station LM3 LM3-Eutro
Lake Michigan Level 3 water quality model Lake Michigan Level 3 water quality model - Eutrophication
LUMCON Louisiana Universities Marine Consortium MED MM5 MODIS Aqua
Mid-Continent Ecology Division A regional model for creating weather forecasts and climate projections Moderate Resolution Imaging Spectroradiometer on the Aqua satellite
NARA National Archives and Records Administration NASA NCAR NCOM
National Aeronautical and Space Administration National Center for Atmospheric Research Navy Coastal Ocean Model
NERL NetCDF
National Environmental Research Laboratory Network Common Data Form
NH3 Ammonia NHEERL NRC
National Health and Environmental Effects Research Laboratory National Research Council
NRL Naval Research Laboratory NOAA National Oceanic and Atmospheric Administration ORD Office of Research and Development PCB Polychlorinated biphenyls PDF PDOM
Portable Document Format file Princeton Dynalysis Ocean Model
POM PRISM
Princeton Ocean Model Parameter Elevation Regression on Independent Slopes Model
QA Quality Assurance

Gulf of Mexico Hypoxia Modeling RQAPP
September 26, 2012 Revision 1 x
QAPP Quality Assurance Project Plan RQAPP ROMS
Research and Quality Assurance Project Plan Regional Ocean Model
QC Quality Control RCS SEAWIFS SOD SSWR
Revision Control System Sea-viewing Wide Field –of-view Sensor Sediment Oxygen Demand Safe and Sustainable Water Resources
TEA URL
Trinity Engineering Associates Uniform Resource Locator
USEPA U.S. Environmental Protection Agency USGS
U.S Geological Survey


Gulf of Mexico Hypoxia Modeling RQAPP
September 26, 2012 Revision 1 2
A.2 Contents
TABLE OF CONTENTS
FOREWORD ............................................................................................................................. iii
NOTICE ..................................................................................................................................... iv
ABSTRACT ................................................................................................................................. v
ACKNOWLEDGMENTS ............................................................................................................. vi
EXECUTIVE SUMMARY .......................................................................................................... vii
LIST OF ABBREVIATIONS ........................................................................................................ ix
GROUP A: PROJECT MANAGEMENT...................................................................................... 1 A.1 Title and Approval Sheet .......................................................................................... 1 A.2 Contents................................................................................................................... 2 A.3 Distribution List......................................................................................................... 4 A.4 Project/Task Organization ........................................................................................ 5 A.5 Problem Definition/Background ................................................................................ 6 A.6 Project/Task Description .......................................................................................... 9 A.7 Quality Objectives and Criteria for Measurement Data ............................................13 A.8 Special Training Needs/Certification/Expertise ........................................................15 A.9 Documents and Records .........................................................................................15
GROUP B: DATA GENERATION AND ACQUISITION .............................................................18 B.1 Model Formulation ..................................................................................................18 B.2 Model Coding ..........................................................................................................23 B.3 Model Inputs ...........................................................................................................24 B.4 Model Confirmation .................................................................................................26 B.5 Model Calibration and Corroboration .......................................................................27 B.6 Model Sensitivity/Uncertainty Analysis ....................................................................28 B.7 Model Application ....................................................................................................28 B.8 Data Management ...................................................................................................29
GROUP C: ASSESSMENT AND OVERSIGHT .........................................................................31 C.1 Assessments and Response Actions ......................................................................31 C.2 Reports to Management ..........................................................................................31
GROUP D: VALIDATION AND USABILITY ...............................................................................32 D.1 Model Review .........................................................................................................32 D.2 Verification and Validation Methods ........................................................................32 D.3 Reconciliation with User Requirements ...................................................................33
REFERENCES .........................................................................................................................34
FIGURES ..................................................................................................................................41
TABLES ....................................................................................................................................49
APPENDIX 1: Conceptual Equations for Dissolved Oxygen and Sediment Diagenesis ............52
Gulf of Mexico Hypoxia Modeling RQAPP
September 26, 2012 Revision 1 3
LIST OF FIGURES
Figure 1. MED Gulf of Mexico Hypoxia Modeling Organization ................................................41 Figure 2. Overview of Project Clients and Collaborators (with lines of communication only).....42 Figure 3. Gulf of Mexico Study Area .........................................................................................43 Figure 4. Areal Extent of 2007 Hypoxic Zone ...........................................................................44 Figure 5. Changes in Areal Extent of 1985-2008 Hypoxic Zone ...............................................45 Figure 6. Annual Nitrate Load to the Gulf of Mexico .................................................................46 Figure 7. Total Annual Phosphorus Load to the Gulf of Mexico ................................................47 Figure 8. Integrated, Multimedia Gulf of Mexico Modeling Framework .....................................48 Figure 9. Sediment-Water Interactions .....................................................................................48
LIST OF TABLES
Table 1. Overall Project Schedule ............................................................................................49 Table 2. List of Desired Field Measurements ...........................................................................50

Gulf of Mexico Hypoxia Modeling RQAPP
September 26, 2012 Revision 1 4
A.3 Distribution List
The USEPA Gulf of Mexico Program Office in partnership with the USEPA Office of Research and Development and USEPA Office of Water are building upon past efforts and have initiated design plans for a framework that guides the science needed to address the hypoxia problem in the Gulf of Mexico to meet the objectives of the Gulf Hypoxia Action Plan. The distribution list consists of those listed below and others to be determined.
Administrative/Management Russell G. Kreis, Jr., Chief, Large Lakes and Rivers Forecasting Research Branch Dave Bolgrien, Chair, Quality of Science Committee Barbara Sheedy, Quality Assurance Manager Janet R. Keough, Associate Director for Science Carl Richards, Director, Mid-Continent Ecology Division Eric S. Mead, Safety, Health and Environmental Management Michael D. Kahl, Chair, Animal Care and Use Committee Suzanne van Drunick, SSWR National Program Director Michael McDonald, SSWR Deputy National Program Director Walt Nelson, SSWR Project Lead Richard M. Greene, Chief, Ecosystem Dynamics and Effects Branch, Supervisory Research
Biologist, Gulf Ecology Division William Benson, Director, Gulf Ecology Division Ben Scaggs, Director, Gulf of Mexico Program Office Darrel Brown, Office of Water, OWOW Michael J. Shapiro, Assistant Administrator, Office of Water Harold Zenick, Laboratory Director, National Health and Environmental Effects Research
Laboratory Jennifer Orme-Zavelata, Director, National Exposure Research Laboratory S. T. Rao, Division Director, Atmospheric Modeling Division Robin Dennis, Senior Scientist, Atmospheric Modeling Division USEPA – GED Personnel Janis Kurtz, Nutrients Team Leader Michael Murrell, DO Task Coordinator James Hagy Diane Yates John Lehrter, SSWR Task Lead Jeanne Scott, GED Quality Assurance Officer Matthew Harwell, Chief, Ecosystem Assessment Branch Mace Barron, Chief, Biological Effects and Population Response Branch J. Kevin Summers, Associate Director for Science USEPA – MED – LLRFRB Personnel David Miller, USEPA, ORD Mark Rowe, USEPA ORD Kenneth Rygwelski, USEPA, ORD James Pauer, USEPA, ORD Amy Anstead, ICF International Phillip DePetro, ICF International Timothy Feist, Trinity Engineering Associates, Inc.

Gulf of Mexico Hypoxia Modeling RQAPP
September 26, 2012 Revision 1 5
Xiaomi Zhang, Trinity Engineering Associates, Inc. Wilson Melendez, CSC David Griesmer, CSC US Navy – Naval Research Laboratory (Stennis Space Center) Robert Arnone
A.4 Project/Task Organization
This project is being conducted within the ORD Safe and Sustainable Water Research Program (SSWR) and is described in the SSWR Strategic Research Action Plan (USEPA, 2012). The research is being conducted within Theme 1: Sustainable Water Resources; Topic 2: minimizing the environmental impacts of land use practices that lead to the sustainability of surface and subsurface water resources; Task 2.3D: modeling the linkage between discharge and nutrients from the Mississippi River basin to the Gulf of Mexico hypoxia. The Project Leader is Walt Nelson and the Task Leader is John Lehrter.
U.S. EPA Mid-Continent Ecology Division (MED) Role
This MED Research and Quality Assurance Plan (RQAPP) describes only those Gulf of Mexico modeling activities that are conducted within the Large Lakes and Forecasting Research Branch of MED. Dr. Russell G. Kreis, Jr. (MED Branch Chief) is the principal investigator for this project. Dr. Kreis is responsible for developing and maintaining the official copy of this RQAPP. MED is responsible for the development, calibration, confirmation, corroboration, sensitivity analysis, and forecasting of a suite of Gulf of Mexico Dissolved Oxygen Models (GoMDOM) including a screening-level one-dimensional (1-D) GoMDOM and three-dimensional (3-D) GoMDOM models on scales of 6 km x 6 km and 2 km x 2 km grid sizes. See Figure 1 for details on MED members of the modeling and support teams.
Project Collaborators
This large project requires products and expertise from parties external to MED (see Figure 2). Partnerships have been established with the following:
The U.S. EPA Gulf Ecology Division (GED) is a primary collaborator and partner in the project. John Lehrter of GED serves as the project Task Lead for the Safe and Sustainable Water Resources (SSWR) program, Task 2.3D, Modeling the linkage between discharge and nutrients from the Mississippi River basin to Gulf of Mexico hypoxia. The work described in this MED Gulf of Mexico Modeling RQAPP is one of the projects under SSWR Task 2.3D. GED has been providing analytical chemistry data from the Gulf and serves as a critical expert advising MED on ocean chemical, biological, and physical processes related to modeling Gulf eutrophication and hypoxia. Results of the modeling work will result in peer reviewed journal articles coauthored among MED and GED scientists and engineers.
U.S. Navy Naval Research Laboratory (located at Stennis Space Center), through agreements with the U.S. EPA Gulf Ecology Division (GED), has been providing hydrodynamic model transport fields from their Environmental Protection Agency Coastal Ocean Model (EPACOM) developed for northern Gulf of Mexico water.

Gulf of Mexico Hypoxia Modeling RQAPP
September 26, 2012 Revision 1 6
The U.S. EPA Office of Environmental Information, Environmental Modeling and Visualization Laboratory (EMVL) has been providing support to the project in the areas of specialized sub-modeling, visualization, and improvement of modeling run times.
U.S. EPA National Exposure Research Laboratory (NERL) Atmospheric Modeling Division has been providing atmospheric fluxes of nitrogen compounds to the Gulf waters from their Atmospheric/Air deposition model (CMAQ, CTM, MM5).
An informal collaboration has been established with the National Aeronautics and Space Administration (NASA) at the Goddard Space Flight Center, Greenbelt, MD. NASA has refined algorithms for chlorophyll, total suspended solids, and particulate organic carbon based on Gulf data from this project that are used in combination with MODIS AQUA and SEAWIFS remote imagery for comparisons to GoMDOM model output.
Project Clients
Gulf of Mexico hypoxia has been a concern and a priority focus for the USEPA for several years. The study efforts described here are anticipated to support decision-making by the USEPA and many other management groups identified on Figure 2 as our clients. This figure shows relationships and lines of communication among these clients and project collaborators. The Office of Water is the lead among the USEPA clients with authorities regarding the Gulf of Mexico and the Assistant Administrator for the Office of Water is Chair of the Interagency Mississippi/Gulf of Mexico Nutrient Task Force. The Office of Water is directly supported by the USEPA Office of Wetlands, Oceans, and Watersheds and USEPA Gulf of Mexico Program Office, Region 4 and Region 6 as they have jurisdictional interests in the Gulf.
A.5 Problem Definition/Background
Investigations of the Gulf of Mexico’s inner shelf (Figure 3) in the coastal waters of Louisiana and Texas have documented seasonal oxygen depletion in this zone during the past several decades (Rabalais et al., 1999, 2001, 2002). Hypoxia, defined as dissolved oxygen concentrations of less than 2 mg/L, has increased in intensity, size, and duration during the past several decades, averaging an area of impact of approximately 15,000 km2. The areal extent of the hypoxic zone (Figure 4 and Figure 5) in the past decade has been observed to be as great as 22,000 km2 and appears to be the largest known hypoxic zone in the waters of the conterminous U.S (Pew Oceans Commission, 2003; U.S. Commission on Ocean Policy, 2004; World Resources Institute, 2008). The Mississippi-Atchafalaya River Basin appears to be the dominant source of macro- and micronutrients which affect the observed hypoxia (Goolsby et al., 1999; Mitsch et al., 1999) through the over-production of phytoplankton and the subsequent decomposition of the organic carbon that imposes oxygen demand and depletion on the water column and underlying sediment interface.
The primary environmental problem is the size, duration, frequency, and intensity of hypoxia in the Gulf of Mexico. Hypoxic bottom waters of the Gulf of Mexico are a detriment to the overall ecological health of this system and have had chronic and acute effects on marine life. The hypoxic zone inhibits the occurrence of marine life, degrades the habitat for many aquatic organisms, and negatively impacts desired aquatic production. The impact on immobile species such as benthos and shellfish is initially a restriction of range and loss of habitat followed by mortality. Mobile species, such as fishes and shrimp, may be able to avoid the hypoxic zone, but their movement and habitat become restricted.

Gulf of Mexico Hypoxia Modeling RQAPP
September 26, 2012 Revision 1 7
Marine systems are typically nitrogen-limited in contrast to freshwater systems which exhibit phosphorus limitation. In each case, the other nutrient, together with silica, may become secondarily limiting when the primary nutrient is over-enriched. Many coastal areas of the U.S. have been enriched with nitrogen and are showing signs of secondary phosphorus and silica limitation, as observed in the case of the Gulf of Mexico. The available historical records indicate that nitrogen loading has increased more dramatically than that of phosphorus (Figure 6 and Figure 7, respectively). The USEPA has adopted a dual management approach for both nitrogen and phosphorus as it relates to the freshwater resources of the Mississippi Basin and the Gulf of Mexico (USEPA, 2008b). The relationships among nitrogen, phosphorus, carbon, and solids loads and concentrations with algal production, algal biomass, and oxygen demand are critical to the understanding of hypoxia in the Gulf of Mexico.
Previously applied water quality models and approaches (Bierman et al., 1994; Greene et al., 2009, Justic et al., 2003; Scavia et al., 2003, 2004; Hetland and DiMarco, 2007; Morse and Eldridge, 2007; Scavia and Donnelly, 2007) have yielded insights to Gulf hypoxia but questions are being raised as to the suitability of their resolution and degree of uncertainty with respect to confidence related to nutrient reduction forecasts and the final target to be established. These models used relatively coarse segmentation schemes with limited spatial resolution; simplistic or limited kinetics; very approximate hydrodynamics, including the flow direction of the Mississippi River plume; and simplistic sediment and dissolved oxygen interactions. Due to these limitations, consensus on loading reduction targets have been very difficult to reach when confronted with a range of 30-65% for nitrogen and/or phosphorus based upon modeling and empirical approaches (Mississippi River/Gulf of Mexico Watershed Nutrient Task Force, 2001, 2004, 2008a, 20008b; USEPA, 2008b; NRC, 2009).
The body of investigative and mathematical modeling studies during the past decade has provided considerable insight into the Gulf hypoxia issue and its relationship to the Mississippi River Basin; however, a number of recommendations for future work and improvements have been outlined (Committee on Environment and Natural Resources, 2010; Mississippi River/Gulf of Mexico Watershed Nutrient Task Force 2001, 2004, 2008a, 20008b; Justic et al., 2007; USEPA, 2008b; NRC, 2009). Selected recommendations, gaps, and issues to promote a consensus modeling framework with supporting data are presented below:
1) A sampling design is needed to support the development of an integrated, multi-media mass balance modeling framework.
2) The sampling program should be specifically-designed to reduce the uncertainty associated with the empirical data and modeled nutrient-reduction forecasts.
3) The sampling program should be seasonally-driven to create at least a full 2-year period dataset and supplement the existing summer sampling program by directed overlap.
4) The sampling program should be statistically-based with random transects and stations that include multiple resource classes: embayment/near-coastal, inner shelf, outer shelf, and bluewater. The offshore boundary should be sufficiently sampled to delineate the boundary condition.
5) Determine phytoplankton species and carbon flux seasonality.
6) Further define sediment diagenesis and sediment nutrient flux factors.

Gulf of Mexico Hypoxia Modeling RQAPP
September 26, 2012 Revision 1 8
7) Account for water column oxygen demand.
8) Further quantify the relationships among loads, ambient concentrations, chlorophyll, and dissolved oxygen, using data and models.
9) Establish a multimedia (air, water, sediment), mathematical modeling framework which builds upon past efforts and includes a hydrodynamic model, atmospheric model, sediment transport and fate model, and water quality-eutrophication model.
In order to address these factors, a high resolution, multi-media modeling suite is being applied to address the atmospheric, hydrodynamic, water quality, and sediment interactions as well as spatial resolution and improved kinetics. The modeling framework is also being supported by a monitoring and laboratory program, specifically designed for the modeling. The cornerstone of the multimedia construct being applied is the Gulf of Mexico Dissolved Oxygen Model (GoMDOM), a version of LM3-Eutro, which includes water quality chemical, physical, and biological interactions and kinetics with linkage capabilities to other modeling components. The modeling framework required primary productivity, dissolved oxygen (DO) and other kinetic equations to realistically represent processes within the Gulf. A sediment-water component is also necessary to account for this important process in the Gulf of Mexico. Nutrient transport is driven by hydrodynamic output from the U.S. Navy Naval Research Laboratory's (NRL) EPACOM model (Ko et al., 2003). Atmospheric loads of nitrogen compounds are being provided by EPA’s Community Multi-scale Air Quality Model (CMAQ).
The Gulf Hypoxia modeling framework is being designed to integrate monitoring, condition assessment, diagnosis, and experimentation within a mathematical modeling construct that incorporates multimedia inputs, environmental data, and ecosystem dynamics to establish a forecasting capability. Since a wealth of information is available to formulate the many transport and kinetic processes and to estimate model parameters, it is believed that this deterministic model will provide a better predictive estimate than using an empirically established relationship. The goal of this collaborative effort is to develop a mathematical modeling framework that will aid water resource managers in making scientifically defensible nutrient restoration decisions to reduce the hypoxia problem. By reducing the size of the hypoxic zone, it is suspected that habitat and food web assemblages along the Louisiana-Texas (LA/TX) coast will benefit. Specifically, the model will be applied to estimate dissolved oxygen concentrations and hypoxia area in the northern Gulf of Mexico under several nutrient load reduction scenarios. Other major model outputs include the duration of hypoxia, nutrient concentrations, and phytoplankton concentrations. This modeling effort will assist managers in helping them to understand options available to achieve a goal of a five-year running average hypoxia zone of 5,000 km2 as specified by the 2001 and 2008 Gulf of Mexico Action Plan and supporting documents (Mississippi River/Gulf of Mexico Watershed Nutrient Task Force 2001, 2004, 2008a, 20008b; USEPA, 2008b).
This Research and Quality Assurance Project Plan focuses on the following components of the modeling project:
Project management, objectives, and description; quality objectives; special training needs; and documents and records management.
Data generation and acquisition

Gulf of Mexico Hypoxia Modeling RQAPP
September 26, 2012 Revision 1 9
Model construct, coding, inputs, confirmation and corroboration, sensitivity/uncertainty analysis, and application
Assessment and oversight
Data validation and usability
A.6 Project/Task Description
The modeling framework will build upon earlier models that were developed and applied to the Gulf of Mexico and is most similar to the efforts of Bierman et al. (1994). The Gulf of Mexico Eutrophication and Dissolved Oxygen Model (GoMDOM) is based on the LM3-Eutro water quality model (Pauer et al., 2006, 2008, 2011; Melendez et al., 2009) that was developed for and applied to Lake Michigan. GoMDOM, in its present form, has salinity, two phytoplankton state variables, one zooplankton state variable, and several dissolved and particulate nutrient state variables. The model uses standard eutrophication kinetics to describe the many biochemical reactions such as: Monod kinetics to describe phytoplankton growth, first- order nutrient mineralization kinetics, and a temperature dependency function for the biochemical reactions. The Jassby and Platt equation was used to estimate the limitation of primary production by available light (Jassby and Platt, 1976; Lehrter et al., 2009). Light attenuation was calculated using a site-specific relationship between light attenuation and chlorophyll, particulate carbon, and salinity. It also has simple user-defined sediment-to-water nutrient fluxes. To prepare LM3-Eutro for its application to the Gulf of Mexico, the model was modified to use output from the Navy hydrodynamics model (EPACOM) and a dissolved oxygen subroutine was included. The model receives loadings primarily from the Mississippi and Atchafalaya Rivers but also from minor tributaries and an atmospheric model (Community Multi-scale Air Quality (CMAQ)). See Figure 8 and Figure 9 for information on the integrated multimedia model interactions. This modeling framework will integrate multimedia inputs (from statistically-based monitoring programs) and ecosystem dynamics to establish a model that will have the forecasting capability for exploring alternative futures and/or remedial options. GoMDOM will be calibrated and corroborated using cruise data collected from 2003 to 2007. Uncertainty, sensitivity, and other statistical analyses will be performed using the model to estimate the accuracy of the model predictions. Finally, the model will be applied to estimate the dissolved oxygen concentration and hypoxic area in the northern Gulf of Mexico under several nutrient reduction scenarios, including the allowable nitrogen load that would limit the hypoxic area to a maximum of 5,000 km2.
An overall project timeline is provided in Table 1. In 2007, advanced general project planning took place. In 2008, database development, which harmonized the various field measurements, laboratory analyses, and research results by media, site, and time, began along with model development. Considerable model calibration runs, sensitivity runs, and journal article preparation took place in FY2011 and FY2012. This timeline is based upon current understanding of the science affecting hypoxia on the coastal shelf and management objectives. The schedule should be considered preliminary and may require adjustment if management priorities change because of future events, if scientific findings during the project indicate a need to change the project scope, or if deliverables from project partners are not received in a timely manner.

Gulf of Mexico Hypoxia Modeling RQAPP
September 26, 2012 Revision 1 10
Model Development Strategy
The modeling framework is being developed following a two phase strategy (see Section B.1 for more details). In the first phase, the model eutrophication, DO, and sediment-water interactions are being developed and tested using a one dimensional (1-D) GoMDOM screening model. This screening-level model will provide for easier development and testing of water quality kinetic equations. It is being applied at selected stations in the Gulf of Mexico where data for calibration purposes are plentiful and where horizontal gradients of model state variables are minimal. The model is run for a relatively short duration and consists of four water layers and includes interaction with the sediment. This screening model will not be used for model scenario forecasting, although it should provide insight into biological and chemical interactions on the coastal shelf. Calibrated model coefficients/parameters from the screening model will be used to provide some initial estimates for similar coefficients/parameters in the higher resolution GoMDOM models.
During the second phase, the model framework developed in the first phase will be applied to an intermediate resolution model grid (approximately 6 km x 6 km and 26 sigma layers). The intermediate resolution model will be calibrated and corroborated to existing coastal shelf cruise data. The model will then be applied as a diagnostic tool to assist in evaluating biochemical interactions on the coastal shelf and applied to selected management scenarios. If needed, a high resolution (2 km x 2 km) GoMDOM model will be implemented.
1-D GoMDOM Screening Model
The development of the screening model will include three tasks: a review of previous modeling efforts and available data, the application of the selected model to the Louisiana coastal shelf, and the modification of the model to more appropriately represent physical, chemical, and biological processes on the Louisiana coastal shelf. The proposed schedule for completing these tasks is outlined in Table 1.
Data/Model Review
This task included reviewing previous modeling efforts, available data, and other recommendations and identified gaps to determine which modeling frameworks are suitable for use in the proposed modeling framework. An initial review of the GED cruise data and other available data was conducted to assist in determining the most suitable extent for the proposed model grid and to determine what time periods and kinetic processes have sufficient data to support modeling efforts. Published studies were reviewed to help determine appropriate water quality processes to include in the model framework. Previous water quality models, both from the study area and those suitable to be applied to the study area, were reviewed for possible use in the modeling framework.
Two mathematical models were considered as frameworks for developing the hypoxia model for the Gulf. CE-QUAL-ICM was developed by the US Army Corps of Engineers (Cerco and Cole, 1995) and applied to Chesapeake Bay (Cerco and Cole, 1994). LM3-Eutro is another high resolution framework that was developed and applied to Lake Michigan (Pauer et al., 2006, 2008, 2011; Melendez et al., 2009). Both models had many positive attributes and very suitable building block for the next the Gulf model. After careful review and consideration, the LM3 framework was selected as a base for developing a new Gulf model. The results of the model review found that LM3-Eutro has most of the features to address the hypoxia problem in the northern Gulf of Mexico. Since this model was developed in-house and staff are familiar with

Gulf of Mexico Hypoxia Modeling RQAPP
September 26, 2012 Revision 1 11
the modeling framework, it can be relatively easily modified and applied to the Gulf study area. Modifications include code modification to utilize output from the Navy hydrodynamics model (EPACOM) and the addition of dissolved oxygen and sediment subroutines.
Hydrodynamic models were also reviewed. The models examined included the Princeton Dynalysis Ocean Model (PDOM), Environmental Fluid Dynamics Code (EFDC), Estuarine, Coastal and Ocean Model (ECOM), Regional Ocean Model (ROMS), and the Navy’s EPACOM model. These were generally regional models with various spatial and depth operational limits. The EPACOM model is based on the Navy’s Intra-Americas Sea Ocean Nowcast/Forecast System (IASNFS) and was selected to provide the hydrodynamic transport fields. IASNFS is based on the Navy Coastal Ocean Model (NCOM) (Martin, 2000; Martin et al., 2009).
The Community Multi-scale Air Quality Model (CMAQ) was selected to provide atmospheric nitrogen compound loads to the water quality model. It is the premier national deposition model, operated by EPA, has nitrate deposition over the Gulf of Mexico, and is being run with finer-resolution deposition for the purposes of this study (Byun and Ching, 1999; Byun and Schere, 2006; Dennis et al., 2007, 2008.
The initial model development task involved applying LM3-Eutro equations to the 1-D model grid (four water layers with interactions with the sediment) to evaluate and test the application. Simplification included limiting the model such that all phytoplankton were represented as a single model state variable along with fewer particulate nutrient and carbon state variables. GoMDOM-1D used site-specific measurements and empirical relationships to determine nutrient and oxygen demand sediment fluxes. MATLAB was used in this model development. After the initial testing, the model will be modified as needed to appropriately simulate important processes affecting hypoxia on the coastal shelf. The model then will undergo further testing and evaluation to ensure that physical, chemical, and biological processes are being suitably simulated. The 1-D GoMDOM will be used to allow for easier testing as the model framework is being developed. The majority of model confirmation/corroboration activities (Section B.4) related to kinetic processes have been completed. The screening model will not be formally applied to management scenarios. The screening model will be compared to field data and may provide insight into processes in the study area that may need to be further evaluated. The calibrated model coefficients from the 1-D GoMDOM will be used as initial estimates of similar coefficients for the 3-D GoMDOM models. Any deficiencies identified in the model framework will be addressed, and the model re-confirmed, before application of the model to the intermediate resolution GoMDOM.
3-D GoMDOM 6 km x 6 km Intermediate Resolution Model
Finalize Intermediate Resolution Model Grid
The model grid for the 3-D GoMDOM 6 km x 6 km intermediate resolution model was based upon the review of available data. The grid extends from the shoreline southward to approximately the 80-100 m contour and from east of the Mississippi River Delta westward to 93o W longitude. This grid extent contains the area of hypoxia during most years and provides sampling stations outside the grid for use as boundary conditions. The model is being applied to an approximately 6 km x 6 km model grid, with hydrodynamic transport provided by the NRL’s EPACOM model output aggregated to this size (the original scale is approximately 2 km x 2 km). EPACOM output provided for this project contains 26 vertical sigma layers which should provide suitable resolution of surface, pycnocline, and hypoxia zone layers. This grid size

Gulf of Mexico Hypoxia Modeling RQAPP
September 26, 2012 Revision 1 12
provides a compromise between higher spatial resolution and faster model run times. The extent of the grid may be expanded to include additional areas of the coastal shelf if the initial model results show it would be useful and if hydrodynamic data are available to support an expansion. The vertical resolution of the grid is identical to that of EPACOM.
Due to the hydrodynamic and biochemical processes in the study area that occur at relatively small scales because of the shallowness of the shelf and the mixing and stratification of the freshwater outflow from the Mississippi and Atchafalaya Rivers, a model with a resolution similar to the intermediate resolution GoMDOM model is recommended for properly simulating processes affecting hypoxia in this area. In the second phase of model development, the knowledge gained from the first phase will be applied to the intermediate resolution GoMDOM model. The model will then be calibrated and corroborated against cruise and process data and used for diagnostic evaluation of biochemical processes and for management scenarios. The proposed schedule for completing these tasks is included in Table 1. This schedule should be considered preliminary and may need to be adjusted if findings from the screening model suggest a change in project scope, if management priorities change, or if products from project partners are not received in a timely manner.
Create Input and Linkage Files
This task included developing the model grid and geometry files, developing software to convert the NRL hydrodynamic model output into a format that the water quality model can use as input, creating input decks (model input files describing oxygen and nutrient initial conditions and estimates for the model parameters), modifying the original source code to read input data and to write simulation results to output using NetCDF, and running and testing the model. Software developed in this phase, for example to generate mapping and linkage files, was designed so the model framework can easily be applied to higher resolution model grids.
Calibration and Corroboration
The intermediate resolution model will be tested to confirm that it is working properly (Section B.4) and then calibrated and corroborated against GED cruise survey data following procedures outlined in Section B.5. Data sets for these procedures will be selected from databases completed by the time of the procedure.
An evaluation of model sensitivity and uncertainty (Section B.6) will be conducted concurrently with the calibration and corroboration of the intermediate resolution model.
Model Diagnostic Testing and Scenarios
In this task the calibrated and corroborated model will be applied in a diagnostic mode for scientific evaluation of shelf processes and in scenarios to assist in evaluating management options following procedures described in Section B.7. Additional input files and hydrodynamic inputs may need to be created depending upon the scenarios selected.
3-D GoMDOM 2 km x 2 km High Resolution Model
If the modeling results and analysis from the 3-D GoMDOM 6 km x 6 km model indicate that a higher resolution model is warranted, and if time permits, a 3-D 2 km x 2km high resolution model will be utilized. The modeling framework from the intermediate resolution GoMDOM model is directly transferable to the 2 km x 2 km model. Also, once the intermediate resolution

Gulf of Mexico Hypoxia Modeling RQAPP
September 26, 2012 Revision 1 13
model is calibrated, those calibrations (when applicable) can be transferred to the high resolution model. This will be a time saver when calibrating the 2 km x 2 km model. However, due to the large number of model cells in the high resolution model, the run times will be much longer than that in the intermediate model. Consequently, an effort is being planned in FY2013 (see Table 1) to parallelize the code to significantly reduce the model run times. This model will likely be run and tested on EPA’s supercomputer in RTP, NC in FY2013.
A.7 Quality Objectives and Criteria for Measurement Data
Quality objectives and criteria will be established to ensure that the model output addresses the management questions with the accuracy required by the user. This can be achieved by establishing statistical criteria to determine, during the model evaluation stage, if the overall accuracy of the model is acceptable and if the model uncertainty is acceptable.
Level of accuracy and precision of model output
Before a model is used for remedial guidance and/or regulatory purposes, agreement between the expectations of the managers who will be using the model and the model developers is needed. Managers need to be generally well versed in the science of modeling natural systems. Modelers have the responsibility of not only attempting to make the models reliable but also to state unequivocally their assumptions and uncertainties. This is usually done by providing the most probable answer(s) along with uncertainty brackets which provide a range that is very likely to contain the actual answer. The decision-maker must determine whether to use the model with the uncertainties and caveats provided or to provide additional resources to refine the results. If refinement is needed, the modeler can advise management on what needs improvement because of their knowledge gained in determining model sensitivity to various model-controlling forcing functions or processes.
Modeling quality objectives continue to be discussed regarding the Gulf of Mexico and will depend upon the certainty required by managers and the importance of the modeling tool in developing nutrient loading targets to reduce the extent of hypoxia. With respect to these concerns, a preliminary data quality objective (DQO) is for the model to simulate the average water quality within plus or minus two standard errors of the mean of the field measurements, meaning there is approximately 95% confidence that the actual model-predicted result falls within this range. It is likely that the model fit to data will be much better than this criteria for many of the model-predicted state variables. The data means and standard errors will be computed using appropriate spatial and temporal statistical averaging and interpolation techniques.
Obviously, the range of plus or minus two standard errors of the mean of the measurements is (in part) a function of measurement (including both sampling and instrument) precision. Most of the field data used in model calibration and confirmation will originate from the U.S. EPA Gulf Ecology Division. The quality objectives and criteria for these data are described in the Gulf of Mexico Hypoxia Quality Assurance Project Plan (Greene, 2007). In this document, most parameters have an instrument accuracy target of 10% and an instrument precision target of 30% Relative Standard Deviation, also known as the Coefficient of Variation.
Prediction bias will be minimized by calibration, the process of parameter optimization seeking to minimize residuals (the difference between model calculated and measured concentrations), without violating constraints imposed by scientific observations and principles. Modelers commonly plot field observations vs. model output for a given model state variable (Pineiro et

Gulf of Mexico Hypoxia Modeling RQAPP
September 26, 2012 Revision 1 14
al., 2008). This method provides both qualitative and quantitative feedback to the modeler on how well the model compares to field observations. If the model predictions match field observations, then it is expected that the residuals (difference between the plotted points and the 1:1 line) fall randomly about the 1:1 line and are relatively close to that line. Model biases can be noted using this method when a majority of points lie either above or below the 1:1 line. If a majority of the points fall either above or below the 1:1 line, then a serious model bias exists and will be explored further to determine the cause.
An R-squared of the correlation described in the previous paragraph provides information on the "goodness of fit" of the model to observations. In a calibration exercise, the modeler will try to maximize the R-squared. However, no target R-squared can be established because this can vary from state variable to state variable. For example, modeling a conservative substance like salinity may yield a maximum achievable R-squared of 0.8; however, for a much more complex state variable involved in a multitude of kinetic reactions such as nitrogen, an R-squared of 0.5 may be the best that can be achieved.
The model will be considered calibrated when the results for important model state variables fall within the 95% confidence intervals of the majority of the data cruise means and the results have a highest achievable R-squared when correlating model output to field observations, stratified appropriately in time and space. In addition, model simulations will attempt to reproduce the statistical distribution properties of the data. This will be evaluated by comparing cumulative frequency distribution plots of data to frequency distribution plots from comparable model predictions.
Once calibrated to field data, the model will be valid within the error constraints specified for the calibration period. However, for forecast predictions, it is not possible to know the uncertainty of predicted forcing functions and boundary conditions. Therefore, the model will be run for various forecast scenarios with inputs bracketed in terms of extreme expectations and probability distributions, and the results will be provided in terms of prediction means and exceedance limits.
Criteria for using secondary data (literature values, etc.)
Data generated specifically for this project will be used for model development and calibration; however, where no project data are available, data from the literature and other modeling studies will be used. The majority of data to be used as model inputs originate from the Gulf of Mexico Hypoxia Study Project and samples are being collected and analyzed following the U.S. EPA Gulf Ecology Division’s “Gulf of Mexico Hypoxia Monitoring Survey Quality Assurance Project Plan” (Greene, 2003; Greene, 2007). The monitoring QA plan describes the QA program and process, organizational structure, data quality objectives, implementation of the QA program, and information management guidelines for the data collection activities of the study. All GED’s analytical data for the model’s target analytes and most supporting data will have been verified through their QA program’s process and will have met the performance criteria established before release to modelers. Data will undergo an additional screening by project modelers to ensure suitability for modeling purposes
Data generated through other projects or studies may be obtained from either published or unpublished sources. The published data (including those from gray literature) will have had some degree of QA review, although there is a wide range of review quality among possible sources. Unpublished databases may be obtained directly from authors or from on-line databases.

Gulf of Mexico Hypoxia Modeling RQAPP
September 26, 2012 Revision 1 15
When possible, all data used by the modelers will be checked for bias, comparability, outliers, normality, completeness, precision, accuracy, validity of station names and sample identification codes, and units errors. Modelers will also review any documentation or data qualifiers accompanying data sets. As questions arise, we will contact the data generator if possible.
Negative consequences of making inappropriate decisions due to poor model prediction ability
The chances of making inappropriate decisions due to poor model prediction ability will be minimized through the quantification and evaluation of the accuracy and reliability of model predictions (Sections A.7, B.5, and B.6) and through the reconciliation of model prediction reliability with user requirements (Section D.3). In addition, the Gulf of Mexico hypoxia model proposed for this study is only one of several tools that will be used by managers when determining management and regulatory options for the Mississippi River/Atchafalaya River/Gulf of Mexico system. Other tools include previous modeling studies, on-going monitoring efforts, and summary reports by scientific panels such as the Science Advisory Board Hypoxia Panel. As one of many tools available, the proposed model will provide additional weight of evidence to proposed nutrient management options and provide additional insight into ecological processes affecting hypoxia, but it will not be the sole determining factor in management decision-making. Model results will include estimates of reliability provided by modelers and reviewers that will guide managers in how much weight to place on model results.
A.8 Special Training Needs/Certification/Expertise
Two primary categories of specialized training and certification are envisioned. Typically an environmental engineering degree or environmental science degree with training in systems science is suggested for mathematical modelers. With the Agency’s emphasis on integrated, multimedia, modeling, it is valuable to have a broad background that includes the aquatic sciences (chemistry, biology, and physical processes). A degree in computer sciences is recommended for model programmers and database specialists. In both cases, degrees may be in other primary disciplines that enable each to conduct the respective job skill. In addition, strong backgrounds in mathematical sciences and statistical analyses are typically necessary.
Additional specialized (such as geographical information systems) training will be provided if needed on an individual basis and will be documented by the project leader. The project leader will be responsible for assuring that the modeling staff have the training necessary to complete the project.
All modeling staff (both federal and contracting staff) will be required to have had training in NHEERL/MED’s Quality Assurance program. This QA training course covers the following topics for new hires: QA Orientation, Laboratory Recordkeeping, QA Planning Documents, Operating Procedures and Technical Systems Audits. Every three years, all scientific staff will be required to attend a QA Refresher Course.
A.9 Documents and Records
A PDF copy of the Gulf of Mexico Research and Quality Assurance Project Plan (this document) with all signature approvals will be made available via the Internet. The notification of accessibility of the approved plan will be sent to those individuals and organizations listed in Section A.3 of this plan. Any modifications resulting from an annual review of the plan will also be posted on the designated web site as addendums to the plan.

Gulf of Mexico Hypoxia Modeling RQAPP
September 26, 2012 Revision 1 16
A Study File (project records at the completion of a project) will be prepared by the Principal Investigator at the termination of the project. The Study File will contain all necessary information to substantiate any project findings and will include both paper and electronic records. Any relevant electronic model records not physically contained in the Study File (such as very large model files) will be stored within a model archive located on a local server. An index to the materials in the Study File will be included. The contents of the Study File may change as needed and directed by the Principal Investigator. The Study File contents for the Gulf of Mexico hypoxia modeling project will contain:
Research and Quality Assurance Project Plan
Applicable Operating Procedures related to modeling
Study-related correspondence including Gulf of Mexico modeling meeting minutes between MED-Grosse Ile and Gulf Ecology Division; MED-Grosse Ile and the RTP, NC Environmental Modeling and Visualization Laboratory.
Model archive describing where input and output files are located, source code, and any other files related to running the Gulf models
Electronic media with the field data used in the project will be placed in the study file
Any peer-reviewed journal articles related to the project
Principal model documentation will be provided within the electronic model archive. Documentation of the models will include a description of the model construct (including the governing equations), model calibration and validation runs, model input and output, and “readme” files. Sensitivity and uncertainty analysis results will be archived along with the model computer code (both source and executable files). Internal documentation is also maintained in the header comments of each program subroutine. A summary of field, literature, and external data sources used in the model input, calibration, and validation process will be documented.
A complete description of the model equations, underlying assumptions, and numerical methods can be found in several user manuals including CE-QUAL-ICM (Cerco and Cole, 1995), the LM3-Eutro model (Pauer et al., 2006, 2008, 2011), and the LM3 model manual (Melendez et al., 2009). All functional changes made to the model program will be documented along with the new code within the electronic Revision Control System (RCS) that maintains all versions of modeling code used at LLRS and serves as the model code archive.
Various model products will be prepared throughout the project. These will include interim reports, and at the request of management, oral presentations will also be given periodically. Presentations at scientific meetings will be encouraged on any aspect of Gulf modeling. The Gulf of Mexico modeling project would likely be classified as a QA Category II, or research of high programmatic relevance which, in conjunction with other ongoing or planned studies, is expected to provide complementary support of Agency rule-making, regulatory, or policy decisions (USEPA, 2005). Because of this designation, significant findings from the study must be published in peer-reviewed scientific/engineering journals. If publication does not occur, then a formal review of the project and results will be required through a formal peer panel review process.

Gulf of Mexico Hypoxia Modeling RQAPP
September 26, 2012 Revision 1 17
As a QA Category II project, the retention and disposition of project records must be in accordance with the Agency’s National Records Management Program led by the Office of Environmental Information. Records retention schedule under Function Code 501 (Function Number 316-258) would likely be applicable to the Gulf of Mexico project. These records are first stored at the office that generated them for three years after the files have been closed; then transferred to the National Archives and Records Administration (NARA); Federal Records Center (FRC) for 20 years; and then a final transfer to the National Archives for permanent archive. The MED Technical Information Officer will manage the transfer of the records to the appropriate archival entity. Details can be found at EPA Records Schedules by Function Code established in 2/20/2007 at http://www.epa.gov/records/policy/schedule/function.htm.

Gulf of Mexico Hypoxia Modeling RQAPP
September 26, 2012 Revision 1 18
GROUP B: DATA GENERATION AND ACQUISITION
B.1 Model Formulation
Study Area
The study area is the Northern Gulf of Mexico and the Louisiana Continental Shelf. It extends from the Mississippi Delta west to the Louisiana-Texas border, and from the shoreline seaward to the 60-100 m bathymetric contours (approximately 26oN to 30oN by 88oW to 94oW -- see Figure 3). The average depth of the hypoxic zone is approximately 20 meters. The Mississippi and Atchafalaya Rivers account for almost all of the freshwater entering this part of the Gulf. This area is strongly stratified over the April to October period, largely due to salinity gradients. Approximately 50% of the autochthonous material produced in this area settles to the sediment, resulting in carbon and nutrient rich sediments. A description of the system and causes of the hypoxia in the northern Gulf of Mexico was described in Section A.5. Details can be found elsewhere (Rabalais and Turner, 2001; Rabalais et al., 2002; Dagg et al., 2007)
Modeling Framework
The model design for the Gulf of Mexico is based on the linked sub-model approach as was used in the Lake Michigan Mass Balance Project (Pauer et al., 2006). It consists of a water quality model that includes eutrophication and DO kinetics that is driven by output from a hydrodynamic model and a coupled sediment model. At this time, however, the sediment model has not yet been incorporated into the model. The water quality model receives tributary loading inputs directly and atmospheric nitrogen compound loads from an atmospheric fate and transport model (CMAQ) developed and run by our collaborator, U.S. EPA/ORD/NERL/Atmospheric Modeling Division. A schematic representation of the overall mass balance design is shown in Figure 8.
Hydrodynamic Model
Hydrodynamic models developed and maintained by the Naval Research Laboratory (NRL) in Stennis, Mississippi are being used to describe the hydrodynamics of the Gulf of Mexico for the modeling framework. The screening model and the high resolution model use output from the NRL hydrodynamic model EPACOM (Northern Gulf of Mexico Coastal Ocean Model for EPA) (http://www7320.nrlssc.navy.mil/IASNFS_WWW/EPANFS_WWW/). This model covers the coastal areas of Louisiana, Texas, Mississippi, Alabama, and part of Florida. For purposes of the hypoxia modeling, only output from the study area is being used. The model uses a high resolution grid that has an approximate size of 2 km x 2 km and 34-40 vertical layers, consisting of 26 proportional-depth sigma layers on the shelf and 14 fixed-depth layers beneath the sigma layers in deeper Gulf waters. The intermediate resolution model utilizes EPACOM vertical mixing coefficients that has been aggregated into a 6 km x 6 km horizontal grid. Water temperature and salinity are taken directly from measurements. The high resolution 2 km x 2 km version of the model (if needed) will use the original 2 km x 2 km output from EPACOM.
The main goal of the hydrodynamic model will be to generate three-dimensional fields of currents and temperature in the Gulf. Currents are very important for the transport simulation of state variables, while water temperature is a critical forcing function of algal growth. Other parameters that the hydrodynamics model provides to the water quality model are

Gulf of Mexico Hypoxia Modeling RQAPP
September 26, 2012 Revision 1 19
hydrodynamic vertical diffusion coefficients and salinity and sea surface heights. Cell volumes are calculated using the sea surface heights, undisturbed water depths, and the sigma layer percentages. Horizontal diffusion coefficients are not archived by the EPACOM model but have been calculated from EPACOM model output. Diffusion coefficients are needed by the transport part of the simulation. Diffusive and advective transport are non-trivial components of the overall movement of particles in the water column. Grid cell volumes are also needed in the transport calculation of the water quality model and in the calculation of state-variable concentrations.
The aforementioned parameters will be calculated by the hydrodynamic model and averaged over an appropriate time span for the selected periods for model calibration, corroboration, and scenarios. The averaging interval used for the intermediate resolution model is one-hour for flows and sea surface elevations and three-hour for temperature and vertical mixing coefficients.
Water Quality Model
The transport algorithm is based on the CE-QUAL-ICM and LM3-Eutro modeling frameworks (Cerco and Cole, 1994; Pauer et al., 2006, 2008, 2011) that were applied in Chesapeake Bay, Lake Michigan, and other systems. This algorithm describes the movement of nutrients, phytoplankton and other constituents in the system.
The one-dimensional Gulf of Mexico hypoxia modeling framework, GoMDOM-1D, is largely based on the three-dimensional Lake Michigan Eutrophication Model “LM3-Eutro” (Pauer et al. 2006, 2008, 2011; Melendez et al., 2009). However, a number of simplifications were made which include a one-dimensional single vertical water column, 6km x 6km scheme, a single phytoplankton state variable, and fewer nutrient state variables. However, the model uses a revised light limitation formulation and simulates dissolved oxygen in the system. GoMDOM-1D uses site-specific measurements and empirical relationships to determine nutrient and oxygen demand sediment fluxes.
The one-dimensional approach is based on the assumption that horizontal advective flows and diffusion across the boundaries of the column are negligible during the time scale of model simulation (~100 hours), and thus the model is defined as an isolated, layered batch reactor. This isolation allows for the parameterization of kinetic and vertical processes in the Gulf of Mexico exclusive of the effects of horizontal transport. Defining process kinetics through GoMDOM-1D assists in the calibration of the three-dimensional model, GoMDOM-3D model, which is being developed concurrently with this work.
For the 3-D intermediate resolution GoMDOM model, the study area has a grid structure of 6 km x 6 km horizontal segments and 26 vertical sigma levels. For the intermediate resolution model, thickness, and thus volumes, of individual cells will vary significantly from relatively small cells in the nearshore regions to much larger cells in the deeper areas of the Gulf. The hydrodynamic transport and eutrophication kinetic equations will be incorporated into this high resolution grid. The transport is based on the integrated compartment method or box model methodology which is a loose extension of the WASP model (Ambrose et al., 1993). The box model concept will be retained in order to allow the coupling, via map files, of the eutrophication/DO model with hydrodynamic models of different dimensions and degrees of complexity. The transport will be performed as a one-dimensional exchange between two adjacent cells through an individual cell face, irrespective of the dimensionality of the model. The model will handle horizontal and vertical transport during separate operations. The constituent transport equation can be written
as follows:

Gulf of Mexico Hypoxia Modeling RQAPP
September 26, 2012 Revision 1 20
( ) ( ) 0x z
F UF WF F FD D
t x z x x z z (B.1)
F = constituent concentration (mass volume-1) U = horizontal cell face velocities (length time-1) W = vertical cell face velocities(length time-1) Dx = horizontal cell face hydrodynamic diffusion coefficient (area time-1) Dz = vertical cell face hydrodynamic diffusion coefficient (area time-1) x = horizontal dimension z = vertical dimension This transport equation is solved using the third-order accurate Non-Uniform Grid ULTIMATE QUICKEST algorithm (Leonard, 1991; Chapman et al., 1997) in the horizontal and second-order implicit Crank-Nicholson scheme in the vertical. A detailed discussion can be found elsewhere (Melendez et al., 2009).
Like the 1-D GoMDOM model, the kinetic equations for the 3-D GoMDOM are based on the LM3-Eutro modeling framework (Pauer et al., 2006, 2008, 2011; Melendez et al., 2009). A schematic diagram of the state variables and transformation reactions is shown in Figure 8. General equations for phytoplankton (chlorophyll-a) and dissolved oxygen are shown below. Detailed equations of the other variables and transformation equations can be found in Appendix 1 (equations which were not described in LM3-Eutro) and elsewhere (Pauer et al., 2006, 2008, 2011; Melendez et al., 2009).
General phytoplankton equation
The kinetic change in phytoplankton concentration can be written as:
g d gz
dPV V k k P Vk Z
dt (B.2)
where
V = volume P = phytoplankton concentration (mass volume-1) t = time kg = phytoplankton growth rate constant (time-1) kd = phytoplankton mortality/respiration rate constant (time-1) kgz = predation rate (time-1) Z = zooplankton concentration (mass volume-1) The growth rate can be written as:
g gmaxk =k f N f T f I (B.3)
where
kgmax = optimum growth rate constant (time-1)

Gulf of Mexico Hypoxia Modeling RQAPP
September 26, 2012 Revision 1 21
f(N) = nutrient growth dependency f(I) = light growth dependency f(T) = temperature growth dependency General DO equations
The general dissolved oxygen equation, often expressed as the Enhanced Streeter-Phelps equation, can be expressed as follows:
d[DO]V = Reaeration - Carbon oxidation - Nitrification
dt
- Respiration + Photosynthesis - SOD
(B.4)
where
V = volume [DO] = dissolved oxygen concentration (mass volume-1) t = time Reaeration = oxygen exchange across the air-water interface (mass oxygen time-1) Carbon oxidation = oxygen consumed due to organic carbon oxidation (mass oxygen time-1) Nitrification = oxygen consumed due to ammonia oxidation (mass oxygen time-1) Respiration = oxygen consumed due to algal respiration (mass oxygen time-1) Photosynthesis = oxygen produced due to algal photosynthesis (mass oxygen time-1) SOD = oxygen consumed due to sediment processes (mass oxygen time-1) Detailed oxygen equations can be found in Appendix 1. Sediment Diagenesis Model
It is well known that the sediment is a major oxygen sink and an important contributor to the problem of summer hypoxia in the Gulf of Mexico. Algae and detrital material settle to the sediment bed and subsequent diagenesis of organic material occurs. This diagenesis process results in nutrient and reduced carbon (oxygen demand) fluxes from the sediment to the water column. A good understanding of sediment processes and formulation of a predictive sediment diagenesis model is necessary to describe and predict nutrient fluxes and oxygen consuming processes. Initially, nutrient and oxygen fluxes between the water column and sediment will be described in the model using user-defined fluxes or as empirically-derived relationships based on recent studies performed in the northern Gulf of Mexico (Murrell and Lehrter, 2011; Lehrter et al, 2012). The empirical equation below (Murrell and Lehrter, 2011) represents the sediment oxygen demand (consumption). It calculates the amount of dissolved oxygen per unit time per unit area (kg O2/m
2/s) that gets consumed or removed from the bottom layer of the water column by the sediments.
6 100.094 10 / 32 1.35 3.7 10DOSOD C
(B.4)
where

Gulf of Mexico Hypoxia Modeling RQAPP
September 26, 2012 Revision 1 22
SOD = sediment oxygen demand (kg O2/m2/s)
CDO = dissolved oxygen concentration of water column bottom layer (kg/m3)
A sediment diagenesis model will be developed when field data and process studies are sufficient to support it. Figure 9 illustrates the sediment diagenesis model. The diagenesis model will be based on the sediment model developed for and applied to Chesapeake Bay (Di Toro and Fitzpatrick, 1993) and will be incorporated into the water quality model with the detrital particles settling out of the water column onto the sediments. The sediments are represented as two layers. The upper layer is in contact with the water and may be oxic or anoxic depending on dissolved oxygen concentration in the overlaying water. The lower layer is permanently anoxic. The depth of the upper layer is variable while the depth of the lower layer is fixed. A general mass balance equation for the two layers can be written as follows:
1 L12 2
2 2 L12 2
dc(1)H J K c(2) c(1) c(1)
dt
dc(2)H c(1) K c(1) c(2) c(2)
dt
(B.5)
where
H1 = depth of surface layer (length) H2 = depth of bottom layer (length) c(1) = concentration in surface layer (mass volume-1) c(2) = concentration in bottom layer (mass volume-1) t = time J = flux (mass area-1 time-1) KL12 = mass transfer coefficient between layers (length time-1) ω2 = sedimentation velocity (length time-1) Detailed equations can be found in Appendix 1. Because the sediment model is a coupled model (incorporated into the water quality model), it will be updated at the same time as the water quality model. Although it can be difficult to obtain accurate values for sediment model parameters, the full sediment diagenesis model has a major advantage over using user-defined sediment fluxes for predictive capability.
Atmospheric Model
The atmospheric component of nitrogen load to the surface water of the Gulf is generally estimated at 2% of the total nitrogen load to the Gulf. CMAQ (Community Multi-scale Air Quality model), or Models3/CMAQ (http://www.epa.gov/asmdnerl/CMAQ/cmaq_model.html), will provide MED with atmospheric fluxes to the surface water segments of GoMDOM of both reduced and oxidized nitrogen compounds. CMAQ and GoMDOM are run independently of each other. Fluxes will be provided for both wet and dry (gaseous and particulate) deposition. The CMAQ grid will be overlaid onto the GoMDOM grid. GIS tools will be used by the MED staff to estimate a surface area-weighted flux to all surface water cells of GoMDOM to yield a load

Gulf of Mexico Hypoxia Modeling RQAPP
September 26, 2012 Revision 1 23
(mass/time). The aggregation of CMAQ fluxes into loads for GoMDOM is not expected to be a major effort for the MED staff. CMAQ does not make estimates of atmospheric phosphorus loads.
CMAQ is a grid-based chemical transport model (fixed, regular grid) that can be nested from a continental/sub-continental scale (at 36-km and 32-km grids) down to finer scales over multi-state geographic regions. Nitrogen deposition will be input from a 12 x 12 km grid for the purposes of this project. It is driven by a mesoscale meteorological model (a weather model), currently MM5 from Penn State/NCAR (National Center for Atmospheric Research). Precipitation volumes are adjusted by the Parameter-elevation Regressions on Independent Slopes Model (PRISM). CMAQ also incorporates the effects of lightning on the generation of nitrates. CMAQ is not a calibrated model, per se, but tries to work as much as possible from basic scientific theories. It outputs on an hourly time-step and requires significant computer resources to run.
CMAQ computes the gas- and particle-phase concentrations of the inorganic N nutrients of ammonia (reduced nitrogen) and nitric acid (oxidized nitrogen). In the eastern U.S., a majority of oxidized-N air concentration is gaseous nitric acid, and a majority of reduced-N air concentration is particulate ammonium. An aqueous chemistry and cloud module is used to derive rainwater nutrient and pollutant concentrations for the computation of wet deposition, given the precipitation predictions from PRISM. Dry deposition algorithms are parameterized for different land use categories for the gases and particles to determine the dry deposition rates by grid cell.
B.2 Model Coding
The water quality model is written using FORTRAN 90/95 programming language. This programming language is suitable for models that require very intensive numerical computations, such as the GoMDOM models. FORTRAN 90/95 has all the features that are important to scientific programming and most of the features of an object oriented language. The language is designed to generate executable codes that are highly optimized and, thus, run extremely fast. FORTRAN 90/95 also supports parallel programming, making it an ideal language for implementation of the water quality model on parallel computers if the hardware is available.
The 3-D GoMDOM models are being run on high-end Linux-based computers. These computers are relatively inexpensive and easy to maintain and update. The Linux operating system offers the advantages of low cost, high stability, high performance, easy networking, multitasking, compatibility with UNIX software packages, and high security.
The model source code will use external libraries which will be needed to handle input and output tasks in addition to what FORTRAN 90/95 provides. The application will be reading large sets of input data and at the same time writing a large amount of model calculations to output; thus the use of a library to store and document the data in binary format will be required. The library chosen to handle those tasks is known as the Network Common Data Form (NetCDF). This library, in addition to using a binary format, allows the modeler to create, access, and share array-oriented data in a form that is self-describing and portable. Self-describing means that a dataset includes information defining the data it contains. Portable means that the data in a dataset is represented in a form that can be accessed by computers with different ways of storing integers, characters, and floating-point numbers. NetCDF will be implemented within the water quality model by using a Fortran interface. This interface consists of a number of routine

Gulf of Mexico Hypoxia Modeling RQAPP
September 26, 2012 Revision 1 24
calls that will be made within the program to the NetCDF library. The library will be linked to the water quality model at compilation time.
Libraries will also be needed to handle reporting messages that convey some kind of information, warnings, and/or errors that might occur during the execution of the source code. Reporting messages are important when performing simulations because they can let the modeler know if the model is running smoothly or if bugs are present in the source code.
The systematic development of a model requires the use of a source code revision tracking system. Thus the model will be archived and source code changes will be tracked using the source-control system known as Revision Control System (RCS). RCS offers the ability to record source code file revisions, retrieve previous file revisions, control new revision creation, record description of changes made to a revision, control who can make source code modifications, and specify user-access to source code files. RCS uses a separate archive file to hold all the revisions of a given source file. Each revision of a file that is put into an archive file is assigned a revision number. The archive files will be stored and maintained under the computer account of the person in charge of managing RCS.
Input and output files related to the model will be archived under a designated directory in the Linux system. Depending on the size of a given file, it will be stored in binary or ASCII format. Large input and output files are better stored using a binary format to save disk space which calls for the use of a library such as CDF or NetCDF.
B.3 Model Inputs
Parameter estimation
The Eutrophication/DO and sediment diagenesis sub-models consist of many biochemical transformation reactions which require estimates for a large number of model parameters. For this study, a number of coefficients will be obtained from Gulf of Mexico in-situ and laboratory measurements, including phytoplankton growth parameters based on primary production measurements and SOD coefficients based on laboratory studies. However, the majority of the model parameters (similar to most other eutrophication/DO studies) will be based on values from similar modeling studies and measurements reported in the literature. Several of these model coefficients will be adjusted during the model calibration process (see Model Calibration and Corroboration section) in order to obtain a final value. Adjusting of model coefficients will be done within a reasonable range of reported literature values. Model parameter uncertainty is discussed in Section B.6.
Initial conditions
Initial conditions for a number of variables (Table 2) in the water column and sediments are required for the model. These include values for dissolved oxygen, dissolved and particulate nutrient species, phytoplankton and zooplankton densities, organic carbon, and salinity in the water column. Initial values for the sediment diagenesis variables include organic carbon and nutrients. Data from the first and perhaps second field surveys of a specific year of interest will provide the majority of the values for initial conditions for the model. However, it is possible that values for some of the initial conditions cannot be calculated (directly or indirectly) from the field surveys. In these cases, values will be determined using peer-reviewed literature, technical reports, similar modeling studies, or unpublished databases. Data from peer-reviewed journals have been subjected to a certain amount of review, but these data will be examined by the

Gulf of Mexico Hypoxia Modeling RQAPP
September 26, 2012 Revision 1 25
modelers for QA. Unpublished data from reliable sources will be examined thoroughly and analyzed with respect to QA. Section A.7 details QA procedures for data obtained from outside USEPA.
Loadings
Nutrient loadings from atmospheric and tributary sources are essential to the calibration of the Gulf of Mexico model. Current loading estimates are also important when performing load reduction scenarios to meet management objectives. Atmospheric nutrient loadings are being provided by the atmospheric model (CMAQ) as was described in Section B.1. The USGS calculates monthly nutrient loads in the Mississippi River from water quality data collected near St. Francisville, LA and from flow data from Tarbert Landing, MS. Monthly loads for the Atchafalaya River are calculated based upon water quality data from Melville, LA and flow data from Simmesport, LA. Loads for nitrite plus nitrate and silica for the mainstem Mississippi River extend as far back as October 1967. From October 1981 to September 2007 monthly load values for both rivers are available for nitrite plus nitrate, total Kjeldahl nitrogen (organic nitrogen plus ammonia), ammonia, total phosphorus, ortho phosphorus, and silica (Aulenbach et al., 2007; recent loads at: http://toxics.usgs.gov/hypoxia/mississippi/flux_ests/delivery/index.html). In addition to monthly loads, nitrite plus nitrate and ortho phosphorus daily concentration and flux values are available for the Mississippi River at Baton Rouge, LA and nitrite plus nitrate daily concentration and flux values are available for the Atchafalaya River at Morgan City (USGS, 2006). Water quality concentrations and flows from the USGS (USGS, 2006; http://waterdata.usgs.gov/nwis/) are used to calculate loads for parameters not provided by the USGS and for smaller tributaries that are not included in the USGS loading estimates.
Other forcing function estimations
Water temperature and advective and vertical dispersive flows are obtained from the output from the hydrodynamics models as described in Section B.1. The NRL also provided solar radiation and wind velocity data that were used in EPACOM. Horizontal dispersive flows are calculated in-house using data from EPACOM and algorithms provided by EMVL. Flows from the Mississippi and Atchafalaya Rivers will be obtained from the US Geological Survey upstream stations (USGS, 2006). The study area modeled has a large boundary with Gulf of Mexico open waters and is strongly affected by movement across this boundary. Boundary concentrations are estimated from a number of cruise measurements made at stations adjacent to the study area, while exchanges are determined from the hydrodynamics model.
Field data
Accurate and reliable field data (Table 2) are essential for model development, estimation of model coefficients, and model confirmation. In support of this project and the modeling study, sampling was undertaken by the USEPA Gulf Ecology Division. Multiple sampling cruises were conducted during several years from 2003 to 2007. The Gulf was sampled for dissolved inorganic nitrite plus nitrate, dissolved ammonium, particulate nitrogen, total dissolved nitrogen, total nitrogen, physical parameters, biological parameters, and other chemical parameters.
Other field data have been collected by researchers associated with the Louisiana Universities Marine Consortium (LUMCON) and Gulf Coast research institutions and universities which have been sampling the Gulf of Mexico for many years. Data from the Gulf of Mexico Hypoxia Monitoring Survey QAPP (Greene, 2003; Greene, 2007) will be subject to the QA procedures specified in those documents. Data received from other reliable sources will be subject to QA

Gulf of Mexico Hypoxia Modeling RQAPP
September 26, 2012 Revision 1 26
procedures similar to those required for the Monitoring Survey. Details of QA can be found in Section A.7.
B.4 Model Confirmation
Model confirmation is the process of reviewing the physical aspects of the model to ensure they match the proposed processes. Model confirmation includes reviewing the model equations for appropriateness to the physical, chemical, and biological attributes of the system under study and for conformity to established theory; reviewing model computer code to verify that model equations have been accurately implemented; and testing of completed individual code modules for functionality.
A mathematical model consists of differential equations representing physical, chemical, or biological processes in the system of interest. When a model is selected or designed for a natural system, the proposed equations should be reviewed to make sure they appropriately represent the system. The proposed model for this project is based upon models using accepted formulations for eutrophication kinetics that have been successfully applied to simulate eutrophication in estuarine (Cerco and Cole, 1994), saltwater (Hall and Dortch, 1994), and freshwater systems (Pauer et al., 2006). Scientific studies from the Gulf of Mexico Louisiana-Texas shelf area will be reviewed to confirm that the proposed chemical and biological kinetics are appropriate for describing processes in this region. If new equations are required to describe processes not presently included in this model, they will be developed based upon peer-reviewed scientific studies. The model construction, including the equations, will also undergo an informal internal and external peer review process by scientific experts with experience in the Gulf of Mexico to confirm its appropriateness for this project. Further peer review is obtained during the publication process in a peer reviewed scientific/engineering journal.
The Gulf of Mexico hypoxia model will be based upon the LM3-Eutro model, which has undergone extensive testing, code review, and formal peer review (Pauer et al., 2006; Melendez et al., 2009). This original code will not require further review.
New equations or changes to existing model code will undergo a rigorous review process. The programmer responsible for translating model equations into code will provide an initial review. The originating personnel providing the initial equations will also conduct a review of the code to confirm that proposed equations or changes have been correctly implemented. Finally, model code will be available for review during any peer review process. All changes to model code will be documented and tracked through the RCS system (see Section B.8).
Any revised or new code will be tested to ensure it correctly calculates the embedded equations. The output of any module that is revised or newly added will be tested before including the module in the overall computer model. Output will be compared to hand-calculated and/or spreadsheet derived analytic solutions and to results from previous versions. Sensitivity analyses will be used to confirm that the module is calculating correctly.
The revised model will be tested to ensure that fundamental operations, such as continuity and mass conservation, are verified. Tests will include checking of numerical stability and convergence properties of model code algorithms, if appropriate. Model results will be checked by comparing results to those obtained by other models and by comparison to manual calculations. Visualization of model results and statistical correlations to field data will assist in determining whether model simulations are realistic.

Gulf of Mexico Hypoxia Modeling RQAPP
September 26, 2012 Revision 1 27
B.5 Model Calibration and Corroboration
Calibration is “the process of adjusting model parameters within physically defensible ranges until the resulting predictions give the best possible fit to observed data” (USEPA, 2009). The model calibration will be accepted when the model simulates the majority of the cruise data within the 95% confidence intervals (+/- two standard errors) for important measures of constituents such as minimum dissolved oxygen concentrations, area and duration of hypoxia, and concentrations of nutrients and phytoplankton. It is expected that the model fit to data will be better than this criteria in many instances. For important constituents, the calibrated model should also have a significant correlation at the 95% confidence level to field data stratified appropriately in time and space.
Calibration of the proposed Gulf of Mexico hypoxia model will be conducted following a systematic procedure. Initial parameterization will be accomplished as described in Section B.3. Model parameters will be individually adjusted to determine the sensitivity of the model simulation results to each parameter. Parameters will only be adjusted within ranges obtained through project studies or published in the literature. Model calibration will start with the most conservative constituents and proceed through constituents that depend on previously calibrated constituents. Calibration efforts will focus on parameters with the largest uncertainty and upon which model results have the largest sensitivity. The model will be calibrated against a one-year data set from the 2003 to 2007 monitoring program data collected by EPA’s Office of Research and Development Gulf Breeze laboratory. Methods of calculating or estimating loadings or other forcing functions may be refined, if necessary, but no calibration of forcing functions will be allowed. The calibration will proceed until an optimal fit to data is achieved for all important constituents. Goodness-of-fit will be assessed by qualitative comparison of model results to data plots as well as by the quantitative statistical tests described in the preceding paragraph.
There is an attempt within this document to help managers determine the degree to which the models will be calibrated to field data. This constitutes the project acceptance criteria and reflects what can practically be done with the resource commitments. The criteria for accepting the modeling results lies in the ability to simulate measured concentrations of materials in water, sediment, and biota during the field collection period. If this is done within the statistical range required, then the model(s) can be used to extrapolate these concentrations in space and time.
Model corroboration, also called validation, includes the “quantitative and qualitative methods for evaluating the degree to which a model corresponds to reality” (USEPA, 2009). The calibrated model will be considered corroborated if model results for important constituents, generated using a second independent set of inputs, fall within the 95% confidence intervals of most of the data cruise means from the second data set. Corroboration will focus on important measures of constituents such as minimum dissolved oxygen concentrations, area and duration of hypoxia, nutrient concentrations, and phytoplankton concentrations.
For corroborating the model, the calibrated model will be compared against one year of data from the 2003-2007 GED monitoring program independent of the calibration data set. Initial conditions and external loadings will be obtained from the same independent data set. The model will be run using these inputs, and model results will be compared against data means and confidence intervals. The data from the calibration and corroboration years will be compared to available long-term data sets to determine if these years were representative of typical conditions. Goodness-of-fit will be assessed by qualitative comparison of model results to data plots as well as by quantitative statistical tests.

Gulf of Mexico Hypoxia Modeling RQAPP
September 26, 2012 Revision 1 28
B.6 Model Sensitivity/Uncertainty Analysis
The sensitivity of the model to individual model parameters will be evaluated informally as part of model calibration. Parameters will be adjusted one at a time and model results reviewed to determine the sensitivity of the model to the adjustment. Model calibration will focus on the most sensitive and uncertain parameter values.
After the model is calibrated and corroborated, a more formal sensitivity analysis will be conducted. Individual parameters will be varied by a specified percentage as a measure of the sensitivity of the model to each parameter and the change in model results recorded. Parameterization error can be a significant source of model prediction uncertainty. Statistical measures of uncertainty in the input data will be reviewed. This review will not only include data used for model initialization, calibration, and corroboration but also the uncertainty in tributary and atmospheric loading estimates and in the hydrodynamic predictions.
To evaluate and quantify the effects of parameterization error, uncertainty analysis will be performed for selected model simulations. A statistical procedure to estimate uncertainty, such as the parameter variance-covariance estimation procedure of Di Toro and Parkerton (1993), and/or Bayesian Monte Carlo, propagation of error, and other statistical techniques will be applied to estimate data, parameter, and model error components.
The uncertainty in forecast predictions is higher than in simulations of present conditions due to the higher uncertainty in predicted inputs. For forecast predictions, the model will be run with inputs, boundary conditions, and process rates bracketed in terms of extreme expectations and probability distributions. The results will be provided in terms of prediction means and exceedance limits.
Model results will also be qualified according to any explicit and implied assumptions made in developing or applying the model. Managers will have to decide whether or not to use the model results and whether or not to conduct additional research to improve the models. The modelers can advise management on areas of input that have high uncertainty and to which the model is very sensitive to. Of course, cost will also be taken into consideration. This is a continuing process.
B.7 Model Application
After the model is calibrated and corroborated, it will be applied to assist in answering management questions and to provide insight into physical, biological, and chemical processes affecting hypoxia in the Gulf of Mexico. The model will be run using inputs developed according to selected nutrient loading scenarios. Management questions will include running the model to review the reduction in nutrient loads required to reduce the area of hypoxia to 5000 km2, a goal specified in the 2001 Hypoxia Action Plan (Mississippi River/Gulf of Mexico Watershed Nutrient Task Force, 2001). Subsequent scientific reviews have suggested that phosphorus reductions may also be necessary to reduce the area of hypoxia, and additional loading scenarios may be run to determine the model response to varying loads of both phosphorus and nitrogen. Additional scenarios may be specified by project managers or peer review members during the project. The model is not designed to make predictions on the effects of intensive, short duration events, such as a hurricane.
Model output will be presented both graphically and in tabular form. The area and duration of hypoxia will be important measures as well as nutrient and phytoplankton concentrations.

Gulf of Mexico Hypoxia Modeling RQAPP
September 26, 2012 Revision 1 29
Scenario results will include comparisons to base line, target, and other scenarios. An animation tool will be developed to present time series results of model scenarios for the area of interest.
B.8 Data Management
All records, including modelers’ electronic files, will be maintained according to Agency standards as defined by the USEPA Office of Information Resources Management Federal Information Processing Standards (FIPS). Paper notebooks will be issued to modelers that meet ORD paper notebook guidelines. Notes in these books are of secondary importance to documentation that will exist in electronic form. Minimum requirements for documenting and maintaining ORD paper notebooks are covered in Chapter 13.2 – Paper Laboratory Records (12/01/2006) of the ORD Policies and Procedures Manual at: http://dcordhqapps1.epa.gov:9876/orma/policies.nsf/webPolicy?OpenView. Many of the records associated with the project will be in the form of electronic mail (email). Email and electronic records that are subject to both the Federal Records Act (FRA) and the Freedom of Information Act (FOIA) will be preserved within EPA’s Enterprise Content Management System (ECMS). ECMS is a NARA – approved electronic recordkeeping system. These laboratory notebooks and electronic files will be maintained by each modeler and turned over to the Principal Investigator upon completion of the project. Similarly, electronic files containing documentation of model testing, calibration, and validation will be maintained by each modeler and transferred to a central project archive as designated by the Principal Investigator.
The primary water quality and process studies data used to support modeling activities will be obtained from the GED Gulf of Mexico Hypoxia Study which has been subjected to an EPA QA process. Secondary data from other studies, published and unpublished sources; other data of opportunity; and equations, kinetics, process rates, and coefficients routinely used in modeling applications can vary in their extent of QA examinations. All data, to the extent possible, will undergo review as specified in Section A.7. A database tracking system has been instituted by the LLRFRB (Large Lakes and Rivers Forecasting Research Branch), Grosse Ile for modeling systems. This database system will be used to provide data entry, storage, access, and analysis capabilities to meet the needs of the modelers and other potential users of Gulf of Mexico data. The system employs a single contact person for data being received. The contact person logs in routine information about the data and coordinates its use. The process provides updated versions if changes occur within the database. The second component of tracking involves versions which have been assessed and completed for modeling purposes. Currently, this position is provided through the Computer Sciences Corporation contract.
Development and production of software code is maintained at the LLFRB in the Revision Control System (RCS). RCS forces strict revision control, supports check-out, locking, and check-in of individual program files for development, and maintains a history and documentation on all changes made to each program file. RCS allows the user to recover specific versions of files so that they can be tested and re-used in the model. Documentation associated with modifications made to files is stored in RCS and within the program file itself. This documentation helps the user/modeler recall or understand why changes were made to files over the course of the source code development. In order to facilitate code maintenance and readability, standard programming style and code documentation will be followed (Melendez and Griesmer, 2002; also see Section B.2).
An Operating Procedure will be made available to modelers of the project that will outline types of model-related files that will be archived at the end of the project. At a minimum, sample input

Gulf of Mexico Hypoxia Modeling RQAPP
September 26, 2012 Revision 1 30
and output files, key calibration and final runs, model source code, compiled source code with compiler identified, and any principal pre- and post-processing programs that were used to support the models will be archived. Readme files will be included to describe any critical information on running the model. The guiding principle in model archiving is to save whatever is necessary to recreate the supportive files and model runs that have been selected. For extremely large output files, saving only the first part of the run and last part of the run would be permissible in order to conserve disk space. This would be explained in an accompanying readme file. The directory structure for the model archive should be hierarchical with meaningful names given to folders. A contiguous archival directory should be used for all of the models applied to the project by a given organization. Please refer to Rygwelski (2005) for a draft operating procedure for archiving models.

Gulf of Mexico Hypoxia Modeling RQAPP
September 26, 2012 Revision 1 31
GROUP C: ASSESSMENT AND OVERSIGHT
C.1 Assessments and Response Actions
There will be internal and external assessment of the model throughout development, including the evaluation stage. Assessments will be conducted internally during the project by the modeling team and project management staff. Review of model structures and implementation are described in Section B.4. Reviews will be documented in project notebooks and internal memoranda with responses documented accordingly. Project activities will also be reviewed and assessed during bi-weekly meetings of the modeling staff, with assessments and responses recorded in meeting minutes.
The external review will be conducted through a continuing informal review process. Review by one’s peers is an essential component to any successful and credible scientific/modeling endeavor. Model development and application is a very complex process with many important issues with multiple approaches available to address them. The external reviews provide an objective means to arrive at a scientific consensus as well as provide judgment on scientific credibility. Reviewers will include staff from the ORD/NHEERL Gulf Ecology Division and the Office of Environmental Information, Environmental Modeling and Visualization Laboratory. Assessments will be performed on the model structure and code (including the numerical schemes used), estimations of model coefficients and forcing functions, test runs on other computer systems, and reasonableness of model results.
External assessments will also include submission of articles to peer-reviewed scientific/engineering journals. Because this project is likely to be assigned a QA Category Level II status, publication in journals is a requirement. Otherwise, a formal external peer review is required.
C.2 Reports to Management
The Principal Investigator will meet periodically with the modeling team and provide periodic email and verbal communication to EPA management on model progress, questions, and changes to the original modeling plan.

Gulf of Mexico Hypoxia Modeling RQAPP
September 26, 2012 Revision 1 32
GROUP D: VALIDATION AND USABILITY
D.1 Model Review
The mathematical model will be evaluated to determine how well the model meets the specified data objectives and acceptance criteria (see Section A.7). These criteria include framework evaluation, code verification, numerical methods accuracy, validation of input data, calibration and corroboration results, and appropriateness of model scenario results. This section contains a summary of the criteria that will be used for checking and accepting data and model output.
The theoretical and mathematical basis of model processes developed as part of this project must be consistent with established scientific theories and modeling practices. Any new model code must accurately describe the theoretical processes and be free from typographical errors. New code must be consistent with the numerical solution technique and not cause significant numerical dispersion or rounding errors.
Project-generated data used for the model inputs or for comparison to model output must have passed the monitoring QAPP and an additional modeler review. Data from external sources should preferentially have undergone a quality assurance process and will also be required to pass a review by project modelers.
The model will be considered calibrated and corroborated when the model results are within the 95% confidence intervals of the majority of the data cruise means for important measures of constituents for the respective data sets. For important constituents, the calibrated model should also have a significant correlation at the 95% confidence level to field data, stratified appropriately in time and space. Important measures of constituents include minimum dissolved oxygen concentrations, area and duration of hypoxia, and concentrations of nutrients and phytoplankton.
The model will be applied to selected loading scenarios to evaluate the effects of load on the extent and duration of hypoxia in the Gulf and the effects of reducing both nitrogen and phosphorus. There is no comparative data set for these model runs because the input data are hypothetical predictions. However, to be considered valid, all model scenarios and results must be approved by expert elicitation provided by the project peer review process.
D.2 Verification and Validation Methods
This section summarizes the methods that will be used to assess and verify that criteria summarized in D.1 are met. Full descriptions of these procedures are contained in Section B.
The Gulf of Mexico hypoxia model will be based upon existing models. The majority of theoretical basis, process formulation, numerical solution technique, and model code have been previously verified, passed a formal peer panel review process, and published in peer-reviewed scientific journals. These portions of the model will not require additional review. Any new processes added to the model will be based upon established scientific studies and must pass a peer review process. New model code will be documented, verified, and checked for numerical accuracy as described in Section B.2 Model Coding and Section B.4 Model Confirmation.
Gulf of Mexico Hypoxia Modeling RQAPP
September 26, 2012 Revision 1 33
Project-generated data will only be used after it has passed the monitoring QAPP acceptance criteria (Greene, 2003, 2007) and an additional review of suitability for modeling by the project modeling team. Data from other sources will preferentially be taken from sources that have followed a QA-QC process or have undergone peer review. These data will undergo an additional review by the project modeling team. Additional details of the data review and acceptance procedure is included in Section A.7 Quality Objectives and Criteria for Measurement Data and Section B.8 Data Management
The model will be calibrated and corroborated following the procedures listed in Section B.5 Model Calibration and Corroboration. The calibration and corroboration will be considered acceptable when criteria listed in Sections D.1and A.7 are met. Standard statistical tests will be applied to compare model output with appropriately averaged field data to determine if the criteria have been met.
Applying the model to run forecast scenarios is described in Section A.7 Quality Objectives and Criteria for Measurement Data and in Section B.7 Model Application. Scenarios will include those suggested by the management team to help evaluate restoration goals for the Mississippi River/Atchafalaya River/Gulf of Mexico system. Because the scenarios involve predicted inputs, there will not be field data for comparison to outputs. Inputs will be bracketed by developing through expert elicitation likely minimum and maximum loads, and the results will be reviewed through the peer review process to ensure the reasonableness of predicted outputs.
D.3 Reconciliation with User Requirements
The accuracy and reliability of models were quantified in Sections A.7 (Quality Objectives and Criteria for Measurement Data), B.5 (Model Calibration and Corroboration) and B.6 (Model Sensitivity/Uncertainty Analysis). The specific Data Quality Objective for this study was to develop a modeling suite capable of simulating nutrient concentrations in the Gulf of Mexico to within two standard errors of the means of observed concentrations in the water column. These estimates were based on other modeling studies and the reported performance statistics of equivalent modeling frameworks when applied to similar systems. The modeling project leader will meet regularly with the users and managers to communicate the status of model development including the model accuracy. The project leader will also inform the users how changes in model accuracy will impact the application and interpretation of the model results when performing load reduction scenarios.

Gulf of Mexico Hypoxia Modeling RQAPP
September 26, 2012 Revision 1 34
REFERENCES
Ambrose, R.B., Jr., J.L. Martin, and T.A. Wool. 1993. WASP4, a Hydrodynamic and Water Quality Model - Model Theory, User’s Manual and Programmer’s Guide. U.S. Environmental Protection Agency, Office of Research and Development, Environmental Research Laboratory, Athens, Georgia. EPA/600/3-87/039, 297 pp.
American Society for Testing and Materials (ASTM). 1992. Standard Practice for Evaluating Mathematical Models for the Environmental Fate of Chemicals. American Society for Testing and Materials, West Conshohocken, Pennsylvania. ASTM Standard E978-92, 8 pp.
Aulenbach, B.T., H.T. Buxton, W.T. Battaglin, and R.H. Coupe. 2007. Streamflow and Nutrient Fluxes of the Mississippi-Atchafalaya River Basin and Sub-basins for the Period of Record through 2005: U.S. Geological Survey Open-File Report 2007-1080 (with updated data at http://toxics.usgs.gov/hypoxia/mississippi/flux_ests/delivery/index.html)
Bierman, V.J., Jr., S.C. Hinz, D. Zhu, W.J. Wiseman, Jr., N.N. Rabalais, and R.E. Turner. 1994. A Preliminary Mass Balance Model of Primary Productivity and Dissolved Oxygen in the Mississippi River Plume/Inner Gulf Shelf Region. Estuaries. 17(4):886-899.
Byun, D.W. and J.K.S. Ching. 1999. Science Algorithms of the EPA Models-3 Community Multi-scale Air Quality (CMAQ) Modeling System. U.S. EPA/600/R-99/030, 611 pp.
Byun, D.W. and K.L. Schere. 2006. Review of the Governing Equations, Computational Algorithms, and other Components of the Models-3 Community Multi-scale Air Quality (CMAQ) Modeling System. Appl. Mech. Rev. 59, 51-77.
Cerco, C. and T. Cole. 1994. Three-Dimensional Eutrophication Model of Chesapeake Bay. U.S. Army Corps of Engineers, U.S. Army Engineer Waterways Experiment Station, Vicksburg, Mississippi. Technical Report EL-94-4, 658 pp.
Cerco, C. and T. Cole. 1995. User’s Guide to the CE-QUAL-ICM Three-Dimensional Eutrophication Model. U.S. Army Corps of Engineers, U.S. Army Engineer Waterways Experiment Station, Vicksburg, Mississippi. Technical Report EL-95-15, 2, 420 pp.
Chapman, R.S., T.M. Cole, and T.K. Gerald. 1997. Development of Hydrodynamic/Water Quality (POM-IPXMT) Linkage for the Lake Michigan Mass Balance Project. U.S. Environmental Protection Agency, Office of Research and Development, National Health and Environmental Effects Research Laboratory, Mid-Continent Ecology Division-Duluth, Large Lakes Research Station, Grosse Ile, Michigan, 51 pp.
Committee on Environment and Natural Resources. 2010. Scientific Assessment of Hypoxia in U.S. Coastal Waters. Interagency Working Group on Harmful Algal Blooms, Hypoxia, and Human Health of the Joint Subcommittee on Ocean Science and Technology, Washington, D.C., 153 pp.
Dagg, M., J. Ammerman, R. Amon, W. Gardner, R. Green and S. Lohrenz. 2007. Review of water column processes influencing hypoxia in the northern Gulf of Mexico. Estuaries and Coasts, 30:735-752.

Gulf of Mexico Hypoxia Modeling RQAPP
September 26, 2012 Revision 1 35
Dennis, R.L., R. Haeuber, T. Blett, J. Cosby, C. Driscoll, J. Sickles, and J.M. Johnston. 2007. Sulfur and Nitrogen Deposition on Ecosystems in the United States. EM: Air and Waste Management Associations Magazine for Environmental Managers. Air and Waste Management Association, Pittsburgh, PA, 12-17.
Dennis, R.L., P. Shave, and R.W. Pinder. 2008. Observable Indicators of the Sensitivity of PM2.5 Nitrate to Emission Reductions, Part II: Sensitivity to Errors in Total Ammonia and Total Nitrate of the CMAQ-Predicted Nonlinear Effect of SO2. Atmos. Environ. 42(6):1287-1300.
Di Toro, D.M., and J. Fitzpatrick. 1993. Chesapeake Bay Sediment Flux Model. U.S. Army Engineer Waterways Experiment Station, Vicksburg, Mississippi. Contract Report Number EL-93-2, 337 pp.
Di Toro, D.M. and T.F. Parkerton. 1993. Uncertainty Analysis of the Green Bay Mass Balance Models – Abstract. Presented at the 36th Conference on Great Lakes Research, International Association for Great Lakes Research, St. Norbert College, DePere, Wisconsin, June 4-10, 1993.
Goolsby, D.A., W.A. Battaglin, G.B. Lawrence, R.S. Artz, B.T. Aulenback, R.P. Hooper, D.R. Keeney, and G.J. Stensland. 1999. Flux and Sources of Nutrients in the Mississippi-Atchafalaya River Basin. Topic 3: Report for the Integrated Assessment on Hypoxia in the Gulf of Mexico. U.S. Department of Commerce, National Oceanic and Atmospheric Administration, Coastal Ocean Program, Silver Springs, Maryland. NOAA Coastal Ocean Program Decision Analysis Series Number 17, 130 pp.
Greene, R.M. 2003. Gulf of Mexico Hypoxia Monitoring Survey 2003-2005 Quality Assurance Project Plan. U.S. Environmental Protection Agency, Office of Research and Development, National Health and Environmental Effects Research Laboratory, Gulf Ecology Division, Gulf Breeze, Florida.
Greene, R.M. 2007. Gulf of Mexico Hypoxia Quality Assurance Project Plan 2007-2010. U.S. Environmental Protection Agency, Office of Research and Development, National Health and Environmental Effects Research Laboratory, Gulf Ecology Division, Gulf Breeze, Florida.
Greene, R., J. Lehrter, and J. Hagy. 2009. Multiple regression models for hindcasting and forecasting midsummer hypoxia in the Gulf of Mexico. Ecol. Appl. 19:1161-1175.
Hall, R.W. and M.S. Dortch. 1994. New York Bight Study; Report 2; Development and Application of a Eutrophication/General Water Quality Model. U.S. Army Engineer Waterways Experiment Station, Vicksburg, Mississippi. Technical Report CERC-94-4, 308 pp.
Hetland, R.D. and S.F. DeMarco. 2007. How Does the Character of Oxygen Demand Control the Structure of Hypoxia on the Texas-Louisiana Continental Shelf. J. Mar. Systems. doi:10.1016/j.jarsys. 2007.03.002.
Jassby, A. D., T. Platt. 1976. Mathematical formulation of the relationship between photosynthesis and light for phytoplankton. Limnol. Oceanogr. 21: 540-547

Gulf of Mexico Hypoxia Modeling RQAPP
September 26, 2012 Revision 1 36
Justic, D., N.N. Rabalais, and R.E. Turner. 2003. Simulated Response of the Gulf of Mexico Hypoxia to Variations in Climate and Anthropogenic Nutrient Loading. J. Mar. Systems. 42(3/4):115-126.
Justic, D., V.J. Bierman Jr., D. Scavia, and R.D. Hetland. 2007. Forecasting Gulf’s Hypoxia: The Next 50 Years? Estuar. Coasts. 30(5): 791-801.
Ko, Dong S., R.H. Preller, and P.J. Martin. 2003. An Experimental Real-Time Intra Americas Sea Ocean Nowcast/Forecast System for Coastal Prediction, Proceedings, AMS 5th Conference on Coastal Atmospheric & Oceanic Prediction & Processes. http://www7320.nrlssc.navy.mil/IASNFS_WWW/IASNFS_intro.html
Lehrter, J.C., M.M. Murrell and J.C. Kurtz. 2009. Interactions between Freshwater Input, Light, and Phytoplankton Dynamics on the Louisiana Continental Shelf. Cont. Shelf Res. 29(15):1861-1872.
Lehrter, J. C., R. Devereux, D.L. Beddick, D.F. Yates, and M.C. Murrell. 2012. Sediment-Water Fluxes of Dissolved Inorganic Carbon, O2, Nutrients, and N2 from the Hypoxic Region of the Louisiana Continental Shelf. Biogeochemistry. Springer, New York, NY, 109:233-252.
Leonard, B. 1991. The ULTIMATE Conservative Difference Scheme Applied to Unsteady One-Dimensional Advection. Comp. Methods. Appl. Mechan. Engin. 88(1):17-74.
Martin, P.J. 2000. Description of the Navy Coastal Ocean Model Version 1.0. Ocean Dynamics and Prediction Branch, Oceanography Division, Naval Research Laboratory, Stennis Space Center, MS. NRL/FR/7322-00-9962, 45 pp.
Martin, P.J., C.N. Barron, L.F. Smedstad, T.J. Campbell, A.J. Wallcraft, R.C. Rhodes, C. Rowley, T.L. Townsend, S.N. Carroll. 2009. User’s Manual for the Navy Coastal Ocean Model (NCOM) Version 4.0. Ocean Dynamics and Prediction Branch, Oceanography Division, Naval Research Laboratory, Stennis Space Center, MS. NRL/MR/7320-09-9151, 73 pp.
Melendez, W. and D. Griesmer. 2002. Standard Operating Procedure for EPA-Grosse Ile Programming Style and Documentation Guidelines. U.S. Environmental Protection Agency, Office of Research and Development, National Health and Environmental Effects Research Laboratory, Mid-Continent Ecology Division-Duluth, Large Lakes Research Station, Grosse Ile, Michigan. LLRS-ADP-SOP-002, 6 pp.
Melendez, W., M. Settles, and J. Pauer. 2009. LM3: A High Resolution Lake Michigan Mass Balance Water Quality Model. U.S. Environmental Protection Agency, Office of Research and Development, National Health and Environmental Effects Research Laboratory, Mid-Continent Ecology Division-Duluth, Large Lakes Research Station, Grosse Ile, Michigan. EPA/600/R-09/020, 285 pp.
Mississippi River/Gulf of Mexico Watershed Nutrient Task Force. 2001. Action Plan for Reducing, Mitigating, and Controlling Hypoxia in the Northern Gulf of Mexico. U.S. Environmental Protection Agency, Office of Wetlands, Oceans, and Watersheds, Washington, DC., 36 pp.

Gulf of Mexico Hypoxia Modeling RQAPP
September 26, 2012 Revision 1 37
Mississippi River/Gulf of Mexico Watershed Nutrient Task Force. 2004. A Science Strategy to Support Management Decisions Related to Hypoxia in the Northern Gulf of Mexico and Excess Nutrients in the Mississippi River Basin: prepared by the Monitoring, Modeling, and Research Workgroup of the Mississippi River/Watershed Nutrient Task Force. U.S. Geological Survey Circular 1270, 58 pp.
Mississippi River/Gulf of Mexico Watershed Nutrient Task Force. 2008a. Gulf Hypoxia Action Plan 2008 for Reducing, Mitigating, and Controlling Hypoxia in the Northern Gulf of Mexico. U.S. Environmental Protection Agency, Office of Wetlands, Oceans, and Watersheds, Washington, DC., 61 pp.
Mississippi River/Gulf of Mexico Watershed Nutrient Task Force. 2008b. FY 2008 Operating Plan. A Compilation of Actions to Implement the Gulf Hypoxia Action Plan 2008. U.S. Environmental Protection Agency, Office of Wetlands, Oceans, and Watersheds, Washington, DC., 41 pp.
Mitsch, W.J., J.W. Day, Jr., J.W. Gilliam, P.M. Groffman, D.L. Hey, G.W. Randall, and N. Wang. 1999. Reducing Nutrient Loads, Especially Nitrate-Nitrogen, to Surface Water, Groundwater, and the Gulf of Mexico. Topic 5: Report for the Integrated Assessment on Hypoxia in the Gulf of Mexico. U.S. Department of Commerce, National Oceanic and Atmospheric Administration, Coastal Ocean Program, Silver Springs, Maryland. NOAA Coastal Ocean Program Decision Analysis Series Number 19, 134 pp.
Murrell, M. C. and J.C. Lehrter. 2011. Sediment and Lower Water Column Oxygen Consumption in the Seasonally Hypoxic Region of the Louisiana Continental Shelf. Estuar. Coasts. 34(5):912-924.
Morse, J.W., and P.M. Eldridge. 2007. A Non-steady State Diagenetic Model for Changes in Sediment Biogeochemistry in Response to Seasonally Hypoxic/Anoxic Conditions in the "Dead Zone" of the Louisiana Shelf. Mar. Chem. 106(1-2):239-255.
National Research Council (NRC). 2007. Models in Environmental Regulatory Decision Making. National Research Council of the National Academies, National Academic Press, Washington, D.C., 286 pp.
National Research Council (NRC). 2009. Nutrient Control Actions for Improving Water Quality in the Mississippi River Basin and the Northern Gulf of Mexico. National Research Council of the National Academies, National Academic Press, Washington, D.C., 79 pp.
Pauer, J.J., K.W. Taunt, and W. Melendez. 2006. LM3-Eutro. In: Rossmann, R. (Ed.), Results of the Lake Michigan Mass Balance Study: PCBs Modeling Report, Part 2, pp. 120-182. U.S. Environmental Protection Agency, Office of Research and Development, National Health and Environmental Effects Research Laboratory, Mid-Continent Ecology Division, Large Lakes Research Station, Grosse Ile, Michigan. EPA-600/R-04/167, 579 pp.
Pauer, J.J., A.M. Anstead, W. Melendez, R. Rossmann , K.W. Taunt, and R.G. Kreis, Jr. 2008. The Lake Michigan Eutrophication Model, LM3-Eutro: Model Development and Calibration. Water Environ. Res. 80(9): 853-861

Gulf of Mexico Hypoxia Modeling RQAPP
September 26, 2012 Revision 1 38
Pauer, J.J., A.M. Anstead, W. Melendez, K.W. Taunt, and R.G. Kreis, Jr. 2011. Revisiting the Great Lakes Water Quality Agreement Phosphorus Targets and Predicting the Trophic Status of Lake Michigan. J. Great Lakes Res. 37, pp. 26-32.
Pew Oceans Commission. 2003. America’s Living Oceans – Charting a Course for Sea
Change. A Report to the Nation – Recommendations for a New Ocean Policy. Pew Oceans Commission, Arlington, Virginia.
Pineiro, G., S. Perelman, J.P. Guerschman, and J.M. Paruelo. 2008. How to Evaluate Models: Observed vs. Predicted or Predicted vs. Observed? Ecol. Model. 216: 316-322.
Rabalais, N.N., R.E. Turner, D. Justic, Q. Dortch, and W.J. Wiseman, Jr. 1999. Characterization of Hypoxia. Topic 1: Report for the Integrated Assessment on Hypoxia in the Gulf of Mexico. U.S. Department of Commerce, National Oceanic and Atmospheric Administration, Coastal Ocean Program, Silver Springs, Maryland. NOAA Coastal Ocean Program Decision Analysis Series Number 15, 203 pp.
Rabalais, N.N., R.E. Turner, and W.J. Wiseman, Jr. 2001. Hypoxia in the Gulf of Mexico. J. Environ. Qual. 30(2):320-329.
Rabalais, N.N. and R. Turner (Eds.). 2001. Coastal Hypoxia: Consequences for Living Resources and Ecosystems. American. Geophysical Union, Washington, DC., 454 pp.
Rabalais, N.N., R.E. Turner, Q. Dortch, D. Justic, V.J. Bierman, Jr. and W.J. Wiseman, Jr. 2002. Nutrient-Enhanced Productivity in the Northern Gulf of Mexico: Past, Present and Future. Hydrobiologia. 475/476(1):39-63.
Richardson, W.L., D.D. Endicott, R.G. Kreis, Jr., and K.R. Rygwelski. 2004. The Lake Michigan Mass Balance Project: Quality Assurance Plan for Mathematical Modeling. U.S. Environmental Protection Agency, Office of Research and Development, National Health and Environmental Effects Research Laboratory, Mid-Continent Ecology Division-Duluth, Large Lakes Research Station, Michigan. EPA-600/R-04/018, 233 pp.
Rygwelski, K.R. 2005. Draft, Operating Procedure for U.S. EPA-Grosse Ile Model Archiving and Operating Guidelines. U.S. Environmental Protection Agency, Office of Research and Development, National Health and Environmental Effects Research Laboratory, Mid-Continent Ecology Division-Duluth, Large Lakes Research Station, Grosse Ile, Michigan. LLRS-MCM-OP-001, 6 pp.
Scavia, D., N.N. Rabalais, R.E. Turner, D. Justic, and W.J. Wiseman Jr. 2003. Predicting the Response of Gulf of Mexico Hypoxia to Variations in Mississippi River Nitrogen Load. Limnol. and Oceanogr. 48(3):951-956.
Scavia, D., D. Justic, and V.J. Bierman, Jr. 2004. Reducing Hypoxia in the Gulf of Mexico: Advice from Three Models. Estuaries. 27:419-425.
Scavia, D.J. and K.A. Donnelly. 2007. Reassessing Hypoxia Forecasts for the Gulf of Mexico. Environ. Sci. Technol. 41:8111–8117.
U.S. Commission on Ocean Policy. 2004. An Ocean Blueprint for the 21st Century. Washington, DC.

Gulf of Mexico Hypoxia Modeling RQAPP
September 26, 2012 Revision 1 39
U.S. Environmental Protection Agency. 1991. Quality Assurance Guidelines for Modeling Development and Application Projects: A Policy Statement. U.S. Environmental Protection Agency, Office of Research and Development, Environmental Research Laboratory, Duluth, Minnesota.
U.S. Environmental Protection Agency. 2000. Guidelines for the Preparation of MED Research Plans. U.S. Environmental Protection Agency, Office of Research and Development, National Health and Environmental Effects Laboratory, Mid-Continent Ecology Division, Duluth, Minnesota.
U.S. Environmental Protection Agency. 2002a. Guidance for Quality Assurance Project Plans. EPA QA/G-5. U.S. Environmental Protection Agency, Office of Environmental Information, Washington, D.C. EPA/240/R-02/009, 111 pp.
U.S. Environmental Protection Agency. 2002b. Guidance for Quality Assurance Project Plans for Modeling, EPA QA/G-5M. U.S. Environmental Protection Agency, Office of Environmental Information, Washington, D.C. EPA/240/R-02/007, 121 pp.
U.S. Environmental Protection Agency. 2005. The Graded Approach to Quality Assurance and Definitions of Research Categories. In: Quality Management Plan for the National Health and Environmental Effects Research Laboratory (NHEERL), Attachment D. U.S. Environmental Protection Agency, Office of Research and Development, Research Triangle Park, North Carolina, QMP-NHEERL/99-01-001, 55 pp. URL: http://www.nheerl.epa.gov/administration/qa/files/qmp05_attachments.pdf
U.S. Environmental Protection Agency. 2008a. Integrated Modeling for Integrated Environmental Decision-Making. A White Paper by U.S. Environmental Protection Agency, Washington, D.C. EPA100/R-08/010, 58 pp.
U.S. Environmental Protection Agency Science Advisory Board. 2008b. Hypoxia in the Northern Gulf of Mexico. An Update by the EPA Science Advisory Board. Washington, DC. EPA Science Advisory Board, EPA-SAB-08-003.
U.S. Environmental Protection Agency. 2009. Guidance on the Development, Evaluation, and Application of Environmental Models. U.S. Environmental Protection Agency, Office of the Science Advisor, Council for Regulatory Environmental Modeling, Washington, D.C. EPA/100/K-09/003, 90 pp.
U.S. Environmental Protection Agency. 2012. Safe and Sustainable Water Resources Strategic Action Plan 2012-2016. U.S. Environmental Protection Agency, Office of Research and Development, Washington, D.C. EPA 601/R-12/004, 38 pp.
U.S. Geological Survey. 2006. Real-time Streamflow and Water Quality (Mississippi River Basin Discharge to the Gulf). U.S. Department of the Interior, U.S. Geological Survey, Lafayette, Louisiana. URL: http://toxics.usgs.gov/hypoxia/mississippi/real_time.html.
World Resources Institute. 2008. Eutrophication and Hypoxia in Coastal Areas: A Global Assessment of the State of Knowledge. World Resources Institute Policy Note: Water Quality: Eutrophication and Hypoxia, No 1. Washington, DC.

Gulf of Mexico Hypoxia Modeling RQAPP
September 26, 2012 Revision 1 40

Gulf of Mexico Hypoxia Modeling RQAPP
September 26, 2012 Revision 1 41
FIGURES
Figure 1. MED Gulf of Mexico Hypoxia Modeling Organization
MED Gulf of Mexico Hypoxia Modeling. Principal Investigator Russell G. Kreis, Jr., EPA
Hypoxia Modeling Project Collaborators (See Figure 2)
MED Modeling Team Kenneth Rygwelski, EPA – Modeling Facilitator/Coordinator Amy Anstead, ICF International Phillip DePetro, ICF International Timothy Feist ,Trinity Engineering Wilson Melendez, CSC James Pauer, EPA Mark Rowe, EPA Xiaomi Zhang, Trinity Engineering
Model Programming Wilson Melendez, CSC
Data Management for Modeling David Griesmer, CSC Xiangsheng Xia, CSC

Gulf of Mexico Hypoxia Modeling RQAPP
September 26, 2012 Revision 1 42
Figure 2. Overview of Project Clients and Collaborators (with lines of communication only)

Gulf of Mexico Hypoxia Modeling RQAPP
September 26, 2012 Revision 1 43
Figure 3. Gulf of Mexico Study Area

Gulf of Mexico Hypoxia Modeling RQAPP
September 26, 2012 Revision 1 44
Figure 4. Areal Extent of 2007 Hypoxic Zone

Gulf of Mexico Hypoxia Modeling RQAPP
September 26, 2012 Revision 1 45
0
5,000
10,000
15,000
20,000
25,000
1985
1987
1989
1991
1993
1995
1997
1999
2001
2003
2005
2007
Are
a (
sq
km
)
Annual Hypoxic Zone Size Action Plan Goal
5-Yr Average (2004-2008)Data from Louisiana Universities Marine Consortium:
http://w w w .gulfhypoxia.net/Overview /
Figure 5. Changes in Areal Extent of 1985-2008 Hypoxic Zone

Gulf of Mexico Hypoxia Modeling RQAPP
September 26, 2012 Revision 1 46
0
200,000
400,000
600,000
800,000
1,000,000
1,200,000
1,400,000
1,600,000
1,800,000
1955
1959
1963
1967
1971
1975
1979
1983
1987
1991
1995
1999
2003
2007
Calendar Year
Nit
rate
Lo
ad
(m
etr
ic t
on
s p
er
year)
1955-1996 loads from Goolsby et al. , 1999
1997-2007 loads from Aulenbach et al. , 2007
Figure 6. Annual Nitrate Load to the Gulf of Mexico

Gulf of Mexico Hypoxia Modeling RQAPP
September 26, 2012 Revision 1 47
0
20,000
40,000
60,000
80,000
100,000
120,000
140,000
160,000
180,000
200,000
1979
1981
1983
1985
1987
1989
1991
1993
1995
1997
1999
2001
2003
2005
2007
Calendar Year
To
tal P
ho
sp
ho
rus L
oad
(m
etr
ic t
on
s p
er
year)
data from Aulenbach et al. , 2007
Figure 7. Total Annual Phosphorus Load to the Gulf of Mexico

Gulf of Mexico Hypoxia Modeling RQAPP
September 26, 2012 Revision 1 48
Figure 8. Integrated, Multimedia Gulf of Mexico Modeling Framework
Figure 9. Sediment-Water Interactions

Gulf of Mexico Hypoxia Modeling RQAPP
September 26, 2012 Revision 1 49
TABLES
Table 1. Overall Project Schedule
07 08 09 10 11 12 13
Project planning x x
Database development/management x x x x x x
Hydrodynamic model (EPACOM) incorporation into 3-D GoMDOM x x x
Incorporate CMAQ atmospheric nitrogen fluxes into GoMDOM models x x
1-D GoMDOM model development x x
1-D GoMDOM model calibration x x
1-D GoMDOM model calibration / sensitivity / scenarios x x
1-D GoMDOM model journal article preparation x x
3-D 6km x 6km GoMDOM model development x x x x x
3-D 6km x 6km GoMDOM model calibration x
3-D 6km x 6km GoMDOM model corroboration x
3-D 6km x 6km GoMDOM model management scenarios / sensitivity x x
3-D 6km x 6km GoMDOM model journal article preparation x
3-D 6km x 6km GoMDOM model climate change scenarios
3-D 2km x 2km GoMDOM model parallelization x x
Fiscal Years
MED Major Gulf of Mexico Project Activities

Gulf of Mexico Hypoxia Modeling RQAPP
September 26, 2012 Revision 1 50
Table 2. List of Desired Field Measurements
Atmosphere Gulf Tributaries Sediment
Wet Dry Gas
Total Nitrogen x x x x x x
Dissolved Inorganic Nitrate x x
Dissolved Inorganic Nitrite x x
Dissolved Inorganic Ammonium x x x x x x
Particulate Organic Nitrogen x x x x x x
Total Kjeldahl Nitrogen x x x x
Total Phosphorus x x x x x
Dissolved Inorganic Phosphorus x x x
Particulate Organic Phosphorus x x x
Dissolved Inorganic Silica x x x
Total Organic Carbon x x x x
Dissolved Organic Carbon x x
Particulate Organic Carbon x x
Total Suspended Solids 0.7µm x x x x
Conductivity x x x
Salinity x x x x
Chloride x x x x x
pH x x x
Alkalinity x x x
Transmissivity x x
Temperature x x
Wind Speed / Direction x
Dissolved Oxygen x x
Photosynthetically Active Radiation
(400-700 nm)
x
Incident PAR x
Light Extinction x
Chlorophyll Fluorescence x x
Fast Repetition Rate Fluorometry
(Fluorometry/Productivity)
x x
Phyto Biomass HPLC Pigments x x
Phyto Biovolume Size Fraction x x

Gulf of Mexico Hypoxia Modeling RQAPP
September 26, 2012 Revision 1 51
Error! Reference source not found. (continued).
Atmosphere Gulf Tributaries Sediment
Wet Dry Gas
C-14 Primary Productivity x x
Zooplankton Biovolume x x
Secondary Productivity x x
Microbial Productivity x x
Plankton Oxygen Demand x x
Porosity x
% Water x
% Solids x
Reduction Oxidation Potential x
Porewater x
Sediment Oxygen Demand x
Sediment-Water Nitrogen Flux x

Gulf of Mexico Hypoxia Modeling RQAPP
September 26, 2012 Revision 1 52
APPENDIX 1: CONCEPTUAL EQUATIONS FOR DISSOLVED OXYGEN AND SEDIMENT DIAGENESIS
The Gulf of Mexico hypoxia modeling framework, GoMDOM, is based on the eutrophication model, LM3-Eutro, which was developed for Lake Michigan (Pauer et al. 2006, 2008, 2011). This document describes equations added-to or changed from those in the LM3-Eutro model. There were several major changes to the LM3-Eutro model. Dissolved oxygen (DO) was added as a state variable with its transformation reactions. Denitrification equations are also briefly described which indirectly affect the DO in the Gulf of Mexico. The GoMDOM model also uses a somewhat different approach than LM3-Eutro to estimate the impact of solar radiation (light) on algal production. The Jassby and Platt equation was used to estimate the limitation of primary production by available light (Jassby and Platt, 1976, Lehrter et al 2009). Light attenuation was calculated using a site-specific relationship between light attenuation and chlorophyll, particulate carbon and salinity. A sediment diagenesis and flux sub-model are planned for the future. DISSOLVED OXYGEN EQUATIONS (WATER COLUMN) The sources of DO in the water column include algal photosynthesis and reaeration. DO sinks in the water column include algal respiration, organic carbon oxidation (bacterial respiration), and chemical oxygen demand (COD), mainly sulfide oxidation and nitrification. DO sinks in the sediment will be discussed in the SEDIMENT-WATER INTERACTION section. Phytoplankton photosynthesis (PHOTO) and respiration (RESP) -- see equation B.4 in Section B.1 of main document. Phytoplankton generate dissolved oxygen (photosynthesis) when sufficient nutrients, sunlight, and “warmth” (temperature) are available and consume oxygen as a result of respiration. Several equations have been proposed to describe these processes ranging form very complex to rather simplistic approaches. We propose the following equation for these processes, which is a simplification of the CE-QUAL-ICM (Cerco and Cole, 1995) equation.
(1)
where P = phytoplankton carbon concentration (mass carbon∙volume-1) DO = dissolved oxygen concentration (mass∙volume-1) kg = phytoplankton growth coefficient (time-1) kd = respiration rate (time-1) AOCR = dissolved oxygen-to-carbon ratio in respiration (2.67 gO2∙gC-1) In general, the Arrhenius equation was used to calculate the effect of temperature on the many reaction rate coefficients.
(2)
where k(T) = rate coefficient at temperature, T
g d
dDOk k P AOCR
dt
[T T(opt)]k(T) k(opt)

Gulf of Mexico Hypoxia Modeling RQAPP
September 26, 2012 Revision 1 53
4
4
4 4NH
DO NH 4
dNH NHDO f(T) k
dt Ks DO Ks NH
doc
res
dDO DO AOCR K DOC
dt Ks DO
COD
COD
dCOD DO K COD
dt Ks DO
k(opt) = rate coefficient at optimum temperature, T(opt) θ = temperature correction constant Dissolved organic carbon oxidation – see equation B.4. Dissolved organic carbon (DOC), for the most part, is present in the water because of the decomposition of phytoplankton, zooplankton, and detrital particulate organic carbon. In the presence of oxygen, DOC can be oxidized to carbon dioxide (CO2), an important oxygen sink. Similar to the CE-QUAL-ICM model, the equation can be written as
(3) where
Ksres = half-saturation conc. of DO required oxidation (mass∙volume-1) Kdoc = DOC oxidation rate (time-1) Chemical Oxygen Demand (COD) – see equation B.4. Chemical oxygen demand is the concentration (oxygen equivalents) of reduced species in the water that can be rapidly oxidized chemically (absence of microorganisms). It is assumed that the source of COD in the Gulf of Mexico is mainly due to sulfide released from the sediments. Using an oxygen dependency, we can write the equation similar to CE-QUAL-ICM.
(4) where COD = chemical oxygen demand (mass O2 equivalents∙volume-1) KsCOD = half-saturation concentration of COD (mass∙volume-1) KCOD = COD oxidation rate (time-1) Nitrification – See equation B.4. Due to the nature of the nitrifiers, it is generally accepted that nitrification occurs much faster in the oxic regions of the sediment-water interface than in the water column. Even at these slow rates, nitrification can be important in a relatively deep water column. Nitrification is typically modeled in low oxygen systems as a double Monod equation with a dependency on both oxygen and ammonia.
(5) where KsDO = half saturation rate for DO (mass∙volume-1) KsNH4 = half saturation rate for NH4 (mass∙volume-1)
f(T) = temperature function similar to other equations in the LM3-Eutro model kNH4 = maximum nitrification rate (mass∙volume-1∙day-1)
Reaeration – See equation B4 It is generally accepted that reaeration in estuaries is largely dependent on wind effects (e.g. Chapra, 1997). The general equation can be written as:

Gulf of Mexico Hypoxia Modeling RQAPP
September 26, 2012 Revision 1 54
1 sat
dDOV K A DO DO
dt
0.5
1.64
1 w
ScK 0.108U
600
1.64
1 wK 0.0986U
res 3denit
res denit 3
Ks NORate ANOX Kdoc
Ks DO Ks NO
denit
dDOC Rate DOC
dt
3denit
dNO Rate ANDC DOC
dt
(6) where Kl = oxygen mass-transfer velocity (length∙time-1) A = surface area of the water body (area) The Wanninkhof equation was used to calculate the oxygen mass-transfer velocity as follows:
(7a) where Sc = Schmidt number (dimensionless number used to characterize fluid flows) Uw = wind speed 10 meters above surface (length∙time-1) The equation can be simplified if a Schmidt number of 500 is used to represent the value of oxygen in water.
(7b) Denitrification In the absence of oxygen, nitrate can act as an electron acceptor during the oxidation of organic matter. This process, known as denitrification, affects nitrogen and carbon concentrations. Similar to nitrification, it can be modeled via a double Monod function.
(8) where Ratedenit = denitrification rate (time-1) Ksres = half saturation conc. of DO for oxic respiration (mass.volume-1) Ksdenit = half-saturation conc. of nitrate for denitrification (mass.volume-1) ANOX = ratio of denitrification to oxic carbon respiration Kdoc = respiration rate of DOC (time-1) The subsequent mass balances terms for carbon and nitrogen are as follows:
(9)
(10) where ANDC = mass nitrate-N reduced per mass DOC oxidized (mass N∙mass C-1)

Gulf of Mexico Hypoxia Modeling RQAPP
September 26, 2012 Revision 1 55
4 T1 4 d1 4 T
12 p2 4 p1 4T T
L12 d2 4 d1 4T T
2 4 T
d PO 1H s PO 0 f PO 1
dt
+ f PO 2 f PO 1
+ K f PO 2 f PO 1
PO 1
4 T2 12 p2 4 p1 4T T
L12 d2 4 d1 4T T
2 4 4 PT T
d PO 2H f PO 2 f PO 1
dt
K f PO 2 f PO 1
PO 1 PO 2 J
SEDIMENT-WATER INTERACTION A common approach used to describe the interaction between the sediment and the water column is to assume a net sedimentation (difference between sedimentation and resuspension) of phytoplankton and detrital material and to describe sediment kinetic reactions and transport of nutrients, oxygen and carbon within and across the sediments. This is known as sediment diagenesis (defined as all chemical, physical, and biological modifications undergone by a sediment after its initial deposition) or sediment flux modeling. The approach will be in large part based (at least as a first approach) on the work by DI Toro and co-workers as described in the CE-QUAL-ICM users guide (Cerco and Cole, 1995), the Chesapeake Bay project report (Cerco and Cole, 1994), The Chesapeake Bay Sediment Flux model report (DI Toro and Fitzpatrick, 1993), and the textbook “Sediment Flux Modeling” (DI Toro, 2001). The sediment flux model includes the following state variables: phosphorus, ammonia, nitrate, silica, and sulfide. Below is a discussion of each state variable and equations to describe their transport and chemical conversions in the sediments and at the sediment-water interface. Phosphorus flux A schematic diagram of the transport and kinetic reactions is shown in Figure A-1. To simplify the model, a partition coefficient is used to account for phosphate (dissolved form) in the pore water and attached to the solids. Several other assumptions are also made:
1. The sediment consists of two layers, a thin oxic layer (< 1 mm) and a much thicker anoxic layer (~10 cm)
2. Because the aerobic layer is much smaller than the anaerobic layer, the particulate organic phosphorus, POP, settles directly to the anaerobic layer
3. Thus no diagenesis occurs in this thin oxic layer 4. The anoxic layer has a fixed (user specified) thickness 5. The solids concentration (TSS) is constant within the sediments 6. The particulate organic phosphorus consist of several reactivity classes ranging from a
labile (highly reactive) to a refractory form The phosphate mass balance in the oxic, H1 and anoxic layers, H2 can be written as follows:
(11a)
(11b)

Gulf of Mexico Hypoxia Modeling RQAPP
September 26, 2012 Revision 1 56
2(T 20)
p POP, i i 2
i 1
J k POP H
DO1
DH
s
1 1 1
1 1
1fd fp 1 fd
1 m
2 2 2
2 2
1fd fp 1 fd
1 m
where H1 and H2 = thicknesses of sediment layers 1 and 2, respectively (length) [PO4(0)]T, [PO4(1)]T and [PO4(2)]T = total PO4 concentration (which includes the dissolved and solid sorbed fractions) of the overlaying water, for layers 1 and 2, respectively (mass∙area-1) fd1 and fd2 = dissolved fractions in layers 1 and 2, respectively
fp1 and fp2 = particulate fractions in layers 1 and 2, respectively These fractions can be calculated by the following equations (assuming the porosity is approximately one)
(12a)
(12b)
where m1, m2 = the solids (mainly Fe3+) concentration in layers 1 and 2, respectively (mass∙volume-1) π1, π2 = partition coefficients in layer 1 and 2, respectively (volume∙mass-1)
KL12 = mass transfer coefficient between the aerobic and anaerobic layers (length∙time-1) ω12 = particle mixing velocity between the aerobic and anaerobic layers (length∙time-1) ω2 = burial velocity (length∙time-1) JP = source of phosphate from diagenesis of particulate organic phosphorus, POP (mass∙area-1∙time-1) and it can be estimated as follows
(13) POPi = concentration of particulate organic phosphorus in reactivity class i (mass∙area1) kPOP,i = first-order reaeration rate coefficient (time-1) θ = temperature correction constant s = surface mass transfer coefficient between sediment and water (length.time-1) The depth of the aerobic layer, H1 can be determined by the following equation:
(14) where
DDO = diffusion coefficient in the aerobic layer (length2.time-1)

Gulf of Mexico Hypoxia Modeling RQAPP
September 26, 2012 Revision 1 57
T 20i2 POP,i POP,i i 2 2 i POP,i POP
dPOPH k POP H POP f J
dt
2
2 2 2T1 1 1 dl
T
2 212 p2 p1
T T
2 2L12 d2 d1
T T
22
T
d S 1H k H S s S 0 f S 1
dt
f S 2 f S 1
K f S 2 f S 1
S 1
4,1 41 2 PO crit, PO
DO DO
For the particulate organic phosphorus (POP) the mass balance equations can be written as follows:
(15) where POPi = concentration of particulate organic phosphorus in reactivity class i (mass∙area-1) kPOP,i = first-order reaction rate coefficient (time-1) θ = temperature coefficient T = temperature (oC) ω2 = sedimentation velocity (length∙.time-1) JPOP = depositional flux of POP from the overlying water to the sediment (mass∙area-1∙time-1) fPOPi = fraction of JPOP that is in the ith G class It is well known that the phosphate sediment fluxes (across the sediment-water interface) are strongly affected by the water column DO concentration. In most systems this is caused by the Fe3/Fe2 redox reaction. In moderate and high DO concentrations, the phosphate forms a precipitate with iron, and thus a very small sediment phosphate release rate. In contrast, below a critical DO concentration, phosphate is released to the overlying water. This can be described mathematically:
(16) where [DO]crit, PO4 = critical DO concentration (mass.volume-1) Δπ = enhanced sorption (in the oxic sediments) Sulfide flux A schematic diagram of the sulfide behavior in the sediments is shown in Figure A-2. In a manner similar to phosphorus, we can write equations for sulfide. For dissolved sulfide, the only difference is a reaction (oxidation) term in the oxic layer. The mass balance equation for sulfide in the oxic layer (1) and anoxic layer (2), respectively, can be written as follows:
(17a)

Gulf of Mexico Hypoxia Modeling RQAPP
September 26, 2012 Revision 1 58
2
2 2T2 12 p2 p1
T T
2 2L12 d2 d1
T T
2 22 2ST T
d S 2H f S 2 f S 1
dt
K f S 2 f S 1
S 1 S 2 J
2 2 2
2 2
2T 20
1 1 H S,dl dl H S,p1 p1 H S 1
M,H S,O
O 1k H k f k f H
K
2 2 2O , H S C C, N 2S2J J J N ga a
T 20
Si Si Si Si satS k P Si Si aq
2T 20
C POC,i POC,i i 2
i 1
J k POC H
(17b) where [S2-(0)]T, [S
-2(1)]T and [S2-(2)]T = total sulfide concentration (which includes the dissolved and solid sorbed fractions) of the overlaying water, layer 1 and layer 2, respectively (g/m2) The reaction term, kH1, and oxygen flux term JS
2- can be written as follows:
(18)
(19) The carbon diagenesis term, Jc, can be expressed as:
(20) where kH2S,d1 = reaction rate constant for dissolved oxidation (time-1) kH2S,p1 = reaction rate constant for particulate oxidation (time-1) KM,H2S,O2 = scaling factor aO2,H2S = stoichiometric coefficient (a value of 2.67 mgO2∙mgC-1) is used aC,N2 = stoichiometric coefficient (a value of 1.071 mgC∙mgN) is used JC = carbon diagenetic flux (massC∙area-1∙time-1) J[N2(g)] = nitrogen gas flux (massN∙area-1∙time-1) kPOC,i = reaction rate (time-1) Silica flux A schematic diagram of the silica transport and kinetic reactions in the sediments are shown in Figure A-3. The equations are similar to phosphorus and sulfide sediment diagenesis. The mineralization of particulate silica is believed to be a chemical as opposed to a biochemical (mediated by bacteria) reaction. It has been determined that the rate of biogenic silica dissolution is proportional to the silica solubility deficit [Si]sat – [Si]aq, where [Si]aq is the dissolved silica concentration . The rate of dissolved silica production , SSi can be written as follows:
(21)

Gulf of Mexico Hypoxia Modeling RQAPP
September 26, 2012 Revision 1 59
T 20
T2 Si Si 2satJ k Si H
T 20
2 Si Si d2k k f
T1 d1 T
12 p2 p1T T
L12 d2 d1T T
2 T
d Si 1H s Si 0 f Si 1
dt
f Si 2 f Si 1
K f Si 2 f Si 1)
Si 1
T2 2 2 T
12 p2 p1T T
L12 d2 d1T T
2 T2T T
d Si 2H k H Si 2
dt
f Si 2 f Si 1
K f Si 2 f Si 1
Si 1 Si 2 J
4
4
1 NH ,1 4 1 L01 4 4
L12 4 4
4
2 L12 4 4 N2
d NH 1H k NH 1 H K NH 1 NH 0
dt
K NH 2 NH 1
d NH 2H K NH 2 NH 1 J
dt
From this we can calculate JT2 and k2 and can be written as:
(22)
(23) The dissolved silica mass balance in the oxic layer (1) and the anoxic layer (2), respectively, can be written as follows:
(24a)
(24b)
where kSi = rate coefficient for silica dissolution rate (time-1) k2 = rate coefficient (time-1) PSi = particulate biogenic silica (mass.volume-1) Ammonia and nitrate fluxes Different from the phosphorus, silica and sulfide, the dissolved nitrogen species are present only in the pore water (no solids partitioning). Other than that, the equations are very similar as before. A schematic of the transport and kinetic reactions are shown in Figure A-4 for ammonia and Figure A-5 for nitrate. The mass balance equations for ammonia and nitrate can be written for the oxic layer (1) and anoxic layer (2) as:
(25)

Gulf of Mexico Hypoxia Modeling RQAPP
September 26, 2012 Revision 1 60
3
3
3
1 NO ,1 3 1 L01 3 3
L12 3 3 3
3
2 NO , 2 3 2 L12 3 3
d NO 1H k NO 1 H K NO 1 NO 01
dt
K NO 2 NO 1 S NO
d NO 2H k NO 2 H K NO 2 NO 1
dt
T 20i2 PON,i PON,i i 2 2 i PON,i PON
dPONH k PON H PON f J
dt
2T 20
N PON,i PON,i i 2
i 1
J k PON H
2 2 2
ox
O ,H S C C,N 2
ox aq br
fr sCSOD a J a J N g
fr s fr s fr s
4
2 4 4
2
NH ,1 T 20
O ,NH NH 4
KNSOD a NH 1
s
(26) where S[NO3] = is the source of nitrate from nitrification The mass balance for the particulate nitrogen can be written as follows:
(27) where The nitrogen diagenetic flux can be written as:
(28) kNH4 = nitrification rate (time-1) S[NO3]= nitrate generated due to nitrification (mass∙area-1∙time-1) Finally we can expressed the Sediment Oxygen Demand Flux (SOD – see equation B.4.) in marine systems as the sum total of the oxygen demand due to the oxidation of sulfide (CSOD) and nitrification (NSOD) within the sediments SOD = CSOD + NSOD (29) where
CSOD and NSOD can be defined as:
(30)
(31) where frox(s) = fraction of sulfide being oxidized fraq(s) = fraction of sulfide being loss due to mixing with the overlying water frbr(s) = fraction of sulfide being removed due to burial K2
NH4,1 = nitrification velocity (length.time-1)

Gulf of Mexico Hypoxia Modeling RQAPP
September 26, 2012 Revision 1 61
Figure A-1: Schematic diagram of the phosphorus transport and kinetic reactions in the sediments.
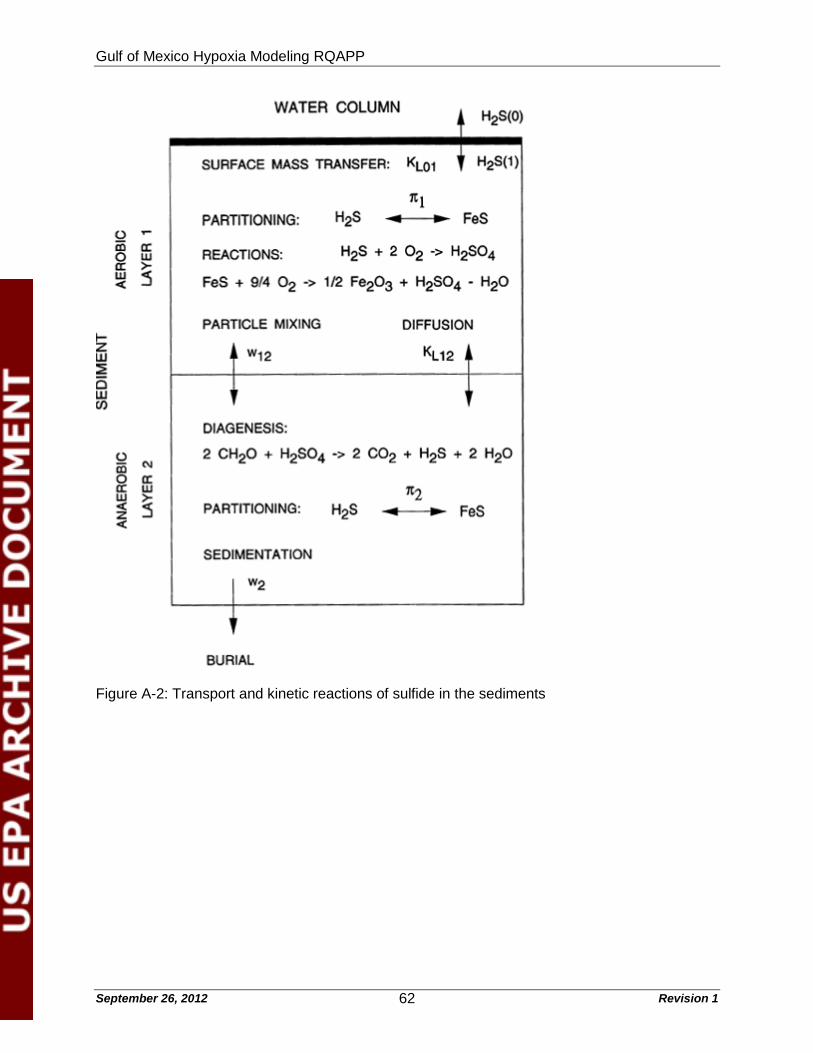
Gulf of Mexico Hypoxia Modeling RQAPP
September 26, 2012 Revision 1 62
Figure A-2: Transport and kinetic reactions of sulfide in the sediments

Gulf of Mexico Hypoxia Modeling RQAPP
September 26, 2012 Revision 1 63
Figure A-3: Silica transport and kinetics in the sediments

Gulf of Mexico Hypoxia Modeling RQAPP
September 26, 2012 Revision 1 64
Figure A-4. Ammonia transport and kinetic reactions in the sediments
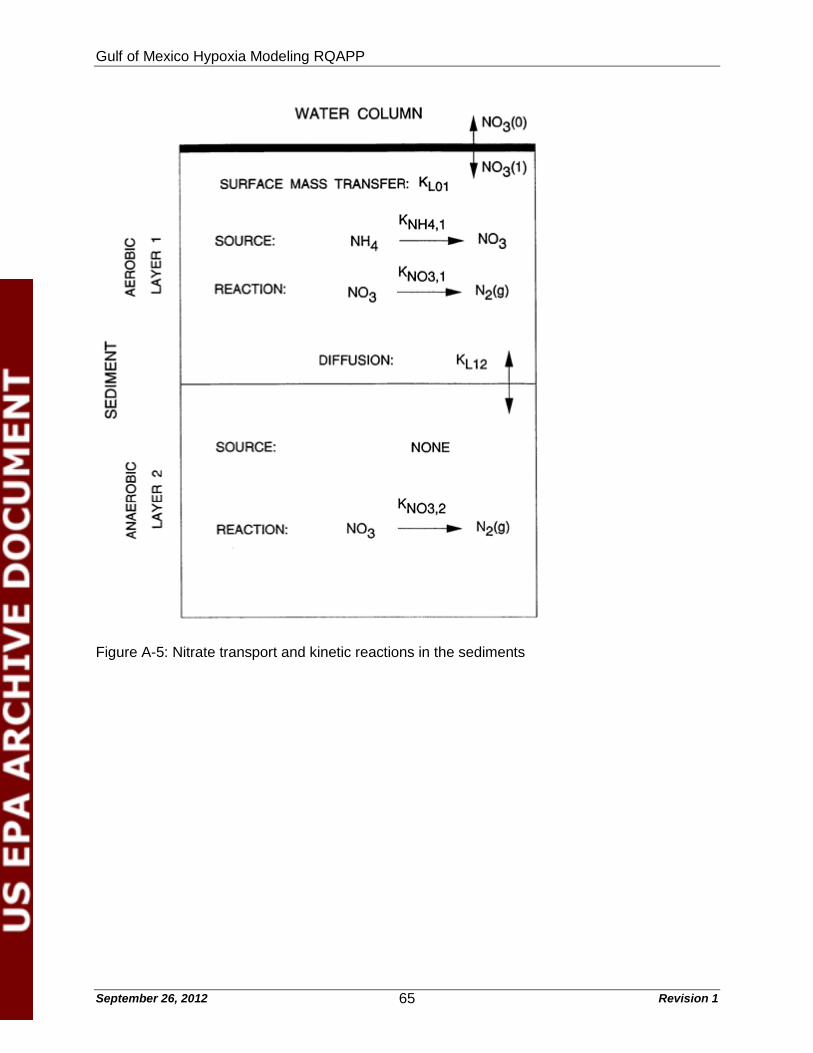
Gulf of Mexico Hypoxia Modeling RQAPP
September 26, 2012 Revision 1 65
Figure A-5: Nitrate transport and kinetic reactions in the sediments
Gulf of Mexico Hypoxia Modeling RQAPP
September 26, 2012 Revision 1 66
REFERENCES Cerco, C. F. and T.M. Cole. 1994. Three-Dimensional Eutrophication Model of Chesapeake
Bay; Technical Report Number EL-94-4; U.S. Army Engineer Waterways Experiment Station, U.S. Army Corps of Engineers: Vicksburg, Mississippi.
Cerco, C.F. and T.M. Cole. 1995. User’s Guide to the CE-QUAL-ICM Three–Dimensional
Eutrophication Model (version 1); EL-95-15; U.S. Army Engineer Waterways Experiment Station: Vicksburg, Mississippi.
Chapra, S.C. 1997. Surface Water-Quality Modeling, McGraw-Hill, New York, NY, pp 844 DI Toro, D.M. and J. Fitzpatrick. 1993. Chesapeake Bay Sediment Flux Model, HydroQual Inc.
Mahwah, NJ Prepared for the US Army Engineer Waterways Experiment Satiation, Vicksburg, MS
DI Toro, D.M. 2001. Sediment Flux Modeling, John Wiley & Sons, Inc. New York, NY pp 624 Jassby, A. D. and T. Platt. 1976. Mathematical formulation of the relationship between
photosynthesis and light for phytoplankton. Limnol. Oceanogr. 21: 540-547 Lehrter, J. C., M.M. Murrell, and J.C. Kurtz. 2009. Interactions between Freshwater Input,
Light, and Phytoplankton Dynamics on the Louisiana Continental Shelf. Cont. Shelf Res. 29(15):1861-1872.
Pauer, J. J., K.W. Taunt, and W. Melendez. 2006. In: Results of the Lake Michigan Mass
Balance Study: PCBs Modeling Report, Rossmann, R., Ed., Report EPA/600/R-04/167; United States Environmental Protection Agency, Office of Research and Development, National Health and Environmental Effects Research Laboratory, Mid-Continent Ecology Division, Large Lakes and Rivers Forecasting Research Branch, Large Lakes Research Station: Grosse Ile, MI, 2006; pp 120-182. URL: http://www.epa.gov/medatwrk/grosseile_site/LMMBP/pcb-report.html
Pauer, J. J., A.M. Anstead, W. Melendez, R. Rossmann, K.W. Taunt, and R.G. Kreis, Jr. 2008.
The Lake Michigan Eutrophication Model, LM3-Eutro: Model Development and Calibration. Water Environ. Res. 80(9): 853-861
Pauer, J.J., A.M. Anstead, W. Melendez, K.W. Taunt, and R.G. Kreis, Jr. 2011. Revisiting the
Great Lakes Water Quality Agreement Phosphorus Targets and Predicting the Trophic Status of Lake Michigan. J. Great Lakes Res. 37, pp. 26-32.