gum arabic and gum resins
TRANSCRIPT
1
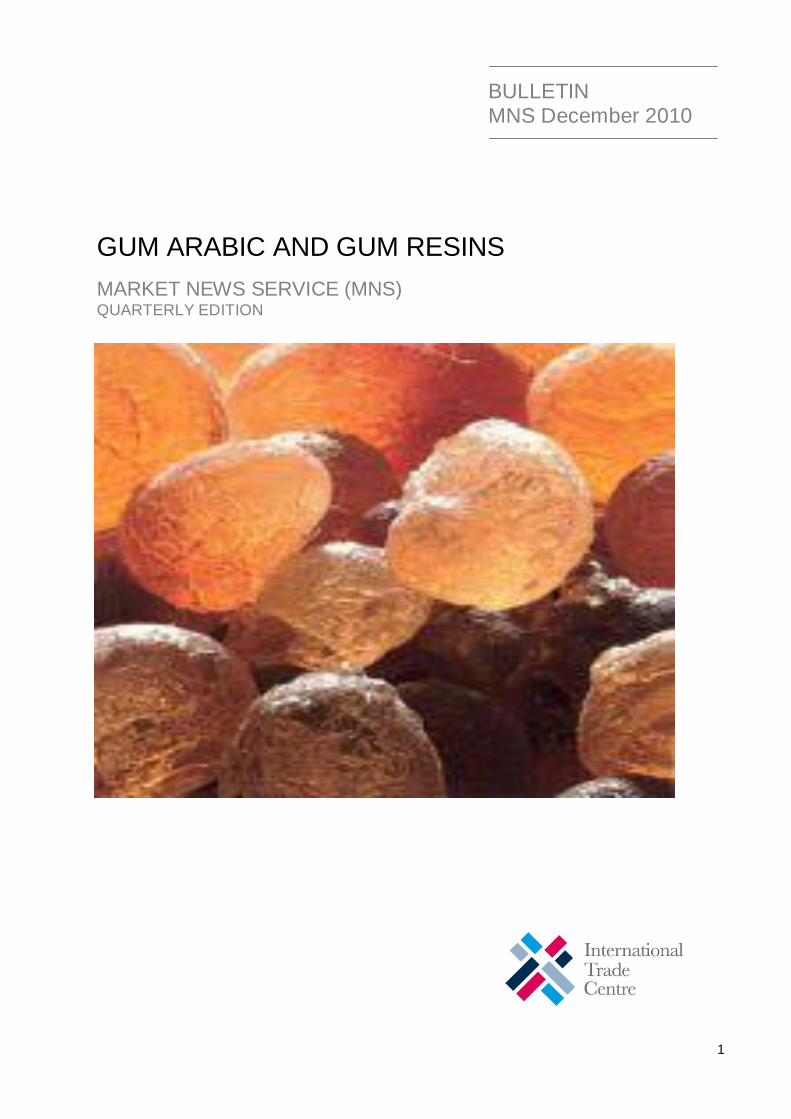
GUM ARABIC AND GUM RESINS
MARKET NEWS SERVICE (MNS) QUARTERLY EDITION
BULLETIN MNS December 2010
2 Market News Service
Gum Arabic and Gum Resins
Disclaimer
This report has been prepared without formal editing, as a service to exporters and industries in developing countries by the Market News Service (MNS), Division of Market Development, International Trade Centre. The Joint Agency of the World Trade Organization and The United Nations. No part of this report may be reproduced, stored in a retrieval system or transmitted in any form or by any means, without prior permission in writing from the International Trade Centre. The mention of specific companies or of certain commercial products and brand names does not imply that they are endorsed or recommended by ITC in preference to others of a similar nature that are not mentioned. The designations employed and the presentation of material on the map do not imply the expression of any opinion whatsoever on the part of the International Trade Centre concerning the legal status of any Country, territory, city or area or of its authorities, or concerning the delimitation of its frontiers or boundaries.

2
Market News Service (MNS)
GUM ARABIC AND GUM RESINS Report prepared for ITC’s Market News Service by: Mr. Salif Touré
Issue 4, December 2010
The Market News Service of the International Trade Centre UNCTAD/WTO (ITC) provides timely and detailed price and market information on selected primary and semi-processed products of particular interest to developing countries and economies in transition. Regular access to such information is vital to companies deciding when and where they should sell or buy products on international markets. MNS thus aims to serve as a market intelligence tool, to enable developing countries realize their full income potential through global trade expansion. MNS does not act as a broker and is exclusively an information service with the objective of improving market transparency and encouraging price and quality competition for the benefit of all market players. MNS’ team of product specialists draws its information from a network of correspondents in many countries worldwide, collecting up-to-date data on wholesale prices paid for specific products, supply and demand trends, and economic, climatic and legislative information that can affect the short-term market situation of particular products. MNS' information providers include major importers, exporters, manufacturers, wholesalers, and governmental organizations. We continuously encourage and welcome new sources of information. Should you be interested in becoming an information provider and contributing to MNS' efforts to improve market transparency and facilitate trade, please contact us at [email protected].
The information provided in this report was obtained from several sources and relates to various Gum Arabic characteristics, the supply and demand situation of the product, economic and legislative environment as well as the effects of climate change on its global trade.
For more information about the report and Market News Service, please contact [email protected] or visit our website on http://www.intracen.org/market-news. The author of this report may be contacted at [email protected].
Copyright © MNS/ITC 2000. All rights reserved
3 Market News Service
Gum Arabic and Gum Resins
INDEX
I. THE GLOBAL MARKET (GUM ARABIC) 4
FACTORS AFFECTING THE GLOBAL MARKET (GUM ARABIC) 14
CONCLUSION (GUM ARABIC) 16
II. THE GLOBAL MARKET (GUM RESINS) 17
FACTORS AFFECTING THE GLOBAL MARKET (GUM RESINS) 19
CONCLUSION (GUM RESINS) 28
TRADE EVENTS 29
I. APPENDIX (GUM ARABIC) 30
II. APPENDIX (GUM RESINS) 33

4 Market News Service
Gum Arabic and Gum Resins
I. THE GLOBAL MARKET
Gum Arabic Demand for gum arabic continued to increase in the third quarter of 2010, signaling an upturn in global consumer spending. This trend confirms that the recession is coming to an end. However, the global economy is still very unstable, consequently leading to a global market for gum arabic lacking the vigour that it previously exhibited. In spite of this atmosphere, one may be optimistic about the 2010-2011 harvest season given the fact that importers are once
again seeking to obtain their supplies in the most profitable conditions. The quantity of gum arabic imported in the third quarter of 2010 is slightly higher than the quantity recorded in the same period in 2009. As a result, the import unit price for crude gum decreased for the majority of importing countries except the United States, Thailand, Chili and Portugal.
Global exports of crude gum and price trends Data obtained from the COMTRADE database on major African gum-producing and gum-exporting countries for the third quarter of 2010 demonstrate an increase in Sudanese exports, except for exports destined for the United States and South Korea. Over the same period, Nigerian gum arabic exports declined while Chadian exports towards France increased. Other African gum-producing countries such as Senegal, Mali and Burkina Faso were not significantly active on the gum arabic market. Undoubtedly, they are affected by the shrinking of import markets that are affected by the ongoing effects of the crisis. This trend is consistent with the decline in gum arabic production observed in these countries since the beginning of the 2009-2010 crop year. As a result, these countries were not able to adjust to the disruptions brought about by the low global demand of gum arabic. The slowdown in export activities observed in these countries,
compared to the major producing countries, is due to the absence of available stocks, coupled with the fact that peasants have turned to more profitable economic ventures. It is worth noting that, on a global level, the total quantities of crude gum exported in the 3
rd
quarter 2010 for all African gum-producing countries is lower than those of the second quarter of 2010. The reason for this is the depletion of stocks that comes with the end of this crop year. The quantities of crude gum exported by the three major African exporters for the third quarter of 2010 (in kg and tons) is presented in tables 2, 3 and 4 for Sudan, Chad and Nigeria, respectively. In the absence of national statistics, the quantities of crude gum exported by these countries were obtained from mirror data.
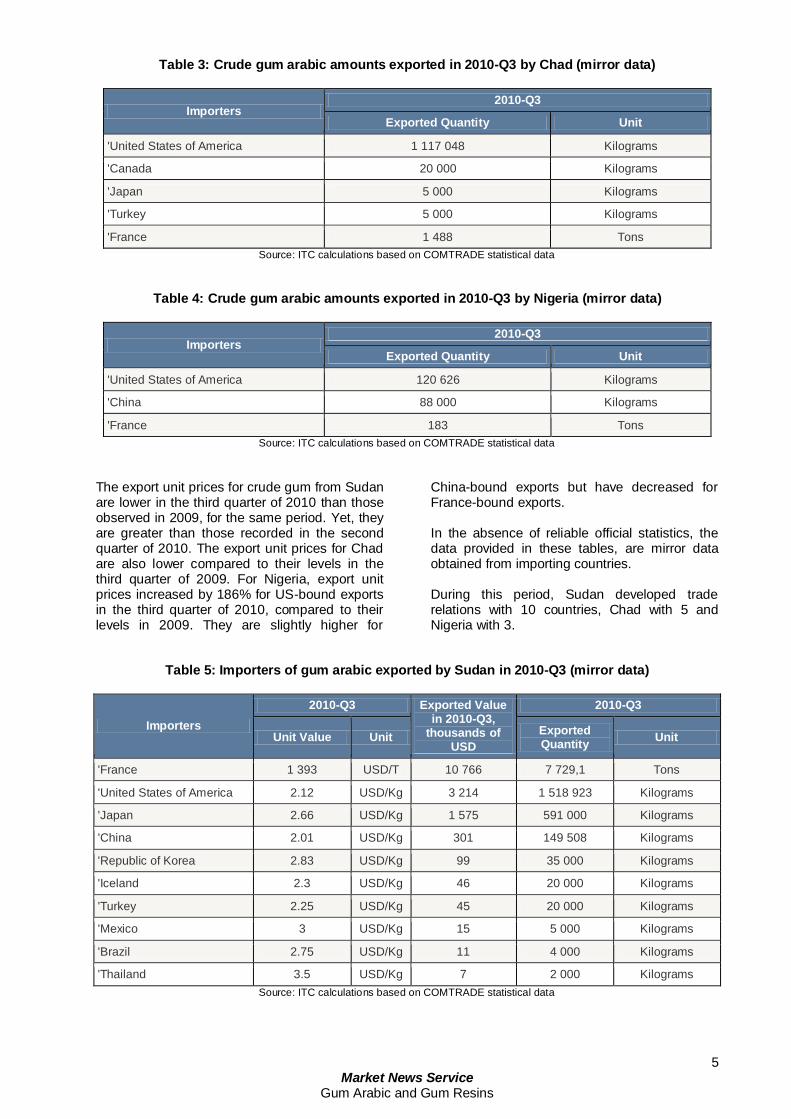
Table 2: Crude gum arabic quantities exported in 2010-Q3 by Sudan (mirror data)
Importers 2010-Q3
Exported Quantity Unit
'United States of America 1 518 923 Kilograms
'Japan 591 000 Kilograms
'China 149 508 Kilograms
'Republic of Korea 35 000 Kilograms
'Iceland 20 000 Kilograms
'Turkey 20 000 Kilograms
'France 7 729,1 Kilograms
'Mexico 5 000 Kilograms
'Brazil 4 000 Kilograms
'Thailand 2 000 Kilograms
Source: ITC calculations based on COMTRADE statistical data
5 Market News Service
Gum Arabic and Gum Resins
Table 3: Crude gum arabic amounts exported in 2010-Q3 by Chad (mirror data)
Importers 2010-Q3
Exported Quantity Unit
'United States of America 1 117 048 Kilograms
'Canada 20 000 Kilograms
'Japan 5 000 Kilograms
'Turkey 5 000 Kilograms
'France 1 488 Tons
Source: ITC calculations based on COMTRADE statistical data
Table 4: Crude gum arabic amounts exported in 2010-Q3 by Nigeria (mirror data)
Importers 2010-Q3
Exported Quantity Unit
'United States of America 120 626 Kilograms
'China 88 000 Kilograms
'France 183 Tons
Source: ITC calculations based on COMTRADE statistical data
The export unit prices for crude gum from Sudan are lower in the third quarter of 2010 than those observed in 2009, for the same period. Yet, they are greater than those recorded in the second quarter of 2010. The export unit prices for Chad are also lower compared to their levels in the third quarter of 2009. For Nigeria, export unit prices increased by 186% for US-bound exports in the third quarter of 2010, compared to their levels in 2009. They are slightly higher for
China-bound exports but have decreased for France-bound exports. In the absence of reliable official statistics, the data provided in these tables, are mirror data obtained from importing countries. During this period, Sudan developed trade relations with 10 countries, Chad with 5 and Nigeria with 3.
Table 5: Importers of gum arabic exported by Sudan in 2010-Q3 (mirror data)
Importers
2010-Q3 Exported Value in 2010-Q3,
thousands of USD
2010-Q3
Unit Value Unit Exported Quantity
Unit
'France 1 393 USD/T 10 766 7 729,1 Tons
'United States of America 2.12 USD/Kg 3 214 1 518 923 Kilograms
'Japan 2.66 USD/Kg 1 575 591 000 Kilograms
'China 2.01 USD/Kg 301 149 508 Kilograms
'Republic of Korea 2.83 USD/Kg 99 35 000 Kilograms
'Iceland 2.3 USD/Kg 46 20 000 Kilograms
'Turkey 2.25 USD/Kg 45 20 000 Kilograms
'Mexico 3 USD/Kg 15 5 000 Kilograms
'Brazil 2.75 USD/Kg 11 4 000 Kilograms
'Thailand 3.5 USD/Kg 7 2 000 Kilograms
Source: ITC calculations based on COMTRADE statistical data
6 Market News Service
Gum Arabic and Gum Resins
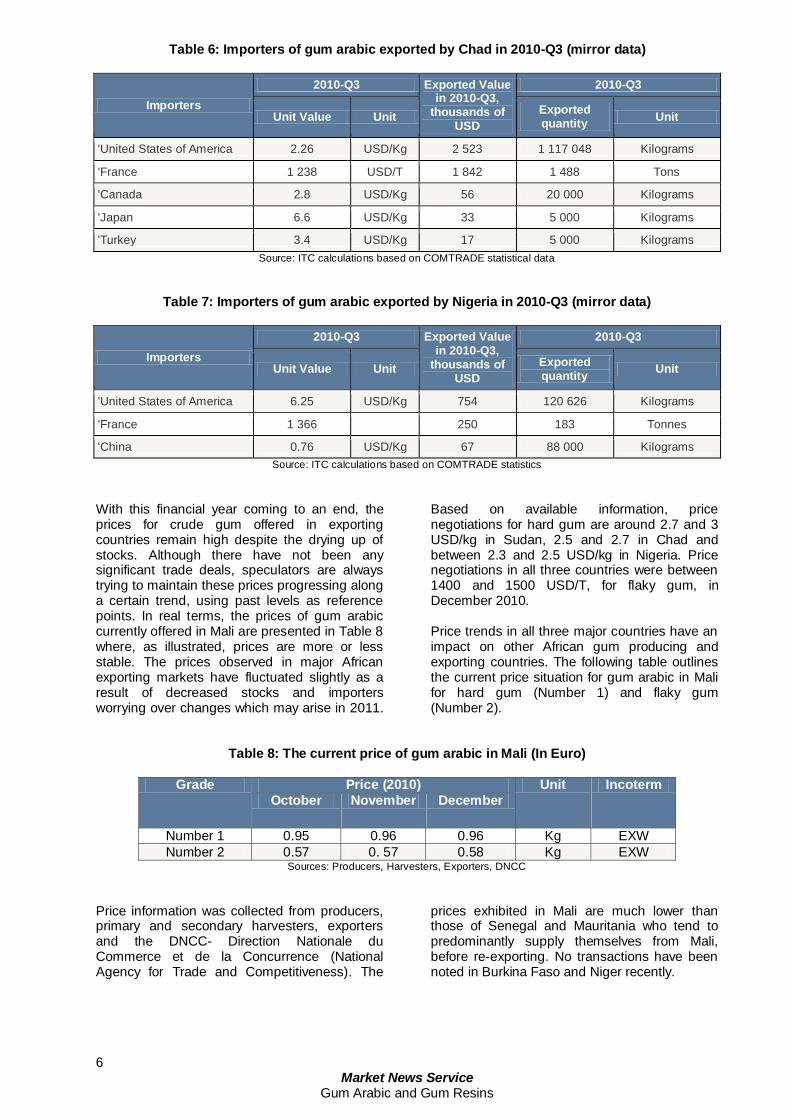
Table 6: Importers of gum arabic exported by Chad in 2010-Q3 (mirror data)
Importers
2010-Q3 Exported Value in 2010-Q3,
thousands of USD
2010-Q3
Unit Value Unit Exported quantity
Unit
'United States of America 2.26 USD/Kg 2 523 1 117 048 Kilograms
'France 1 238 USD/T 1 842 1 488 Tons
'Canada 2.8 USD/Kg 56 20 000 Kilograms
'Japan 6.6 USD/Kg 33 5 000 Kilograms
'Turkey 3.4 USD/Kg 17 5 000 Kilograms
Source: ITC calculations based on COMTRADE statistical data
Table 7: Importers of gum arabic exported by Nigeria in 2010-Q3 (mirror data)
Importers
2010-Q3 Exported Value in 2010-Q3,
thousands of USD
2010-Q3
Unit Value Unit Exported quantity
Unit
'United States of America 6.25 USD/Kg 754 120 626 Kilograms
'France 1 366
250 183 Tonnes
'China 0.76 USD/Kg 67 88 000 Kilograms
Source: ITC calculations based on COMTRADE statistics
With this financial year coming to an end, the prices for crude gum offered in exporting countries remain high despite the drying up of stocks. Although there have not been any significant trade deals, speculators are always trying to maintain these prices progressing along a certain trend, using past levels as reference points. In real terms, the prices of gum arabic currently offered in Mali are presented in Table 8 where, as illustrated, prices are more or less stable. The prices observed in major African exporting markets have fluctuated slightly as a result of decreased stocks and importers worrying over changes which may arise in 2011.
Based on available information, price negotiations for hard gum are around 2.7 and 3 USD/kg in Sudan, 2.5 and 2.7 in Chad and between 2.3 and 2.5 USD/kg in Nigeria. Price negotiations in all three countries were between 1400 and 1500 USD/T, for flaky gum, in December 2010. Price trends in all three major countries have an impact on other African gum producing and exporting countries. The following table outlines the current price situation for gum arabic in Mali for hard gum (Number 1) and flaky gum (Number 2).
Table 8: The current price of gum arabic in Mali (In Euro)
Grade Price (2010) Unit Incoterm
October November December
Number 1 0.95 0.96 0.96 Kg EXW
Number 2 0.57 0. 57 0.58 Kg EXW Sources: Producers, Harvesters, Exporters, DNCC
Price information was collected from producers, primary and secondary harvesters, exporters and the DNCC- Direction Nationale du Commerce et de la Concurrence (National Agency for Trade and Competitiveness). The
prices exhibited in Mali are much lower than those of Senegal and Mauritania who tend to predominantly supply themselves from Mali, before re-exporting. No transactions have been noted in Burkina Faso and Niger recently.
7
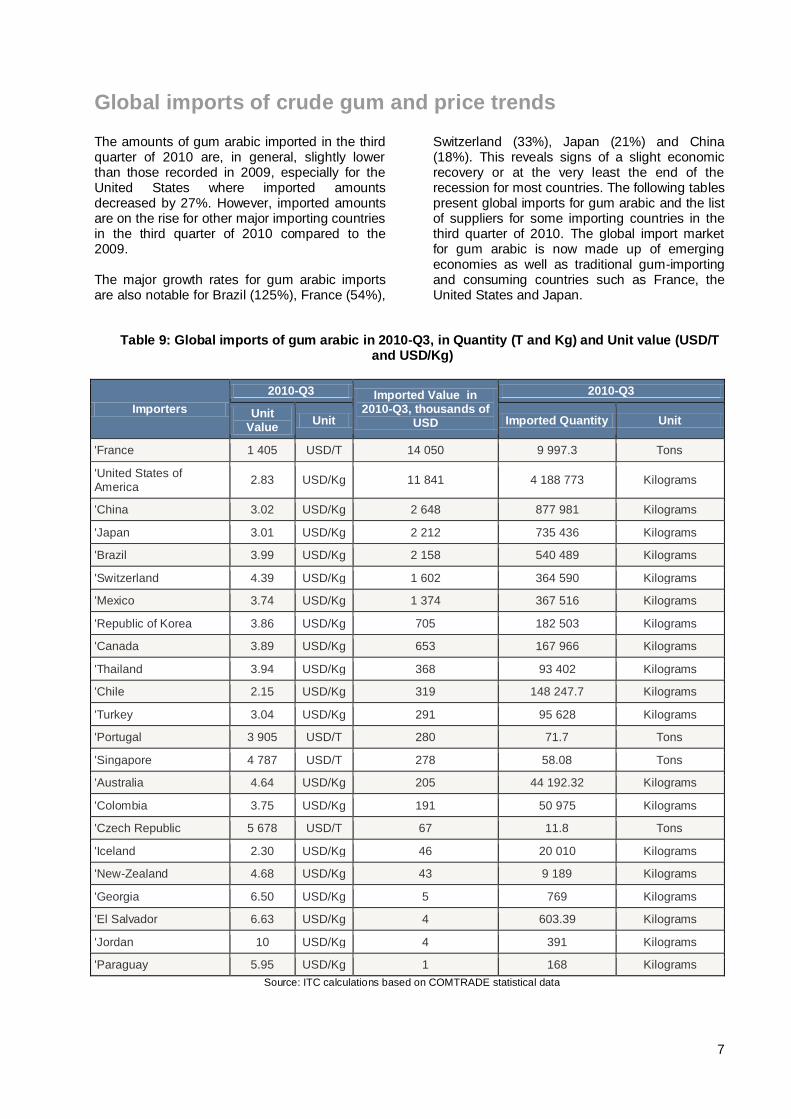
Global imports of crude gum and price trends The amounts of gum arabic imported in the third quarter of 2010 are, in general, slightly lower than those recorded in 2009, especially for the United States where imported amounts decreased by 27%. However, imported amounts are on the rise for other major importing countries in the third quarter of 2010 compared to the 2009. The major growth rates for gum arabic imports are also notable for Brazil (125%), France (54%),
Switzerland (33%), Japan (21%) and China (18%). This reveals signs of a slight economic recovery or at the very least the end of the recession for most countries. The following tables present global imports for gum arabic and the list of suppliers for some importing countries in the third quarter of 2010. The global import market for gum arabic is now made up of emerging economies as well as traditional gum-importing and consuming countries such as France, the United States and Japan.
Table 9: Global imports of gum arabic in 2010-Q3, in Quantity (T and Kg) and Unit value (USD/T and USD/Kg)
Importers
2010-Q3 Imported Value in 2010-Q3, thousands of
USD
2010-Q3
Unit Value
Unit Imported Quantity Unit
'France 1 405 USD/T 14 050 9 997.3 Tons
'United States of America
2.83 USD/Kg 11 841 4 188 773 Kilograms
'China 3.02 USD/Kg 2 648 877 981 Kilograms
'Japan 3.01 USD/Kg 2 212 735 436 Kilograms
'Brazil 3.99 USD/Kg 2 158 540 489 Kilograms
'Switzerland 4.39 USD/Kg 1 602 364 590 Kilograms
'Mexico 3.74 USD/Kg 1 374 367 516 Kilograms
'Republic of Korea 3.86 USD/Kg 705 182 503 Kilograms
'Canada 3.89 USD/Kg 653 167 966 Kilograms
'Thailand 3.94 USD/Kg 368 93 402 Kilograms
'Chile 2.15 USD/Kg 319 148 247.7 Kilograms
'Turkey 3.04 USD/Kg 291 95 628 Kilograms
'Portugal 3 905 USD/T 280 71.7 Tons
'Singapore 4 787 USD/T 278 58.08 Tons
'Australia 4.64 USD/Kg 205 44 192.32 Kilograms
'Colombia 3.75 USD/Kg 191 50 975 Kilograms
'Czech Republic 5 678 USD/T 67 11.8 Tons
'Iceland 2.30 USD/Kg 46 20 010 Kilograms
'New-Zealand 4.68 USD/Kg 43 9 189 Kilograms
'Georgia 6.50 USD/Kg 5 769 Kilograms
'El Salvador 6.63 USD/Kg 4 603.39 Kilograms
'Jordan 10 USD/Kg 4 391 Kilograms
'Paraguay 5.95 USD/Kg 1 168 Kilograms
Source: ITC calculations based on COMTRADE statistical data
8 Market News Service
Gum Arabic and Gum Resins
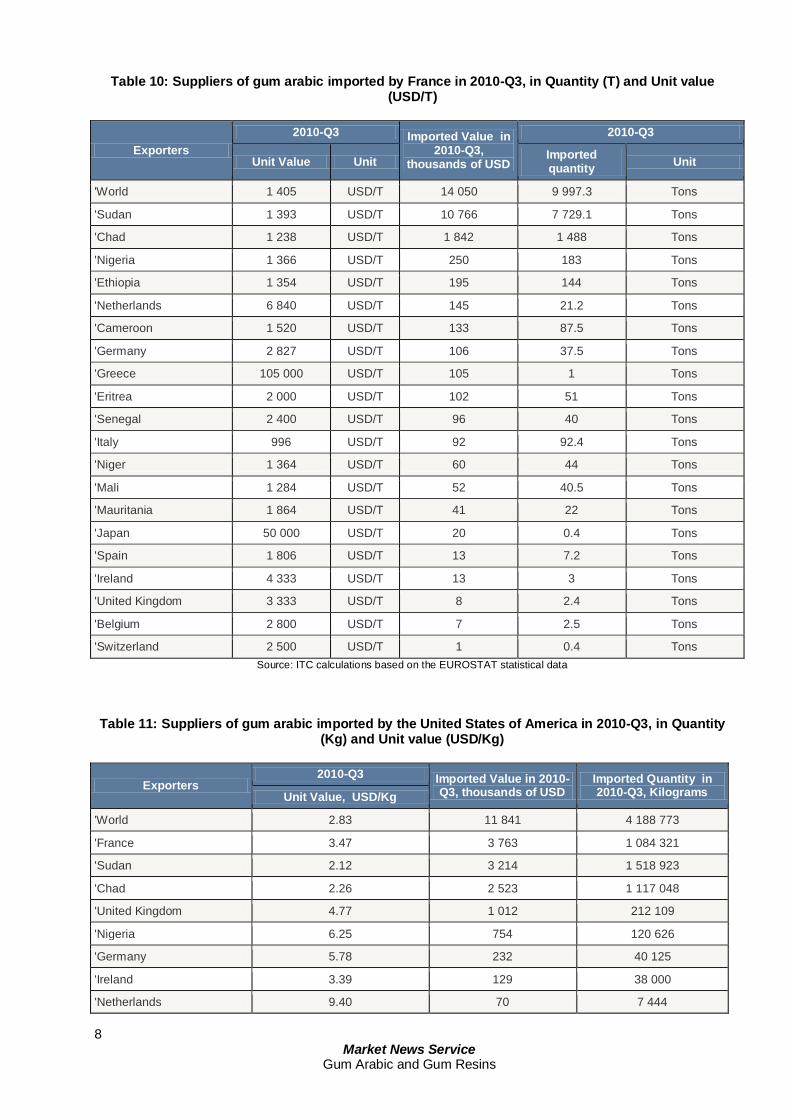
Table 10: Suppliers of gum arabic imported by France in 2010-Q3, in Quantity (T) and Unit value (USD/T)
Exporters
2010-Q3 Imported Value in 2010-Q3,
thousands of USD
2010-Q3
Unit Value Unit Imported quantity
Unit
'World 1 405 USD/T 14 050 9 997.3 Tons
'Sudan 1 393 USD/T 10 766 7 729.1 Tons
'Chad 1 238 USD/T 1 842 1 488 Tons
'Nigeria 1 366 USD/T 250 183 Tons
'Ethiopia 1 354 USD/T 195 144 Tons
'Netherlands 6 840 USD/T 145 21.2 Tons
'Cameroon 1 520 USD/T 133 87.5 Tons
'Germany 2 827 USD/T 106 37.5 Tons
'Greece 105 000 USD/T 105 1 Tons
'Eritrea 2 000 USD/T 102 51 Tons
'Senegal 2 400 USD/T 96 40 Tons
'Italy 996 USD/T 92 92.4 Tons
'Niger 1 364 USD/T 60 44 Tons
'Mali 1 284 USD/T 52 40.5 Tons
'Mauritania 1 864 USD/T 41 22 Tons
'Japan 50 000 USD/T 20 0.4 Tons
'Spain 1 806 USD/T 13 7.2 Tons
'Ireland 4 333 USD/T 13 3 Tons
'United Kingdom 3 333 USD/T 8 2.4 Tons
'Belgium 2 800 USD/T 7 2.5 Tons
'Switzerland 2 500 USD/T 1 0.4 Tons
Source: ITC calculations based on the EUROSTAT statistical data
Table 11: Suppliers of gum arabic imported by the United States of America in 2010-Q3, in Quantity (Kg) and Unit value (USD/Kg)
Exporters 2010-Q3 Imported Value in 2010-
Q3, thousands of USD Imported Quantity in 2010-Q3, Kilograms Unit Value, USD/Kg
'World 2.83 11 841 4 188 773
'France 3.47 3 763 1 084 321
'Sudan 2.12 3 214 1 518 923
'Chad 2.26 2 523 1 117 048
'United Kingdom 4.77 1 012 212 109
'Nigeria 6.25 754 120 626
'Germany 5.78 232 40 125
'Ireland 3.39 129 38 000
'Netherlands 9.40 70 7 444
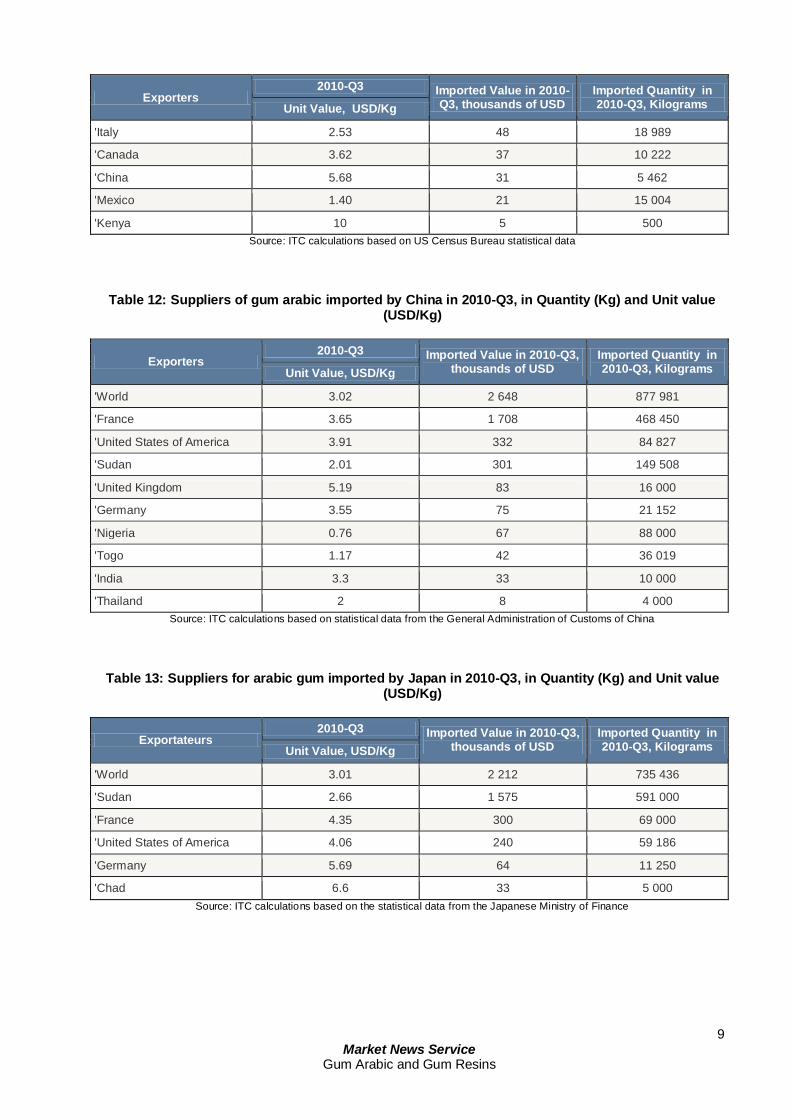
9 Market News Service
Gum Arabic and Gum Resins
Exporters 2010-Q3 Imported Value in 2010-
Q3, thousands of USD Imported Quantity in 2010-Q3, Kilograms Unit Value, USD/Kg
'Italy 2.53 48 18 989
'Canada 3.62 37 10 222
'China 5.68 31 5 462
'Mexico 1.40 21 15 004
'Kenya 10 5 500
Source: ITC calculations based on US Census Bureau statistical data
Table 12: Suppliers of gum arabic imported by China in 2010-Q3, in Quantity (Kg) and Unit value (USD/Kg)
Exporters 2010-Q3 Imported Value in 2010-Q3,
thousands of USD Imported Quantity in 2010-Q3, Kilograms Unit Value, USD/Kg
'World 3.02 2 648 877 981
'France 3.65 1 708 468 450
'United States of America 3.91 332 84 827
'Sudan 2.01 301 149 508
'United Kingdom 5.19 83 16 000
'Germany 3.55 75 21 152
'Nigeria 0.76 67 88 000
'Togo 1.17 42 36 019
'India 3.3 33 10 000
'Thailand 2 8 4 000
Source: ITC calculations based on statistical data from the General Administration of Customs of China
Table 13: Suppliers for arabic gum imported by Japan in 2010-Q3, in Quantity (Kg) and Unit value
(USD/Kg)
Exportateurs 2010-Q3 Imported Value in 2010-Q3,
thousands of USD Imported Quantity in 2010-Q3, Kilograms Unit Value, USD/Kg
'World 3.01 2 212 735 436
'Sudan 2.66 1 575 591 000
'France 4.35 300 69 000
'United States of America 4.06 240 59 186
'Germany 5.69 64 11 250
'Chad 6.6 33 5 000
Source: ITC calculations based on the statistical data from the Japanese Ministry of Finance
10 Market News Service
Gum Arabic and Gum Resins
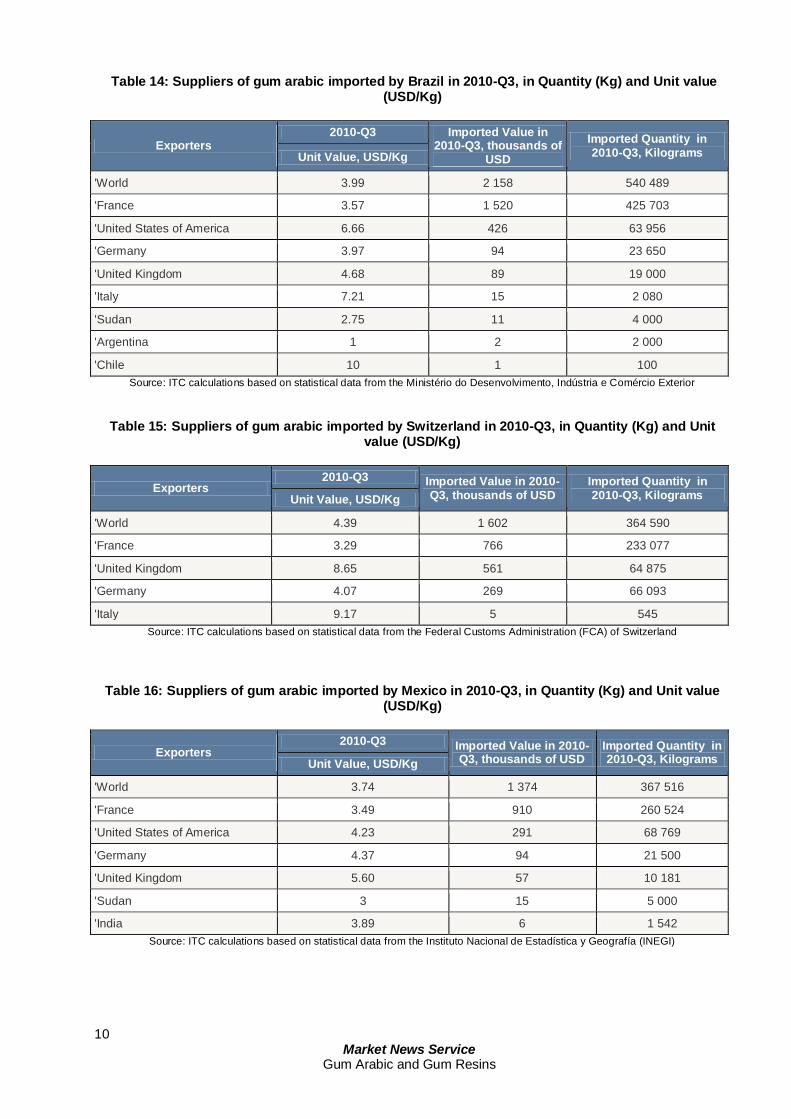
Table 14: Suppliers of gum arabic imported by Brazil in 2010-Q3, in Quantity (Kg) and Unit value (USD/Kg)
Exporters 2010-Q3 Imported Value in
2010-Q3, thousands of USD
Imported Quantity in 2010-Q3, Kilograms Unit Value, USD/Kg
'World 3.99 2 158 540 489
'France 3.57 1 520 425 703
'United States of America 6.66 426 63 956
'Germany 3.97 94 23 650
'United Kingdom 4.68 89 19 000
'Italy 7.21 15 2 080
'Sudan 2.75 11 4 000
'Argentina 1 2 2 000
'Chile 10 1 100
Source: ITC calculations based on statistical data from the Ministério do Desenvolvimento, Indústria e Comércio Exterior
Table 15: Suppliers of gum arabic imported by Switzerland in 2010-Q3, in Quantity (Kg) and Unit value (USD/Kg)
Exporters 2010-Q3 Imported Value in 2010-
Q3, thousands of USD Imported Quantity in 2010-Q3, Kilograms Unit Value, USD/Kg
'World 4.39 1 602 364 590
'France 3.29 766 233 077
'United Kingdom 8.65 561 64 875
'Germany 4.07 269 66 093
'Italy 9.17 5 545
Source: ITC calculations based on statistical data from the Federal Customs Administration (FCA) of Switzerland
Table 16: Suppliers of gum arabic imported by Mexico in 2010-Q3, in Quantity (Kg) and Unit value
(USD/Kg)
Exporters 2010-Q3 Imported Value in 2010-
Q3, thousands of USD Imported Quantity in 2010-Q3, Kilograms Unit Value, USD/Kg
'World 3.74 1 374 367 516
'France 3.49 910 260 524
'United States of America 4.23 291 68 769
'Germany 4.37 94 21 500
'United Kingdom 5.60 57 10 181
'Sudan 3 15 5 000
'India 3.89 6 1 542
Source: ITC calculations based on statistical data from the Instituto Nacional de Estadística y Geografía (INEGI)
11 Market News Service
Gum Arabic and Gum Resins
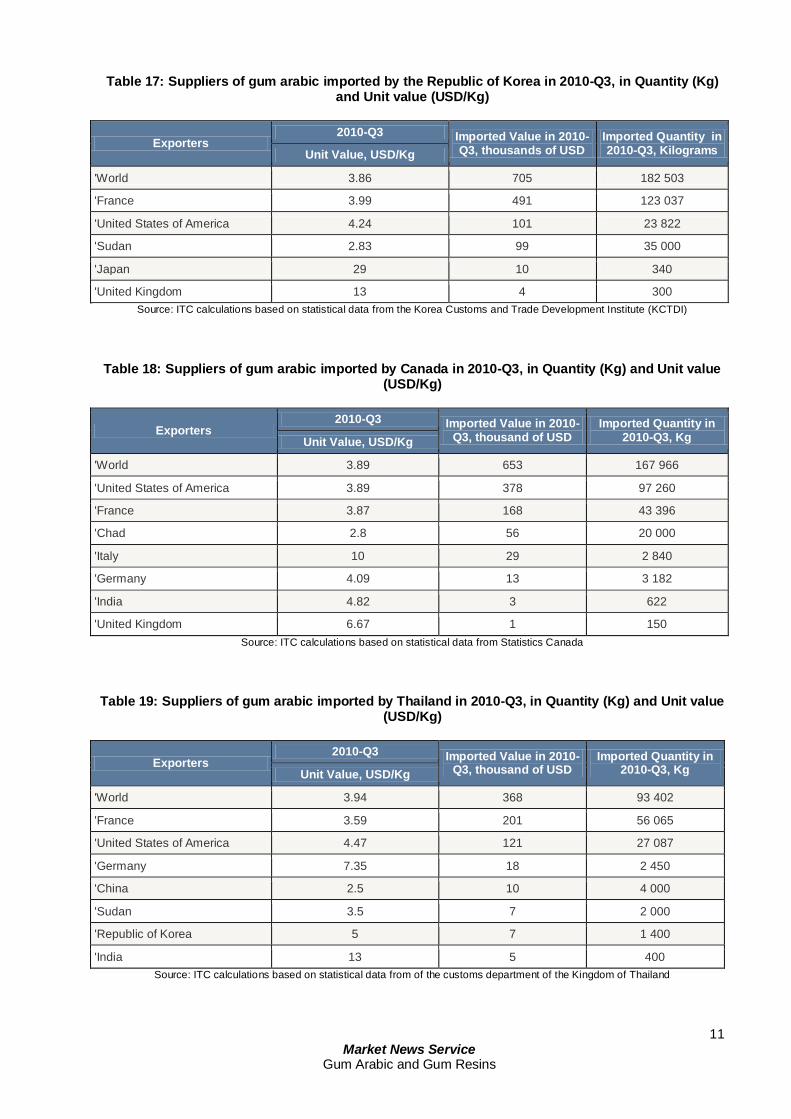
Table 17: Suppliers of gum arabic imported by the Republic of Korea in 2010-Q3, in Quantity (Kg) and Unit value (USD/Kg)
Exporters 2010-Q3 Imported Value in 2010-
Q3, thousands of USD Imported Quantity in 2010-Q3, Kilograms Unit Value, USD/Kg
'World 3.86 705 182 503
'France 3.99 491 123 037
'United States of America 4.24 101 23 822
'Sudan 2.83 99 35 000
'Japan 29 10 340
'United Kingdom 13 4 300
Source: ITC calculations based on statistical data from the Korea Customs and Trade Development Institute (KCTDI)
Table 18: Suppliers of gum arabic imported by Canada in 2010-Q3, in Quantity (Kg) and Unit value (USD/Kg)
Exporters 2010-Q3 Imported Value in 2010-
Q3, thousand of USD Imported Quantity in
2010-Q3, Kg Unit Value, USD/Kg
'World 3.89 653 167 966
'United States of America 3.89 378 97 260
'France 3.87 168 43 396
'Chad 2.8 56 20 000
'Italy 10 29 2 840
'Germany 4.09 13 3 182
'India 4.82 3 622
'United Kingdom 6.67 1 150
Source: ITC calculations based on statistical data from Statistics Canada
Table 19: Suppliers of gum arabic imported by Thailand in 2010-Q3, in Quantity (Kg) and Unit value (USD/Kg)
Exporters 2010-Q3 Imported Value in 2010-
Q3, thousand of USD Imported Quantity in
2010-Q3, Kg Unit Value, USD/Kg
'World 3.94 368 93 402
'France 3.59 201 56 065
'United States of America 4.47 121 27 087
'Germany 7.35 18 2 450
'China 2.5 10 4 000
'Sudan 3.5 7 2 000
'Republic of Korea 5 7 1 400
'India 13 5 400
Source: ITC calculations based on statistical data from of the customs department of the Kingdom of Thailand
12 Market News Service
Gum Arabic and Gum Resins
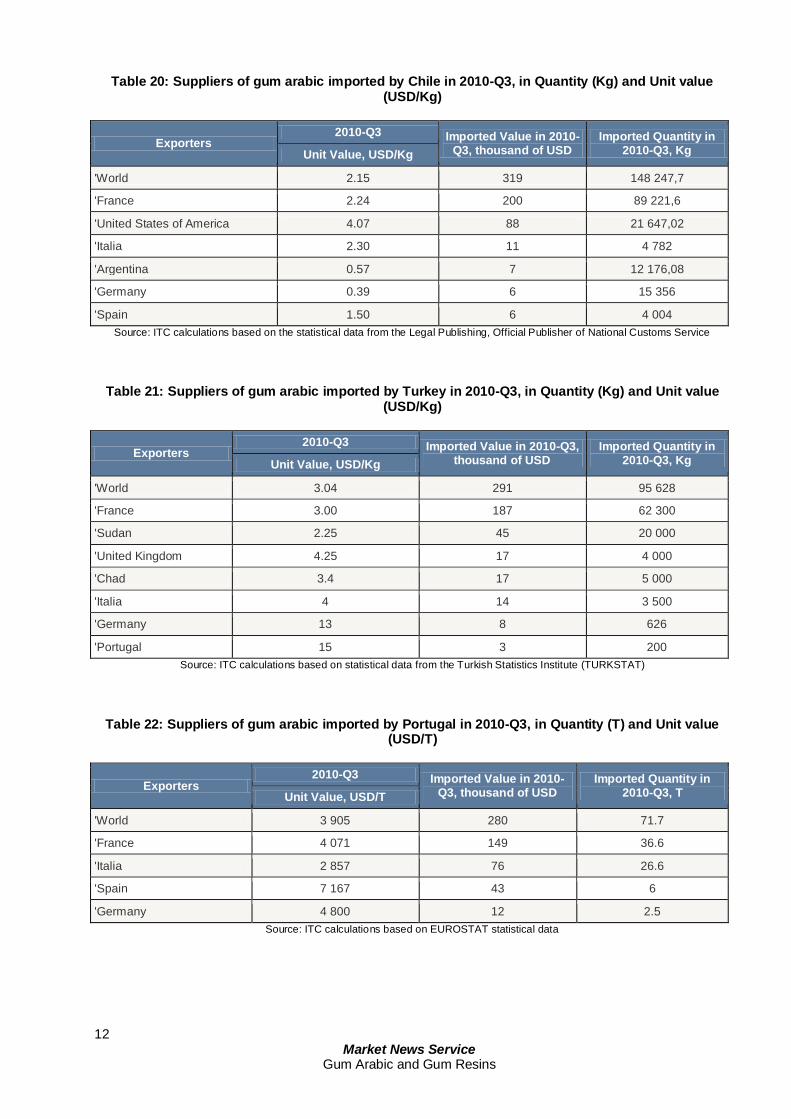
Table 20: Suppliers of gum arabic imported by Chile in 2010-Q3, in Quantity (Kg) and Unit value (USD/Kg)
Exporters 2010-Q3 Imported Value in 2010-
Q3, thousand of USD Imported Quantity in
2010-Q3, Kg Unit Value, USD/Kg
'World 2.15 319 148 247,7
'France 2.24 200 89 221,6
'United States of America 4.07 88 21 647,02
'Italia 2.30 11 4 782
'Argentina 0.57 7 12 176,08
'Germany 0.39 6 15 356
'Spain 1.50 6 4 004
Source: ITC calculations based on the statistical data from the Legal Publishing, Official Publisher of National Customs Service
Table 21: Suppliers of gum arabic imported by Turkey in 2010-Q3, in Quantity (Kg) and Unit value (USD/Kg)
Exporters 2010-Q3 Imported Value in 2010-Q3,
thousand of USD Imported Quantity in
2010-Q3, Kg Unit Value, USD/Kg
'World 3.04 291 95 628
'France 3.00 187 62 300
'Sudan 2.25 45 20 000
'United Kingdom 4.25 17 4 000
'Chad 3.4 17 5 000
'Italia 4 14 3 500
'Germany 13 8 626
'Portugal 15 3 200
Source: ITC calculations based on statistical data from the Turkish Statistics Institute (TURKSTAT)
Table 22: Suppliers of gum arabic imported by Portugal in 2010-Q3, in Quantity (T) and Unit value (USD/T)
Exporters 2010-Q3 Imported Value in 2010-
Q3, thousand of USD Imported Quantity in
2010-Q3, T Unit Value, USD/T
'World 3 905 280 71.7
'France 4 071 149 36.6
'Italia 2 857 76 26.6
'Spain 7 167 43 6
'Germany 4 800 12 2.5
Source: ITC calculations based on EUROSTAT statistical data
13 Market News Service
Gum Arabic and Gum Resins
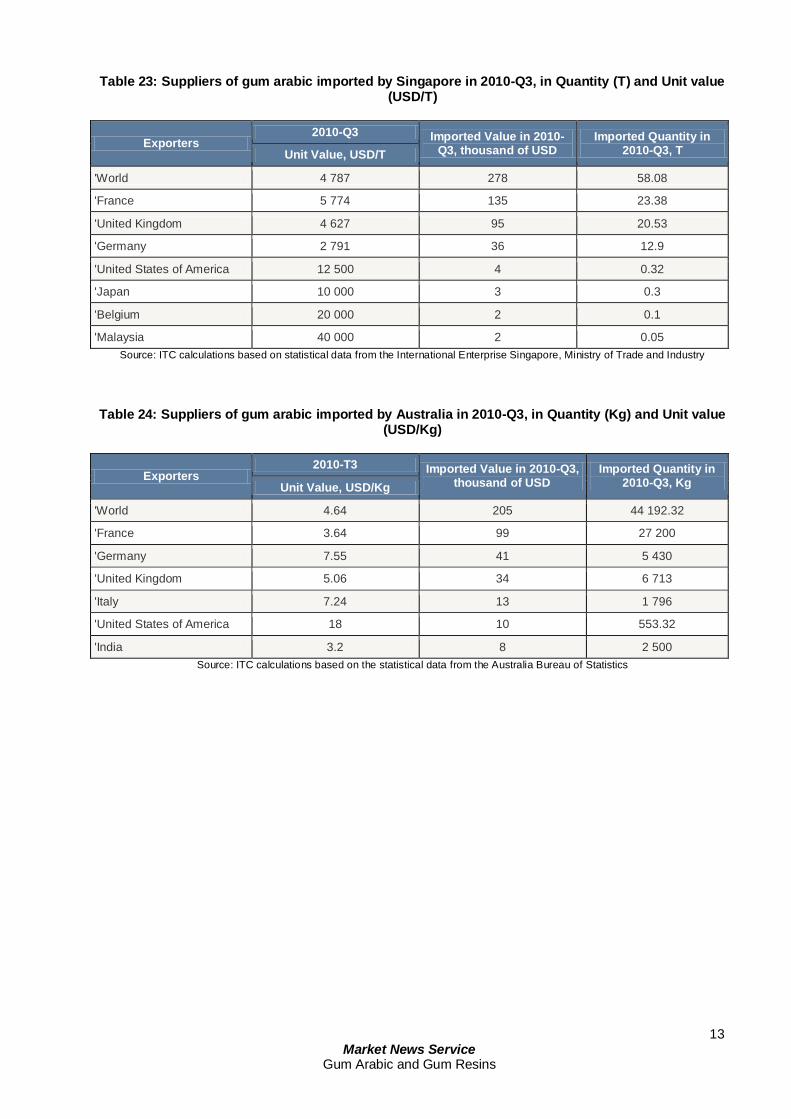
Table 23: Suppliers of gum arabic imported by Singapore in 2010-Q3, in Quantity (T) and Unit value (USD/T)
Exporters 2010-Q3 Imported Value in 2010-
Q3, thousand of USD Imported Quantity in
2010-Q3, T Unit Value, USD/T
'World 4 787 278 58.08
'France 5 774 135 23.38
'United Kingdom 4 627 95 20.53
'Germany 2 791 36 12.9
'United States of America 12 500 4 0.32
'Japan 10 000 3 0.3
'Belgium 20 000 2 0.1
'Malaysia 40 000 2 0.05
Source: ITC calculations based on statistical data from the International Enterprise Singapore, Ministry of Trade and Industry
Table 24: Suppliers of gum arabic imported by Australia in 2010-Q3, in Quantity (Kg) and Unit value (USD/Kg)
Exporters 2010-T3 Imported Value in 2010-Q3,
thousand of USD Imported Quantity in
2010-Q3, Kg Unit Value, USD/Kg
'World 4.64 205 44 192.32
'France 3.64 99 27 200
'Germany 7.55 41 5 430
'United Kingdom 5.06 34 6 713
'Italy 7.24 13 1 796
'United States of America 18 10 553.32
'India 3.2 8 2 500
Source: ITC calculations based on the statistical data from the Australia Bureau of Statistics
14 Market News Service
Gum Arabic and Gum Resins
FACTORS AFFECTING THE GLOBAL MARKET
Gum Arabic
Climate conditions The exceptional pluviometry recorded in the Sahel was mentioned in the previous edition of the report. Predictions made have turned out to correct. Although it is too early to predict the what the agricultural output will be, it promises to be good although some areas are likely to experience shortages. But the situation remains uncertain, according to experts, because although the rains lasted longer than expected, they began late. The direct effects were quickly felt on gum arabic production as the harvest of acacia senegal (the species which produces gum of good quality) was delayed in the major production zones of Mali and other gum-producing countries where the monsoon was present. As a result, gum arabic production and beginning of the 2010-2011 crop year will be delayed.
The indirect effect of the abundance in rainfall will be on the enthusiasm of peasants/farmers in production zones that are usually less disposed to gum cultivation. This is valid especially if gum arabic prices remain non-lucrative but also because the agricultural output for food products has been particularly good, yielding ample stockpiles. Another positive aspect of the abundance in pluviometry on gum plantations, which have been heavily impacted by climate change for a few years, will be the healthy state of pastures. This will relieve pressure on aerial fodder which very often consists of Acacia species trees.
Legal aspects The most favourable news in this domain is the adoption of the REDD+ (Reducing Emissions from Deforestation and Forest Degradation) plan at the Cancun summit (Mexico) on climate change. The objective of this mechanism is to improve the living conditions of rural populations in developing countries (including all gum-producing countries) and preserve the ecosystems in countries that use non-sustainable production and harvesting methods yielding carbon emission. As a reminder, these emissions
represent close to 25% of the total global greenhouse gas emissions. In addition to this plan, a climate change fund will be created to assist countries affected by climate change. This will allow them to better cope with the effects of climate change through the financing of targeted programs, the transfer of technology and international cooperation/collaboration. These mechanisms will increase the surface area and management, particularly for gum plantations situated on the outskirts of fragile ecosystems.
The international financial and economic crisis It is increasingly being acknowledged that the worse of the crisis is over although growth is still slow. According to the World Bank, developing countries will overtake developed countries around 2015, in terms of economic share, as
they are currently beginning to exhibit growth.
In a recent publication by World Bank economists entitled “The Day After Tomorrow: A Handbook on the Future of Economic Policy in the Developing World” suggests that close to half of the global growth is to be attributed to
developing countries.
According to current projections, these will overtake developed countries in terms of economic share around 2015. “Developing countries have rescued the global economy”, said Otaviano Canuto, vice-president of Poverty Reduction and Economic Management (PREM) at the World Bank and one of the co-directors of this publication. “They are the ones that are currently driving global growth at a time when high-income countries are stagnating. “ According to the estimates put forward in this publication, the growth of developing countries
15 Market News Service
Gum Arabic and Gum Resins
should hit 6.1% in 2010, 5.9% in 2011, and 6.1% in 2012 and should be 2.3%, 2.4% and 2.6%, respectively for developed countries during the same period. These differing growth rates are expected over the mid-term. This is the result of the following five factors: the faster acquisition of the technological process in developing countries, growth of the middle-class, increase in South-South trade, the increase in the prices of basic products/commodities, as well as the proper maintenance of public account balances, which will allow them to borrow and invest in infrastructure. “The future is promising for the developing world”, according to the other co-director of the publication, Marcelo Guigale, who supervises the activities of the World Bank’s PREM network activities in the Latin American and the Caribbean regions. “The balancing of global growth to include a greater number of driving elements will give more importance to developing countries. This will also modify their policy situations: on average, one is set to witness a strengthening in economic management and an improvement in public administration, which will hopefully hint the beginning of the end of poverty.“ The study suggests that developing countries should take advantage of their relatively more
healthy public finances to promote growth which will be beneficial for all. This will involve more targeted social programs, the need to ensure equal opportunities for their citizens and that they establish a more business-friendly climate in the formal sector of their economies. Additionally, a good number of additional future trends for developing countries are mentioned in this publication including : an upturn in the transfer of funds from their labour force abroad, an increase in South-South trade, an increase in the investment of state funds, more careful debt management and for many of these countries, an increase in public opinion of their leaders. According to the publication, regions such as East Asia, Latin America, South Asia, or in the near future, Africa, all have the needed potential to reach the level of “newly developed” regions. In sub-Saharan Africa, the poorest region of the world, the crisis contributed to pushing 7-10 million additional people into poverty. However, the outlook for stronger growth is positive, as long as the countries remain determined to apply wise policies. This will involve address infrastructure problems, job creation, governance and shrinking aid.
16 Market News Service
Gum Arabic and Gum Resins
CONCLUSION
Gum Arabic The trends observed among importers and exporters for gum arabic, over the course of this quarter, show positive developments although full activity is not yet attained. In reference to the previously discussed World Bank publication analyzing the economic crisis, one may be optimistic about the future of developing economies. This viewpoint is supported by the fact that almost all these economies are based on the primary sector for which significant growth is projected.
Consequently, gum arabic producing countries should strengthen their production capacities by improving, among other things, their trade-related infrastructure to meet the demand. These countries should look into policies to eliminate supply-side constraints in order to take advantage of the benefits of export development, especially in the gum arabic sector.
17 Market News Service
Gum Arabic and Gum Resins
II. THE GLOBAL MARKET
Gum Resins
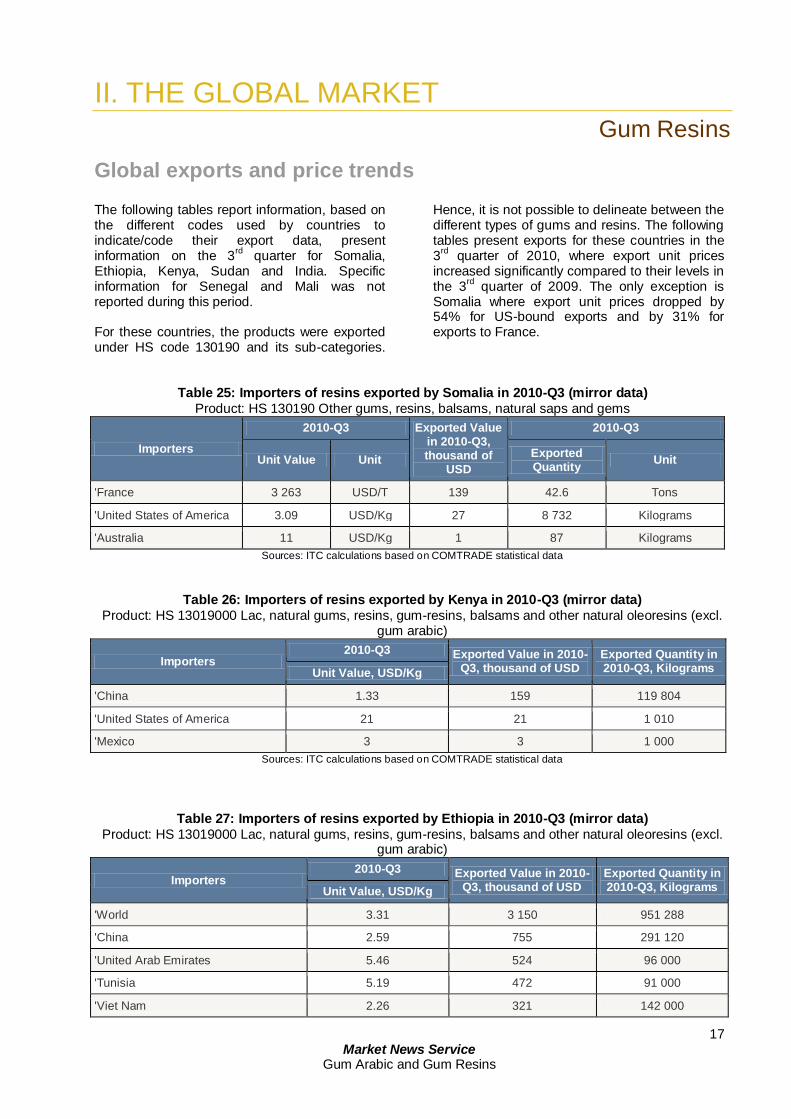
Global exports and price trends The following tables report information, based on the different codes used by countries to indicate/code their export data, present information on the 3
rd quarter for Somalia,
Ethiopia, Kenya, Sudan and India. Specific information for Senegal and Mali was not reported during this period. For these countries, the products were exported under HS code 130190 and its sub-categories.
Hence, it is not possible to delineate between the different types of gums and resins. The following tables present exports for these countries in the 3
rd quarter of 2010, where export unit prices
increased significantly compared to their levels in the 3
rd quarter of 2009. The only exception is
Somalia where export unit prices dropped by 54% for US-bound exports and by 31% for exports to France.
Table 25: Importers of resins exported by Somalia in 2010-Q3 (mirror data)
Product: HS 130190 Other gums, resins, balsams, natural saps and gems
Importers
2010-Q3 Exported Value in 2010-Q3, thousand of
USD
2010-Q3
Unit Value Unit Exported Quantity
Unit
'France 3 263 USD/T 139 42.6 Tons
'United States of America 3.09 USD/Kg 27 8 732 Kilograms
'Australia 11 USD/Kg 1 87 Kilograms
Sources: ITC calculations based on COMTRADE statistical data
Table 26: Importers of resins exported by Kenya in 2010-Q3 (mirror data)
Product: HS 13019000 Lac, natural gums, resins, gum-resins, balsams and other natural oleoresins (excl. gum arabic)
Importers 2010-Q3 Exported Value in 2010-
Q3, thousand of USD Exported Quantity in 2010-Q3, Kilograms Unit Value, USD/Kg
'China 1.33 159 119 804
'United States of America 21 21 1 010
'Mexico 3 3 1 000
Sources: ITC calculations based on COMTRADE statistical data
Table 27: Importers of resins exported by Ethiopia in 2010-Q3 (mirror data)
Product: HS 13019000 Lac, natural gums, resins, gum-resins, balsams and other natural oleoresins (excl. gum arabic)
Importers 2010-Q3 Exported Value in 2010-
Q3, thousand of USD Exported Quantity in 2010-Q3, Kilograms Unit Value, USD/Kg
'World 3.31 3 150 951 288
'China 2.59 755 291 120
'United Arab Emirates 5.46 524 96 000
'Tunisia 5.19 472 91 000
'Viet Nam 2.26 321 142 000
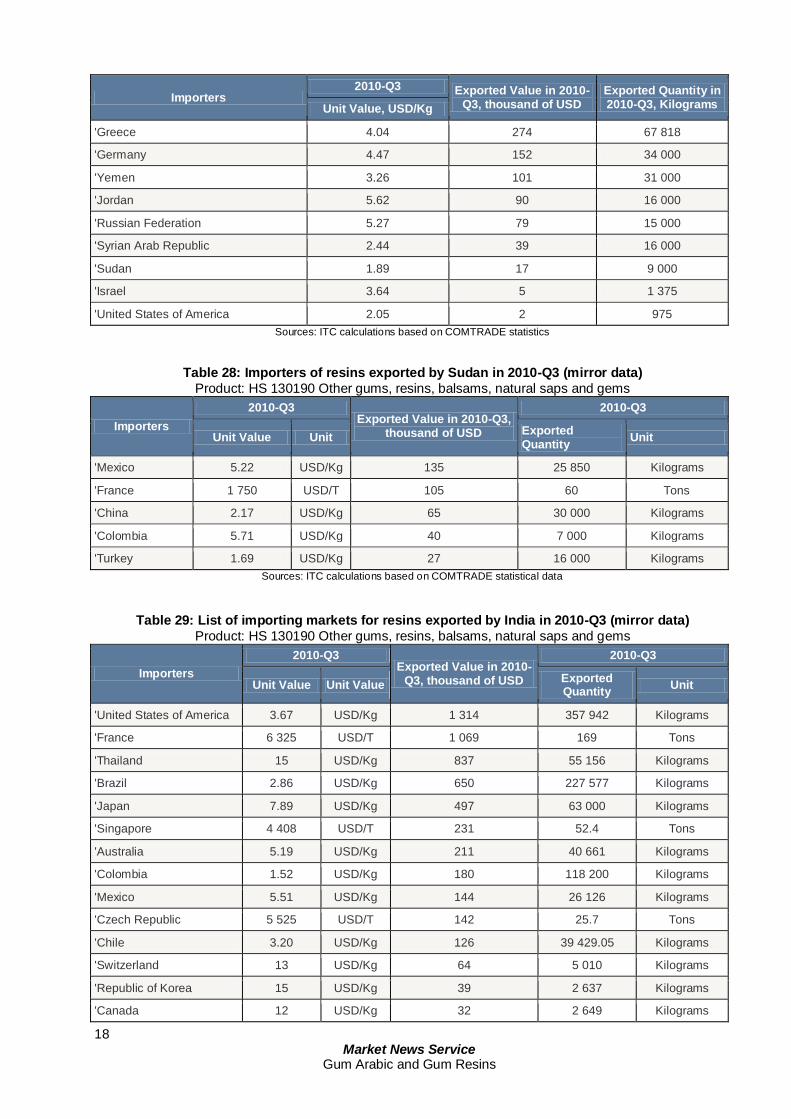
18 Market News Service
Gum Arabic and Gum Resins
Importers 2010-Q3 Exported Value in 2010-
Q3, thousand of USD Exported Quantity in 2010-Q3, Kilograms Unit Value, USD/Kg
'Greece 4.04 274 67 818
'Germany 4.47 152 34 000
'Yemen 3.26 101 31 000
'Jordan 5.62 90 16 000
'Russian Federation 5.27 79 15 000
'Syrian Arab Republic 2.44 39 16 000
'Sudan 1.89 17 9 000
'Israel 3.64 5 1 375
'United States of America 2.05 2 975
Sources: ITC calculations based on COMTRADE statistics
Table 28: Importers of resins exported by Sudan in 2010-Q3 (mirror data)
Product: HS 130190 Other gums, resins, balsams, natural saps and gems
Importers
2010-Q3 Exported Value in 2010-Q3,
thousand of USD
2010-Q3
Unit Value Unit Exported Quantity
Unit
'Mexico 5.22 USD/Kg 135 25 850 Kilograms
'France 1 750 USD/T 105 60 Tons
'China 2.17 USD/Kg 65 30 000 Kilograms
'Colombia 5.71 USD/Kg 40 7 000 Kilograms
'Turkey 1.69 USD/Kg 27 16 000 Kilograms
Sources: ITC calculations based on COMTRADE statistical data
Table 29: List of importing markets for resins exported by India in 2010-Q3 (mirror data)
Product: HS 130190 Other gums, resins, balsams, natural saps and gems
Importers
2010-Q3 Exported Value in 2010-
Q3, thousand of USD
2010-Q3
Unit Value Unit Value Exported Quantity
Unit
'United States of America 3.67 USD/Kg 1 314 357 942 Kilograms
'France 6 325 USD/T 1 069 169 Tons
'Thailand 15 USD/Kg 837 55 156 Kilograms
'Brazil 2.86 USD/Kg 650 227 577 Kilograms
'Japan 7.89 USD/Kg 497 63 000 Kilograms
'Singapore 4 408 USD/T 231 52.4 Tons
'Australia 5.19 USD/Kg 211 40 661 Kilograms
'Colombia 1.52 USD/Kg 180 118 200 Kilograms
'Mexico 5.51 USD/Kg 144 26 126 Kilograms
'Czech Republic 5 525 USD/T 142 25.7 Tons
'Chile 3.20 USD/Kg 126 39 429.05 Kilograms
'Switzerland 13 USD/Kg 64 5 010 Kilograms
'Republic of Korea 15 USD/Kg 39 2 637 Kilograms
'Canada 12 USD/Kg 32 2 649 Kilograms
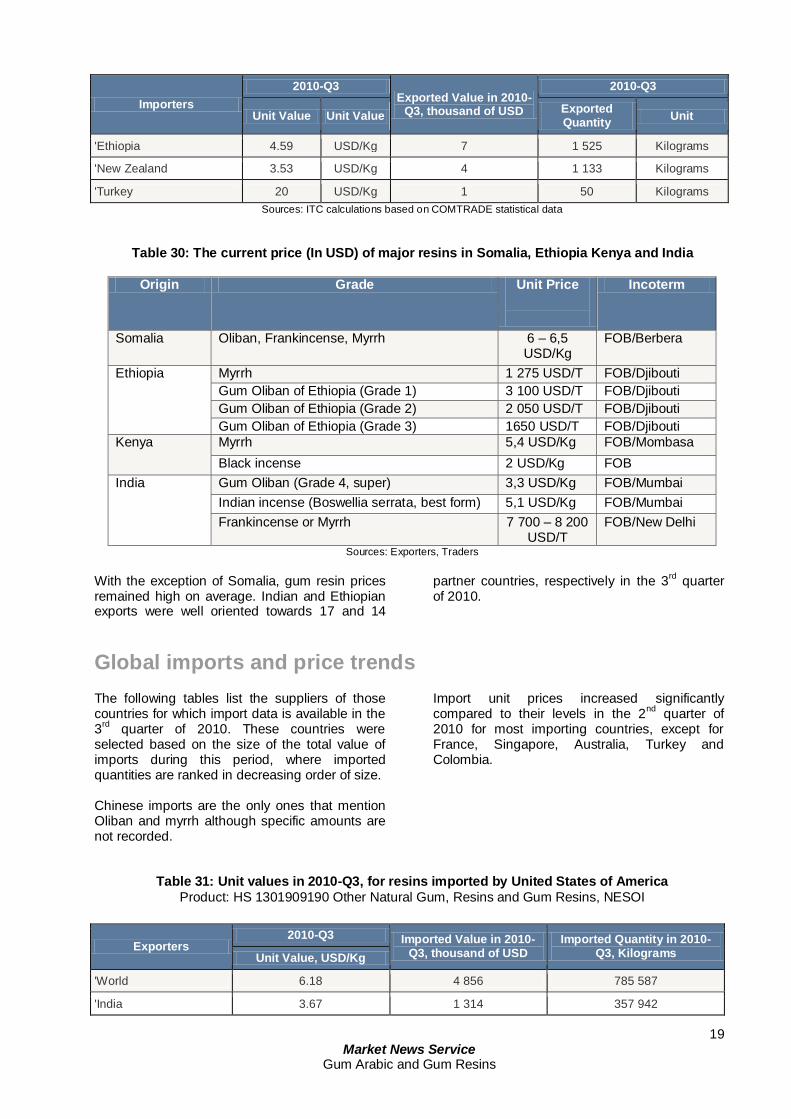
19 Market News Service
Gum Arabic and Gum Resins
Importers
2010-Q3 Exported Value in 2010-
Q3, thousand of USD
2010-Q3
Unit Value Unit Value Exported Quantity
Unit
'Ethiopia 4.59 USD/Kg 7 1 525 Kilograms
'New Zealand 3.53 USD/Kg 4 1 133 Kilograms
'Turkey 20 USD/Kg 1 50 Kilograms
Sources: ITC calculations based on COMTRADE statistical data
Table 30: The current price (In USD) of major resins in Somalia, Ethiopia Kenya and India
Origin Grade Unit Price
Incoterm
Somalia Oliban, Frankincense, Myrrh 6 – 6,5 USD/Kg
FOB/Berbera
Ethiopia Myrrh 1 275 USD/T FOB/Djibouti
Gum Oliban of Ethiopia (Grade 1) 3 100 USD/T FOB/Djibouti
Gum Oliban of Ethiopia (Grade 2) 2 050 USD/T FOB/Djibouti
Gum Oliban of Ethiopia (Grade 3) 1650 USD/T FOB/Djibouti
Kenya Myrrh 5,4 USD/Kg FOB/Mombasa
Black incense 2 USD/Kg FOB
India Gum Oliban (Grade 4, super) 3,3 USD/Kg FOB/Mumbai
Indian incense (Boswellia serrata, best form) 5,1 USD/Kg FOB/Mumbai
Frankincense or Myrrh 7 700 – 8 200 USD/T
FOB/New Delhi
Sources: Exporters, Traders
With the exception of Somalia, gum resin prices remained high on average. Indian and Ethiopian exports were well oriented towards 17 and 14
partner countries, respectively in the 3rd
quarter of 2010.
Global imports and price trends
The following tables list the suppliers of those countries for which import data is available in the 3
rd quarter of 2010. These countries were
selected based on the size of the total value of imports during this period, where imported quantities are ranked in decreasing order of size. Chinese imports are the only ones that mention Oliban and myrrh although specific amounts are not recorded.
Import unit prices increased significantly compared to their levels in the 2
nd quarter of
2010 for most importing countries, except for France, Singapore, Australia, Turkey and Colombia.
Table 31: Unit values in 2010-Q3, for resins imported by United States of America
Product: HS 1301909190 Other Natural Gum, Resins and Gum Resins, NESOI
Exporters 2010-Q3 Imported Value in 2010-
Q3, thousand of USD Imported Quantity in 2010-
Q3, Kilograms Unit Value, USD/Kg
'World 6.18 4 856 785 587
'India 3.67 1 314 357 942

20 Market News Service
Gum Arabic and Gum Resins
Exporters 2010-Q3 Imported Value in 2010-
Q3, thousand of USD Imported Quantity in 2010-
Q3, Kilograms Unit Value, USD/Kg
'China 6.49 1 231 189 745
'Germany 27 753 27 771
'Canada 5.17 397 76 727
'Thailand 6.31 250 39 646
'Switzerland 13 192 14 904
'El Salvador 15 150 10 337
'Spain 4.97 100 20 122
'Australia 469 92 196
'Indonesia 4.43 78 17 590
'France 7.37 67 9 092
'Honduras 37 41 1 112
'Singapore 5.37 36 6 700
'United Kingdom 24 35 1 489
'Somalia 3.09 27 8 732
'Denmark 131 23 175
'Kenya 21 21 1 010
'Israel 950 19 20
'Brazil 15 19 1 299
'Japan 10 8 800
'Oman 22 4 178
Sources: ITC calculations based on US CENSUS Bureau statistical data
Table 32: Unit values in 2010-Q3, for resins imported by France
Product: HS 13019000 Natural Gums, Resins, Gum-Resins, Balsams and Other Natural Oleoresins (Excl. Gum Arabic)
Exporters
2010-Q3 Imported Value in 2010-Q3,
thousand of USD
2010-Q3
Unit Value Unit Imported Quantity
Unit
'World 4 851 USD/T 4 766 982.4 Tons
'India 6 325 USD/T 1 069 169 Tons
'Islamic Republic of Iran 9 552 USD/T 554 58 Tons
'Germany 9 004 USD/T 470 52.2 Tons
'Indonesia 8 352 USD/T 304 36.4 Tons
'Greece 105 714 USD/T 296 2.8 Tons
'Brazil 1 291 USD/T 236 182.8 Tons
'Madagascar 1 035 USD/T 219 211.6 Tons
'Democratic Republic of Laos 21 358 USD/T 173 8.1 Tons
'United Kingdom 10 377 USD/T 165 15.9 Tons
'Spain 13 727 USD/T 151 11 Tons
21 Market News Service
Gum Arabic and Gum Resins
Exporters
2010-Q3 Imported Value in 2010-Q3,
thousand of USD
2010-Q3
Unit Value Unit Imported Quantity
Unit
'Honduras 27 736 USD/T 147 5.3 Tons
'Somalia 3 263 USD/T 139 42.6 Tons
'Yemen 4 462 USD/T 116 26 Tons
'Sudan 1 750 USD/T 105 60 Tons
'Malaysia 10 375 USD/T 83 8 Tons
'Netherlands 4 020 USD/T 82 20.4 Tons
'Senegal 4 901 USD/T 74 15.1 Tons
'Syrian Arab Republic 6 452 USD/T 60 9.3 Tons
'Belgium 51 111 USD/T 46 0.9 Tons
'Turkey 71 667 USD/T 43 0.6 Tons
'Mali 3 636 USD/T 40 11 Tons
'Italy 2 564 USD/T 40 15.6 Tons
'Ethiopia 3 700 USD/T 37 10 Tons
'Mexico 210 000 USD/T 21 0.1 Tons
'Afghanistan 22 857 USD/T 16 0.7 Tons
'Philippines 3 000 USD/T 15 5 Tons
Sources: ITC calculations based on EUROSTAT statistical data
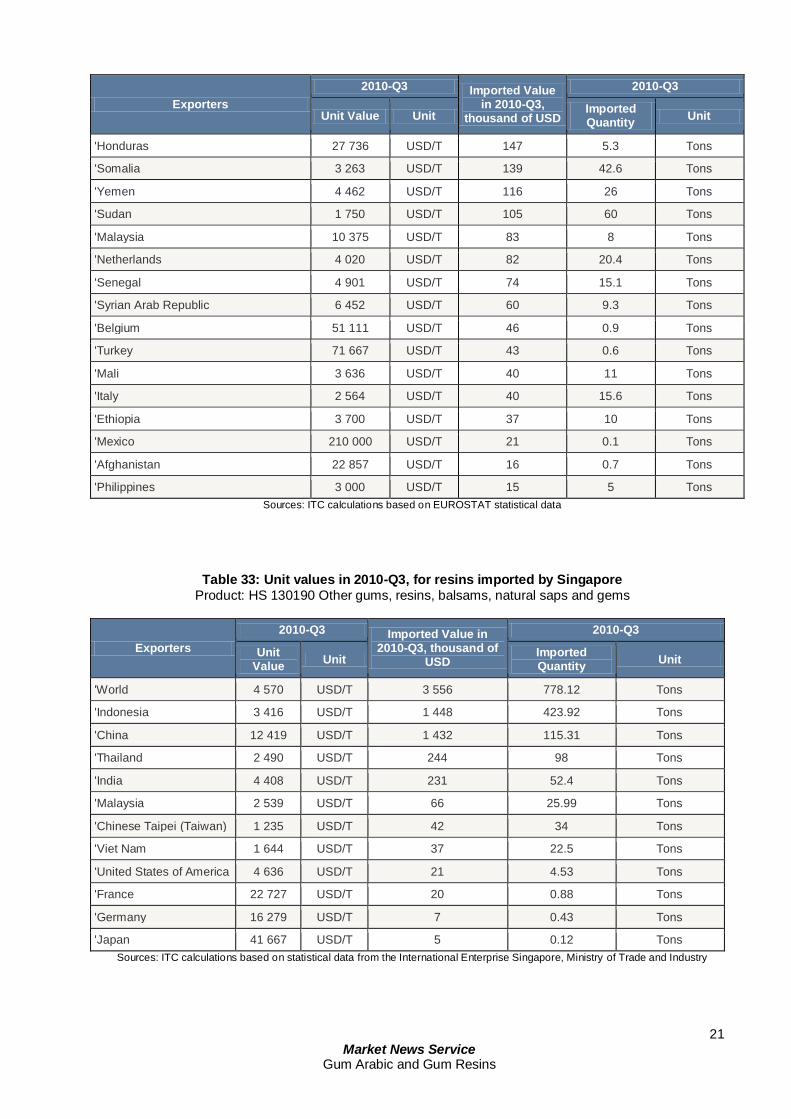
Table 33: Unit values in 2010-Q3, for resins imported by Singapore
Product: HS 130190 Other gums, resins, balsams, natural saps and gems
Exporters
2010-Q3 Imported Value in 2010-Q3, thousand of
USD
2010-Q3
Unit Value
Unit Imported Quantity
Unit
'World 4 570 USD/T 3 556 778.12 Tons
'Indonesia 3 416 USD/T 1 448 423.92 Tons
'China 12 419 USD/T 1 432 115.31 Tons
'Thailand 2 490 USD/T 244 98 Tons
'India 4 408 USD/T 231 52.4 Tons
'Malaysia 2 539 USD/T 66 25.99 Tons
'Chinese Taipei (Taiwan) 1 235 USD/T 42 34 Tons
'Viet Nam 1 644 USD/T 37 22.5 Tons
'United States of America 4 636 USD/T 21 4.53 Tons
'France 22 727 USD/T 20 0.88 Tons
'Germany 16 279 USD/T 7 0.43 Tons
'Japan 41 667 USD/T 5 0.12 Tons
Sources: ITC calculations based on statistical data from the International Enterprise Singapore, Ministry of Trade and Industry
22 Market News Service
Gum Arabic and Gum Resins
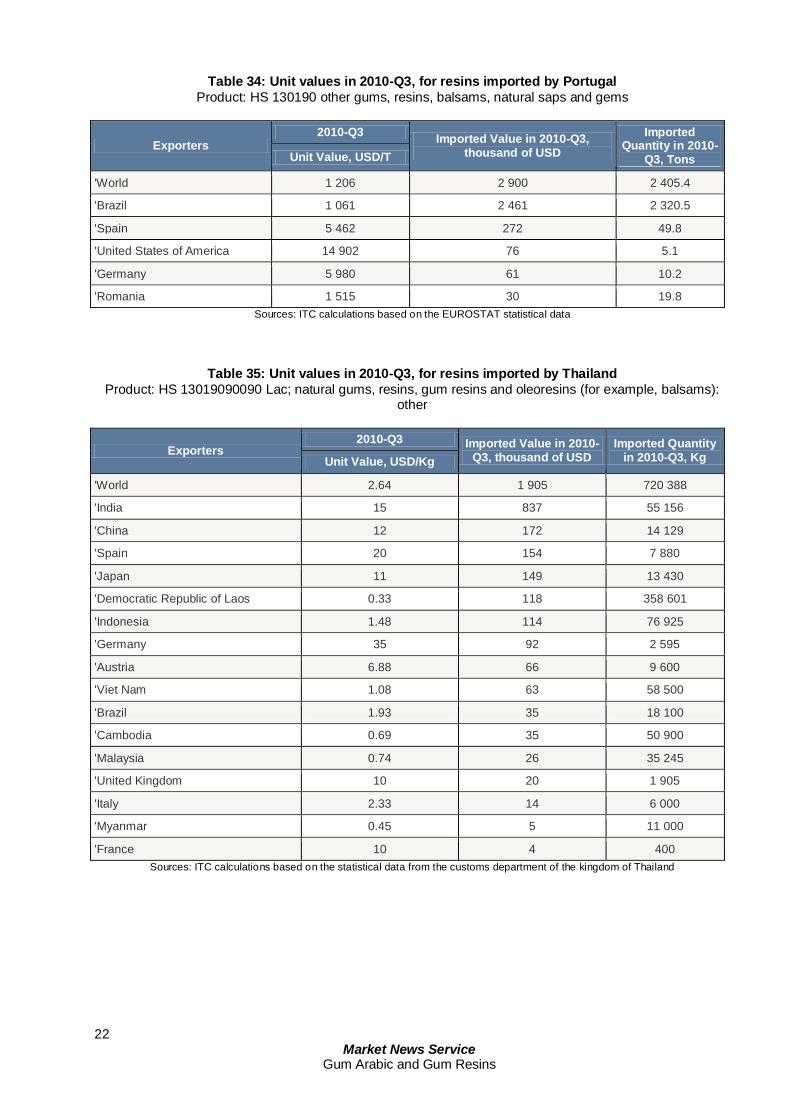
Table 34: Unit values in 2010-Q3, for resins imported by Portugal
Product: HS 130190 other gums, resins, balsams, natural saps and gems
Exporters 2010-Q3
Imported Value in 2010-Q3, thousand of USD
Imported Quantity in 2010-
Q3, Tons Unit Value, USD/T
'World 1 206 2 900 2 405.4
'Brazil 1 061 2 461 2 320.5
'Spain 5 462 272 49.8
'United States of America 14 902 76 5.1
'Germany 5 980 61 10.2
'Romania 1 515 30 19.8
Sources: ITC calculations based on the EUROSTAT statistical data
Table 35: Unit values in 2010-Q3, for resins imported by Thailand
Product: HS 13019090090 Lac; natural gums, resins, gum resins and oleoresins (for example, balsams): other
Exporters 2010-Q3 Imported Value in 2010-
Q3, thousand of USD Imported Quantity
in 2010-Q3, Kg Unit Value, USD/Kg
'World 2.64 1 905 720 388
'India 15 837 55 156
'China 12 172 14 129
'Spain 20 154 7 880
'Japan 11 149 13 430
'Democratic Republic of Laos 0.33 118 358 601
'Indonesia 1.48 114 76 925
'Germany 35 92 2 595
'Austria 6.88 66 9 600
'Viet Nam 1.08 63 58 500
'Brazil 1.93 35 18 100
'Cambodia 0.69 35 50 900
'Malaysia 0.74 26 35 245
'United Kingdom 10 20 1 905
'Italy 2.33 14 6 000
'Myanmar 0.45 5 11 000
'France 10 4 400
Sources: ITC calculations based on the statistical data from the customs department of the kingdom of Thailand
23 Market News Service
Gum Arabic and Gum Resins
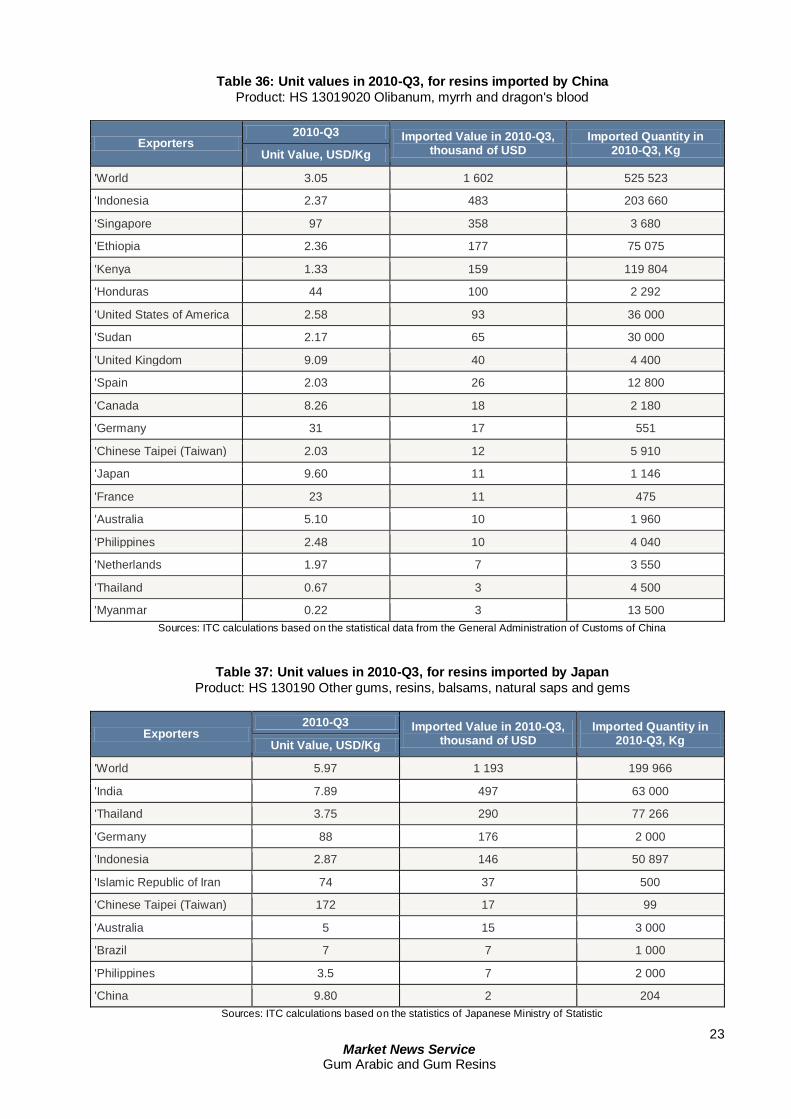
Table 36: Unit values in 2010-Q3, for resins imported by China
Product: HS 13019020 Olibanum, myrrh and dragon's blood
Exporters 2010-Q3 Imported Value in 2010-Q3,
thousand of USD Imported Quantity in
2010-Q3, Kg Unit Value, USD/Kg
'World 3.05 1 602 525 523
'Indonesia 2.37 483 203 660
'Singapore 97 358 3 680
'Ethiopia 2.36 177 75 075
'Kenya 1.33 159 119 804
'Honduras 44 100 2 292
'United States of America 2.58 93 36 000
'Sudan 2.17 65 30 000
'United Kingdom 9.09 40 4 400
'Spain 2.03 26 12 800
'Canada 8.26 18 2 180
'Germany 31 17 551
'Chinese Taipei (Taiwan) 2.03 12 5 910
'Japan 9.60 11 1 146
'France 23 11 475
'Australia 5.10 10 1 960
'Philippines 2.48 10 4 040
'Netherlands 1.97 7 3 550
'Thailand 0.67 3 4 500
'Myanmar 0.22 3 13 500
Sources: ITC calculations based on the statistical data from the General Administration of Customs of China
Table 37: Unit values in 2010-Q3, for resins imported by Japan
Product: HS 130190 Other gums, resins, balsams, natural saps and gems
Exporters 2010-Q3 Imported Value in 2010-Q3,
thousand of USD Imported Quantity in
2010-Q3, Kg Unit Value, USD/Kg
'World 5.97 1 193 199 966
'India 7.89 497 63 000
'Thailand 3.75 290 77 266
'Germany 88 176 2 000
'Indonesia 2.87 146 50 897
'Islamic Republic of Iran 74 37 500
'Chinese Taipei (Taiwan) 172 17 99
'Australia 5 15 3 000
'Brazil 7 7 1 000
'Philippines 3.5 7 2 000
'China 9.80 2 204
Sources: ITC calculations based on the statistics of Japanese Ministry of Statistic
24 Market News Service
Gum Arabic and Gum Resins
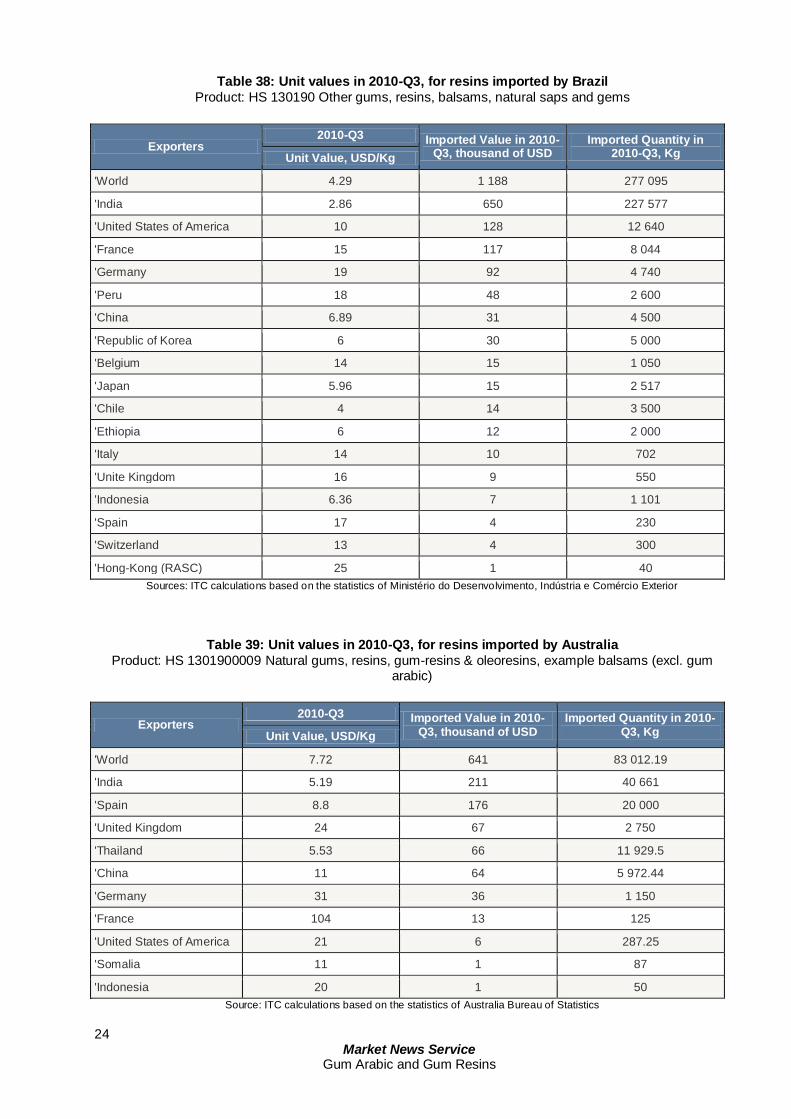
Table 38: Unit values in 2010-Q3, for resins imported by Brazil
Product: HS 130190 Other gums, resins, balsams, natural saps and gems
Exporters 2010-Q3 Imported Value in 2010-
Q3, thousand of USD Imported Quantity in
2010-Q3, Kg Unit Value, USD/Kg
'World 4.29 1 188 277 095
'India 2.86 650 227 577
'United States of America 10 128 12 640
'France 15 117 8 044
'Germany 19 92 4 740
'Peru 18 48 2 600
'China 6.89 31 4 500
'Republic of Korea 6 30 5 000
'Belgium 14 15 1 050
'Japan 5.96 15 2 517
'Chile 4 14 3 500
'Ethiopia 6 12 2 000
'Italy 14 10 702
'Unite Kingdom 16 9 550
'Indonesia 6.36 7 1 101
'Spain 17 4 230
'Switzerland 13 4 300
'Hong-Kong (RASC) 25 1 40
Sources: ITC calculations based on the statistics of Ministério do Desenvolvimento, Indústria e Comércio Exterior
Table 39: Unit values in 2010-Q3, for resins imported by Australia
Product: HS 1301900009 Natural gums, resins, gum-resins & oleoresins, example balsams (excl. gum arabic)
Exporters 2010-Q3 Imported Value in 2010-
Q3, thousand of USD Imported Quantity in 2010-
Q3, Kg Unit Value, USD/Kg
'World 7.72 641 83 012.19
'India 5.19 211 40 661
'Spain 8.8 176 20 000
'United Kingdom 24 67 2 750
'Thailand 5.53 66 11 929.5
'China 11 64 5 972.44
'Germany 31 36 1 150
'France 104 13 125
'United States of America 21 6 287.25
'Somalia 11 1 87
'Indonesia 20 1 50
Source: ITC calculations based on the statistics of Australia Bureau of Statistics
25 Market News Service
Gum Arabic and Gum Resins
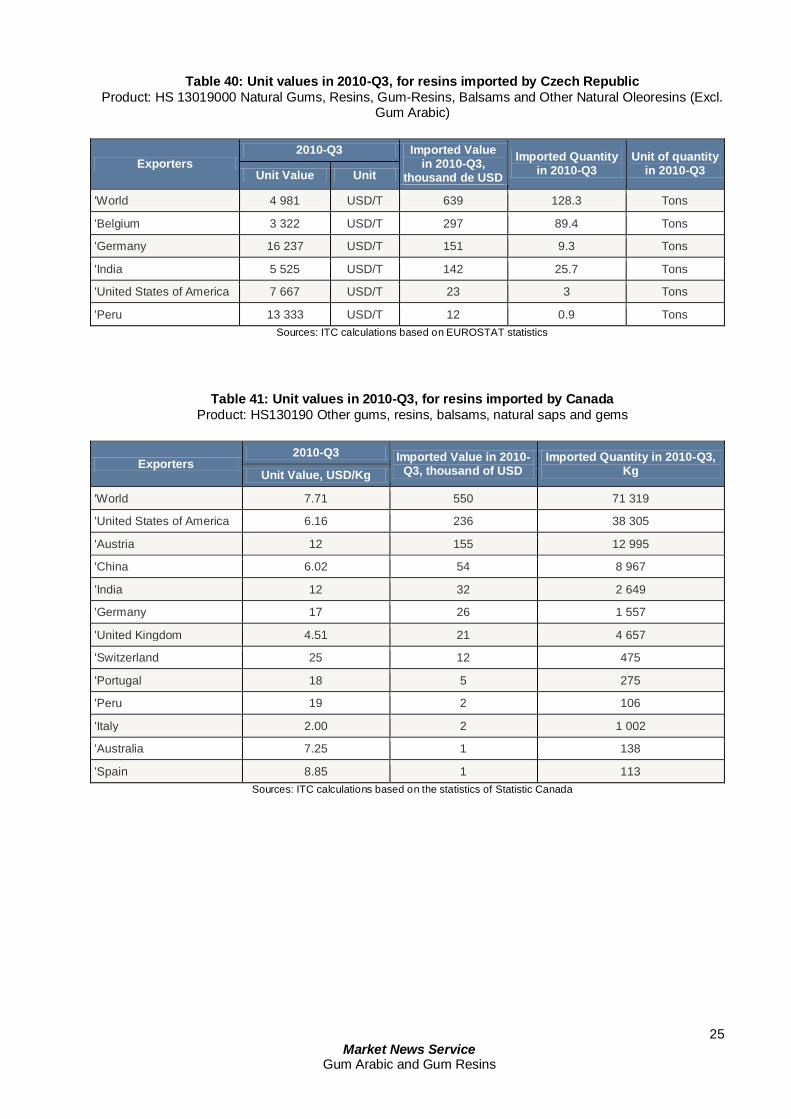
Table 40: Unit values in 2010-Q3, for resins imported by Czech Republic
Product: HS 13019000 Natural Gums, Resins, Gum-Resins, Balsams and Other Natural Oleoresins (Excl. Gum Arabic)
Exporters 2010-Q3 Imported Value
in 2010-Q3, thousand de USD
Imported Quantity in 2010-Q3
Unit of quantity in 2010-Q3 Unit Value Unit
'World 4 981 USD/T 639 128.3 Tons
'Belgium 3 322 USD/T 297 89.4 Tons
'Germany 16 237 USD/T 151 9.3 Tons
'India 5 525 USD/T 142 25.7 Tons
'United States of America 7 667 USD/T 23 3 Tons
'Peru 13 333 USD/T 12 0.9 Tons
Sources: ITC calculations based on EUROSTAT statistics
Table 41: Unit values in 2010-Q3, for resins imported by Canada
Product: HS130190 Other gums, resins, balsams, natural saps and gems
Exporters 2010-Q3 Imported Value in 2010-
Q3, thousand of USD Imported Quantity in 2010-Q3,
Kg Unit Value, USD/Kg
'World 7.71 550 71 319
'United States of America 6.16 236 38 305
'Austria 12 155 12 995
'China 6.02 54 8 967
'India 12 32 2 649
'Germany 17 26 1 557
'United Kingdom 4.51 21 4 657
'Switzerland 25 12 475
'Portugal 18 5 275
'Peru 19 2 106
'Italy 2.00 2 1 002
'Australia 7.25 1 138
'Spain 8.85 1 113
Sources: ITC calculations based on the statistics of Statistic Canada
26 Market News Service
Gum Arabic and Gum Resins
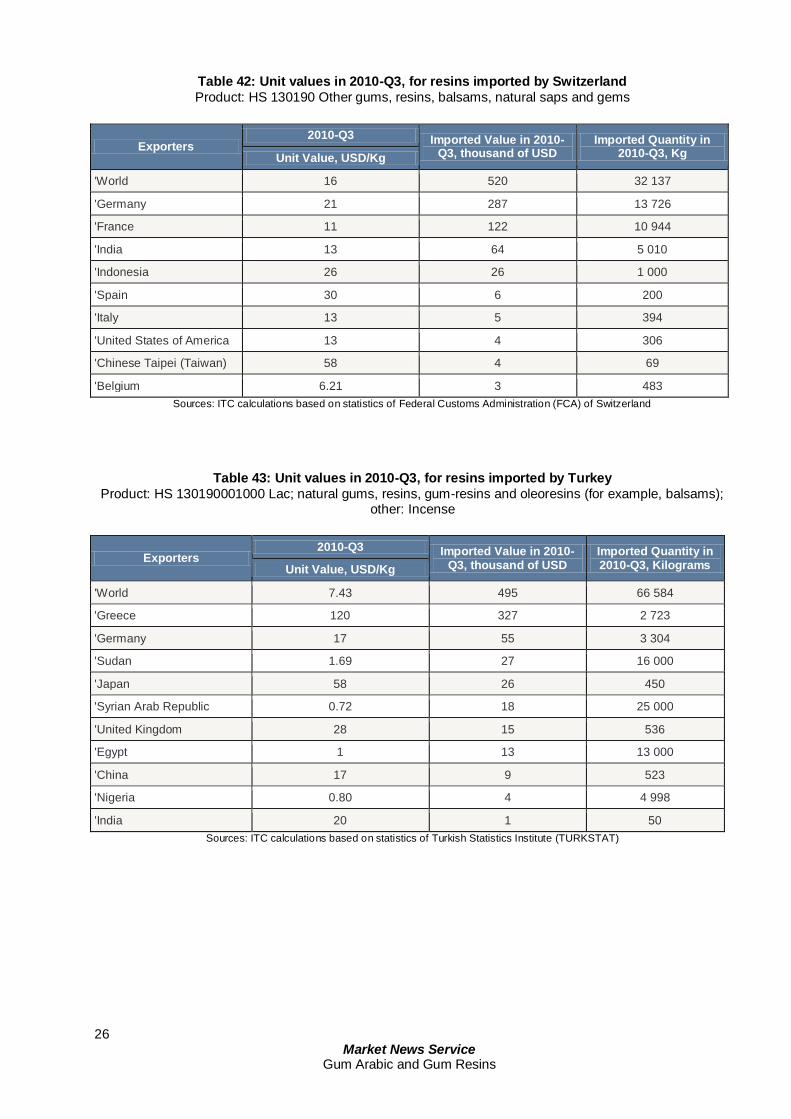
Table 42: Unit values in 2010-Q3, for resins imported by Switzerland
Product: HS 130190 Other gums, resins, balsams, natural saps and gems
Exporters 2010-Q3 Imported Value in 2010-
Q3, thousand of USD Imported Quantity in
2010-Q3, Kg Unit Value, USD/Kg
'World 16 520 32 137
'Germany 21 287 13 726
'France 11 122 10 944
'India 13 64 5 010
'Indonesia 26 26 1 000
'Spain 30 6 200
'Italy 13 5 394
'United States of America 13 4 306
'Chinese Taipei (Taiwan) 58 4 69
'Belgium 6.21 3 483
Sources: ITC calculations based on statistics of Federal Customs Administration (FCA) of Switzerland
Table 43: Unit values in 2010-Q3, for resins imported by Turkey
Product: HS 130190001000 Lac; natural gums, resins, gum-resins and oleoresins (for example, balsams); other: Incense
Exporters 2010-Q3 Imported Value in 2010-
Q3, thousand of USD Imported Quantity in 2010-Q3, Kilograms Unit Value, USD/Kg
'World 7.43 495 66 584
'Greece 120 327 2 723
'Germany 17 55 3 304
'Sudan 1.69 27 16 000
'Japan 58 26 450
'Syrian Arab Republic 0.72 18 25 000
'United Kingdom 28 15 536
'Egypt 1 13 13 000
'China 17 9 523
'Nigeria 0.80 4 4 998
'India 20 1 50
Sources: ITC calculations based on statistics of Turkish Statistics Institute (TURKSTAT)
27 Market News Service
Gum Arabic and Gum Resins
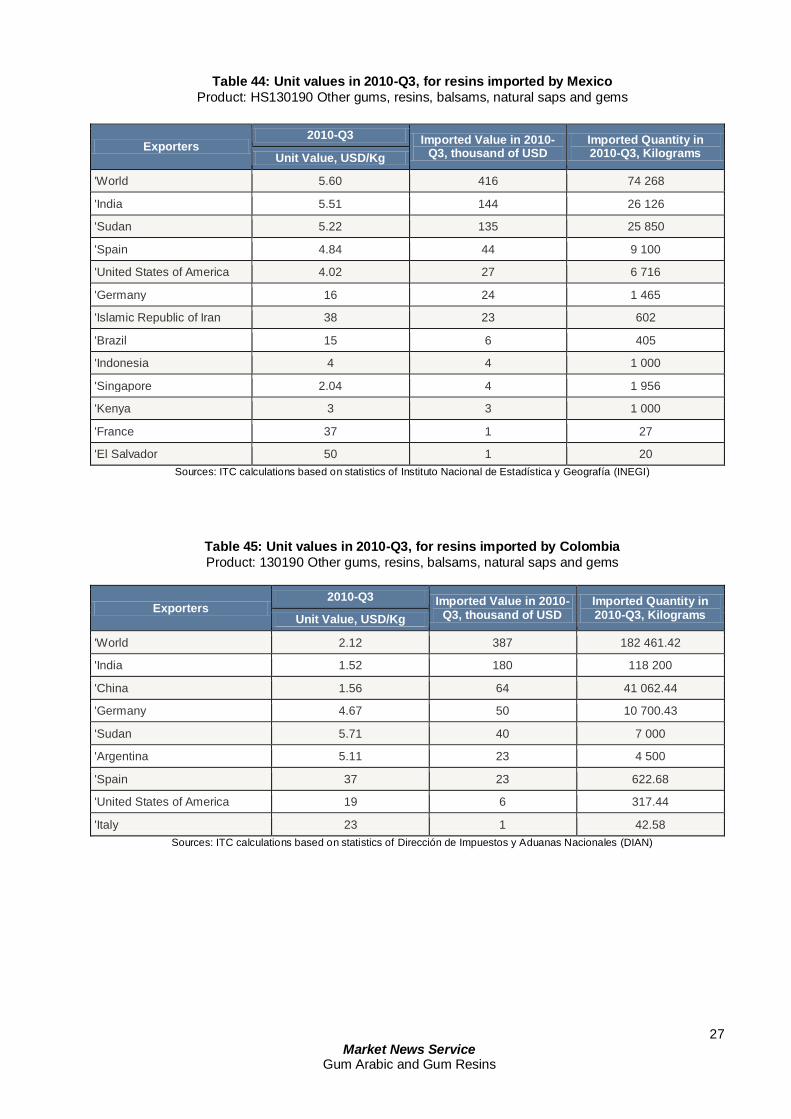
Table 44: Unit values in 2010-Q3, for resins imported by Mexico
Product: HS130190 Other gums, resins, balsams, natural saps and gems
Exporters 2010-Q3 Imported Value in 2010-
Q3, thousand of USD Imported Quantity in 2010-Q3, Kilograms Unit Value, USD/Kg
'World 5.60 416 74 268
'India 5.51 144 26 126
'Sudan 5.22 135 25 850
'Spain 4.84 44 9 100
'United States of America 4.02 27 6 716
'Germany 16 24 1 465
'Islamic Republic of Iran 38 23 602
'Brazil 15 6 405
'Indonesia 4 4 1 000
'Singapore 2.04 4 1 956
'Kenya 3 3 1 000
'France 37 1 27
'El Salvador 50 1 20
Sources: ITC calculations based on statistics of Instituto Nacional de Estadística y Geografía (INEGI)
Table 45: Unit values in 2010-Q3, for resins imported by Colombia
Product: 130190 Other gums, resins, balsams, natural saps and gems
Exporters 2010-Q3 Imported Value in 2010-
Q3, thousand of USD Imported Quantity in 2010-Q3, Kilograms Unit Value, USD/Kg
'World 2.12 387 182 461.42
'India 1.52 180 118 200
'China 1.56 64 41 062.44
'Germany 4.67 50 10 700.43
'Sudan 5.71 40 7 000
'Argentina 5.11 23 4 500
'Spain 37 23 622.68
'United States of America 19 6 317.44
'Italy 23 1 42.58
Sources: ITC calculations based on statistics of Dirección de Impuestos y Aduanas Nacionales (DIAN)
28 Market News Service
Gum Arabic and Gum Resins
FACTORS AFFECTING THE GLOBAL MARKET
Gum Resins It is currently not possible to draw up the situation of the ecosystems in which these resins are currently being cultivated, due to the lack of reliable spatial data on the state of gum resins in major producing countries. However, the rainy season which has been good throughout sub-Saharan Africa will result in the improvement of grazing areas. This will in turn result in less grazing of resin-producing ecosystems which tend to have a greater value-added.
Like gum arabic, gum resins would benefit from the implementation of the REDD+ system which was devised in the Cancun summit on climate change. Consequently, the activities initiated by these countries to preserve their ecosystems and adapt to climate change would especially benefit from tree species which produce gum resins like Sterculia, Boswelia, Commiphora and Combretum, depending on the particular country.
CONCLUSION Gum Resins
Despite the crisis, the status of gum resins did not deteriorate over the year 2010 but improved instead. The fear around these products stemmed from the fact during a time of crisis, all that is deemed “not essential” is usually neglected. There is no denying that gum arabic was much more affected than gum resins were. The reason for this being that gum arabic, in many ways, is a raw material in many sectors, whereas resins require little to no processing before consumption. Given the high demand on international markets, decision-makers in gum resin producing countries should pay more attention to them. However, there is a long-term problem in sight namely the disparity between the price trends observed in gum resin producing countries and the amounts that can be produced. Indeed, in
some importing countries, prices have remained on a sharp upward trend due to speculation, at the expense of the growth of the product on the field. This could prove to be detrimental for gum resins which could end up being victims of their own popularity if sufficient measures are not undertaken to maintain stable production levels. It is clearly evident that prices in international markets cannot rise indefinitely. Production conditions would need to improve to prevent exporters from attempting to meet a demand, at the expense of quality, which would only lead to a loss in competition.
29 Market News Service
Gum Arabic and Gum Resins
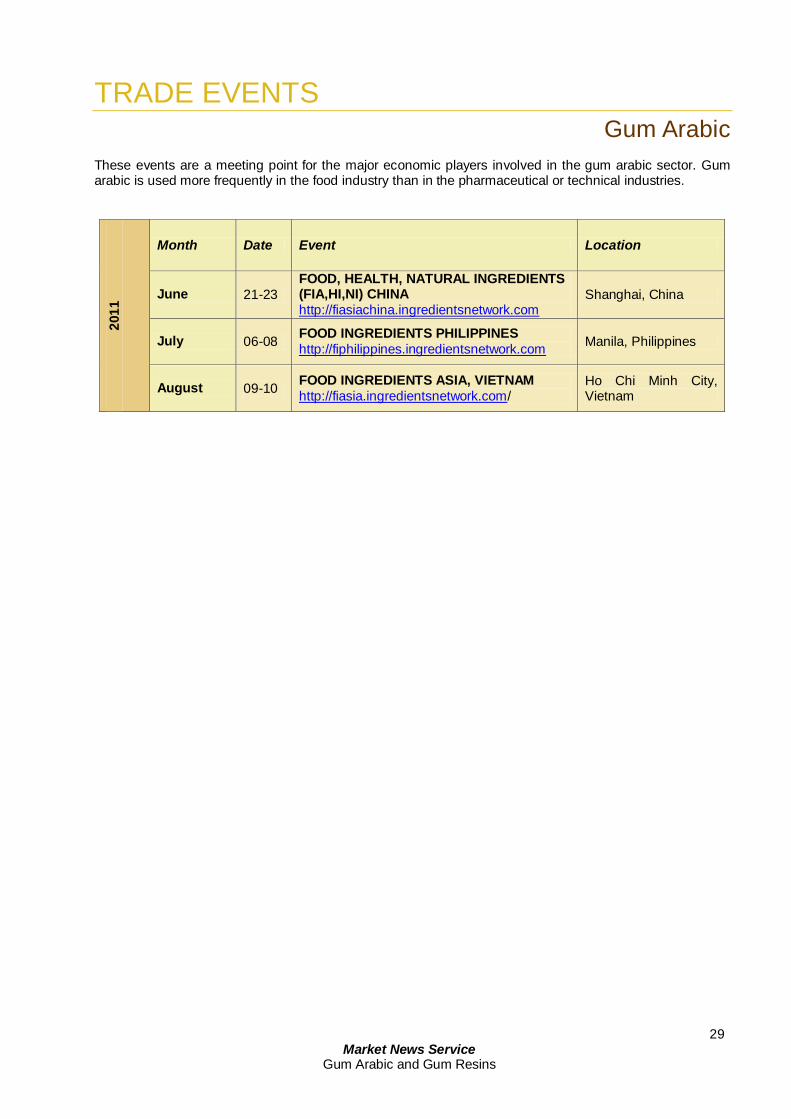
TRADE EVENTS
Gum Arabic
These events are a meeting point for the major economic players involved in the gum arabic sector. Gum arabic is used more frequently in the food industry than in the pharmaceutical or technical industries.
201
1
Month Date Event Location
June 21-23
FOOD, HEALTH, NATURAL INGREDIENTS (FIA,HI,NI) CHINA
http://fiasiachina.ingredientsnetwork.com Shanghai, China
July 06-08 FOOD INGREDIENTS PHILIPPINES
http://fiphilippines.ingredientsnetwork.com Manila, Philippines
August 09-10 FOOD INGREDIENTS ASIA, VIETNAM
http://fiasia.ingredientsnetwork.com/ Ho Chi Minh City, Vietnam
30 Market News Service
Gum Arabic and Gum Resins
I. APPENDIX
Gum Arabic
List of Abbreviations ITC: International Trade Centre FAO: Food and Agriculture Organization FDA: Food and Drug Administration GRAS: Generally Recognized As Safe JECFA: Joint FAO/WHO Expert Committee on Food Additives Kg: Kilograms NES / NESOI: Not Elsewhere Specified / Not Elsewhere Specified Or Included USD/T: Dollar of the United States of America per Ton USD/Kg: Dollar of the United States of America per Kilogram Q3: Third quarter T: Ton WHO: World Health Organization
Adresses
Useful Addresses AIPG, Association for International Promotion of Gums
E-mail: [email protected] - Site: www.treegums.org AIDGUM, Association Internationale pour le Développement des Gommes Naturelles 129, Chemin de
Croisset BP 4151 76723 ROUEN CEDEX Tel.: + 33 232 831 818 Fax: + 33 232 831 919 NGARA, Natural Gum and Resins in Africa
Nairobi, Kenya Tel: +254 720 811 411 Fax : +254 20 4444 841 E-mail: [email protected] - Site: www.NGARA.org
Exporters NIGERIA
DANSA FOOD Processing Co. Ltd. Industrial Estate lot 2 - KANO Tel.: + 234 64 31 41 42; E-mail: [email protected] GACON Ltd. 1st Floor 8 Market Street P.O. Box 50134 Falomo Ikoyi – LAGOS Tel: + 234 1 266 54 50 Fax: + 234 1 266 78 01 E-mail: [email protected]
VICTORIA AGRO EXPORTS Ltd. 270 Ozumba Mbadiwe street – Victoria Island – LAGOS Tel: + 234 1 262 13 24 Fax: + 234 1 61 84 51 E-mail: [email protected]
SUDAN
THE GUM ARABIC COMPANY P.O. Box 857 KHARTOUM Tel: + 249 11 46 10 61 Fax: + 249 11 47 13 36 E-mail: [email protected]
THE KHARTOUM GUM ARABIC PROCESSING Co. Ltd. P.O. Box 12034 KHARTOUM Tel: + 249 11 78 56 66 Fax: + 249 11 77 46 32 E-mail: [email protected] CHAD
ABHS Aboul-Hassanein B.P. 3061 N’DJAMENA Tel: + 235 51 00 76 Fax: + 235 51 06 86 E-mail: [email protected]
31 Market News Service
Gum Arabic and Gum Resins
SANIMEX B.P. 492 N’DJAMENA Tel.: + 235 51 49 69 Fax: + 235 51 40 40 E-mail: [email protected] SCCL B.P. 1110 N’DJAMENA Tel.: + 235 51 79 61 Fax: + 235 51 06 86 E-mail: [email protected] or [email protected]
SETEX Acacia B.P. 744 N’DJAMENA Tel.: + 235 51 29 07 Fax: + 235 51 59 97 E-mail: [email protected]
SODEC B.P. 877 N’DJAMENA Tel.: + 235 51 29 26 Fax: + 235 51 79 27 E-mail: [email protected]
Importers FRANCE
ALLAND & ROBERT 9, rue de Saintonge - 75003 PARIS Tel.: + 33 144 592 130 Fax: + 33 142 725 438 Telex: 210963 F E-mail: [email protected] C.N.I., COLLOIDES NATURELS INTERNATIONAL 129, chemin de Croisset BP 4151 - 76723 ROUEN Cedex Tel.: + 33 232 831 818 Fax: + 33 232 831 919 Telex: 180921 F E-mail: [email protected] EMIGA Zone Industrielle Avon, Lot 152 - 13120 GARDANNE Tel.: + 33 442 512 828 Fax: + 33 442 512 533 Telex: 400547 F E-mail: [email protected]
SPINDAL – AEB group Zone Industrielle 3/5 rue Ampère - 77220 GRETZ-ARMAINVILLIERS Tel.: + 33 164 078 000 Fax: + 33 164 075 920 E-mail: [email protected] VALMAR Zone Industrielle de Saint Mitre - 13400 AUBAGNE Tel.: + 33 442 849 292 Fax: + 33 442 841 079 E-mail: [email protected] UNITED KINGDOM
AGRISALES LIMITED – AGRIPRODUCT group Royal Oak House - 45A Porchester road - LONDON W2 5DP Tel.: + 44 207 221 1275 Fax: + 44 207 792 9014
ARTHUR BRANWELL & Co LIMITED Bonte House, 58-62 High street - EPPING, ESSEX CM16 4AE Tel.: + 44 1 992 577 333 Fax: + 44 1 992 561 138 Telex: 817158 BRANWL G E-mail: [email protected] RED CARNATION GUMS LIMITED Unit 11 Westmayne Industrial Park - Bramston way, Laindon, Essex, SS15 6TP Tel.: + 44 1 268 412 020 Fax: + 44 1 268 410 040 Telex: 99238 EMULS G E-mail: [email protected] A.F. SUTER and Co Ltd Thames House – 18 Park street – LONDON SE1 9EQ Tel.: + 44 207 403 6555 Fax: + 44 207 378 8582 E-mail: [email protected]
TOYOTA TSUSHO UK Ltd. 140 London wall, LONDON EC2Y 5DN Tel.: + 44 2 077 762 778 Fax: + 44 2 077 762 795 E-mail: [email protected] U.S.A.
AEP Colloids Inc. 393 Church street – P.O. Box 3425 SARATOGA SPRINGS, NY 12866 Tel.: + 1 518 584 4105 Fax: + 1 518 580 8577 ; E-mail: [email protected] ISC Importers Service Corporation 233 Suydam avenue – JERSEY CITY, NJ 07304-3399 Tel.: + 1 201 332 6970 Fax: + 1 201 332 4152 ; E-mail: [email protected]
32 Market News Service
Gum Arabic and Gum Resins
PAUL THOMAS & Co INC 119 Headquarters Plaza - MORRISTOWN, NJ 07960 Tel.: + 1 973 984 0900 Fax: + 1 973 984 5666 Telex: 219805 SPGM UR E-mail: [email protected]
TIC GUMS INC 4609-T Richlynn Drive P.O. Box 369 - BELCAMP, MD 21017-0369 Tel.: + 1 410 273 7300 Fax: + 1 410 273 6469 ; Site: www.ticgums.com GERMANY
Willy BENECKE GmbH Hoverstrasse 41 - 20539 HAMBURG Tel.: + 49 407 804 440 Fax: + 49 40 780 44 433 E-mail: [email protected] Johannes BASSEN GmbH Kaiser-Wilhelmstasse 115 – 20355 HAMBURG Tel.: + 49 40 355 47 913 Fax: + 49 40 355 47 918 E-mail: [email protected] C.E. ROEPER GmbH Hans Duncker strasse 13 - 21035 HAMBURG Tel.: + 49 40 734 10 317 Fax: + 49 40 734 10 381 Telex: 217811 E-mail: [email protected] Ernst H. SINGELMANN GmbH Hopfensack 20 – 20457 HAMBURG Tel.: + 49 40 350 257 Fax: + 49 40 331 642; E-mail: [email protected] Alfred WOLFF GmbH Sudanhaus – Grosse Backerstasse 13 – P.O. Box 106620 20044 HAMBURG Tel.: + 49 40 376 76 121 Fax: + 49 40 376 76 100 Telex: 211778 E-mail: [email protected]
BELGIUM
CLADIC Belgium N.V. Terlochtweg 1 – 2620 HEMISKSEM; Tel.: + 32 3 870 48 11 Fax : + 32 3 870 48 99 E-mail: [email protected] INDIA
DRYTECH B-16 Ginkunz Industrial Estate – Off Mahakali Caves road – Andheri East MUMBAI 400093 Tel.: + 91 22 268 753 61 Fax : + 91 22 268 752 21 E-mail: [email protected] IRELAND KERRY Ingredients 3 Eldred terrace – Douglas road - CORK Tel.: + 353 214 313 172 ; E-Mail: [email protected] ISRAEL
FRUTAROM Industries Ltd. P.O. Box 10067 – HAIFA Tel.: + 972 846 2442 Fax: + 972 872 2517 E-mail: [email protected] ITALY
RATHGEB Rose-Marie Viale Belisario 20145 MILANO Tel.: + 39 024 813 424 Fax: + 39 024 819 5518 E-mail: [email protected] JAPAN
SAN-EI YAKUHIN BOEKI K.K. c/o Morii Bidg 4-10 Awajimachi 1 – Chome Chuo-Ku OSAKA Tel.: + 81 662 028 524 Fax: + 81 662 027 204 E-mail: [email protected]
References and sources of information - ITC website and sub-websites: http://www.intracen.org/ ;
- NGARA publication 3rd series, September 2005;
- World Bank: http://go.worldbank.org/TPPWANWXR0/
33 Market News Service
Gum Arabic and Gum Resins
II. APPENDIX
Gum Resins AIPG, Association for International Promotion of Gums
E-mail: [email protected] - Site: www.treegums.org AIDGUM, Association Internationale pour le Développement des Gommes Naturelles 129, Chemin de Croisset
BP 4151 76723 Rouen Cedex, France Tel.: + 33 232 831 818 Fax: + 33 232 831 919 NGARA, Natural Gums and Resins in Africa
Nairobi, Kenya Tel: +254 720 811 411 Fax: +254 20 4444 841 E-mail: [email protected] - Site: www.NGARA.org GARA, Gums and Resins Association of Kenya, an organisation registered under the societies Act in 1997. The
association joins together public, private partners as well as civil society organisations.
Exporters ETHIOPIE
ABBEBAYE C.C. PLC Tél.: + 251 01 53 07 75; Fax: + 251 01 51 39 65 P.O. Box: 5304 Addis Abeba GENALE MIGS TRADING P.L.C. Tél.: + 251 01 56 03 52; Fax: + 251 01 51 39 65 P.O. Box: 2259 Addis Abeba DARUELA NESREDIN Tél.: + 251 01 75 25 72; Fax: + 251 01 75 62 61 P.O. Box: 12 672 Addis Abeba GUNA TRADING HOUSES P.L.C. Tél.: + 251 01 65 22 88; Fax: + 251 01 65 46 32 Addis Abeba NGPME Tél.: + 251 01 51 88 13/ 15 99 32; Fax: + 251 01 51 81 18 P.O. Box: 62 322 Addis Abeba
AMBASSEL TRADING HOUSE Tél.: + 251 01 53 35 02/ 52 56 95; Fax: + 251 01 51 53 15/ 50 58 40 P.O. Box: 12 617 Addis Abeba BWAP EXPORT PLC P.O. Box: 5304 Addis Abeba
YAHIYA SEID OMAR Tél./Fax: + 251 01 75 12 96; P.O. Box: 4202 Addis Abeba KENYA ELEGANT TRADING COMPANY LTD Tél.: 0 722 718 290 ; Contact: M. QURESH E.mail : [email protected] GUMS AND RESINS KENYA Tél.: 0 722 491 379 ; Contact: M. Abdi Kadir Hassan Phoenix House, 3
rd floor, Kenyatta Avenue
E.mail : [email protected] SAM IMPEX KENYA LTD Tél.: 552 392/652436 ; Lunga lunga Road ARIDS LANDS RESSOURCES LTD Tél.: 0 722 817 492 ; Contact: M. Dennis Leete Village Market, Isiolo E.mail : [email protected] VETOCHEM Tél.: 0 733 720 068 ; Contact: M. Sadqa HAQ Lunga lunga Road E.mail : [email protected] MUNAISSAR ENTERPRISES Tél.: 20-797669 ; Contact: M. MUNAISSAR Dandora, Nairobi HASSAN HASSINE Tél.: 020-536053-64 ; Contact: M. Hassan Hassine P.O. Box : 458605, Nairobi
34 Market News Service
Gum Arabic and Gum Resins
ERYTHREE
AZIEB INTERNATIONAL Tél.: 291-1121462/117343 ; Fax: 291-1-121 462 175.9 Acss N°2, P.O.BOX: 2- Lorenzo Taezaz Asmara
SACIF (ERITREA) PVT. LTD.CO Tél.: 291-1-120747 ; Fax: 291-1-120354 Nakfa Street Number 175, House N°10, P.O.BOX: 521 Asmara
Importers UNITED KINGDOM
FRUTAROM (UK) LTD Belassis Avenue, Billingham Cleveland TS 231 LQ Contact: Dr. John Heffernan, Research Manager UK TRADE & INVESTMENT (formerly Export Market Information Centre) Kingsgate House 66-74 Victoria Street London SWIE 65 W ALLEMAGNE
CE ROEPER (Gmbh & Co) Hans – Dunaker-Str.13 D-21035 Hamburg Contact: Mr. Ruediger Dreyer, Director
ERNST H SINGELMANN Hopfensack 20 D-20457 Hamburg Contact: Mr. Carsten Singelmann, Director WILLY BENECKE Hovestr.41 D-20539 Hamburg Contact: Mr. Thorsten Hauser, Director ALFRED L. WOLFF Gr. Bäckerstr.13 D-20095 Hamburg Contact: Mr. Aw Duve, Director
References and sources of information
- NGARA publications, 5th
edition, march 2006 ;
- ITC websites and sub-websites: http://www.intracen.org/

HANDBOOKVer. 5.3
The International Trade Centre (ITC) is the joint agency of the World Trade Organization and the United Nations.
Street addressInternational Trade Centre54-56 Rue de Montbrillant1202 Geneva, Switzerland
P: +41 22 730 0111F: +41 22 733 4439E: [email protected]
Postal addressInternational Trade CentrePalais des Nations1211 Geneva 10, Switzerland
SHAPE THE FUTUR OF YOUR SECTOR’S SUCCESS
HOW TO DEVELOP A SECTOR STRATEGY