gurufocus user manual: all-in-one guru screener and ... · the all-in-one guru screener consists of...
TRANSCRIPT

1
GuruFocus User Manual:
All-in-One Guru Screener and Backtesting
2018 version

2
Contents
One. All-in-One Guru Screener: Basic Features
1. Introduction and Access
a. Introduction to the All-in-One Guru Screener
b. Accessing the Screener
c. Screener Layout
2. Selecting Filters to Screen for Companies
3. The Predefined Screeners
4. Custom Filters in the All-in-One Screener
5. Saving Custom Screeners
6. The Screener Results Tabs
7. Screener FAQs
Two. Backtesting in the All-in-One Screener
1. Introduction to Backtesting
2. Backtesting Parameters
3. Backtesting Results
4. Backtesting FAQs
Three. Advanced Features in All-in-One Screener
1. Peter Lynch Charts
2. Customized Screener Results Views
3. The Valuation Heat Map
Four. New Features added to the Screener
1. Screening from Historical Data
2. Screening from a user portfolio
3. Various new filters
4. Screening using technical indicators
5. New Features FAQs

3
Section One: All-in-One Guru Screener Basic Features
1. Introduction and Overview
As a value investing research platform, GuruFocus tracks the best stock ideas from various sources,
including Peter Lynch, Ben Graham and Warren Buffett. These three legendary investors, unofficially
known as the “Power 3 of Value Investing,” generate value strategies that have outperformed stock
market benchmarks for decades.
This user manual focuses on the “granddaddy of them all,” the All-in-one Guru Screener, which allows
you to screen for companies using more than 200 predefined filters and customized filters.
Introduction to the Screener
As the name suggests, the All-in-One Guru Screener allows you to screen for companies from an eclectic
variety of filters, ranging from profitability filters, valuation filters and guru filters. The Screener contains
over 200 filters as of the writing of this user manual; however, the Customized Filters feature, which we
will discuss later in this manual, boosts the number of filters to essentially infinity.
Figure 1.1 shows a screen shot of the Screener upon access. At first glance, swarms of drop-down menus
inundate the screen. However, we have organized the filters to facilitate the use of the Screener.
Figure 1.1
Accessing the Screener
GuruFocus offers several ways to access the All-in-one Guru Screener, likely due to its popularity among
users. You can access the Screener by simply clicking the “All-in-One Guru Screener” underneath the
“Screeners” tab. The Screener is the first item under the “Value Screeners” heading as Figure 1.2
illustrates.

4
Figure 1.2
Although discussing every possible way to access the All-in-One Guru Screener is beyond the scope of
this user manual, we can still highlight other key ways to access the Screener. For example, let us
consider the “Search” bar at the top of the Web page, below the blue “GuruFocus” ribbon.
Note the purple arrow pointing to the word “Search” in Figure 1.3.1. You can click here to drop a menu
with two items: “Search” and “Compare.” Suppose we choose “compare” and type in some stock tickers
as illustrated in Figure 1.3.2. Clicking the “go” button takes us to the All-in-One Guru Screener with the
four stock symbols listed in the “Compare” bar reappearing in the “Stocks” filter, located in the top-left
corner of the “Fundamental” tab.
Figure 1.3.1

5
Figure 1.3.2
Screener layout
The All-in-one Guru Screener consists of three parts: the header, the filter box and the results area.
Figure 1.4.1 shows the former two while Figure 1.4.2 shows the third item.
Figure 1.4.1
Figure 1.4.2
The “header” section contains two drop-down menus and the “Global Stock Market” ribbon. The drop-
down menu on the left lists the predefined GuruFocus screens while the drop-down menu on the right
lists your customized screens. Finally, the “Global Stock Market” ribbon allows you to screen for
companies trading in global markets. Click on the check boxes to activate or deactivate the regions.
Clicking on “Show All Countries” pulls down a color-coded list of all countries from the regions as Figure
1.5 illustrates. You can select the specific countries to screen right here.
To save the “Global Stock Market” settings, click on the “Set as Default” button located on the farthest
right of the Global Stock Market ribbon. Unless you change the settings, the Screener results area will
only display the companies in the selected regions / stock exchanges.

6
Figure 1.5
The “Filter box,” which represents the “core” of the Screener, contains hundreds of financial filters
organized in several tabs. The selected filters determine which company stocks populate the “results
area” below the filter box.

7
2. Selecting filters to screen for companies
As illustrated in Figure 1.4.1 above, the All-in-one Screener contains over 200 filters organized into nine
tabs: fundamental, valuation ratio, profitability, growth, valuation rank, price, dividends, gurus and
insiders. Each tab screens for companies based on various value-investing categories. By default, the
Screener displays the “Fundamental” tab.
Brief overview of selecting filters
Each of the drop-down menus allows you to screen for companies based on a specific financial metric.
For each filter, the Screener implements the following layout:
(Financial Metric) (Drop-Down Menu 1) To (Drop-Down Menu 2)
To screen for companies whose revenue is at least a particular value, select the desired value from drop-
down menu 1, the box between the financial metric name and the word “to.” Similarly, you can screen
for companies whose revenue is less than a particular value by selecting the desired value from drop-
down menu 2, the box to the right of “to.”
As you activate filters, red numbers next to each of the tab headings track the number of active filters
underneath each tab as illustrated in Figure 1.6.
Figure 1.6

8
Click the “Reset” button (the leftmost button in Figure 1.7 below) to erase all active filters from the
Screener. Then confirm the screener reset by clicking “OK” on the dialog box that appears.
New Feature:
GuruFocus added two features to the Screener: hiding the filters and resetting filters for a specific tab.
Figure 1.7 shows the “Reset / Tutorial / Filter” row of buttons.
Figure 1.7
Click on the “Filter” button to close the “Filter box” and only show the gray ribbon. This will allow you to
see the screener results area without having to scroll down.
The bottom-right corner of each tab contains a button titled “Reset current tab.” As the name implies,
clicking this button will remove all filters for the active tab only.
Fundamental tab
Figure 1.4.1 displays about 65 fundamental filters into five columns. From left to right, the columns
contain the following financial filters:
Column 1 contains the most fundamental filters, including revenue, market cap, enterprise value
(EV), earnings per share, financial strength rank, profitability rank and predictability rank.
Column 2 contains filters on financial strength, including FZM scores, current and Sloan ratios,
interest coverage and other debt ratios.
Column 3 contains filters on profit returns, including return on assets, return on equity, return
on capital and Greenblatt return on capital.
Column 4 contains filters on return on tangible assets / equity, days inventory, days sales
outstanding, days payable, cash conversion cycle and number of good signs / severe warning
signs.
Column 5 contains filters on ownership, share buyback rate, total payout ratio / yield, initial
public offering (IPO) date, in S&P 500 and exclude / include over-the-counter stocks.
Valuation ratio tab
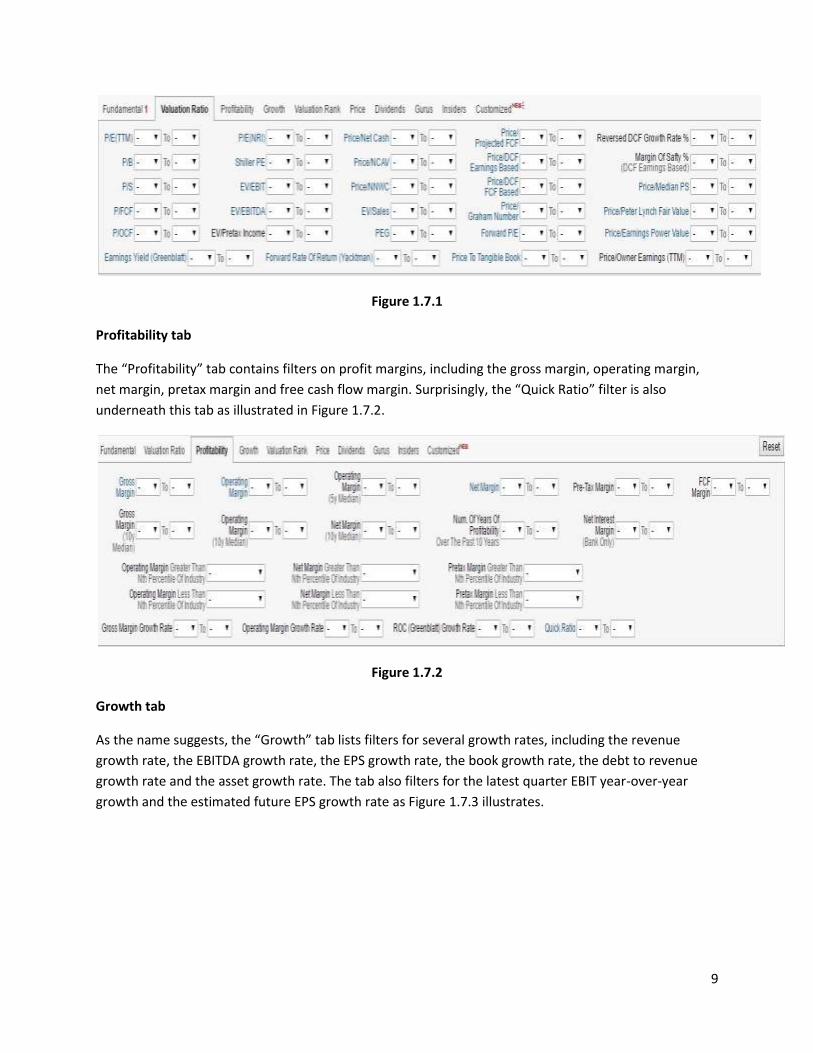
As Figure 1.7.1 illustrates, the “Valuation Ratio” tab allows you to screen for stocks with low valuation
ratios, including the price-earnings ratio, the price-to-sales ratio and the price-to-book ratio. This tab
also contains filters for the Greenblatt earnings yield, the Yacktman forward rate of return and the
margin of safety based on the discounted earnings model.
9
Figure 1.7.1
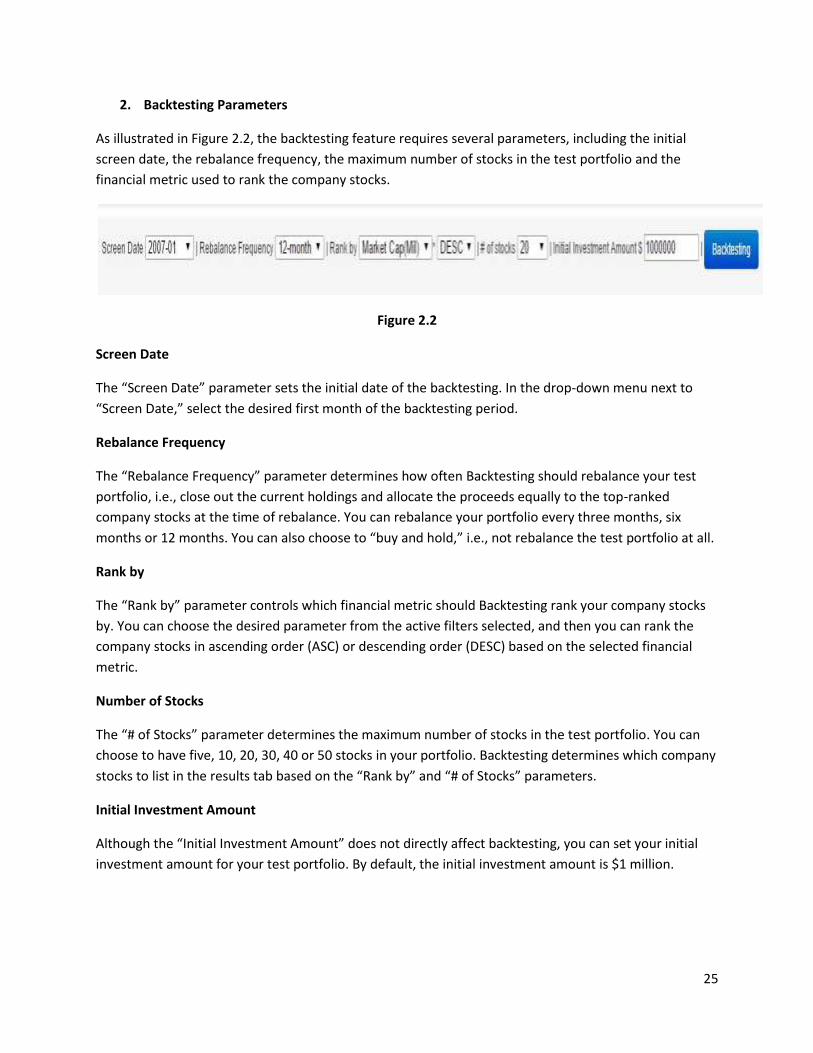
Profitability tab
The “Profitability” tab contains filters on profit margins, including the gross margin, operating margin,
net margin, pretax margin and free cash flow margin. Surprisingly, the “Quick Ratio” filter is also
underneath this tab as illustrated in Figure 1.7.2.
Figure 1.7.2
Growth tab
As the name suggests, the “Growth” tab lists filters for several growth rates, including the revenue
growth rate, the EBITDA growth rate, the EPS growth rate, the book growth rate, the debt to revenue
growth rate and the asset growth rate. The tab also filters for the latest quarter EBIT year-over-year
growth and the estimated future EPS growth rate as Figure 1.7.3 illustrates.

10
Figure 1.7.3
Valuation rank tab
While this tab only has six filters, the “Valuation Rank” tab allows you to screen for companies that have
high or low valuation ratios relative to the industry. We currently support valuation ranks for P/E, P/S
and P/B as of the writing of this user manual. The valuation rank tab filters are summarized in Figure
1.7.4.
Figure 1.7.4
Price tab
As Figure 1.7.5 illustrates, the “Price” tab consists of three parts: price and shares outstanding, price
changes and historical price comparisons.

11
Figure 1.7.5
The first two rows list basic filters pertaining to price and shares outstanding while the next three rows
list filters pertaining to price changes. The final four rows list filters pertaining to price comparisons
based on historical prices and valuations.
Dividend tab
As the name suggests, the “Dividend” tab contains all filters dealing with dividends, including the
dividend yield, the payout ratio and the minimum years of dividend increase. These filters are
summarized in Figure 1.7.6.
Figure 1.7.6
Gurus tab
As the name suggests, the “Gurus” tab allows you to screen for companies based on guru ownership and
guru trades. Figure 1.7.7 displays a screen shot of the “Gurus” filter box.
Figure 1.7.7
On the left, you will see a list of gurus and a check box next to each guru. To view the company stocks
owned by a particular guru, click the check box next to the desired guru. While you cannot search for
the guru name, you can click on one of the letters to list all gurus whose first name begins with the
selected letter.

12
Click on one of the buttons west of the guru list to select all hedge fund gurus, mutual fund gurus, global
gurus or premium gurus. The final button deselects all gurus. You can also select a list of gurus from the
“Choose My Gurus” drop-down menu, which is interconnected with your Personalized Lists of Gurus.
You can screen for guru buys / sells over a specific time frame, current guru ownership, etc. by selecting
the desired values for the drop-down menus on the right.
Insiders tab
The “Insiders” tab allows you to screen for insider cluster buys, CEO buys and CFO buys (and
correspondingly, sells) during a specific time period.
For cluster buys and sells, you can screen based on number of insiders. For CEO trades, CFO trades and
all insider trades, you can either screen based on number of shares (left drop-down menu) or total
transaction cost (right drop-down menu). The filters are summarized in Figure 1.7.8.
Figure 1.7.8
Customized tab
As we will explore later in this user manual, the “Customized” tab allows you to screen for companies
based on a user-defined filter formula. This tab effectively increases the number of possible filters from
about 200 to infinity.

13
3. The Predefined Screeners
Since its 2004 inception, GuruFocus generated about 20 predefined screeners, which can be accessed
from the drop-down menu next to “GuruFocus Screens” from the header. While a deep discussion on all
predefined screeners is beyond the scope of this user manual, we can still highlight some of the key
screeners.
Ben Graham’s Lost Formula in 1976
Intelligent investor Ben Graham had more investing strategies than his famous Net-Net Working Capital
strategy. The “Father of Value Investing” also worked on a “nearly finished” magic formula in 1976, as
discussed in the following tutorial article. Some criteria include a trailing 12-month price-earnings ratio
less than 10 and an equity-to-asset ratio of at least 0.5. GuruFocus also limits the companies in non-
cyclical industries and requires a market cap of at least $1 billion.
Screening for high dividend stocks
Income investors can screen for high dividend stocks by activating filters underneath the “Dividends” tab
as shown in Figure 7.6 above. Such companies have a trailing dividend-yield of at least 3%, a three-year
dividend growth rate of at least 10% and a dividend payout ratio less than 0.6.
GuruFocus also provides two predefined screeners on dividend stocks: the dividend income portfolio
and the dividend growth portfolio. The T Rowe Price Equity Income Fund (Trades, Portfolio) primarily
invests in companies with high dividend yields.
Peter Lynch Screeners
Legendary investor Peter Lynch made his way on the GuruFocus Predefined Screeners, which include the
Growth with lower valuation screener, the Lynch-Buffett Screener, the S&L Low-Book Screener and the
Stalwart Screener. Most of these screeners utilize his “earnings line,” i.e., the screeners require a P/E
(ttm) less than 14.
Predictable Companies Screeners
Several of the predefined screeners utilize the predictability rank filter, including the High Quality
screeners, the “Profitable Predictable Margin Expanders” screener and the “Good Companies” screener.
The companies that make these screeners have consistent per-share revenue growth and EBITDA
growth during the past 10 years.
Several of the “Most Popular Value Screeners,” including the Undervalued Predictable Screener, the
Buffett-Munger Screener and the Historical Low P/S or P/B Screeners require a GuruFocus Predictability
Rank of at least four stars. The following tutorial article discusses how to implement the most popular
screeners, which also include the Ben Graham Net-Net, Walter Schloss Cheap Stock and Peter Lynch
Growth screeners.
“Value Trap” Screeners

14
So far, the above screeners list potential “buy” targets. However, we also have screeners that list
potential “value traps,” including the James Montier Short Screen and the Margin Declining Screen. Such
companies appear to have value, but the declining margins suggest that these companies have higher
bankruptcy potential and low value potential.
GMO fund manager James Montier researched “the dark side” of value investing by looking at
companies with high price-to-sales ratios relative to the industry, a low Piotroski F-score and double-
digit asset growth. While the Montier Short Screen does not directly look for margin decliners,
companies on the Montier screen have high potential for declining margins in the short-term due to
poor business operations.

15
4. Custom filters in the All-in-One Guru Screener
While the Screener has about 200 predefined filters, the “Customized Filters” feature effectively
increases the number of possible filters to infinity. You can create a user-defined filter by typing in the
formula for the filter using the following steps:
1. First, click on the “Customized” tab, which should be the rightmost tab from Figure 1.4.1. Note
that this tab contains the word “new,” which blinks like a flashlight.
2. Scroll down until you see a blue “Create New Filter” button. When you click on this button, you
should see a screen like the one in Figure 1.8.
Figure 1.8
3. The “Edit Filter Formula” pop-up screen contains two parts: a formula box and a “Valid
Parameters” box. As you type in your filter formula, you can select the desired term from the
drop-down menu. You can also click on the desired term from the “Valid Parameters.”
a. Note: Each parameter requires single quotation marks around the term.
b. The site will notify you if your formula input is invalid. Please check that you spelled the
terms correctly.
4. You can name the filter by typing the name in the small box at the top of the screen. Once you
finish typing the filter formula, click on the blue “Save” button to add the filter to your custom
filter list.

16
5. For each custom filter listed, you can select the min / max value or activate it by clicking the
“Activated” check box. The red number next to the “Customized” tab lists the number of active
Custom filters.
6. Each custom filter has its own row. To edit a custom filter, click on the “pencil” icon located in
the desired filter’s row. To delete a custom filter, click on the “X” icon located in the desired
row. The former pops-up Figure 3 with the existing formula in the big box while the latter pops-
up a dialog box confirming the filter delete.
The following tutorial article illustrates how to create a sample “Strong Stocks 2017” screener.

17
5. Saving custom screeners
Once you finish selecting your desired screener filters, you can save the screen by typing the screen
name in the box next to “Save Current Screen.” As illustrated in Figure 1.9, “Save Current Screen
occupies the white strip between the filter box and the “Screener Results” tabs.
Figure 1.9
To access your saved screens, click on the drop-down menu next to “User Defined Screens” in the
header section (See Figure 1.4.1). Click on the desired screen to display that screen’s active filters and
the company stocks matching the criteria.
The “Manage Screens” button next to the “User Defined Screens” drop-down menu pops up a window
like the one shown in Figure 1.10.
Figure 1.10

18
As illustrated in Figure 1.10, the “Manage Screens” pop-up window contains four columns: screen name,
private, email alert and delete. You can click on the “Private” check box to prevent a screener from
appearing on our “User Defined Screens” list. To receive email alerts when new stocks appear on the top
50 screen results (or when stocks disappear from the list), click on the “Email Alert” check box for the
desired screener. Finally, click on the red “X” to delete a screen. Click to confirm the screener delete
when the dialog box appears.

19
6. The “Screener Results” area
As you select filters, the Screener results area populates the companies that meet all of the selected
criteria. Figure 1.11 shows a sample “Screener Results” screen shot.
Figure 1.11
The pink arrow in Figure 1.11 lists the total records in the Screener results. By default, the Screener
results area first displays the “Active Filters” tab. As the name suggests, this tab only lists financial
information for the filters selected in the filter box. You can click on the other tabs in the gray ribbon at
the header of Figure 1.11 to view financial information for a predefined set of filters. The first nine tabs
correspond to tabs in the filter box, while the four tabs to the right of “Active Filters” offer advanced
features within the Screener. For each of the first nine tabs, the Screener results area lists the
companies that match all of the selected criteria and the following financial information (including the
company ticker symbol):
Fundamental tab: the company name, exchange, market cap ($ millions), price, yield, number of
shares (millions), float shares, return on equity, return on assets and the industry. By default,
the Screener lists the companies in ABC order by ticker symbol. Assume this is the case unless
stated otherwise.
Valuation tab: the price, price-book ratio, price-earnings ratio, price-sales ratio, DCF valuations
(FCF based followed by earnings based), Projected FCF. The Screener lists the companies by
increasing P/E ratios by default.
Profitability tab: the company name, price, gross margin, operating margin, pretax margin and
net margin.
Growth tab: the price, and the 1-year, 5-year and 10-year growth rates for revenue, EBITDA,
EPS, Book, Debt to Revenue and Asset.
Price: the price, market cap, stock beta, trade volume, short ratio and other information about
price changes / price changes relative to the Standard & Poor’s 500 index price.

20
Dividend: the company name, price, trailing dividend yield, five-year yield on cost, payout ratio
and five-year dividend growth rate.
Guru Buy / Sell: the guru name, transaction date, action, price average, price change since
action, current price, transaction comments and resultant shares. By default, the guru trades are
listed from newest to oldest.
Insider: the company name, the insider’s position / name, the transaction date, transaction
details and the current share price. By default, the insider trades are listed from newest to
oldest.
Guru Consensus: the company name, number of shares outstanding, market cap ($ millions),
number of guru owners and information about the company’s top guru holder. By default, the
Screener lists the company stocks by decreasing number of guru owners and excludes
companies with zero guru owners.
Premium members have the option to customize the Screener Results area by clicking on the
“Customized” tab between the “Peter Lynch Charts” and “Valuation Map” tabs. Note that this tab is
different from the “Customized” tab in the filter box above. We will discuss this further in the “Advanced
Features” section later in the user manual.

21
7. All-in-One Screener FAQs
Do I need a Premium membership to use the All-in-One Guru Screener?
o To have full access of the All-in-One Guru Screener, you do need a Premium
membership.
o Note the blurred lines as you attempt to use the Screener. Clicking on one of these
blurred lines will either direct you to the “membership upgrade” screen or the “Home”
screen. If you see the former page, we encourage you to go ahead and sign up for a free
seven-day trial of Premium membership.
Can I screen for technical indicators, like the relative strength index or the simple moving
average?
o You can now screen for technical indicators like the 14-day relative strength index and
the 50-day simple moving average. (We support SMA’s for 20 days, 50 days and 200
days.) Please refer to Section 4.4 for more details on “technical indicator screening.”
What can I do if I cannot find a particular screener filter?
o Please select the “Customized” tab in the filter box and click on the “Create New Filter”
button.
o Then follow the steps illustrated in Section 4, “Creating Custom Filters in the All-in-One
Screener.”
What does the “From Home Exchange” filter do?
o The “From Home Exchange” filter limits the companies to those trading from their home
exchange, e.g., it will only show Apple (AAPL) if you select the USA region.
o This filter allows you to remove duplicate companies from the Screener results area.
Is there a way I can show companies that do not meet all of the selected criteria in the Screener,
in addition to the companies listed?
o Yes. If you look closely at the Screener Results area, you should see the words “Compare
the results with these stocks,” and a white box.
o You can type the ticker symbols you want to compare into the white box.
o For example, let us consider the “Strong Stocks 2017” Screener that we discuss in the
tutorial article. We can compare these results to other companies, like AAPL, IBM and
WMT. Figure 1.12 shows a screen shot of the output:
o o Figure 1.12

22
o The yellow bars in Figure 1.12 indicate that these company stocks do not meet all of the
above criteria and are not included in the “total records” count. For example, the three
stocks we compared do not have a GuruFocus Predictability Rank of four stars or higher,
one of the key filters for the “Strong Stocks 2017” Screener.
Can I download the screener records to Excel?
o Only Premium members can download screener records to Excel. To download the
Screener records to Excel, click on the “XLS Download” link.
o Additionally, Premium members can download just the top 1000 records from the
Screener.
o If you want to download up to 5000 records, you must upgrade to Premium Plus.
How can I exclude industries from the Screener?
o If you click on the button next to “Industry” under the “Fundamental” tab, you will see a
drop-down menu listing all of the industries, as illustrated in Figure 1.13.
o o Figure 1.13
o Consider the pink oval in Figure 1.13. If you select the “Exclude” option, you can select
the industries / sectors you want to exclude from the Screener.
o You can also select or unselect all industries by clicking the “Select/Unselect All” link.
o Similarly, you can also exclude certain companies by tying the stocks to exclude in the
white box after “Stocks” and click on the “Exclude” checkbox between the white box
and the “Go” button.
Can I screen for warning signs?
o Yes. On the “Fundamental” tab, you will see two filters, “Good Signs” and “Warning
Signs.” These two filters are located immediately above “Financial Statement Type” as
Figure 1.14 illustrates.
o o Figure 1.14
o Note: The “Warning Signs” filter applies to the “Severe Warning Signs.” To screen for
“Medium Warning Signs,” please go to Customized Filters and type in ‘Number of
Median Warning Signs’ in the formula box. You can also add a criterion, e.g.

23
o ‘Number of Median Warning Signs’ < 5
o NOTE: Although you can screen for warning signs and good signs, you cannot backtest
on these parameters as of the writing of this user manual. Please try backtesting these
through custom filters.
Why do you show user generated screeners on the home page and on the initial Screener page?
o As “good minds think alike,” the GuruFocus community can share value investing ideas
among themselves. If you have good stock ideas, we can benefit from them if you are
willing to share them with us.
o If you do not want to share your stock ideas, you can set your user defined screener to
“Private” by clicking the “Private” check box next to the “Save” button in the white
“Save Current Screen” strip.
o You can also change the privacy settings for your screeners through “Manage Screens.”
Please refer to Figure 1.10 (Pages 17 and 18 of the user manual) for information on
managing your custom screens.
What happened to the filters for “Price Change?” You used to have them, but they are gone.
o We actually display the “Total Return” instead of the “Price Change.” The “Total Return”
filters show the split and dividend adjusted price changes for the following time periods:
one week, one month, three months, six months and 12 months.
o You will still find the “total return” filters underneath the “Price” tab.
o Note: we might just use “total return” as we get these values from our data vendor.
o You might be interested in a six-month price index. Please consult Section 4.4 for more
details on screening using technical indicators, which includes the relative strength
index and simple moving average.
Section One ends here.

24
Section Two: Backtesting in All-in-One Guru Screener
1. Introduction to Backtesting
Once you create a user-defined investing strategy from the All-in-One Screener, you may want to
“backtest” the strategy and determine the strategy’s outperformance relative to the Standard & Poor’s
500 index exchange-traded fund. You can now backtest your user-defined strategies through GuruFocus.
During June 2016, GuruFocus launched the backtesting feature in the Screener, free of “survival bias
caused by the historical mergers, acquisitions, spin-offs and delisting” as discussed in the new feature
announcement. This section of the user manual will detail the backtesting feature and how to analyze
the results.
Backtesting Preliminaries
Before you can run backtesting, you must first choose the Screener filters that match your investing
strategy. Section one of this user manual details how to screen for companies. Once you finish selecting
the desired filter criteria, click on the “Backtesting” tab among the tabs located in the Screener Results
area. This tab is located immediately to the right of the “Active Filters” tab, as Figure 1.11 illustrates.
Once you click on the “Backtesting” tab, you should see a screen like the one shown in Figure 2.1.
Figure 2.1
Note the large white space in Figure 2.1. Once you run backtesting, the white space will display two
charts that we will discuss further.
25
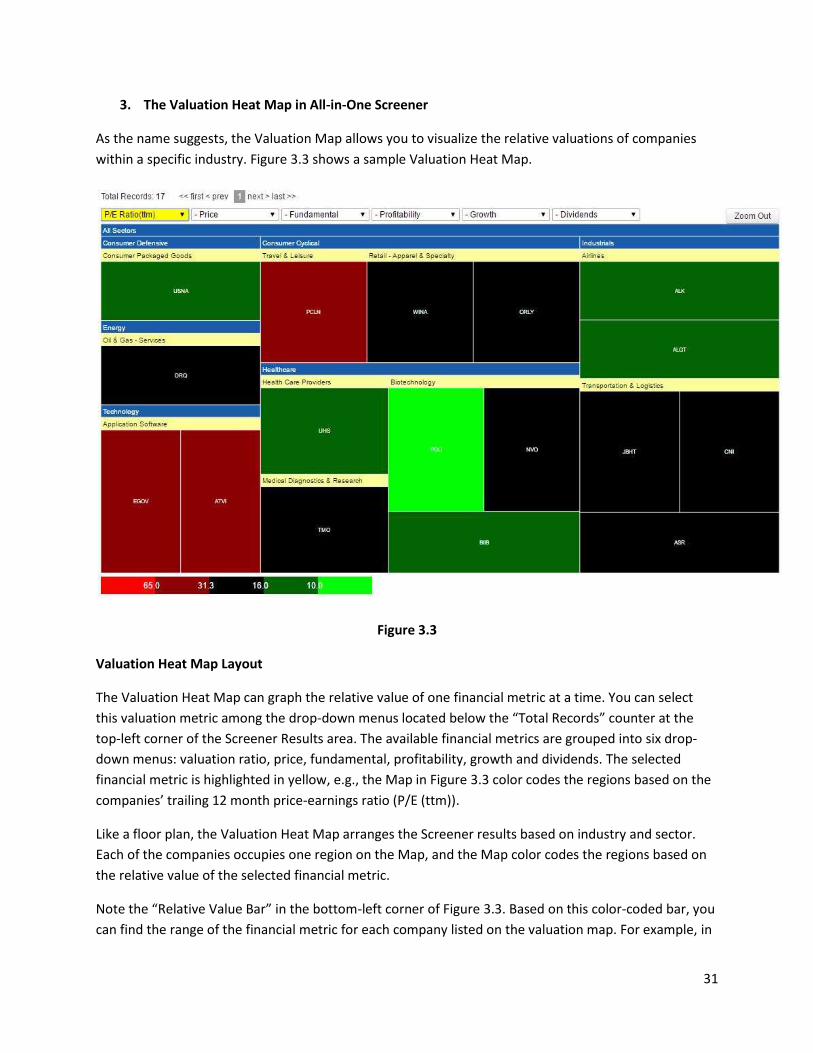
2. Backtesting Parameters
As illustrated in Figure 2.2, the backtesting feature requires several parameters, including the initial
screen date, the rebalance frequency, the maximum number of stocks in the test portfolio and the
financial metric used to rank the company stocks.
Figure 2.2
Screen Date
The “Screen Date” parameter sets the initial date of the backtesting. In the drop-down menu next to
“Screen Date,” select the desired first month of the backtesting period.
Rebalance Frequency
The “Rebalance Frequency” parameter determines how often Backtesting should rebalance your test
portfolio, i.e., close out the current holdings and allocate the proceeds equally to the top-ranked
company stocks at the time of rebalance. You can rebalance your portfolio every three months, six
months or 12 months. You can also choose to “buy and hold,” i.e., not rebalance the test portfolio at all.
Rank by
The “Rank by” parameter controls which financial metric should Backtesting rank your company stocks
by. You can choose the desired parameter from the active filters selected, and then you can rank the
company stocks in ascending order (ASC) or descending order (DESC) based on the selected financial
metric.
Number of Stocks
The “# of Stocks” parameter determines the maximum number of stocks in the test portfolio. You can
choose to have five, 10, 20, 30, 40 or 50 stocks in your portfolio. Backtesting determines which company
stocks to list in the results tab based on the “Rank by” and “# of Stocks” parameters.
Initial Investment Amount
Although the “Initial Investment Amount” does not directly affect backtesting, you can set your initial
investment amount for your test portfolio. By default, the initial investment amount is $1 million.

26
3. Backtesting Results
Once you finishing setting the backtesting parameters, click on the blue “Backtesting” button to run the
backtesting. You will see two charts once the backtesting finishes. Figure 2.3 shows a sample backtesting
output.
Figure 2.3
Chart 1 graphs the model portfolio’s performance relative to three exchange-traded funds: the Standard
& Poor’s 500 index, the Dow Jones industrial average and the Nasdaq. Chart 2, the one below Chart 1,
graphs the portfolio value during the backtesting period. The final value of the portfolio value depends
on the initial investment amount entered.
If you scroll down, you should see two sections: Performance and Annual Performance. The former lists
the portfolio gains over a certain time period while the latter lists the portfolio gains for each year
during the backtesting period. Figure 2.4 shows a sample “Performance” table while Figure 2.5 shows a
sample “Annual Performance” table.
Figure 2.4

27
Figure 2.5
To see the stocks in the model portfolio, click on the Results tab, the lower of the two tabs west of the
Charts. By default, Backtesting lists the initial companies in the model portfolio as Figure 2.6 illustrates.
You can view the companies in the model portfolio during a particular rebalancing period by clicking the
respective tab.
Figure 2.6

28
4. Backtesting FAQs
Do I need Premium membership to run backtesting?
o Yes. (This is the likely reason why Backtesting is highlighted in orange.)
o Furthermore, Premium members can only backtest up to three years. As of the writing
of this user manual, Premium members can use any initial screen date after 2014-01.
o You must upgrade to Premium Plus membership to backtest beyond three years.
Premium Plus members can backtest all the way to 2006-01, the first month we have
backtesting data.
When I run backtesting, I noticed that gurus and insider filters become deactivated. Why does
this occur?
o As mentioned in the June 2016 new feature announcement, we only have the first
release of the Backtesting manual.
o Filters on gurus and insiders are still not supported as of the writing of this user manual.
o However, we do support custom filters in Backtesting.
Can I backtest companies in Europe or U.K.?
o We only support backtesting for U.S. companies as of the writing of this user manual.
Sorry about that.
o Why? Since we want backtesting to be free of survival bias, we include all historical
mergers, acquisitions, spin-offs and delisting in the backtest. In order to show
backtesting results for global companies, we will need “high quality” fundamental data
for delisted companies in global markets.
I see an asterisk between the drop-down menus for “rank by parameter” and “order by”. What
does the asterisk mean?
o The asterisk reminds you that you need to choose an active financial filter for the
backtesting. You will see the following warning message similar to the one in Figure 2.7
if you leave the “Rank By” parameter blank:
o Figure 2.7
Can I download the backtesting results to Excel?
o Yes, if you are a Premium or a Premium Plus member. (Which you should be or
otherwise you won’t be able to access Backtesting at all!)
o You can click the blue “Download all tables to Excel” button to download all backtesting
results into one Excel file. This button should be directly to the right of the “Backtesting”
button.
o You can also download a specific period’s backtesting results by following these steps:
First, click on the Results tab and select the desired backtesting period.
Click on the “XLS Download to Excel” item to download the results.
Section Two ends here.

29
Section Three: Advanced Features in All-in-One Guru Screener
1. Peter Lynch Charts in All-in-One Screener
As the name suggests, you can click on the Peter Lynch Charts tab to view the Peter Lynch chart for all
companies listed in the records. You can view the companies three at a time. For each Peter Lynch chart,
you can graph the historical price and earnings line for the year to date, the past 12 months, the past
three years, the past five years, the past 10 years or all historical years. You can also save the charts or
embed them in your articles.
2. Customized views in All-in-One Screener
In Section One above, we discussed the tabs to the left of the “Backtesting” tab and the financial metrics
discussed on each tab. As a GuruFocus Premium member, you can customize the Screener Results area
by first clicking on the “Customized” tab located two tabs to the right of “Backtesting,” and then clicking
the “Customize View” icon as illustrated in Figure 3.1.
Figure 3.1
By default, the Customized view lists the symbol, company, price, predictability rank, market cap and
price-earnings ratio for the companies meeting all selected criteria. The “Customized View” feature
allows you to select which financial metrics you want to view in the Screener Results area. Figure 3.2
shows a portion of the “Customized view financial metric selection box.”

30
Figure 3.2
The “Custom View Financial Metric Selection Box” lists over 500 financial metrics into nine categories:
fundamental, valuation ratio, profitability, growth, price, dividends, income statement, balance sheet
and cash flow statement. The first six categories correspond to the filter tabs discussed in Section One
while the latter three list financial information from the accounting statements. Once you finish
selecting all of the desired filters (you may need to scroll up and down the page), scroll down to the
bottom where you should see a blue “Save View” button. Click on the “Save View” button to save the
custom view.
You can also download the custom view to Excel by clicking on the CSV or Excel button underneath the
“Customize View” icon.
Note: If you are not a Premium member, you may see blurred lines underneath the “Symbol” and
“Company” headers. Clicking on the blurred lines will take you to our “membership upgrade” page,
where you can sign up for a free seven-day trial of GuruFocus.
31
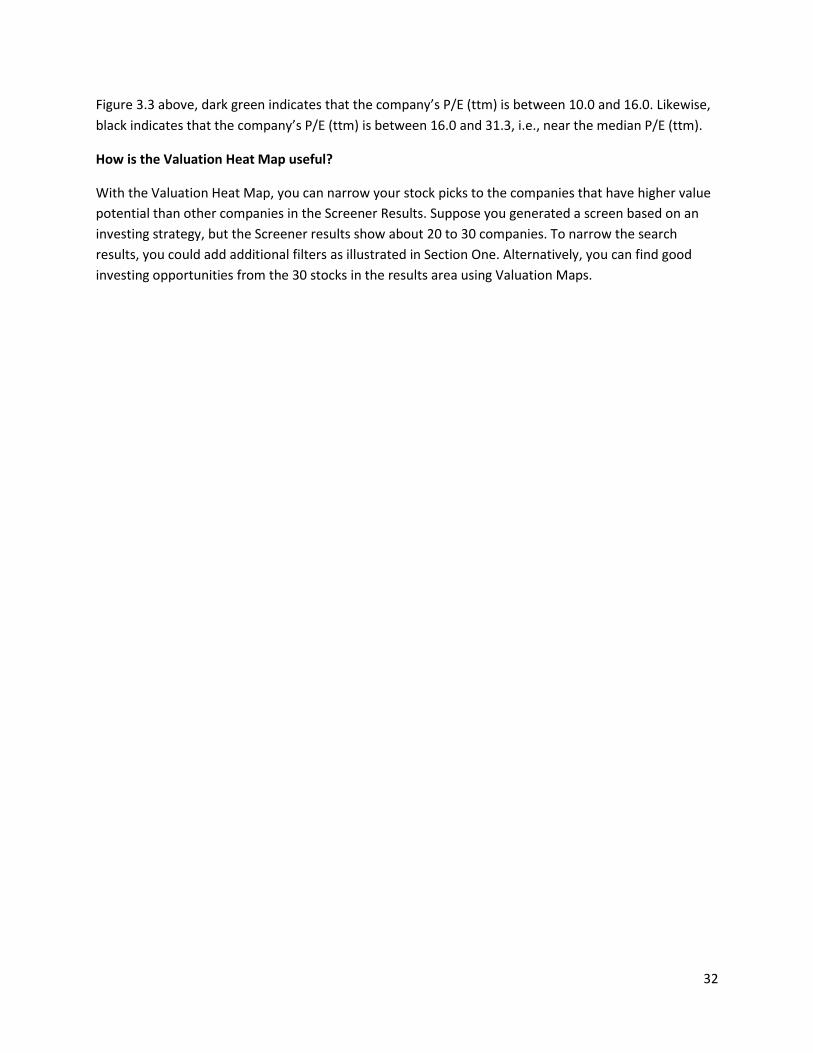
3. The Valuation Heat Map in All-in-One Screener
As the name suggests, the Valuation Map allows you to visualize the relative valuations of companies
within a specific industry. Figure 3.3 shows a sample Valuation Heat Map.
Figure 3.3
Valuation Heat Map Layout
The Valuation Heat Map can graph the relative value of one financial metric at a time. You can select
this valuation metric among the drop-down menus located below the “Total Records” counter at the
top-left corner of the Screener Results area. The available financial metrics are grouped into six drop-
down menus: valuation ratio, price, fundamental, profitability, growth and dividends. The selected
financial metric is highlighted in yellow, e.g., the Map in Figure 3.3 color codes the regions based on the
companies’ trailing 12 month price-earnings ratio (P/E (ttm)).
Like a floor plan, the Valuation Heat Map arranges the Screener results based on industry and sector.
Each of the companies occupies one region on the Map, and the Map color codes the regions based on
the relative value of the selected financial metric.
Note the “Relative Value Bar” in the bottom-left corner of Figure 3.3. Based on this color-coded bar, you
can find the range of the financial metric for each company listed on the valuation map. For example, in
32
Figure 3.3 above, dark green indicates that the company’s P/E (ttm) is between 10.0 and 16.0. Likewise,
black indicates that the company’s P/E (ttm) is between 16.0 and 31.3, i.e., near the median P/E (ttm).
How is the Valuation Heat Map useful?
With the Valuation Heat Map, you can narrow your stock picks to the companies that have higher value
potential than other companies in the Screener Results. Suppose you generated a screen based on an
investing strategy, but the Screener results show about 20 to 30 companies. To narrow the search
results, you could add additional filters as illustrated in Section One. Alternatively, you can find good
investing opportunities from the 30 stocks in the results area using Valuation Maps.

33
Section Four: New Features added to the Screener in June / July 2017
1. Screening for companies using historical data
You will notice we have added the option to screen using historical data between the “Customized” tab
and the “Reset” button as Figure 4.1 illustrates.
Figure 4.1
Click on the check box between “Use historical data” and the corresponding drop-down menu to
activate the “historical data screening” feature. The Screener will then list the companies that met your
screening criteria for the month specified. You can change the backtesting month by selecting it from
the drop-down menu provided as illustrated in Figure 4.2.
Figure 4.2

34
2. Screening from user portfolios
In addition to screening from historical data, you can also screen from a user portfolio. (Notice how this
feature connects the “My Portfolios” feature to our All-in-one Screener, a winning combination.) Figure
4.3 illustrates the location of this filter.
Figure 4.3
You can select the “universe of stocks” for the screener by selecting the desired user portfolio from the
drop-down menu. Figure 4.4 shows a sample screenshot illustrating this.
Figure 4.4
Notice that the Screener automatically populates the “Stocks” filter with the ticker symbols for the
stocks included in the selected portfolio. You can change the “universe of stocks to screen” by selecting
the desired portfolio from the “Load from Portfolio” drop-down menu.
Remark: For both features, the Screener works the same way as outlined in Sections One and Two of
this user manual. Please consult the My Portfolios user manual for details on creating user portfolios.

35
3. Miscellaneous new filters in the Screener
Figure 4.5 shows the lower-left corner of the Fundamental filters box, which contains three newly-added
filters: Next Earnings Date, Most Recent Financial Update and Optionable Stock.
Figure 4.5
Next Earnings Date: This filter allows you to screen for stocks whose next earnings report will be
released in a given time period. You can select from a period of one month to 12 months in one-month
intervals.
Most Recent Financial Update: This filter allows you to screen for stocks that reported a financial update
during a given time period. You can select from a period from one week up to 12 months.
Optionable Stock: The word “optionable” (it is not really a word per se) means that the stock offers call
options and put options. Select “Yes” to view only the stocks that offer options or “No” to view only the
stocks that do not offer options.
We also added a “Probability of Financial Distress” (PFD) filter in the leftmost column underneath the
Fundamental tab as Figure 4.6 illustrates.
Figure 4.6

36
The PFD is the probability that a company will go bankrupt within the next year based on a
comprehensive model containing eight explanatory variables: net income over total market assets, total
liabilities over total market assets, cash over market assets, excess return compared to the S&P 500,
standard deviation of daily returns from the past three months, the relative size, market to book and the
logarithmic share price.
The logit probability of financial distress (LPFD) is a linear sum of the explanatory variables according to
a 2010 Harvard Business School research article:
LPFD = -20.12 * NIMTAAVG + 1.60 * TLMTA – 7.88 * EXRETAVG + 1.55 * SIGMA – 0.005 * RSIZE – 2.27 *
CASHMTA + 0.070 * MB – 0.09 * PRICE – 8.87
PFD = exp (LPFD) / (1 + exp (LPFD))
You can screen for the PFD between 0% and 100% in increments of 5% by selecting the drop-down
menus for PFD.
4. Screening for technical indicators (August 2017 new feature)
You have waited for this “all year long” and it is finally here. You can now screen using technical
indicators like the Relative Strength Index (RSI), the Six-Month Price Index and the Simple Moving
Average (SMA). These filters are located underneath the Price tab as Figure 4.6 illustrates.
Figure 4.6: The filters highlighted in yellow represent the new “technical indicator” Screener filters
You screen for these filters just like how you screen for filters like revenue per share or operating
margin: click on the drop-down menus next to the desired filter to select the desired range. For
example, you can screen for companies whose 14-day relative strength index is between 30 and 50 by
setting the 14-Day RSI filter as (30) To (50).
We will now briefly discuss these technical indicators:
Relative strength index:
o The relative strength index (RSI) determines if a stock is likely “overbought” or
“oversold.” According to Investopedia, the RSI equals 100 minus the quotient of 100 and
a “(1+RS) term.” The RS value equals the average gain of up periods divided by the

37
average loss of down periods during the past 14 days (we only support a 14-day RSI as of
the writing of this user manual).
o Traditionally, an RSI of 70 or above suggests that a stock is likely “overbought” while an
RSI of 30 or below suggests that a stock is likely “oversold.” These values suggest that
over time, the stock’s RSI should “revert to a mean of 50.”
The six-month price index:
o The six-month price index compares the current share price (numerator) to the share
price six months ago (denominator). The share prices are adjusted for stock splits and
cash dividends.
o Price indexes greater than 1 indicate that the company’s share price increased during
the recent six-month period while price indexes less than 1 indicate that the company’s
share price declined during the recent six-month period.
The simple moving average
o The simple moving average (SMA) computes the arithmetic average price of a security
during a set time frame. We currently support SMA for the past 20 days, the past 50
days and the past 200 days.
o You can screen for companies whose share price is between a% and b% above or below
its SMA 20, SMA 50 or SMA 200, where a and b is any multiple of five less than or equal
to 100. This includes screening for combinations of these SMA filters.

38
5. New Features FAQs
Do I need a Premium membership to screen from historical data?
o Yes. Screening from historical data has the same limitations as that of Backtesting (see
Section Two): up to 2014-01 for Premium members and up to 2006-01 for Premium Plus
members.
o Notice that we explicitly indicate which months require Premium Plus with the
(Premium+) tag next to those months.
How can I screen from multiple months?
o We unfortunately do not support this feature as of the writing of this user manual.
o Here is a workaround:
First, please screen for stocks using one month and download the screener
results into a portfolio.
You can then load that portfolio into the Screener and screen for stocks using
the second month.
Repeat the two steps above until you have your desired list of companies.
Do you have data on the stock options themselves?
o We unfortunately do not have options data as of the writing of this user manual.
o You can only screen for stocks that offer options at this time.
o Sorry, but you also cannot backtest on stocks that offer options either.
How does the “Most Recent Financial Update” work? Will it tell me if the financial update is an
8-K, 10-Q or a 10-K?
o Unfortunately, the “Most Recent Financial Update” only gives you the date of the last
financial update.
o You can click on the “Filings” item from a company’s summary page to view the past 10-
Qs and 10-Ks for a specific company. (You will be directed to that company’s SEC Edgar
search page.) Figure 4.6 illustrates the location of the “Filings” button.
o o Figure 4.6
o Our new homepage has a section titled “Latest Quotes,” where you can access your
most-recently viewed stock pages. The Alerts tab, as Figure 4.7 illustrates, will give you
the alert type and details.
o o Figure 4.7

39
Where can I find the “next earnings date” for a company?
o You can find the “next earnings date” in the Financials section of a company’s stock
page as Figure 4.8 illustrates. Note that “Est.” indicates an estimated date.
o o Figure 4.8
Can I backtest on some of these new filters?
o We unfortunately do not support backtesting on the technical indicators even though
the Screener suggests you can.
o You cannot backtest on the “next earnings date” or “most recent financial update” as
well (these filters will be grayed out when you click “Backtesting.”)
How can I screen for a different RSI or SMA, say an SMA 100 or a seven-day RSI?
o We unfortunately only support screening for 14-day RSI and the following SMA’s:
SMA 20
SMA 50
SMA 200
o Note that the Price tab only offers filters for “% above” or “% below” the SMA’s. You can
screen for the SMA’s themselves using Customized filters (please refer to Section 1.4).
o Note that we only have simple moving averages. Sorry, but we do not support screening
on exponential moving averages at this time.

40
All-in-One Screener Manual: Conclusions
The All-in-One Guru Screener is one of the most popular features that GuruFocus provides to its
Premium members. Although every detail of the Screener is beyond the scope of the user manual, this
user manual detailed the Screener Basics, the Backtesting Feature and several other advanced features.
If you are not a Premium member of GuruFocus, you will see a warning message similar to the one
shown in Figure 5 throughout the Screener.
Figure 5
Please click on the orange link to sign up for a free seven-day trial of our Premium Membership, which
gives you full access to the All-in-one Guru Screener and much more. The link is also listed below:
https://www.gurufocus.com/membership/upgrade.php?ref=screener