guy robertson
TRANSCRIPT

8/14/2019 Guy Robertson
http://slidepdf.com/reader/full/guy-robertson 1/25
Static Models, DynamicProcesses and the TongassLand Management Plan
Guy Robertson
Research & DevelopmentUS Forest ServiceWashington Office

8/14/2019 Guy Robertson
http://slidepdf.com/reader/full/guy-robertson 2/25

8/14/2019 Guy Robertson
http://slidepdf.com/reader/full/guy-robertson 3/25

8/14/2019 Guy Robertson
http://slidepdf.com/reader/full/guy-robertson 4/25
Overview
• Two Central Arguments
– Static, deterministic (and complex) models
don’t work in predicting futures for dynamic,stochastic systems
– Adaptive management approaches are very
difficult to implement in highly contentiousplanning environments
8/14/2019 Guy Robertson
http://slidepdf.com/reader/full/guy-robertson 5/25
Overview
• Strategy
Comparison of ex ante predictions and ex postoutcomes associated with the Tongass Land
Management Plan in Southeast Alaska• General planning process
• Economic Impact Analysis
•Predicted harvest levels
Conclude with discussion of new FS planningrule

8/14/2019 Guy Robertson
http://slidepdf.com/reader/full/guy-robertson 6/25
Tongass Land Management Plan
• Part of a recurrent forest planning processstipulated by the NFMA
• Subject to NEPA requiring an EIS
• Anticipated a reduction of timber harvest
• Highly contentious
Framed as a classic conflict between jobs andthe environment

8/14/2019 Guy Robertson
http://slidepdf.com/reader/full/guy-robertson 7/25
Technocratic Planning Model
IDT Produces
NEPA Document
FS Decision
Maker Decision
Within Agency
“Science” Public
Participation
Formal Process
8/14/2019 Guy Robertson
http://slidepdf.com/reader/full/guy-robertson 8/25
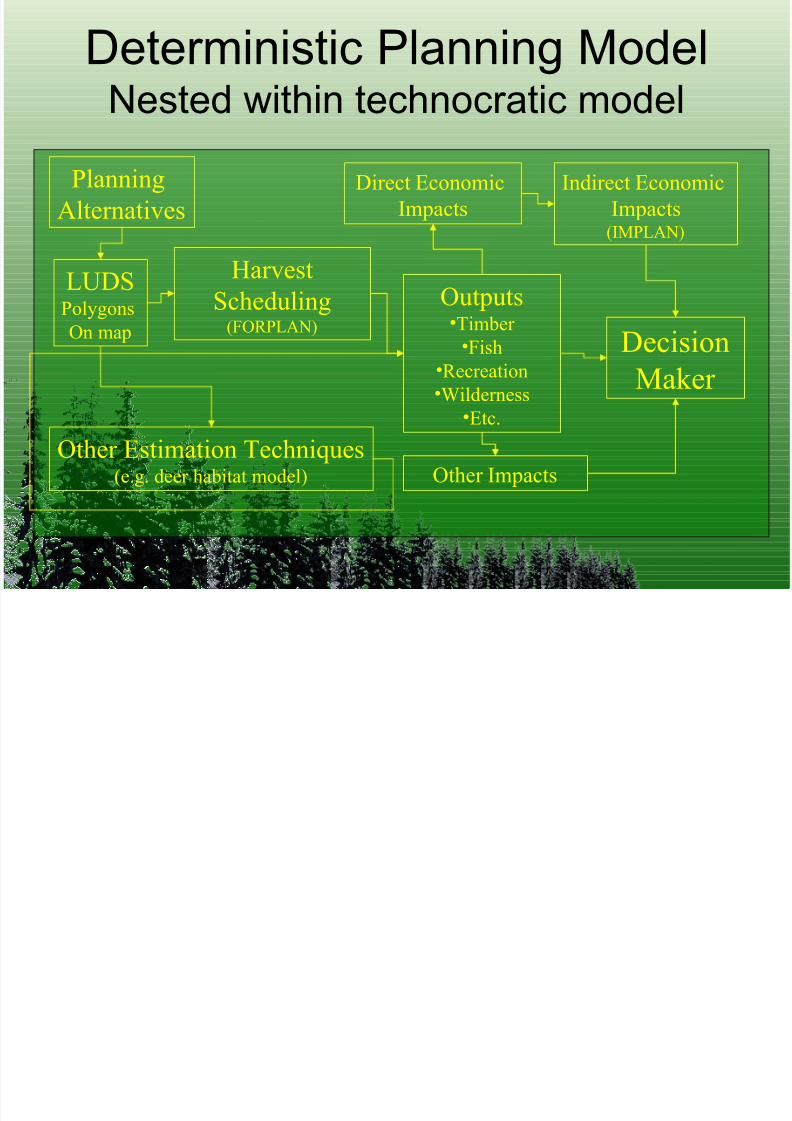
Deterministic Planning ModelNested within technocratic model
LUDSPolygons
On map
HarvestScheduling
(FORPLAN)
Other Estimation Techniques(e.g. deer habitat model)
Planning
Alternatives
Outputs•Timber
•Fish
•Recreation•Wilderness
•Etc.
Direct Economic
Impacts
Other Impacts
Indirect Economic
Impacts(IMPLAN)
Decision
Maker

8/14/2019 Guy Robertson
http://slidepdf.com/reader/full/guy-robertson 9/25
Social Choice Planning Model
Formal Process
Broader Social Arena•Politics•Press•Public Opinion•Courts
Policy Outcome

8/14/2019 Guy Robertson
http://slidepdf.com/reader/full/guy-robertson 10/25
TLMP Preferred Alternative:
Called for a 200 million board foot (MMbf)reduction in harvest(down from previous average of 450 MMbf)
Projected Employment Impacts:
-1,7788.89Total employment (Multiplier = 2.93)
-6073.03Direct Employment
@ -200
MMbf
per
MMbf

8/14/2019 Guy Robertson
http://slidepdf.com/reader/full/guy-robertson 11/25
What Actually Happened:Timber Harvest
0
20
40
60
80
100
120
2001 2002 2003 2004 2005
M i l l i o n B o a r d f
Offered
Sold
Harvested
Markets didn’t cooperate…

8/14/2019 Guy Robertson
http://slidepdf.com/reader/full/guy-robertson 12/25
What Actually Happened: Direct Employment
0
500
1,000
1,500
2,000
2,500
3,000
3,500
4,000
1 9 8 2
1 9 8 3
1 9 8 4
1 9 8 5
1 9 8 6
1 9 8 7
1 9 8 8
1 9 8 9
1 9 9 0
1 9 9 1
1 9 9 2
1 9 9 3
1 9 9 4
1 9 9 5
1 9 9 6
1 9 9 7
1 9 9 8
1 9 9 9
2 0 0 0
2 0 0 1
2 0 0 2
2 0 0 3
2 0 0 4
2 0 0 5
J o b
Plan “implemented”
1,052 Direct jobslost since 1997

8/14/2019 Guy Robertson
http://slidepdf.com/reader/full/guy-robertson 13/25
What about the indirect and
Induced employment impacts?
@ 2.93 total jobs per direct job, impactswould be on the order of:
1,052 x 2.93 = 3,082 jobs
46,000
47,000
48,000
49,000
50,000
51,000
52,000
1993 1994 1995 1996 1997 1998 1999 2000 2001 2002 2003 2004 2005
J o b
Total Employment in SE Alaska

8/14/2019 Guy Robertson
http://slidepdf.com/reader/full/guy-robertson 14/25
In Timber Production Counties?
Total Employment in Ketchikan, Prince of Wales, and Wrangel
10,000
11,000
12,000
13,000
14,000
15,000
16,000
17,000
18,000
19,000
1 9 8 0
1 9 8 2
1 9 8 4
1 9 8 6
1 9 8 8
1 9 9 0
1 9 9 2
1 9 9 4
1 9 9 6
1 9 9 8
2 0 0 0
2 0 0 2
2 0 0 4

8/14/2019 Guy Robertson
http://slidepdf.com/reader/full/guy-robertson 15/25
“Basic” and“Non-Basic”employment inselected
communities
Kake
0
50
100
150
200
250
8
2 .
1
8
3 .
2
8
4 .
3
8
5 .
4
8
7 .
1
8
8 .
2
8
9 .
3
9
0 .
4
9
2 .
1
9
3 .
2
9
4 .
3
9
5 .
4
Year & Quarter
E m p l o y e e Basic
Non-Basic
Haines
0
100
200
300
400
500
600
700
800
900
E m p l o y e e Basic
Non-Basic
Yakutat
0
50
100
150
200
250
E m p
l o y e e
Basic
Non-Basic
Evidence of
Multipliers
…?

8/14/2019 Guy Robertson
http://slidepdf.com/reader/full/guy-robertson 16/25
“Basic” and “Non-Basic”employment inselectedcommunities (first
differenced)
Evidence of
Multipliers
…?
-200
-100
0
100
200
300
82 84 86 88 90 92 94 96
NONBASIC BASIC
Angoon
-200
-150
-100
-50
0
50
100
82 84 86 88 90 92 94 96
NONB ASI C B ASI C
Gustavus
-400
-300
-200
-100
0
100
200
300
82 84 86 88 90 92 94 96
NONBASIC BASIC
Hollis
-150
-100
-50
0
50
100
150
82 84 86 88 90 92 94 96
NONB ASI C B ASI C
Kake
-400
-200
0
200
400
82 84 86 88 90 92 94 96
NONBASIC BASIC
Wrangell
-80
-40
0
40
80
120
82 84 86 88 90 92 94 96
NONB ASI C B ASI C
Yakutat

8/14/2019 Guy Robertson
http://slidepdf.com/reader/full/guy-robertson 17/25
Regression Estimates of Multipliers with+/- 2 standard deviations
Evidence of Multipliers
…?
-2.5
-2
-1.5
-1
-0.5
0
0.5
1
1.5
2
2.5
Y a k u
t a t
A n g o
o n
M e t l a k a t l a
S i t k a
W r a n g e l l
K e t c h i
k a n
H y
d a b u r g
H a i n
e s
J u n e a u
T h o r n e B
a y
H o o n
a h
P e t e r s b u r g
H o
l l i s
K a k e
G u s t a v u s

8/14/2019 Guy Robertson
http://slidepdf.com/reader/full/guy-robertson 18/25
Evidence of Multipliers
…?No
But why?
– Leakage
– Labor inelasticity
– Static models can’t predict dynamicsystems…not even as approximations

8/14/2019 Guy Robertson
http://slidepdf.com/reader/full/guy-robertson 19/25
So was the TLMP a Failure?
No
– Public information document
– Reference to keep the debaters honest
– Focus for social and legal debate• Current conditions
• ProjectionsBut not a success in the narrow technocratic
decision model sense

8/14/2019 Guy Robertson
http://slidepdf.com/reader/full/guy-robertson 20/25
So was the TLMP a Failure?
Also numerous “setbacks” – 1999 New ROD released to address 33 TLMP Appeals.
– 2001 1999 ROD vacated; 1997 ROD reinstated.
– 2003 February 2003: Supplemental Environmental Impact Statement –Roadless Area Evaluation for Wilderness Recommendations Record of Decision.
– 2005 Ninth Circuit Court claims inadequacies in NEPA proceduresrequires additional adjustments and updates of the Forest Plan (officiallycalled a Forest Plan Amendment).
– 2007 The Draft Environmental Impact Statement and proposed ForestPlan Amendment became available for public review
Reaffirms broader social arena as locus of decision making
8/14/2019 Guy Robertson
http://slidepdf.com/reader/full/guy-robertson 21/25
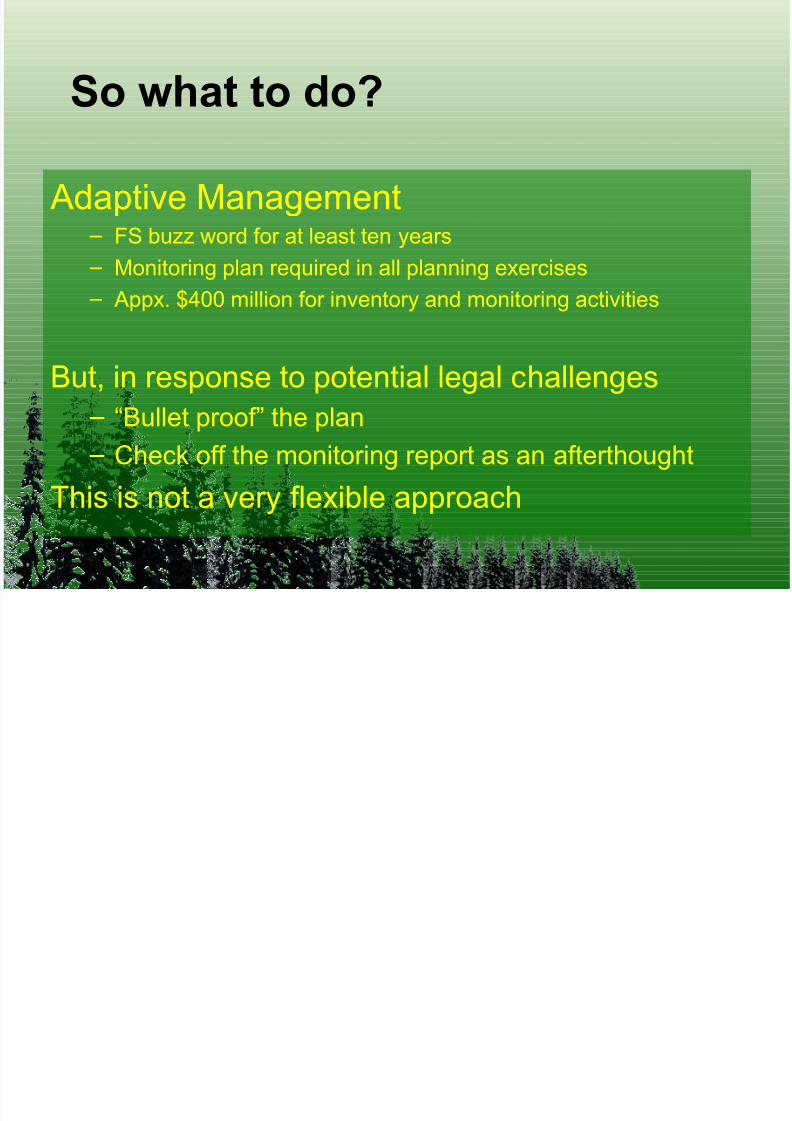
So what to do?
Adaptive Management – FS buzz word for at least ten years
–Monitoring plan required in all planning exercises – Appx. $400 million for inventory and monitoring activities
But, in response to potential legal challenges
– “Bullet proof” the plan – Check off the monitoring report as an afterthought
This is not a very flexible approach

8/14/2019 Guy Robertson
http://slidepdf.com/reader/full/guy-robertson 22/25
New FS Planning Rule
Strategy Design CriteriaVision
Forest Level
Long-term
Collaborative
Project Level
Short-term
Collaborative
Forest Level
Mid-scale
Technical/Collaborative
Combined with EMS and third party monitoring
Internalizes social choice dynamics through collaboration

8/14/2019 Guy Robertson
http://slidepdf.com/reader/full/guy-robertson 23/25
New FS Planning Rule
Aims to provide a flexible planning
approach that avoids conflict and legalchallenges
FS argues that the “vision stage” is not subject to NEPA (EIS) as it does
not involve actions on the ground
Unclear if and how conflict will be arbitrated
However, the Rule itself was successfully challenged in
9th circuit owing to lack of EIS

8/14/2019 Guy Robertson
http://slidepdf.com/reader/full/guy-robertson 24/25
Conclusion
• Technocratic model is out of touch withreality
– Failure to adequately predict – Decision locus not with the agency
• Communication and information flow more
important than technique – Fancy models and false precision

8/14/2019 Guy Robertson
http://slidepdf.com/reader/full/guy-robertson 25/25
Conclusion
• Adaptive management problematic inconflict environment
– From an agency perspective at least – From broader social perspective system may
be adaptive, though cumbersome and
expensive• Anticipating a post-conflict future for public
forest management in US