gwa group | annual report 2014 · gwa group limited 2014 annual report chairman’s review the gwa...
TRANSCRIPT
2014 ANNUAL REPORT
GW
A G
RO
UP
| AN
NU
AL R
EP
OR
T 20
14
STRATEGIC REVIEW COMPLETED
with focus on core Bathrooms & Kitchens and Door & Access Systems businesses and divestment of non-core businesses – Dux Hot Water and Brivis Heating & Cooling
SUBJECT TO SUCCESSFUL DIVESTMENT of Dux and Brivis, capital return options to shareholders will be reviewed
DWELLING COMPLETIONS rise only 4% on a moving annual total basis year on year to March 2014
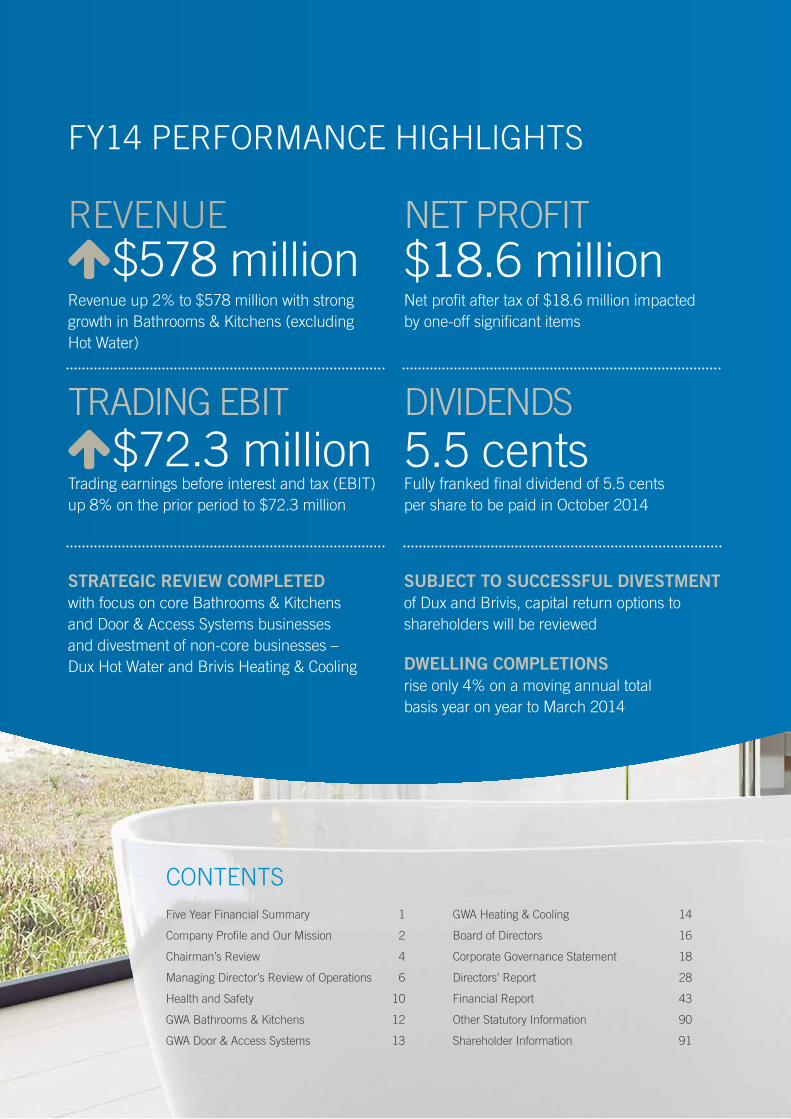
FY14 PERFORMANCE HIGHLIGHTS
Five Year Financial Summary 1
Company Profile and Our Mission 2
Chairman’s Review 4
Managing Director’s Review of Operations 6
Health and Safety 10
GWA Bathrooms & Kitchens 12
GWA Door & Access Systems 13
GWA Heating & Cooling 14
Board of Directors 16
Corporate Governance Statement 18
Directors’ Report 28
Financial Report 43
Other Statutory Information 90
Shareholder Information 91
CONTENTS
REVENUE
Revenue up 2% to $578 million with strong growth in Bathrooms & Kitchens (excluding Hot Water)
TRADING EBIT
Trading earnings before interest and tax (EBIT) up 8% on the prior period to $72.3 million
NET PROFIT
Net profit after tax of $18.6 million impacted by one-off significant items
$18.6 million
DIVIDENDS
Fully franked final dividend of 5.5 cents per share to be paid in October 2014
5.5 cents
$578 million
$72.3 million
1
2009/10 $’000
2010/11 $’000
2011/12 $’000
2012/13 $’000
2013/14 $’000
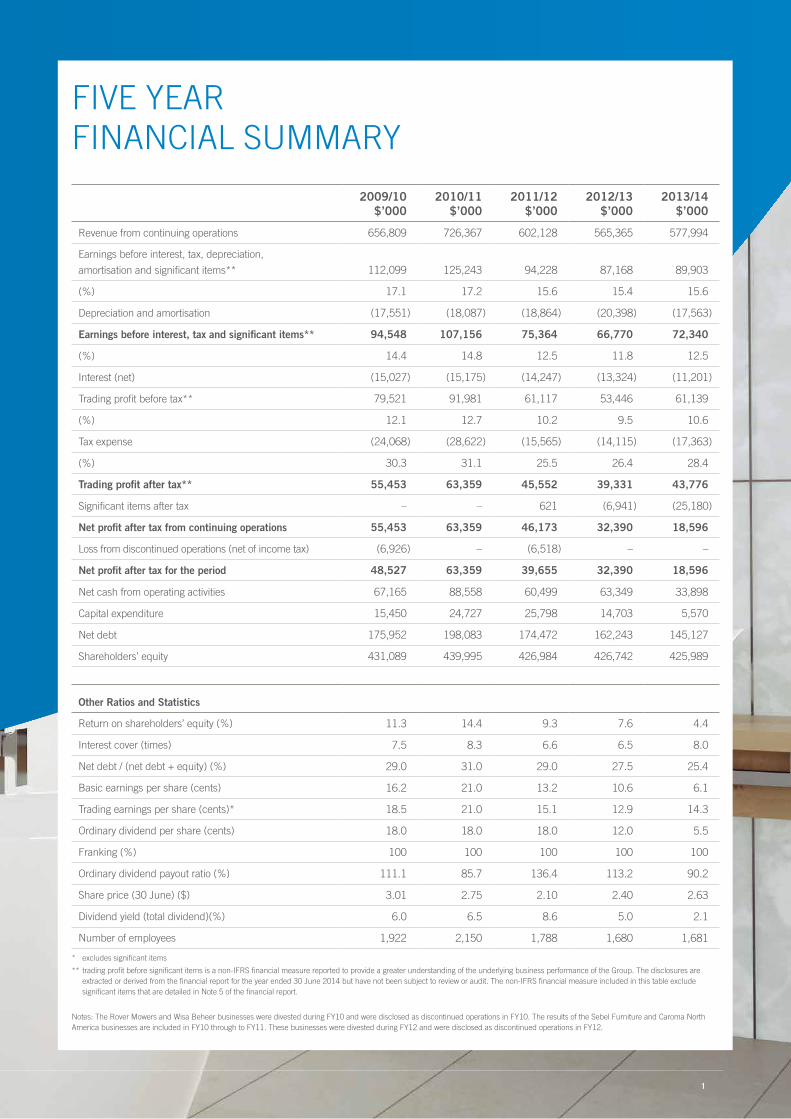
Revenue from continuing operations 656,809 726,367 602,128 565,365 577,994
Earnings before interest, tax, depreciation,
amortisation and significant items** 112,099 125,243 94,228 87,168 89,903
(%) 17.1 17.2 15.6 15.4 15.6
Depreciation and amortisation (17,551) (18,087) (18,864) (20,398) (17,563)
Earnings before interest, tax and significant items** 94,548 107,156 75,364 66,770 72,340
(%) 14.4 14.8 12.5 11.8 12.5
Interest (net) (15,027) (15,175) (14,247) (13,324) (11,201)
Trading profit before tax** 79,521 91,981 61,117 53,446 61,139
(%) 12.1 12.7 10.2 9.5 10.6
Tax expense (24,068) (28,622) (15,565) (14,115) (17,363)
(%) 30.3 31.1 25.5 26.4 28.4
Trading profit after tax** 55,453 63,359 45,552 39,331 43,776
Significant items after tax – – 621 (6,941) (25,180)
Net profit after tax from continuing operations 55,453 63,359 46,173 32,390 18,596
Loss from discontinued operations (net of income tax) (6,926) – (6,518) – –
Net profit after tax for the period 48,527 63,359 39,655 32,390 18,596
Net cash from operating activities 67,165 88,558 60,499 63,349 33,898
Capital expenditure 15,450 24,727 25,798 14,703 5,570
Net debt 175,952 198,083 174,472 162,243 145,127
Shareholders’ equity 431,089 439,995 426,984 426,742 425,989
Other Ratios and Statistics
Return on shareholders’ equity (%) 11.3 14.4 9.3 7.6 4.4
Interest cover (times) 7.5 8.3 6.6 6.5 8.0
Net debt / (net debt + equity) (%) 29.0 31.0 29.0 27.5 25.4
Basic earnings per share (cents) 16.2 21.0 13.2 10.6 6.1
Trading earnings per share (cents)* 18.5 21.0 15.1 12.9 14.3
Ordinary dividend per share (cents) 18.0 18.0 18.0 12.0 5.5
Franking (%) 100 100 100 100 100
Ordinary dividend payout ratio (%) 111.1 85.7 136.4 113.2 90.2
Share price (30 June) ($) 3.01 2.75 2.10 2.40 2.63
Dividend yield (total dividend)(%) 6.0 6.5 8.6 5.0 2.1
Number of employees 1,922 2,150 1,788 1,680 1,681
* excludes significant items
** trading profit before significant items is a non-IFRS financial measure reported to provide a greater understanding of the underlying business performance of the Group. The disclosures are extracted or derived from the financial report for the year ended 30 June 2014 but have not been subject to review or audit. The non-IFRS financial measure included in this table exclude significant items that are detailed in Note 5 of the financial report.
Notes: The Rover Mowers and Wisa Beheer businesses were divested during FY10 and were disclosed as discontinued operations in FY10. The results of the Sebel Furniture and Caroma North America businesses are included in FY10 through to FY11. These businesses were divested during FY12 and were disclosed as discontinued operations in FY12.
FIVE YEAR FINANCIAL SUMMARY

GWA GROUP LIMITED • 2014 ANNUAL REPORT
GWA Group Limited (GWA) listed on the Australian Securities Exchange
in May 1993 and is Australia’s leading supplier of building fixtures and
fittings to households and commercial premises. The Group had 1,681
employees at 30 June 2014 with manufacturing, sales and distribution
facilities located across Australia and with a branch office in New
Zealand. GWA is a member of the ASX 200 index of listed Australian
companies with a market capitalisation in excess of $800 million at
30 June 2014.
COMPANY PROFILE
GWA currently operates through three distinct business divisions including:
GWA Bathrooms & Kitchens is Australia’s foremost designer, manufacturer, importer and
distributor of residential and commercial bathroom and kitchen products. The product range
is distributed under Australian brands including Caroma, Dorf, Fowler, Stylus, Clark, Epure,
Radiant, Irwell, Dux, Ecosmart and international brands including Hansa, Schell, Virtu, EMCO
and Sanitron. In December 2012, the division was expanded to include Dux Hot Water
which is an Australian manufacturer and importer of hot water systems for residential
and commercial markets.
GWA Heating & Cooling is an Australian designer, manufacturer and importer of heating and
cooling systems for residential and light commercial markets. The product range is distributed
under Australian brands including Brivis and APAC.
GWA Door & Access Systems is a leading Australian designer, manufacturer, importer and
distributor of a comprehensive range of access and security systems for use in residential and
commercial premises. The product range is distributed under Australian brands including
Gainsborough, Trilock, Renovator, Austral Lock, Gliderol, Matador and international brands
including Salto, Hillaldam and Eco Schulte. In October 2012, the division was expanded
to include API Locksmiths which is an Australian supplier of security and access control
systems and locksmithing services to major commercial enterprises.
GWA has grown significantly since listing as a result of the strong operating performance
of the core building fixtures and fittings businesses and through successful acquisitions.
The Group remains committed to growing shareholder wealth through organic growth
initiatives in targeted market segments and acquisitions that add value to its core businesses
by supporting expansion into new markets or providing access to new products and solutions.

3
OUR MISSION We will be efficient and easy to deal with.
We recognise that time is precious to both our external and internal customers and is a source of value and sustainable competitive advantage.
We recognise markets are changing and will deliver products and solutions that save time for tradesmen, builders and across commercial projects.
We will refocus our business units on their target market segments to ensure they have unmatched understanding of customer needs, able to reach and influence the key decision makers in these segments.
We will free up our business units to focus on their markets by leveraging corporate functions which will enable:
Increased innovation and market insights;
Closer customer engagement and information via group information systems;
Supply chain efficiencies and responsiveness;
A supportive culture and pipeline of appropriately skilled management; and
Unmatchable scale.
We will pursue acquisitions which leverage our existing market relationship and scale.
32014 ANNUAL REPORT
To be Australia’s LEADING
SUPPLIER of PRODUCTS
and SOLUTIONS to the
RESIDENTIAL and COMMERCIAL
building markets
GWA GROUP LIMITED • 2014 ANNUAL REPORT
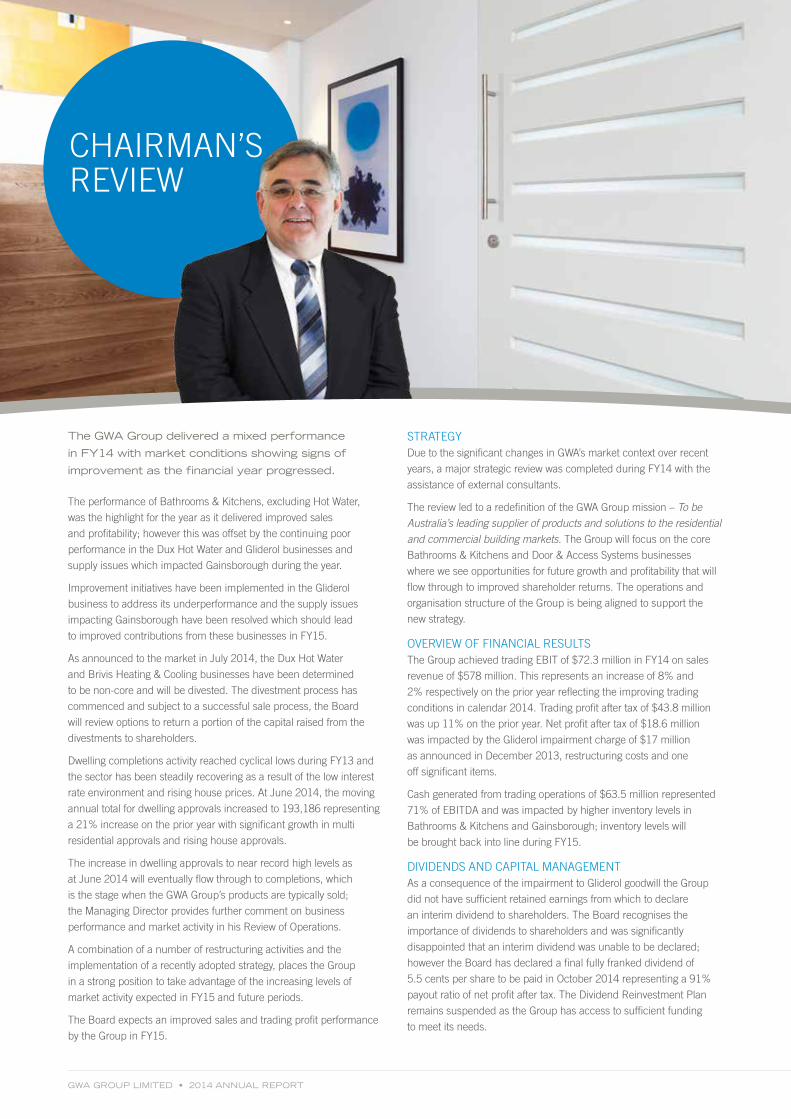
CHAIRMAN’S REVIEW
The GWA Group delivered a mixed performance
in FY14 with market conditions showing signs of
improvement as the financial year progressed.
The performance of Bathrooms & Kitchens, excluding Hot Water,
was the highlight for the year as it delivered improved sales
and profitability; however this was offset by the continuing poor
performance in the Dux Hot Water and Gliderol businesses and
supply issues which impacted Gainsborough during the year.
Improvement initiatives have been implemented in the Gliderol
business to address its underperformance and the supply issues
impacting Gainsborough have been resolved which should lead
to improved contributions from these businesses in FY15.
As announced to the market in July 2014, the Dux Hot Water
and Brivis Heating & Cooling businesses have been determined
to be non-core and will be divested. The divestment process has
commenced and subject to a successful sale process, the Board
will review options to return a portion of the capital raised from the
divestments to shareholders.
Dwelling completions activity reached cyclical lows during FY13 and
the sector has been steadily recovering as a result of the low interest
rate environment and rising house prices. At June 2014, the moving
annual total for dwelling approvals increased to 193,186 representing
a 21% increase on the prior year with significant growth in multi
residential approvals and rising house approvals.
The increase in dwelling approvals to near record high levels as
at June 2014 will eventually flow through to completions, which
is the stage when the GWA Group’s products are typically sold;
the Managing Director provides further comment on business
performance and market activity in his Review of Operations.
A combination of a number of restructuring activities and the
implementation of a recently adopted strategy, places the Group
in a strong position to take advantage of the increasing levels of
market activity expected in FY15 and future periods.
The Board expects an improved sales and trading profit performance
by the Group in FY15.
STRATEGY Due to the significant changes in GWA’s market context over recent
years, a major strategic review was completed during FY14 with the
assistance of external consultants.
The review led to a redefinition of the GWA Group mission – To be Australia’s leading supplier of products and solutions to the residential and commercial building markets. The Group will focus on the core
Bathrooms & Kitchens and Door & Access Systems businesses
where we see opportunities for future growth and profitability that will
flow through to improved shareholder returns. The operations and
organisation structure of the Group is being aligned to support the
new strategy.
OVERVIEW OF FINANCIAL RESULTS The Group achieved trading EBIT of $72.3 million in FY14 on sales
revenue of $578 million. This represents an increase of 8% and
2% respectively on the prior year reflecting the improving trading
conditions in calendar 2014. Trading profit after tax of $43.8 million
was up 11% on the prior year. Net profit after tax of $18.6 million
was impacted by the Gliderol impairment charge of $17 million
as announced in December 2013, restructuring costs and one
off significant items.
Cash generated from trading operations of $63.5 million represented
71% of EBITDA and was impacted by higher inventory levels in
Bathrooms & Kitchens and Gainsborough; inventory levels will
be brought back into line during FY15.
DIVIDENDS AND CAPITAL MANAGEMENTAs a consequence of the impairment to Gliderol goodwill the Group
did not have sufficient retained earnings from which to declare
an interim dividend to shareholders. The Board recognises the
importance of dividends to shareholders and was significantly
disappointed that an interim dividend was unable to be declared;
however the Board has declared a final fully franked dividend of
5.5 cents per share to be paid in October 2014 representing a 91%
payout ratio of net profit after tax. The Dividend Reinvestment Plan
remains suspended as the Group has access to sufficient funding
to meet its needs.

5
Trading EBIT of $72.3 million in FY14 represents an increase of 8% on the prior year reflecting the improving trading conditions in calendar 2014.
09/10
10/11
Trading EBIT $m
11/12
12/13
25 50 75 100 1250 0 50 100 150 250200
09/10
10/11
Net Debt
The Group’s financial metrics remain strong with net debt at the end of June 2014 of $145 million, a reduction of $17 million from June 2013.
11/12
12/13
$m
13/14 13/14
The Group’s financial metrics remain strong with net debt at the end of
June 2014 of $145 million, a reduction of $17 million from June 2013.
Debt is well covered by total bank facilities of $275 million and we
appreciate the ongoing support of our banks including Commonwealth
Bank of Australia, Australia and New Zealand Banking Group, HSBC
Bank Australia and Westpac Banking Corporation.
DIVERSITYThe Board understands the significant benefits that arise from a
diverse workforce and has approved a Diversity Policy which is
available on the Group’s website at www.gwagroup.com.au.
A number of measurable objectives have been approved by the Board
to promote and encourage diversity, particularly the improvement of
female representation within the workforce. The appointment of a
new Group General Manager – People, Culture and Communications,
Ms Kay Veitch, to the senior executive team will assist the Board with
progress in achieving the Group’s measurable objectives.
The Board supports the recommendations of the ASX Corporate
Governance Council on diversity and has provided the required diversity
disclosures in its Corporate Governance Statement. The Group lodged
its Workplace Gender Equality Report with the Workplace Gender
Equality Agency in May 2014 and the report is available on the Group’s
website at www.gwagroup.com.au under Gender Equality Reporting.
EXECUTIVE REMUNERATIONGWA’s remuneration policies continue to be assessed with the
independent advice of Guerdon Associates who were engaged by
the Board for the FY15 executive remuneration review. We aim to
provide remuneration to executives that is fair and sufficient to attract
and retain a high quality management team with the experience,
knowledge, skills and judgment required for the business. In order
to achieve this objective, the key principle is that fixed remuneration
varies between the median and third quartiles relative to companies
of comparable size and scope.
Following shareholder feedback and advice from Guerdon Associates,
the Board has approved changes to the Long Term Incentive Plan which
will apply to grants of Performance Rights to executives during FY15.
The changes address concerns raised by shareholders that the
performance requirements under the EPS hurdle are not sufficiently
challenging for executives compared to market expectations of the
Group’s future EPS growth, and that a significant proportion
of Performance Rights vest at average performance levels.
The changes to the plan which are outlined in detail in the
2014 Remuneration Report are designed to address shareholder
concerns whilst ensuring the plan continues to achieve its
performance objectives.
The Board attempts to balance the need to address market trends
whilst positioning GWA to retain and attract a high quality executive
team led by our experienced Managing Director, Mr Peter Crowley.
The fixed remuneration for Mr Crowley has been frozen since
2011. For other GWA executives, the review by Guerdon Associates
concluded that fixed remuneration is in line with market levels.
Bathrooms & Kitchens and Brivis achieved their short term incentive
trading EBIT financial targets for FY14 reflecting their improved
trading result. No other divisional or corporate short term incentive
financial targets were achieved in FY14.
CARBON EMISSIONS The Board is committed to reducing energy, carbon emissions, water
and waste across the GWA Group operations. GWA reports its Group
carbon emissions annually under the Federal Government’s NGER
Scheme and the reports can be accessed on GWA’s website at
www.gwagroup.com.au under Carbon Reporting.
The FY14 total carbon emissions from GWA’s controlled facilities is
expected to be in line with the previous financial year and has been
impacted by a combination of factors including new facilities, facility
closures, increased production at key manufacturing sites, full year
reporting for API Locksmiths and the implementation of energy
efficiency measures.
SAFETYOur business is only as good as our people and we aim to provide a
safe and rewarding environment in the workplace. We are pleased
with continuing progress in safety performance resulting in a 19%
reduction in the total injury frequency rate in FY14. This was an
excellent outcome and represents the ninth consecutive year of
improvement reflecting the ongoing commitment to creating an
injury free work environment.
In closing, I thank management and staff for their efforts in FY14 and
their ongoing commitment to GWA. We have the people, businesses
and strategies to take advantage of the expected stronger trading
conditions in FY15 as the recovery in dwelling activity gathers pace.
GWA GROUP LIMITED • 2014 ANNUAL REPORT
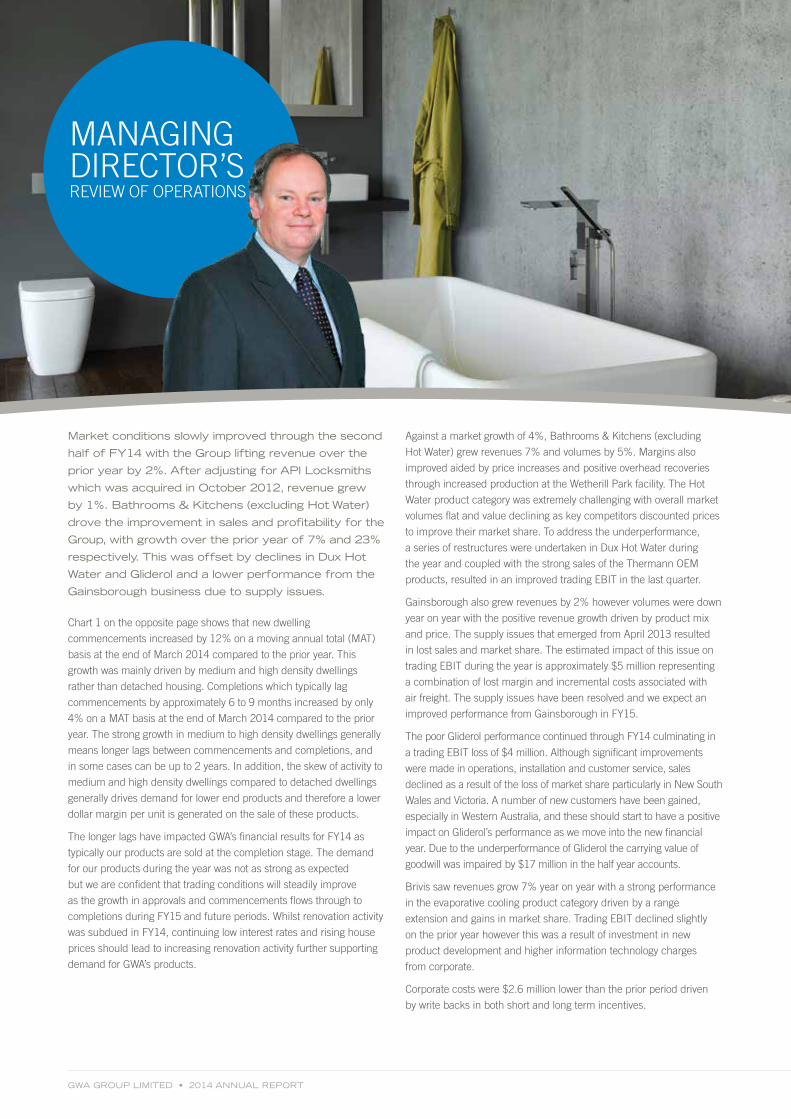
MANAGING DIRECTOR’S REVIEW OF OPERATIONS
Market conditions slowly improved through the second
half of FY14 with the Group lifting revenue over the
prior year by 2%. After adjusting for API Locksmiths
which was acquired in October 2012, revenue grew
by 1%. Bathrooms & Kitchens (excluding Hot Water)
drove the improvement in sales and profitability for the
Group, with growth over the prior year of 7% and 23%
respectively. This was offset by declines in Dux Hot
Water and Gliderol and a lower performance from the
Gainsborough business due to supply issues.
Chart 1 on the opposite page shows that new dwelling
commencements increased by 12% on a moving annual total (MAT)
basis at the end of March 2014 compared to the prior year. This
growth was mainly driven by medium and high density dwellings
rather than detached housing. Completions which typically lag
commencements by approximately 6 to 9 months increased by only
4% on a MAT basis at the end of March 2014 compared to the prior
year. The strong growth in medium to high density dwellings generally
means longer lags between commencements and completions, and
in some cases can be up to 2 years. In addition, the skew of activity to
medium and high density dwellings compared to detached dwellings
generally drives demand for lower end products and therefore a lower
dollar margin per unit is generated on the sale of these products.
The longer lags have impacted GWA’s financial results for FY14 as
typically our products are sold at the completion stage. The demand
for our products during the year was not as strong as expected
but we are confident that trading conditions will steadily improve
as the growth in approvals and commencements flows through to
completions during FY15 and future periods. Whilst renovation activity
was subdued in FY14, continuing low interest rates and rising house
prices should lead to increasing renovation activity further supporting
demand for GWA’s products.
Against a market growth of 4%, Bathrooms & Kitchens (excluding
Hot Water) grew revenues 7% and volumes by 5%. Margins also
improved aided by price increases and positive overhead recoveries
through increased production at the Wetherill Park facility. The Hot
Water product category was extremely challenging with overall market
volumes flat and value declining as key competitors discounted prices
to improve their market share. To address the underperformance,
a series of restructures were undertaken in Dux Hot Water during
the year and coupled with the strong sales of the Thermann OEM
products, resulted in an improved trading EBIT in the last quarter.
Gainsborough also grew revenues by 2% however volumes were down
year on year with the positive revenue growth driven by product mix
and price. The supply issues that emerged from April 2013 resulted
in lost sales and market share. The estimated impact of this issue on
trading EBIT during the year is approximately $5 million representing
a combination of lost margin and incremental costs associated with
air freight. The supply issues have been resolved and we expect an
improved performance from Gainsborough in FY15.
The poor Gliderol performance continued through FY14 culminating in
a trading EBIT loss of $4 million. Although significant improvements
were made in operations, installation and customer service, sales
declined as a result of the loss of market share particularly in New South
Wales and Victoria. A number of new customers have been gained,
especially in Western Australia, and these should start to have a positive
impact on Gliderol’s performance as we move into the new financial
year. Due to the underperformance of Gliderol the carrying value of
goodwill was impaired by $17 million in the half year accounts.
Brivis saw revenues grow 7% year on year with a strong performance
in the evaporative cooling product category driven by a range
extension and gains in market share. Trading EBIT declined slightly
on the prior year however this was a result of investment in new
product development and higher information technology charges
from corporate.
Corporate costs were $2.6 million lower than the prior period driven
by write backs in both short and long term incentives.

7
Cash generated from trading operations of $63.5 million during FY14
represents 71% of EBITDA. The focus on working capital management
resulted in improvements in debtors and creditors however inventories
increased year on year by $33 million. Gainsborough accounted for
$10 million of the increase. Gainsborough inventory at June 2013
was unsustainably low. This coupled with poor performance by a key
vendor resulted in lost sales and the need to build extra stocks as we
transitioned the business to new suppliers. The new supply chain has
been established with our vendors performing well. The inventory we
have built is all high turnover core products and it is expected the
stock levels will reduce to sustainable levels through FY15.
The balance of the inventory build is in Bathrooms & Kitchens. Earlier
in the year we planned to build inventory to mitigate any risk from
impending Enterprise Agreement (EA) negotiations, the Chinese New
Year supplier factory closures and in anticipation of improving dwelling
activity levels. With EA negotiations now largely behind us and dwelling
completion activity continuing to lift we expect that inventory levels will
be brought back in line as we move through FY15.
Due to the impairment of the carrying value of goodwill in Gliderol
in the half year accounts, the Group did not have sufficient retained
earnings to declare an interim dividend in February 2014. However
the Board will pay a fully franked final dividend of 5.5 cents per share,
representing a 91% payout ratio of net profit after tax. The Dividend
Reinvestment Plan will not be offered to shareholders for the final
dividend and remains suspended.
STRATEGY AND GROWTH GWA completed a major strategic review of its operations with the
assistance of Second Road Consulting. The outcome of the work
defined the following:
It is clear that our market context is changing and while GWA remains
Australia’s leading supplier of building fixtures and fittings, our markets
are evolving:
• The relationship with our buyers is becoming more equal and
also less predictable, through trends such as channel consolidation
and digitisation.
• Shifts in supply chain are required for us to be more efficient
and effective.
• Value does not lie solely in the products themselves but also in
the systems and experiences that come with them.
• Industry boundaries are not what they used to be – innovations
from outside of the traditional building and construction spaces
are becoming relevant.
Financial Results for FY14
$Million 2013/14 2012/13%
Change
Sales Revenue 578.0 565.4 2%
Trading EBIT * 72.3 66.8 8%
EBIT Margin 12.5% 11.8%
Trading Profit after Tax * 43.8 39.3 11%
Net Profit after Tax 18.6 32.4 -43%
Trading Earnings per Share * 14.3 12.9 11%
* excludes significant items
Chart 1 – New Dwelling Activity (2003 – 2014)
190,000
Mov
ing
Ann
ual N
umbe
rs
120,000
130,000
140,000
150,000
160,000
170,000
180,000
200,000
June 03 June 04 June 05 June 06 June 07 June 08 June 09 June 10
Dec 11Dec 10Dec 09Dec 08Dec 07Dec 06Dec 05Dec 04Dec 03
June 11 June 12
Dec 12
June 13
Dec 13
June 14
Source: BIS Shrapnel – August 2014Approvals Commencements Completions
GWA GROUP LIMITED • 2014 ANNUAL REPORT
In response to these market context changes, we have developed a
strong argument for our portfolio which is outlined in the table below:
Our Mission
To be Australia’s leading supplier of products and solutions to the
residential and commercial building markets.
What we will do • We will be efficient and easy to deal with.
• We recognise that time is precious to both our external and
internal customers and is a source of value and sustainable
competitive advantage.
• We recognise markets are changing and will deliver products
and solutions that save time for tradesmen, builders and across
commercial projects.
• We will refocus our business units on their target market
segments to ensure they have unmatched understanding of
customer needs, able to reach and influence the key decision
makers in these segments.
• We will free up our business units to focus on their markets
by leveraging corporate functions which will enable:
› Increased innovation and market insights;
› Closer customer engagement and information
via group information systems;
› Supply chain efficiencies and responsiveness;
› A supportive culture and pipeline of appropriately
skilled management; and
› Unmatchable scale.
• We will pursue acquisitions which leverage our existing
market relationship and scale.
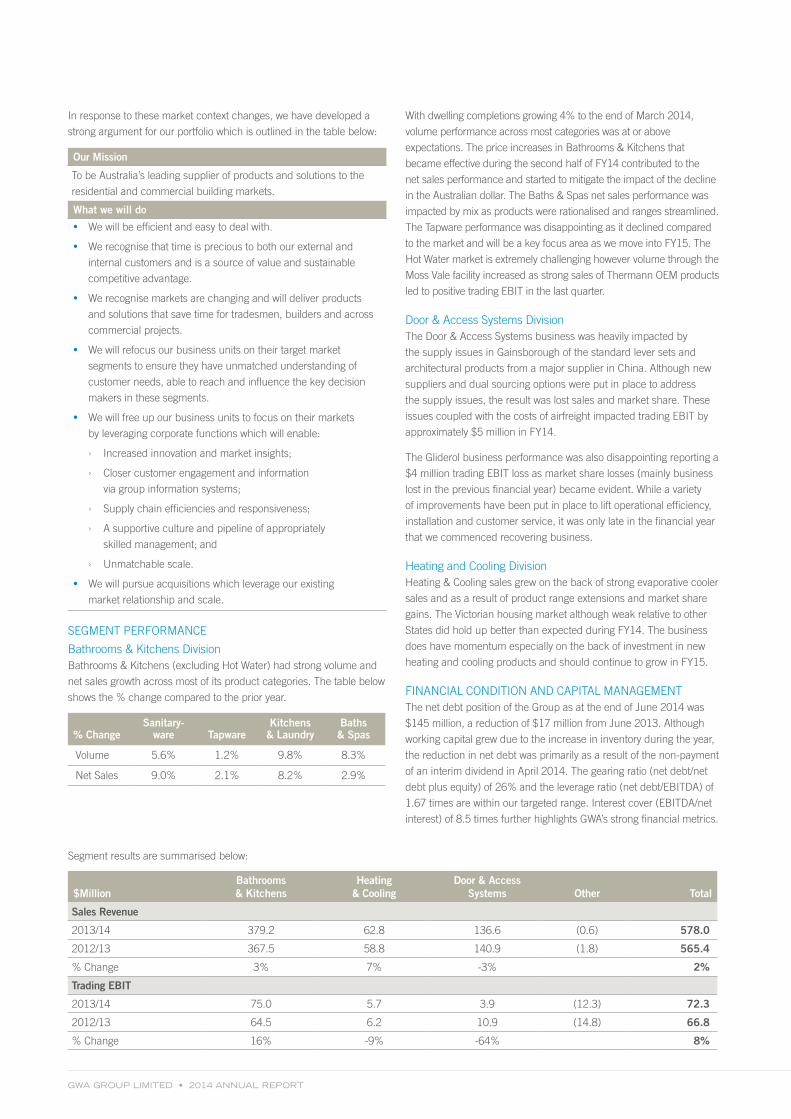
SEGMENT PERFORMANCE
Bathrooms & Kitchens DivisionBathrooms & Kitchens (excluding Hot Water) had strong volume and
net sales growth across most of its product categories. The table below
shows the % change compared to the prior year.
% ChangeSanitary-
ware TapwareKitchens
& LaundryBaths & Spas
Volume 5.6% 1.2% 9.8% 8.3%
Net Sales 9.0% 2.1% 8.2% 2.9%
With dwelling completions growing 4% to the end of March 2014,
volume performance across most categories was at or above
expectations. The price increases in Bathrooms & Kitchens that
became effective during the second half of FY14 contributed to the
net sales performance and started to mitigate the impact of the decline
in the Australian dollar. The Baths & Spas net sales performance was
impacted by mix as products were rationalised and ranges streamlined.
The Tapware performance was disappointing as it declined compared
to the market and will be a key focus area as we move into FY15. The
Hot Water market is extremely challenging however volume through the
Moss Vale facility increased as strong sales of Thermann OEM products
led to positive trading EBIT in the last quarter.
Door & Access Systems DivisionThe Door & Access Systems business was heavily impacted by
the supply issues in Gainsborough of the standard lever sets and
architectural products from a major supplier in China. Although new
suppliers and dual sourcing options were put in place to address
the supply issues, the result was lost sales and market share. These
issues coupled with the costs of airfreight impacted trading EBIT by
approximately $5 million in FY14.
The Gliderol business performance was also disappointing reporting a
$4 million trading EBIT loss as market share losses (mainly business
lost in the previous financial year) became evident. While a variety
of improvements have been put in place to lift operational efficiency,
installation and customer service, it was only late in the financial year
that we commenced recovering business.
Heating and Cooling DivisionHeating & Cooling sales grew on the back of strong evaporative cooler
sales and as a result of product range extensions and market share
gains. The Victorian housing market although weak relative to other
States did hold up better than expected during FY14. The business
does have momentum especially on the back of investment in new
heating and cooling products and should continue to grow in FY15.
FINANCIAL CONDITION AND CAPITAL MANAGEMENTThe net debt position of the Group as at the end of June 2014 was
$145 million, a reduction of $17 million from June 2013. Although
working capital grew due to the increase in inventory during the year,
the reduction in net debt was primarily as a result of the non-payment
of an interim dividend in April 2014. The gearing ratio (net debt/net
debt plus equity) of 26% and the leverage ratio (net debt/EBITDA) of
1.67 times are within our targeted range. Interest cover (EBITDA/net
interest) of 8.5 times further highlights GWA’s strong financial metrics.
Segment results are summarised below:
$MillionBathrooms & Kitchens
Heating & Cooling
Door & Access Systems Other Total
Sales Revenue
2013/14 379.2 62.8 136.6 (0.6) 578.0
2012/13 367.5 58.8 140.9 (1.8) 565.4
% Change 3% 7% -3% 2%
Trading EBIT
2013/14 75.0 5.7 3.9 (12.3) 72.3
2012/13 64.5 6.2 10.9 (14.8) 66.8
% Change 16% -9% -64% 8%

9
As we commence the implementation of the strategic plans, we
remain focussed on maintaining GWA’s investment grade metrics.
The business has a strong balance sheet ensuring it is well positioned
to respond to growth opportunities that arise which are in line with the
strategic plans. The Group has a $275 million facility which was put
in place in May 2013. This facility comprises a three year tranche of
$200 million which expires in July 2016 and a five year tranche of
$75 million which expires in July 2018. GWA has sufficient undrawn
debt facilities and in-principle support from our banks to increase
facilities to fund growth opportunities if required.
A summary of our debt position and existing facilities at the end
of June 2014 is provided in the table below:
GWA Group Bank Facilities and Net Debt at 30 June 2014
Bank $Million
Available Facilities
Drawn Facilities Maturity Profile
CBA 85
ANZ 80
Westpac 55
HSBC 55
Gross debt 275 175.0 0.0
July 2016 – $200 million July 2018 – $75 million
Cash and deposits (29.9)
Net debt 145.1
HEALTH AND SAFETY Management is committed to continuous improvement in GWA’s
health and safety performance through better safety systems and
processes, extensive communication with our workforce and increased
diligence in identifying and removing safety risks across our workplace.
Continuous improvement in safety performance over the past 9 years
has been consolidated with a further 19% decline in the total injury
frequency rate (TIFR) in FY14. With our TIFR reducing to 6.2, we have
a consistent sense of purpose in creating a safe work environment for
our people. Despite these impressive results, we still had 12 employees
(two fewer than last year) sustain lost time injuries during the year which
we will continue striving to reduce. Good safety is good management
and reflects both the efforts of management and the diligence of our
workforce. We remain committed to continuous safety improvements
with the objective of creating an injury free work environment.
The below chart highlights the continued improvement in the TIFR
in FY14.
2008/09 2010/112009/100
30
20
10
Chart 2 – GWA Group Total Injury Frequency Rate (TIFR)
2011/12 2013/142012/13
SUSTAINABILITY AND CARBON REDUCTIONGWA has an active program to improve our impact on the environment
through the reduction of energy, carbon emissions, water and waste.
Our environmentally sustainable products are also a major source of
competitive advantage for the Group.
GWA reports greenhouse gas emissions under the National
Greenhouse and Energy Reporting Scheme and the reports are
available on the Group’s website at www.gwagroup.com.au under
Carbon Reporting. The FY14 carbon emissions will not be finalised
until September 2014 however our direct carbon emissions are
estimated to be 9,000 tonnes CO2e with 20,000 tonnes CO2e of
indirect carbon emissions through the purchase of energy. The total
carbon emissions (both direct and indirect) for FY14 are expected to
be approximately 29,000 tonnes CO2e which is in line with the total
reported carbon emissions for the Group in FY13.
PEOPLEGWA’s long term success has been due to the efforts of a committed
and talented workforce. We continue to bring new thinking and skills
into the business and are committed to developing our people to
provide succession opportunities. The Group recognises the benefits
that can be achieved from a diverse workforce and has implemented
policies aimed at improving workplace diversity. The appointment of a
new Group General Manager – People, Culture and Communications,
Ms Kay Veitch, to the senior executive team will assist the promotion
of diversity and the development of succession plans for key senior
management roles.
In support of these objectives, a significant investment has been
made during the year with Spencer Stuart assessing our leaders and
key senior managers. GWA Group is committed to creating a high
performance culture where employees can learn and develop to their
full potential. This will ensure the Group has the right capabilities to
execute the strategic plans and meet our growth ambitions.
FUTURE PROSPECTS AND RISKSThe outlook for FY15 is positive with improved house prices and rising
dwelling commencements driving higher sales. We will implement
the strategic plans and with the focus on growing the core Bathrooms
& Kitchens and Door & Access Systems businesses, we will be
well positioned to take advantage of the stronger market conditions
expected in FY15 and future periods. We have developed clear
initiatives aimed at our target market segments in both core divisions
and together with an enhanced and centralised corporate structure
should see leveraging of Group expertise and improved efficiency.
There are a number of key business risks that may impact on the
achievement of the outlook for FY15 and future periods including:
• The expected improvement in dwelling and renovation activity does
not eventuate or is delayed.
• The regaining of market share in Gainsborough and Gliderol takes
longer than expected leading to continued underperformance and
poor profitability.
• Unforeseen disruptions impacting product supply from material
offshore suppliers leading to lower sales and loss of market share.
We will be in a better position to update the market on FY15 trading
performance at the Annual General Meeting in October 2014 following
first quarter trading and updated data on dwelling activity.
GWA GROUP LIMITED • 2014 ANNUAL REPORT
HEALTH & SAFETY
GWA continues to ensure that it provides a safe
workplace for its employees, contractors, visitors
and customers in an efficient and compliant manner.
Through divisional or site based health and safety
managers, the Group promotes awareness of health
and safety in a continuous improvement environment.
The health and safety managers meet periodically with the Group
Risk Manager with the collective objectives of:
• Discussing safety performance, goals and improvement strategies
• Exchanging ideas and detailing successful improvement programs
• Promoting training through guest speakers and external experts
• Planning for cross site auditing (whereby health and safety
managers visit other internal GWA sites)
• Planning and implementing of new systems and procedures
The Group Risk Manager prepares a monthly Group Risk Report
for the Board and attends the May and November Audit and Risk
Committee meetings to present the Operational Risk Report. The
reporting includes current health and safety performance, current
improvement plans and compliance to regulations. An audit plan,
consistent with the Group’s health and safety objectives, is also
presented for approval by the Board for the new financial year.
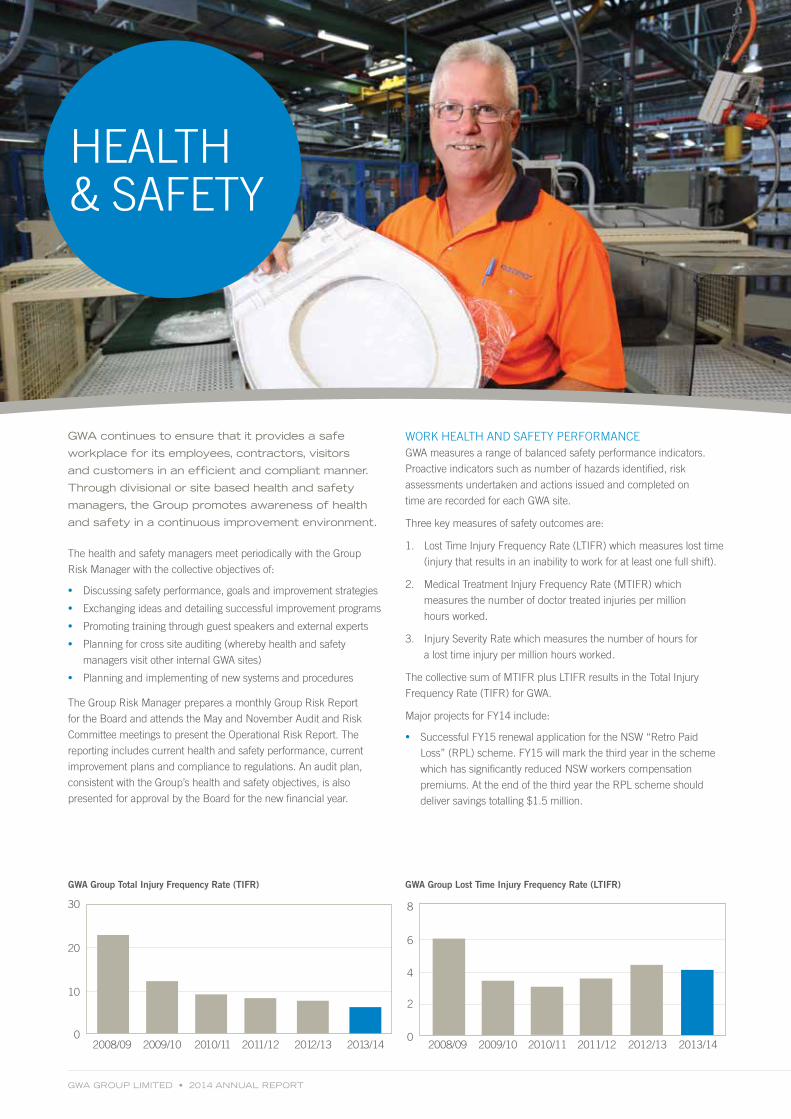
WORK HEALTH AND SAFETY PERFORMANCEGWA measures a range of balanced safety performance indicators.
Proactive indicators such as number of hazards identified, risk
assessments undertaken and actions issued and completed on
time are recorded for each GWA site.
Three key measures of safety outcomes are:
1. Lost Time Injury Frequency Rate (LTIFR) which measures lost time
(injury that results in an inability to work for at least one full shift).
2. Medical Treatment Injury Frequency Rate (MTIFR) which
measures the number of doctor treated injuries per million
hours worked.
3. Injury Severity Rate which measures the number of hours for
a lost time injury per million hours worked.
The collective sum of MTIFR plus LTIFR results in the Total Injury
Frequency Rate (TIFR) for GWA.
Major projects for FY14 include:
• Successful FY15 renewal application for the NSW “Retro Paid
Loss” (RPL) scheme. FY15 will mark the third year in the scheme
which has significantly reduced NSW workers compensation
premiums. At the end of the third year the RPL scheme should
deliver savings totalling $1.5 million.
GWA Group Total Injury Frequency Rate (TIFR)
2008/09 2010/112009/100
30
20
10
2011/12 2012/13 2013/14
GWA Group Lost Time Injury Frequency Rate (LTIFR)
2008/09 2010/112009/10 2011/120
2
4
6
8
2012/13 2013/14

11
• The upgrade of GWA’s elearning platform to enhance compliance
for workplace health and safety (WHS) training in areas such as
bullying, safety in the workplace and site inductions. The training
is an important supplement to the Group’s policies and procedures
in these areas.
• Completed training of approximately 200 GWA managers for
anti-bullying awareness. A central GWA bullying reporting/
compliance officer has been appointed to handle bullying
complaints in the Group.
• Continued the project commenced in 2013 to integrate WHS
management systems across all Group businesses into one
consistent structure. This project is expected to be completed
by December 2014.
At the start of FY14 the GWA executive team set a target of 10% year
on year improvement for TIFR versus the FY13 results. The actual
improvement in TIFR performance was 19% which was significantly
better than the target and was an excellent outcome. This is the ninth
consecutive year that GWA has improved TIFR performance and
demonstrates the Group’s ongoing commitment to an injury
free workplace.
Highlights within the GWA divisions during FY14 include:
• The Group Injury Severity Rate (ISR) has reduced for the second
year in a row however the reduction in FY14 was less than 1%
compared to the prior year and the target of 2600 was not met.
Heating & Cooling and Bathrooms & Kitchens achieved a reduction
in ISR of 43% and 20% respectively from the prior year.
• All GWA divisions except Doors & Access Systems achieved
better than target results for TIFR. Bathrooms & Kitchens
achieved a 52% reduction in TIFR from the prior year which
was an excellent outcome.
WHS improvement objectives and projects are planned to be met
through continuation of the FY14 initiatives including:
• FY15 TIFR target of a further 6% reduction versus FY14 results
by continuing to focus on hazard identification and regular audits.
• Plans to reduce ISR to 2600 through improved return to work plans
and injury management.
2008/09 2010/112009/10 2011/120
5
20
15
10
GWA Group Medical Treatment Injury Frequency Rate (MTIFR)
2012/13 2013/14 2008/09 2010/112009/10 2011/12
1000
GWA Group Injury Severity Rate (ISR)
2000
3000
4000
5000
02012/13 2013/14
GWA GROUP LIMITED • 2014 ANNUAL REPORT
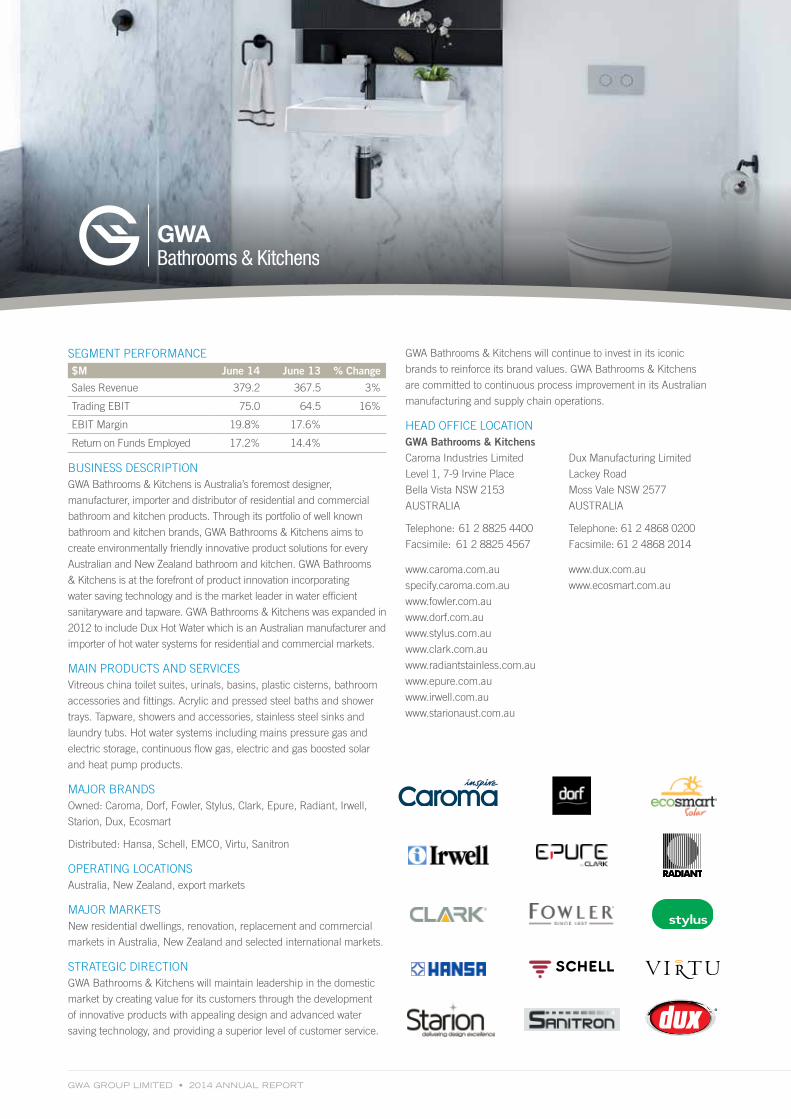
SEGMENT PERFORMANCE$M June 14 June 13 % Change
Sales Revenue 379.2 367.5 3%
Trading EBIT 75.0 64.5 16%
EBIT Margin 19.8% 17.6%
Return on Funds Employed 17.2% 14.4%
BUSINESS DESCRIPTIONGWA Bathrooms & Kitchens is Australia’s foremost designer,
manufacturer, importer and distributor of residential and commercial
bathroom and kitchen products. Through its portfolio of well known
bathroom and kitchen brands, GWA Bathrooms & Kitchens aims to
create environmentally friendly innovative product solutions for every
Australian and New Zealand bathroom and kitchen. GWA Bathrooms
& Kitchens is at the forefront of product innovation incorporating
water saving technology and is the market leader in water efficient
sanitaryware and tapware. GWA Bathrooms & Kitchens was expanded in
2012 to include Dux Hot Water which is an Australian manufacturer and
importer of hot water systems for residential and commercial markets.
MAIN PRODUCTS AND SERVICESVitreous china toilet suites, urinals, basins, plastic cisterns, bathroom
accessories and fittings. Acrylic and pressed steel baths and shower
trays. Tapware, showers and accessories, stainless steel sinks and
laundry tubs. Hot water systems including mains pressure gas and
electric storage, continuous flow gas, electric and gas boosted solar
and heat pump products.
MAJOR BRANDS Owned: Caroma, Dorf, Fowler, Stylus, Clark, Epure, Radiant, Irwell,
Starion, Dux, Ecosmart
Distributed: Hansa, Schell, EMCO, Virtu, Sanitron
OPERATING LOCATIONS Australia, New Zealand, export markets
MAJOR MARKETS New residential dwellings, renovation, replacement and commercial
markets in Australia, New Zealand and selected international markets.
STRATEGIC DIRECTION GWA Bathrooms & Kitchens will maintain leadership in the domestic
market by creating value for its customers through the development
of innovative products with appealing design and advanced water
saving technology, and providing a superior level of customer service.
GWA Bathrooms & Kitchens will continue to invest in its iconic
brands to reinforce its brand values. GWA Bathrooms & Kitchens
are committed to continuous process improvement in its Australian
manufacturing and supply chain operations.
HEAD OFFICE LOCATION GWA Bathrooms & Kitchens Caroma Industries Limited
Level 1, 7-9 Irvine Place
Bella Vista NSW 2153
AUSTRALIA
Telephone: 61 2 8825 4400
Facsimile: 61 2 8825 4567
Dux Manufacturing Limited
Lackey Road
Moss Vale NSW 2577
AUSTRALIA
Telephone: 61 2 4868 0200
Facsimile: 61 2 4868 2014
www.caroma.com.au
specify.caroma.com.au
www.fowler.com.au
www.dorf.com.au
www.stylus.com.au
www.clark.com.au
www.radiantstainless.com.au
www.epure.com.au
www.irwell.com.au
www.starionaust.com.au
www.dux.com.au
www.ecosmart.com.au

13
SEGMENT PERFORMANCE$M June 14 June 13 % Change
Sales Revenue 136.6 140.9 -3%
Trading EBIT 3.9 10.9 -64%
EBIT Margin 2.9% 7.7%
Return on Funds Employed 4.4% 10.6%
BUSINESS DESCRIPTIONGWA Door & Access Systems is a leading Australian designer,
manufacturer, importer and distributor of a comprehensive range of
access and security systems for use in residential and commercial
premises. The division comprises three business units including
the following:
• Gainsborough Hardware which is a leading Australian designer,
manufacturer, importer and distributor of a comprehensive range
of residential and commercial door hardware and fittings, including
security products.
• Gliderol Garage Doors which is a leading Australian manufacturer
and distributor of garage doors and openers for residential and
commercial markets.
• API Locksmiths which is a national supplier of security and
access control systems and locksmithing services to major
commercial enterprises.
MAIN PRODUCTS AND SERVICESA comprehensive range of door hardware and access systems
comprising door handles (knobs and levers), locking systems, door
closers, hinges and other door accessories. A wide range of roller doors,
sectional overhead doors, automatic operators, gate operators and roller
shutters. Commercial locksmithing services for security systems and
safes, supply and installation of electronic access control systems and
associated products including CCTV, alarms and intercoms.
MAJOR BRANDS Owned: Gainsborough, Trilock, Renovator, Austral Lock, Gliderol,
Matador, API Locksmiths
Distributed: Salto, Hillaldam, Eco Schulte
OPERATING LOCATIONSAustralia, export markets
MAJOR MARKETS Residential home builders, DIY and renovation projects, commercial
buildings and multi-dwelling developments, after sales servicing.
STRATEGIC DIRECTION GWA Door & Access Systems strategic direction encompasses the
development of new and innovative door hardware, access system
technologies and garage door products to suit residential buildings and
commercial projects. GWA Door & Access Systems will continue to focus
on its key customer relationships through the supply of market leading
product innovation and design, and high levels of customer service.
HEAD OFFICE LOCATION GWA Door & Access Systems
Gainsborough Hardware Industries
Limited
31-33 Alfred Street
Blackburn VIC 3130
AUSTRALIA
Telephone: 61 3 9877 1555
Facsimile: 61 3 9894 1599
API Services and Solutions
Pty Limited
248 Normanby Road
South Melbourne VIC 3205
AUSTRALIA
Telephone: 131KEY(539)
Facsimile: 61 3 9644 5887
www.gainsboroughhardware.com.au www.apisec.com.au
www.ausloc.com
Gliderol International Pty Limited
31-33 Alfred Street
Blackburn VIC 3130
AUSTRALIA
Telephone: 61 3 9877 1555
Facsimile: 61 3 9894 1599
www.gliderol.com.au
GWA GROUP LIMITED • 2014 ANNUAL REPORT
SEGMENT PERFORMANCE$M June 14 June 13 % Change
Sales Revenue 62.8 58.8 7%
Trading EBIT 5.7 6.2 -9%
EBIT Margin 9.0% 10.6%
Return on Funds Employed 12.6% 13.0%
BUSINESS DESCRIPTIONGWA Heating & Cooling is an Australian designer, manufacturer
and importer of heating and cooling systems for residential and light
commercial markets. All products are developed to provide consumers
with greater control and comfort in their home or work environments.
GWA Heating & Cooling has developed an extensive range of innovative
environmental products to meet the changing regulatory requirements,
while assisting consumers to reduce their energy consumption and
manage comfort in the home.
MAIN PRODUCTS AND SERVICESThe range includes heating and cooling systems, such as ducted gas
furnaces, evaporative coolers and inverter based refrigerated heating
and cooling systems. All products are supported by an after sales and
service department with a full range of spare parts used to maintain
the products.
MAJOR BRANDS Owned: Brivis, APAC
OPERATING LOCATIONS Australia, overseas distributors
MAJOR MARKETS GWA Heating & Cooling participates in the new home, renovation and
replacement or breakdown markets primarily for residential and light
commercial applications.
STRATEGIC DIRECTION GWA Heating & Cooling will continue to develop its range of climate
solutions for consumers and take them to market through its
channel partners under its strong brands. Much of the development
in the division will be centered around reducing energy and water
consumption to meet emerging Australian regulations. GWA Heating
& Cooling will continue to strengthen its key customer and channel
relationships, invest in brands and reduce costs through investment in
improved manufacturing capability and selective sourcing of products
and components.
HEAD OFFICE LOCATION GWA Heating & Cooling Brivis Climate Systems Pty Ltd
61 Malcolm Road
Braeside VIC 3195
AUSTRALIA
Telephone: 61 3 9264 9555
Facsimile: 61 3 9264 9400
www.brivis.com.au

15

GWA GROUP LIMITED • 2014 ANNUAL REPORT
DARRYL MCDONOUGH BBUS (ACTY), LLB (HONS), SJD, FCPA, FAICD
Independent Chairman and Non-Executive Director
• Expertise: Experienced public company director and lawyer
• Special Responsibilities: Chairman of Board and Nomination
Committee and member of Remuneration and Audit and
Risk Committees
Mr McDonough was appointed Deputy Chairman and Non-Executive
Director of GWA Group Limited in 2009 and was appointed Chairman
effective 30 October 2013. He has over 25 years of corporate
experience as a director and lawyer. He has served as a director
of a number of public companies in the past, including Bank of
Queensland Limited and Super Retail Group Limited and is a
Past-President of The Australian Institute of Company Directors,
Queensland Division.
JOHN MULCAHY PHD (CIVIL ENGINEERING), FIE AUST
Independent Deputy Chairman and Non-Executive Director
• Expertise: Civil Engineer and experienced public company director
• Special Responsibilities: Member of Remuneration and
Nomination Committees
Mr Mulcahy was appointed a Non-Executive Director of GWA Group
Limited in 2010 and Deputy Chairman effective 30 October 2013.
He is a Fellow of the Institute of Engineers and is a Non-Executive
Director of Mirvac Group Limited, Coffey International Limited,
ALS Limited and a Guardian of the Future Fund. He is the former
Managing Director and Chief Executive Officer of Suncorp Group
Limited (“Suncorp”). Prior to joining Suncorp, he held a number
of senior executive roles at the Commonwealth Bank and Lend
Lease Corporation.
During the past three years, Mr Mulcahy has served as a director
of the following other listed companies, and the period in which
the directorships have been held:
• Mirvac Group Limited since 2009*
• Coffey International Limited since 2009*
• ALS Limited since 2012*
*denotes current directorship
PETER CROWLEY BA BECON FAICD
Managing Director
• Expertise: Broad manufacturing experience in Australia
and overseas
2003: Managing Director of GWA Group Limited
2001: Managing Director and Chief Executive, Austrim Nylex Limited,
a diversified industrial company
1999: Executive Director, Cement and Lime, The Rugby Group PLC,
a UK Public Company with extensive international cement
operations. During this period, also served as a director of
Adelaide Brighton Limited
1997: Chief Executive, Cockburn Cement Limited (a subsidiary of The
Rugby Group PLC), Western Australia’s largest cement producer
and Australia’s largest lime producer
1982: Various roles with Queensland Cement Limited and its parent
company Holderbank culminating in General Management
responsibilities within Australia and South-East Asia
.
BILL BARTLETT FCA, CPA, FCMA, CA (SA)
Independent Non-Executive Director
• Expertise: Chartered Accountant, actuarial, property, insurance
and financial services
• Special Responsibilities: Chairman of Remuneration and Audit
and Risk Committees and member of Nomination Committee
Mr Bartlett was appointed a Non-Executive Director of GWA Group Limited in 2007 and Chairman of the Audit and Risk Committee in October 2009. He is a Fellow of the Institute of Chartered Accountants and was a partner at Ernst & Young in Australia for 23 years, retiring on 30 June 2003. He is Chairman of the Cerebral Palsy Council of Governors and a former director and honorary treasurer of the Bradman Museum and Foundation.
During the past three years, Mr Bartlett has served as a director of the following other listed companies, and the period in which the directorships have been held:
• Suncorp Group Limited since 2003*
• Reinsurance Group of America Inc (NYSE) since 2004*
• Abacus Property Group since 2007*
*denotes current directorship
BOARD OF DIRECTORS
17
ROBERT ANDERSON
Independent Non-Executive Director
• Expertise: Property investment and transport logistics
Mr Anderson was appointed a Non-Executive Director of GWA Group
Limited in 1992. He was appointed a director of the former public
company, GWA Limited in 1979 after joining the Group in 1955
where he gained wide experience in management, investment
and property matters.
.
PETER BIRTLES BSC, ACA
Independent Non-Executive Director
• Expertise: Chartered Accountant, retail, financial and operational
• Special Responsibilities: Member of Audit and Risk Committee
Mr Birtles was appointed a Non-Executive Director of GWA Group Limited in November 2010. He is a Chartered Accountant and is the current Managing Director and Chief Executive Officer of Super Retail Group Limited (“Super Retail”). He was formerly the Chief Financial Officer of Super Retail. Prior to joining Super Retail, he held a variety of finance, operational and information technology roles with The Boots Company in the United Kingdom and Australia and worked for Coopers & Lybrand.
During the past three years, Mr Birtles has served as a director of the following other listed company, and the period in which the directorship has been held:
• Super Retail Group Limited since 2006*
*denotes current directorship
RICHARD THORNTON CA B COM (ACC) LLB (HONS) LLM
Executive Director and Company Secretary
• Expertise: Chartered Accountant, taxation and finance
Mr Thornton was appointed an Executive Director of GWA Group
Limited in May 2009. He joined GWA Group Limited in 2002 as
Group Taxation Manager and Treasurer and was appointed Company
Secretary in 2003. He is a Chartered Accountant and is experienced
in accounting, taxation and finance through positions at Coopers
& Lybrand, Citibank and Ernst & Young in Australia and overseas.
Mr Thornton continued in his role as Company Secretary following
his appointment as an Executive Director in 2009. He is a director
of Great Western Corporation Pty Ltd.

GWA GROUP LIMITED • 2014 ANNUAL REPORT
The Board of Directors is responsible for the corporate governance
of GWA Group Limited (the Group) which is an essential part of the
role of the Board. The Group’s corporate governance practices have
been in place since listing and are constantly reassessed in the light of
experience, contemporary views and guidelines on corporate governance
practices. The Board adopts practices it considers to be superior and
which will lead to better outcomes for the Group’s shareholders.
The Board supports the Corporate Governance Principles and
Recommendations (the recommendations) of the ASX Corporate
Governance Council. The Board confirms that the current
corporate governance practices of the Group meet or exceed the
recommendations. The Group’s corporate governance disclosures
have been prepared in accordance with the third edition of the
recommendations of the ASX Corporate Governance Council which
are effective for financial years commencing 1 July 2014. Additional
disclosures have also been provided to enhance the transparency
of the Group’s corporate governance practices.
PRINCIPLE 1 – LAY SOLID FOUNDATIONS FOR MANAGEMENT AND OVERSIGHT
Role of the Board and ManagementThe Board is responsible for the long term growth and financial
performance of the Group. The Board charts the strategic direction
of the Group and monitors executive and senior management
performance on behalf of shareholders. To achieve this, the
Board is engaged in the following activities:
• Providing input and final approval of corporate strategies and
performance objectives developed by senior management.
• Approval and monitoring of financial and other reporting.
• Monitoring of executive and senior management performance,
including the implementation of corporate strategies, and
ensuring appropriate resources are available.
• Appointment and monitoring of the performance of the
Managing Director.
• Liaison with the Group’s External Auditor through the Audit
and Risk Committee.
• Ensuring that the Group has appropriate systems of risk
management and internal controls, reporting mechanisms
and delegation authority limits in place.
• Approval and monitoring the progress of major capital expenditure,
capital management, acquisitions and divestments.
• Any other matters required to be dealt with by the Board
from time to time depending upon circumstances of the Group.
• Other matters referred to in the Board and Board Committee charters.
The Board operates under a charter that details the functions and
responsibilities of the Board. The charter is reviewed annually
to ensure it remains consistent with the Board’s objectives and
responsibilities. Refer to the Group’s website at www.gwagroup.com.au
for a copy of the charter.
Management is responsible for the implementation of corporate
strategies and performance objectives and all aspects of the day to day
running of the Group. Management are also responsible for ensuring
the Group operates within the risk parameters set by the Board and for
providing the Board with accurate and timely information to enable the
Board to carry out its duties.
Delegations PolicyThe Board has approved a Delegations Policy which clearly outlines
the authorities of the Board and those which have been delegated
to senior executives covering all management activities. The policy
ensures that the executives understand the authorities delegated
by the Board and are accountable to the Board for its compliance.
Annual reviews are conducted on the appropriateness of the delegated
authorities and any material breaches are reported to the Board.
Background ChecksBefore the appointment of directors and senior executives the Group
ensures that appropriate background checks are conducted as to
the person’s character, experience, education, criminal record and
bankruptcy history. This is an important step in the recruitment
process to ensure the appointment of suitable candidates to the
director and senior executive roles.
All material information relevant to the election or re-election of directors
is provided to shareholders in the director profiles which are included in
the Explanatory Memorandum to the Notice of Annual General Meeting.
The following information is provided to shareholders:
• Details of the qualifications, skills and experience of the director
• Details of any other directorships held by the director
• The term of office currently served by the director (if any)
• A statement if the Board considers the director independent
• A statement on whether the Board supports the election or
re-election of the director
• Any other material information advised to shareholders that is
relevant to the decision on whether to elect or re-elect the director
CORPORATE GOVERNANCE STATEMENT FOR THE YEAR ENDED 30 JUNE 2014

19
Letter of AppointmentNew directors of the Group are provided with a formal letter
of appointment which outlines the key terms and conditions of
their appointment. Similarly, senior executives including the
Managing Director, Executive Director and Chief Financial Officer
have formal job descriptions and letters of appointment describing
their salary arrangements, rights and responsibilities and entitlements
on termination.
A comprehensive induction program is available to directors and
senior executives to ensure full understanding of the Group, its
policies and procedures and the industry within which it operates.
Company SecretaryThe Company Secretary is accountable to the Board, through the
Chairman, on all matters to do with the proper functioning of the
Board including all corporate governance matters. The Company
Secretary is responsible for the completion and dispatch of the agenda
and papers for each Board and Committee meeting. The Company
Secretary prepares the draft minutes for each meeting, which are
tabled at the next Board meeting for review and approval. The
Company Secretary and the directors communicate regularly
on all Group and governance matters.
Diversity in the WorkforceThe Group is committed to the promotion of diversity in the
organisation through the implementation of targeted employment
policies and initiatives to achieve a diverse workforce. The Board
understands the significant benefits that can arise from increasing the
pool of talent from which the Group can draw high quality employees
and the different perspectives that can be brought to the organisation
from a diverse workforce.
The Group strengthened its focus on diversity in 2012 with the Board’s
approval of a specific Diversity Policy which is available on the Group’s
website at www.gwagroup.com.au. In accordance with the policy, the
Board has established a number of measurable objectives to promote
and encourage increased diversity and in particular, to improve the
representation of females within the workforce. The measurable
objectives are assessed annually and performance is reported in
the Corporate Governance Statement in the Annual Report.
The measurable objectives are:
1. Increase the percentage of females employed by GWA
• Ensure the recruitment process and practices continue
to comply with equal opportunity principles.
• Provide recruitment training for managers ensuring a focus
on equal opportunity and avoiding ‘unconscious bias’.
• Investigate the feasibility of implementing a graduate
program with an emphasis on encouraging women into
non-traditional roles.
2. Provide and promote flexible work practices to attract and
retain female employees
• Continue to promote awareness of current flexible work
practices available in the Group to existing employees
and potential candidates.
• Investigate and implement any additional flexible work
arrangements appropriate to the needs of employees
with families.
3. Succession planning and high potential employee development
• Ensure high potential female employees are identified as
part of the Group’s succession planning process and actively
developed for career progression.
During the year the Group’s recruitment practices were reviewed to
ensure they continue to comply with equal opportunity principles and
encourage diversity. An easy to use recruitment guide was developed
and circulated to all managers. Recruitment training for managers
is planned for the upcoming year which will reinforce the equal
opportunity principles and encourage diversity in the recruitment
process to assist in achieving an increase in the percentage of females
employed by the Group. The implementation of a graduate program is
still under consideration.
The Group has continued to promote the ‘Work Life Balance’ policies
introduced in 2011. These policies, such as paid parental leave and
flexible work arrangements, were aimed at assisting in attracting more
females to apply for positions advertised and retaining the current
female employees. It is pleasing that based on the Group’s 2014
Workplace Gender Equality Report, 44% of staff recruited into the
organisation during the reporting period were female, a significant

GWA GROUP LIMITED • 2014 ANNUAL REPORT
increase from the previous year’s percentage of 31%. The Group
continues to have a number of employees moving to flexible working
arrangements, particularly on return from parental leave. The Group
regularly reviews its policies and practices to ensure they are offering
the flexibility required to attract and retain female talent.
In July 2014 the Group appointed a new Group General Manager –
People, Culture and Communications, Ms Kay Veitch. Ms Veitch is
part of the senior executive team reporting directly to the Managing
Director and will enhance the focus on developing talent in the
organisation and ensuring succession plans are in place for key senior
management roles including the promotion of talented and high
potential females. The position will assist the Board with its progress
towards achieving the Group’s measurable objectives to promote
and encourage increased diversity in the organisation including an
improved representation of females.
As outlined in the Group’s 2014 Workplace Gender Equality Report,
the overall workforce consists of 28% female and 72% male. This is a
small but encouraging increase in the percentage of female employees
from the prior year.
The following table outlines the Group’s workplace profile at
31 March 2014:
Title % Female % Male
Board 0% 100%
Key Management Personnel 0% 100%
Other executives/General Managers 33% 66%
Senior Managers 18% 82%
Other Managers 12% 88%
Total – Management 13% 87%
Professionals 28% 72%
Technicians and trade 4% 96%
Clerical and Administrative 70% 30%
Sales 28% 72%
Machinery Operators and drivers 8% 92%
Labourers 24% 76%
Others 0 100%
Total – Non-Management 30% 70%
Overall Totals 28% 72%
In May 2014, the Group lodged its 2014 Workplace Gender Equality
Report with the Workplace Gender Equality Agency in accordance
with the Workplace Gender Equality Act 2012. The Group notified its
employees and employee organisations that it lodged its report and
advised how it may be accessed. The Group also allowed employees
and employee organisations to make comments on the report. The
report is available on the Group’s website at www.gwagroup.com.au
under Gender Equality Reporting. The Group received notification
during June 2014 that it is compliant with the Workplace Gender Equality Act 2012.
Performance Evaluation – DirectorsThe Nomination Committee conducts an annual evaluation of the
performance of the Board, the Board Committees and the individual
Board members to determine whether they are functioning effectively
by reference to current good practice. The performance evaluation is
conducted by the Chairman of the Board through open discussions
with the Board members and detailed questionnaires as required.
Any issues or improvement opportunities identified from the
performance evaluation are actioned.
During FY14 a performance evaluation of the Board was conducted
by the Chairman in accordance with the evaluation process.
Performance Evaluation – Senior ExecutivesPerformance reviews of senior executives are conducted formally on
a bi-annual basis. The performance review process is critical to the
development of senior executives and enables performance issues to
be addressed. The Group has identified core competencies for the key
roles in the organisation and these are incorporated into individual job
descriptions. During the performance review process, the performance
of senior executives is assessed against the business objectives and
core competencies.
Measurable personal financial and business improvement goals
are established during the performance review process and the
achievement of the personal goals is incorporated into the Group’s
Short Term Incentive Plan as outlined in the Remuneration Report.
During FY14 performance reviews of senior executives were
conducted in accordance with the performance review process.
PRINCIPLE 2 – STRUCTURE THE BOARD TO ADD VALUE
Board MeetingsThe Board meets at least 9 times each year for scheduled meetings
and may, on other occasions, meet to deal with specific matters that
require attention between scheduled meetings. Together with the
Board Committees, the directors use the Board meetings to challenge
and fully understand the business and its operational issues. To assist
with the Board’s understanding of the business, the Board regularly
conducts Board meetings at the various business locations followed
by management presentations and site tours.
The Divisional Chief Executives and General Managers are required to
regularly attend and present at the Board meetings on divisional and
business unit operational issues and performance. An annual group
strategy meeting is held as part of the budget approval process which
enables the Board to review corporate strategies and performance with
the executives. This ensures that the Board is effectively carrying out
its duties of providing input and approving corporate strategies and
performance objectives.
The Chief Financial Officer is required to attend Board meetings
and present the finance department monthly report, and to answer
questions from the directors on financial performance, accounting,
risk management and treasury matters.
Composition of the BoardThe Board presently comprises 7 directors, 5 of whom, including the
Chairman and Deputy Chairman, are non-executive directors and 2,
the Managing Director and Executive Director, are executive directors.
The profiles of the directors are set out in the Annual Report. The
profiles outline the skills, experience and expertise of each Board
member, including the period of office held by each director.
CORPORATE GOVERNANCE STATEMENT (CONT) FOR THE YEAR ENDED 30 JUNE 2014
21
The composition of the Board is determined by the Nomination
Committee and, where appropriate, external advice is sought.
The following principles and guidelines are adhered to:
• The Board should maintain a majority of non-executive directors
• The Board should consist of a majority of independent directors
• The Chairperson should be an independent director
• The role of Chairperson and Managing Director should not be
exercised by the same individual
• Non-executive directors should not be involved in management
of the day to day operations of the Group
• All Board members should be financially literate and have relevant
experience in the industries in which the Group operates
Re-Election of DirectorsIn accordance with the Group’s constitution, at each Annual General
Meeting, a number of directors will face re-election. One third of
the Board (excluding the Managing Director and any director not
specifically required to stand for re-election) must stand for re-election.
In addition, no director (other than the Managing Director) may hold
office for more than three years without standing for re-election and
any director appointed by the Board since the last Annual General
Meeting must stand for re-election at the next Annual General
Meeting. All retiring directors are eligible for re-election.
Independence of DirectorsThe Board considers that the non-executive directors must be
independent from management and free of any business or other
relationship that could interfere, or reasonably be perceived to interfere,
with the exercise of their unfettered and independent judgment.
In considering the relationships which may affect independent
status as outlined in the recommendations of the ASX Corporate
Governance Council, it has been determined that the Group’s non-
executive directors are independent. Therefore, the Board comprises
5 independent directors and 2 non-independent directors (being
the Managing Director and Executive Director) which meets the
recommendation of the ASX Corporate Governance Council of
having a majority of the Board comprising independent directors.
The table below outlines the Group’s directors considered
to be independent.
The Board is responsible for ensuring that the action of individual
directors in the Boardroom is that of independent persons. The Board
distinguishes between the concept of independence and issues of
conflict of interest or material personal interest which may arise from
time to time – refer Conflicts of Interest on the following page.
In recognising the importance of the independence of directors
and the immediate disclosure of conflicts of interest, the Board has
included both matters as permanent items on the agenda at Board
meetings. Any independence or conflict of interest issues that arise
must be disclosed to the Chairman prior to each Board meeting.
The disclosure is recorded in the Register of Directors’ Interests
and in the Board minutes.
(i) Legal Services provided by Clayton Utz
During FY14 Clayton Utz provided legal services amounting to
$712,246 (2013: $332,195) to the Group as outlined in the key
management personnel transactions in the Directors’ Report. The legal
services were provided on arm’s length terms and covered specialty
areas including employment, environment, competition, acquisition,
litigation, corporate and commercial advice.
Mr Darryl McDonough is Chairman and Non-Executive Director of
GWA Group Limited and is also a partner of Clayton Utz. Mr McDonough
is not involved in providing any of the legal services to the Group,
nor does he influence the selection of legal adviser by the Group.
The Group also uses other legal providers.
The Group has utilised Clayton Utz for legal services for many years
prior to the appointment of Mr McDonough. Clayton Utz is one of
Australia’s leading legal firms and the Group has a high regard for the
expertise of their partners and quality of legal support. Over the years
Clayton Utz has developed a detailed knowledge and understanding
of GWA’s business operations and requirements which knowledge
enhances the quality of legal support provided to the Group.
The increase in legal fees paid to Clayton Utz during FY14 has been
driven by the selection of Clayton Utz as the Group’s preferred legal
provider for general corporate advisory work including commercial
contract and property leasing legal support. The Group previously used
a smaller legal firm for these services which did not meet the Group’s
needs. Litigaton services were also provided by Clayton Utz during
FY14 in support of the Group’s claims against Carrier – refer Note 27
of the financial statements.
The Board is of the view that the provision of legal services by
Clayton Utz has no impact on the independence of Mr McDonough
who continues to be classified as an independent director.
(ii) Length of Service – Mr Robert Anderson
The Board is of the opinion that the length of service of Mr Anderson
as Non-Executive Director (since 1992) has not compromised his
ability to bring independent judgement to bear on issues before
Director Role Length of Service Non-Executive Independent
Mr Darryl McDonough Chairman 5 years Yes Yes
Mr John Mulcahy Deputy Chairman 4 years Yes Yes
Mr Peter Crowley Managing Director 11 years No No
Mr Bill Bartlett Non-Executive Director 7 years Yes Yes
Mr Robert Anderson Non-Executive Director 22 years Yes Yes
Mr Peter Birtles Non-Executive Director 4 years Yes Yes
Mr Richard Thornton Executive Director 5 years No No

GWA GROUP LIMITED • 2014 ANNUAL REPORT
the Board and to act in the best interests of the Group and its
shareholders. Mr Anderson is a highly experienced director and has a
deep understanding of the Group and its businesses through his long
association. The Group and its shareholders are well served by his
appointment as a director.
(iii) Board Succession Planning
The Board has established succession plans for the retirement of
individual Board members to ensure an appropriate balance of skills,
experience and expertise on the Board. The Board views director
renewal as an essential process to ensure optimal Board performance.
The Board is also mindful of the need to increase diversity of the
Board for future director appointments.
Conflicts of InterestThe directors are required to disclose to the Board any relationships
from which a conflict of interest might arise. A director who has an
actual or potential conflict of interest or a material personal interest in
a matter is required to absent himself from any meeting of the Board
or Board Committee, whenever the matter is considered. In addition,
the director does not receive any Board papers or other documents
in which there is a reference to the matter.
This process is applied to business and trading relationships, dealings
with the directors, dealings with companies with common directors
and dealings with any significant shareholders of the Group.
The materiality thresholds used for the determination of independence
and issues of conflict of interest has been considered from the point
of view of the Group and directors. For the Group, a relationship which
accounts for 5% or more of its revenue is considered material. For
a director, a relationship which accounts for 5% or more of the total
income of a director is considered material. Directors’ fees are not
subject to this test.
Access to Independent AdviceDirectors and the Board Committees have the right in connection with
their duties and responsibilities to seek independent advice at the
Group’s expense. Prior approval of the Chairman is required, but this
will not be unreasonably withheld. Where appropriate, directors share
such advice with the other directors.
Nomination CommitteeThe Nomination Committee meets as required and on several
occasions throughout the year. For membership and attendance
details of the Nomination Committee, refer to the Directors’ Report.
The composition of the Nomination Committee is based on the
following principles:
• The Nomination Committee should consist of non-executive
directors only
• The Nomination Committee should consist of a majority
of independent directors
• The Chairperson of the Nomination Committee should
be an independent director
• The Nomination Committee should consist of a minimum
of three members
• The Chairperson should be the Chairperson of the Board
or another non-executive director
The Nomination Committee operates under a charter that details the
Committee’s role and responsibilities, composition, structure and
membership requirements. The charter is reviewed annually to ensure
it remains consistent with the Board’s objectives and responsibilities.
Refer to the Group’s website at www.gwagroup.com.au for a copy of
the charter.
The main responsibilities of the Committee include:
• Assessment of the necessary and desirable competencies
of Board members
• Review of the Board succession plans
• Evaluation of the performance and contributions of Board members
• Recommendations for the appointment and removal of directors
• Review of the remuneration framework for the non-executive
directors
• Reporting to the Board on the Committee’s role and responsibilities
covering all the functions in its charter
In performing its responsibilities, the Nomination Committee
receives appropriate advice from external consultants and
other advisers as required.
The Company Secretary prepares the draft minutes for each
Nomination Committee meeting, which are tabled at the next
Nomination Committee meeting for review and approval. The draft
minutes are also included in the Board papers of the next Board
meeting following the Nomination Committee meeting.
Selection and Appointment of DirectorsThe Nomination Committee is responsible for the selection and
appointment of directors. In the circumstances where there is a
need to appoint a director, whether due to the retirement of a director,
growth of the Group, or changed circumstances of the Group, certain
procedures will be followed including the following:
• Determination of the skills and experience appropriate for an
appointee, having regard to those of the existing directors and
other likely changes to the Board.
• Upon identifying a potential appointee, consider the competency
and qualifications, independence, other directorships, time
availability, and the effect that their appointment would have on
the overall balance of the composition of the Board.
• Consideration of the need for Board diversity and whether the
potential appointee furthers the Board’s objective of achieving a
diverse workforce in accordance with its Diversity Policy.
• The Board members consent to the proposed appointee.
Details of the skills, experience and expertise of each director are
outlined in the director profiles in the Annual Report.
Induction ProgramThe Nomination Committee is responsible for ensuring that an
effective induction program for new directors is in place and regularly
reviewed to ensure its effectiveness. The Board has developed a
comprehensive induction program for new directors to allow the new
appointees to participate fully and actively in Board decision making.
The Board views the induction program as critical in enabling the new
directors to gain an understanding of the Group and the markets in
which it operates. The Company Secretary assists with the induction
CORPORATE GOVERNANCE STATEMENT (CONT) FOR THE YEAR ENDED 30 JUNE 2014

23
program for directors to ensure the Group’s corporate governance
practices are understood. The Group also supports appropriate
professional development opportunities for directors to enable
them to enhance their skills and knowledge.
PRINCIPLE 3 – ACT ETHICALLY AND RESPONSIBLY
Code of ConductThe Group’s objective is to conduct its business with the highest
standards of personal and corporate integrity. To assist employees in
achieving this objective, the Group has developed a comprehensive
Code of Conduct which guides the behaviour of directors, officers
and employees (including senior executives) and demonstrates the
commitment of the Group to ethical practices. The Code of Conduct
is incorporated as part of new employees’ induction training and an
acceptance form is signed by new employees acknowledging their
understanding and on-going compliance with the Code of Conduct
and the Group’s policies and procedures.
The Code of Conduct states the values and policies of the Group
and complements the Group’s risk management and internal control
practices. The Code of Conduct is reviewed annually and updated
to ensure that it reflects current good practice and to promote the
ethical behaviour of all employees. Refer to the Group’s website at
www.gwagroup.com.au for a copy of the Code of Conduct.
Share Trading PolicyThe Board has approved a Share Trading Policy which complies
with the ASX Listing Rules. The policy limits the trading periods for
directors and senior executives in the Group’s securities to 30 days
after each yearly/half yearly results announcement and Annual
General Meeting, and provided they are not in the possession of
unpublished insider information.
Outside of these trading periods, the directors, senior executives and
other ‘potential insiders’ are prohibited from trading in the Group’s
securities unless ‘exceptional circumstances’ exist and prior written
approval has been obtained. ‘Exceptional circumstances’ mean
severe financial hardship or other circumstances considered to be
exceptional, including a court order or court enforceable undertaking
in a bona fide family settlement or some other overriding legal or
regulatory requirement to transfer the Group’s securities.
The Share Trading Policy requires the directors to notify the
Executive Director within two business days after trading, to
enable the Executive Director to lodge the required disclosures
with the Australian Securities Exchange.
PRINCIPLE 4 – SAFEGUARD INTEGRITY IN CORPORATE REPORTING
Audit and Risk CommitteeThe Audit and Risk Committee meets as required and at least four
times throughout the year. For membership and attendance details
of the Audit and Risk Committee, refer to the Directors’ Report. The
qualifications and experience of each member of the Audit and Risk
Committee is outlined in the director profiles in the Annual Report.
The composition of the Audit and Risk Committee is based
on the following principles:
• The Audit and Risk Committee should consist of non-executive
directors only
• The Audit and Risk Committee should consist of a majority
of independent directors
• The Chairperson of the Audit and Risk Committee should
be an independent director and not Chairperson of the Board
• The Audit and Risk Committee should consist of at least
three members
• The Audit and Risk Committee should include members who are
financially literate with at least one member who has financial and
accounting related expertise
The Audit and Risk Committee is governed by a charter which outlines
the Committee’s role and responsibilities, composition, structure and
membership requirements. The charter is reviewed annually to ensure
it remains consistent with the Board’s objectives and responsibilities.
Refer to the Group’s website at www.gwagroup.com.au for a copy of the
charter. A detailed Terms of Reference has been developed to ensure
the Audit and Risk Committee meeting agenda is consistent with the
Committee’s role and responsibilities as outlined in the charter.
The External Auditor, Managing Director, Chief Financial Officer,
Executive Director, Group Commercial Manager, Group Risk Manager
and other Group executives (as required) attend Audit and Risk
Committee meetings, by invitation, to present the relevant statutory
information, Financial Statements, reports, and to answer the
questions of the members. At the Audit and Risk Committee
meetings, the members will meet with the External Auditor
without management present.
The main responsibilities of the Audit and Risk Committee include:
• Review of financial statements and external financial reporting
• Assess the management processes supporting external reporting
• Assess whether the external reporting is adequate to meet the
information needs for shareholders
• Recommendations on the appointment and removal of the
External Auditor
• Review and monitor the performance and independence of the
external audit function
• Review of tax planning and tax compliance systems and processes
• Review and monitor risk management and internal compliance and
control systems
• Assess the performance and objectivity of the internal audit function
• Reporting to the Board on the Committee’s role and responsibilities
covering all the functions in its charter
The Company Secretary prepares the draft minutes for each Audit and
Risk Committee meeting, which is tabled at the next Audit and Risk
Committee meeting for review and approval. The draft minutes are
also included in the Board papers of the next Board meeting following
the Audit and Risk Committee meeting.

GWA GROUP LIMITED • 2014 ANNUAL REPORT
Certification of Financial ReportsThe Managing Director and Chief Financial Officer state in writing to
the Board at each reporting period that, in their opinion:
• The financial records of the Group have been properly maintained;
• The financial reports present a true and fair view of the Group’s
financial position and performance;
• The financial reports comply with Accounting Standards; and
• The opinion has been formed on the basis of a sound system of
risk management and internal compliance and control which is
operating effectively.
The statements from the Managing Director and Chief Financial Officer
are based on a formal sign-off framework established throughout the
Group and reviewed by the Audit and Risk Committee as part of the
financial reporting process.
External Auditor IndependenceThe Board recognises the importance of a truly independent external
audit firm to ensure that the audit function delivers, for the benefit
of the Board and all other stakeholders, an unbiased confirmation of
both the Financial Statements and the state of affairs of the Group.
Consistent with the Board’s commitment to an independent audit firm,
a policy has been approved by the Board on the role of the External
Auditor, which is designed to ensure the independence of the external
audit function.
The Audit and Risk Committee reviews the independence of the
external audit function annually and makes a recommendation to the
Board on continuing independence. As part of this review, the Audit
and Risk Committee examines the non-audit roles performed by the
External Auditor to satisfy itself that the auditor’s independence is not
compromised. Whilst the value of non-audit services could, in extreme
cases, compromise audit independence, more important is to ensure
that the External Auditor is not passing an audit opinion on the non-
audit work of its own firm.
As a further measure to ensure the independence of the audit
function, the Chairman of the Audit and Risk Committee must
pre-approve all audit services provided by the External Auditor
and non-audit services with a value of greater than $5,000.
During the year, the Group’s External Auditor, KPMG, provided an
Auditor Independence Declaration to the Board (refer to the Directors’
Report) that, to the best of their knowledge and belief, there have been
no contraventions of:
• The auditor independence requirements of the Corporations Act 2001 in relation to the audit; and
• Any applicable code of professional conduct in relation to the audit.
In considering the KPMG independence declaration and the
recommendation of the Audit and Risk Committee, the Board is
satisfied with the continuing independence of the external audit
function. For details of the non-audit roles performed by KPMG during
the year, please refer to the notes to the Financial Statements.
Selection and Appointment of External AuditorFollowing shareholder approval at the 2004 Annual General Meeting,
KPMG were appointed External Auditor for the financial year
commencing 1 July 2004 after a comprehensive tender process
conducted by the Audit and Risk Committee. KPMG replaced
Ernst & Young who had been the External Auditor since 1995.
Rotation of External AuditorKPMG has advised the Group that their policy of audit partner rotation
requires a change in the lead engagement partner and review partner
after a period of five years. An audit partner rotation plan has been
reviewed and approved by the Audit and Risk Committee to ensure
the transition process is managed effectively. In accordance with the
plan, effective from 1 July 2010, Mr Greg Boydell was appointed the
Lead Engagement Partner following the rotation of Mr Mark Epper.
AGM AttendanceThe External Auditor attends the Annual General Meeting and is
available to answer questions from shareholders about the conduct of
the external audit and the preparation and content of the Independent
Auditor’s Report. Shareholders attending the Annual General Meeting
are made aware they can ask questions of the External Auditor
concerning the conduct of the audit.
PRINCIPLE 5 – MAKE TIMELY AND BALANCED DISCLOSUREThe Group is committed to ensuring the timely disclosure of material
price sensitive information through compliance with the continuous
disclosure obligations in the ASX Listing Rules and the Corporations Act 2001. The Group includes continuous disclosure as a permanent
item on the agenda for Board meetings. The Board has approved a
Continuous Disclosure Policy to ensure the Group complies with the
continuous disclosure requirements and to ensure accountability at
the executive and senior management level for that compliance.
The Managing Director is the Group’s Continuous Disclosure
Compliance Officer and is responsible for ensuring compliance
with the continuous disclosure requirements and overseeing and
authorising disclosure of information to the ASX. All media releases
which contain material price sensitive information must be approved
by the Board prior to release to the ASX.
The Company Secretary coordinates the communications with the
ASX including ensuring compliance with regulatory requirements and
overseeing information released to the ASX, shareholders and other
interested parties. Announcements made to the ASX are published on
the Group’s website immediately after release.
CORPORATE GOVERNANCE STATEMENT (CONT) FOR THE YEAR ENDED 30 JUNE 2014
25
PRINCIPLE 6 – RESPECT THE RIGHTS OF SECURITY HOLDERSThe Group is committed to ensuring shareholders and the financial
markets are provided with full, open and timely information about its
activities. This is achieved by the following:
• Ensuring that shareholder communications (including the Annual
Report and Notice of Annual General Meeting) satisfy relevant
regulatory requirements and guidelines. The Group is committed
to producing shareholder communications in plain english with full
and open disclosure about the Group’s policies and procedures,
operations and performance.
• Ensuring that shareholders have the opportunity to receive external
announcements by the Group through the corporate website at
www.gwagroup.com.au. All Group announcements and information
released to the market (including half and full year results) are
located on the website and may be accessed by shareholders.
There is a Corporate Governance section on the website which
outlines the Group’s governance practices and policies and other
information such as the Group’s carbon emissions reporting,
gender equality reporting and information on workplace health
and safety performance.
• The Board is committed to the use of electronic communications
with shareholders to reduce the environmental impact and
costs. Shareholders can elect to receive Group communications
electronically, although at present not all communications are
made available electronically. Annual Reports are no longer printed
and mailed to shareholders, unless specifically requested. Annual
Reports are made available to shareholders on the Group’s website
at www.gwagroup.com.au in an accessible and user friendly
format. Shareholders are mailed the Notice of Annual General
Meeting and Proxy Form, which includes details on accessing
the online Annual Report and instructions for casting proxy
votes electronically.
• The Group encourages shareholders to attend and participate
at the Annual General Meeting to canvass the relevant issues
of interest with the Board. An opportunity is given at the Annual
General Meeting for shareholders to ask questions on the Group’s
financial reports and the business operations and performance.
If shareholders are unable to attend the Annual General Meeting
personally, they are encouraged to participate through proxy voting.
The Group has implemented online proxy voting to make it easier
for shareholders to lodge their proxy votes if they are unable to
attend the Annual General Meeting. The Group endeavours to set
the timing and the location of the Annual General Meeting so that it
is convenient for shareholders generally.
• The Group has developed an investor relations program to facilitate
effective communications with investors. The Group actively engages
with the financial media, broking analysts, institutional and private
investors on the Group’s operations, performance, governance and
prospects, and to provide an opportunity for investors to express their
views or concerns about the Group. At all times the Group ensures
compliance with the continuous disclosure obligations in the ASX
Listing Rules and the Corporations Act 2001.
PRINCIPLE 7 – RECOGNISE AND MANAGE RISKThe Board recognises that effective risk management processes help
ensure the business is more likely to achieve its business objectives
and that the Board meets its corporate governance responsibilities. In
meeting its responsibilities, the Board has ensured that management
has put in place comprehensive risk management policies and
practices across the Group. The Board conducts annual reviews of
the Group’s risk management framework to ensure that it continues
to be sound. During FY14, the Audit and Risk Committee conducted
a review of the Group’s risk management framework to ensure it is
working effectively and within the risk parameters set by the Board.
Such risk management processes include defining the risk oversight
responsibilities of the Board and the responsibilities of management
in ensuring risks are both identified and effectively managed.
Whilst ultimate responsibility for risk oversight rests with the Board,
the Audit and Risk Committee is the delegated mechanism for
focusing the Group on risk oversight, risk management and internal
controls. The Audit and Risk Committee reports to the Board on risk
management and internal control matters in accordance with its main
responsibilities as outlined in the Audit and Risk Committee Charter.
For further details of the Audit and Risk Committee composition and
responsibilities, refer to the Audit and Risk Committee disclosures
under Principle 4 – Safeguard integrity in corporate reporting.
The Audit and Risk Committee is supported in managing risk through
the combined activities of:
• An Executive Risk Committee (ERC) comprising the executive and
senior management of the Group which has been established to
identify business risks in the organisation and review status and
risk mitigation activities. Formal enterprise risk profiles have been
prepared for the businesses and these are reviewed half yearly by
the ERC. The major business risks are reported to the Audit and
Risk Committee at the May and November meetings together with
risk mitigation activities. The ERC reports to the Audit and Risk
Committee on its activities as outlined in the ERC charter;
• Enterprise risk profiles have been developed for the Group and its
divisions which are regularly reviewed and updated as part of the
strategic planning process together with mitigation actions. The
identified risks are analysed based on their potential impact and
likelihood of occurrence and mitigation responses are put in place
to manage the risks. Updates to the enterprise risk profiles form
part of the agenda for the quarterly business reviews and strategy
planning sessions with the Managing Director, Chief Financial
Officer and Group Commercial Manager. An enterprise risk update
for the major risks is prepared for the Audit and Risk Committee at
the May and November meetings;
• A Finance Committee comprising the executive and senior
management of the Group which has been established to review
and monitor the financial risks in the organisation, oversee the
execution of Group policies in relation to finance risk and measure
the impact of both the underlying risk and the mitigation strategies
employed. Financial risks include liquidity and funding risk, interest
rate risk, foreign currency risk, credit risk and legal risk. The
Finance Committee reports to the Audit and Risk Committee on its
activities as outlined in the Finance Committee charter;
GWA GROUP LIMITED • 2014 ANNUAL REPORT
• A Group Commercial Manager who has primary responsibility
for designing, implementing and coordinating the overall risk
management and internal control practices of the Group. The
Group Commercial Manager attends the Audit and Risk Committee
meetings to present the Internal Audit Report and prepares a
monthly Commercial Risk Report for the Board. Whilst reporting
to the Chief Financial Officer on a day to day basis, the Group
Commercial Manager has the authority to report directly to the
Board or Audit and Risk Committee on any matter;
• A Group Risk Manager who has specific responsibilities in respect
of operational risks including workplace health and safety, business
continuity, environmental, sustainability and industrial relations risks.
The Group Risk Manager prepares a monthly Group Risk Report
for the Board and attends the May and November Audit and Risk
Committee meetings to present the Operational Risk Report;
• A Group Information Systems Manager who has specific
responsibilities in respect of the Group’s information technology
(IT) security and risk environment. The Group Information
Systems Manager attends the May and November Audit and
Risk Committee meetings to present the IT Security, Risk and
Governance Report;
• A Company Secretary who is responsible for putting in place
adequate insurances to cover the major group insurable risks
including property and business interruption, product and
public liability, product recall and directors and officers liability
insurances. The Group’s insurance brokers are AON Risk Solutions
who assist with arranging the insurances and claims management.
The insurance policies are placed with reputable insurers with
appropriate coverage, limits and deductibles;
• An Internal Audit function under the management of Grant
Thornton. The Internal Audit activities are carried out by a
combination of internal and appropriately qualified external
resources from Grant Thornton based on a program of work
approved by the Audit and Risk Committee. Such activities link
to the Group’s risk management practices by ensuring risks are
being adequately identified and managed through the effective
and efficient operation of control procedures. The internal audit
function is independent of the external audit function; and
• External Audit activities undertaken by the External Auditor, KPMG,
to review internal controls as part of the year end audit procedures.
Internal control weaknesses are identified by the External Auditor
and communicated to management to address through a formal
reporting process. The actions taken by management are reviewed
by the Chief Financial Officer and Group Financial Controller as part
of the stewardship review process for the half and full year accounts.
The Group has implemented risk management software across the
Group for the purpose of identifying and managing workplace health
and safety, business continuity and environmental risks. The software
is a critical tool for executives and senior management and has
enhanced the identification, reporting and monitoring of actions in
this important area in order to support management’s objectives.
Risk management is embedded in the Group’s policies and
procedures which have enabled the Group to pro-actively identify and
manage all types of risk within the organisation. The Board aims to
continually evaluate and re-assess the risk management and internal
control practices of the Group to ensure current good practice is
maintained and to preserve and create value within the organisation.
Certification of Risk Management ControlsIn conjunction with the certification of financial reports, the Managing
Director and Chief Financial Officer state in writing to the Board each
reporting period that in their opinion:
• The statement is founded on a sound system of risk management
and internal compliance and control which implements the policies
adopted by the Board; and
• The Group’s risk management and internal compliance and control
system is operating efficiently and effectively in all material respects.
The statements from the Managing Director and Chief Financial Officer
are based on a formal sign-off framework established throughout the
Group and reviewed by the Audit and Risk Committee as part of the
financial reporting process.
Environment and Sustainability RisksThe Group does not have any material exposures to environment and
social sustainability risks.
The Board is committed to reducing energy, carbon emissions, water
and waste across the Group’s operations. The Group reports its group
carbon emissions annually under the Federal Government’s National
Greenhouse and Emissions Reporting Scheme and the reports can
be accessed on the Group’s website at www.gwagroup.com.au under
Carbon Reporting. In recent years, the Group’s carbon emissions have
declined due to a combination of factors including site rationalisations,
site closures, reduced demand and energy efficiency measures.
CORPORATE GOVERNANCE STATEMENT (CONT) FOR THE YEAR ENDED 30 JUNE 2014
27
PRINCIPLE 8 – REMUNERATE FAIRLY AND RESPONSIBLY
Remuneration CommitteeThe Remuneration Committee meets as required and on several
occasions throughout the year. For membership and attendance
details of the Remuneration Committee, refer to the Directors’ Report.
The composition of the Remuneration Committee is based on the
following principles:
• The Remuneration Committee should consist of non-executive
directors only
• The Remuneration Committee should consist of a majority
of independent directors
• The Remuneration Committee should consist of a minimum
of three members
• The Chairperson of the Remuneration Committee should
be an independent director
The Remuneration Committee operates under a charter that details
the Committee’s role and responsibilities, composition, structure and
membership requirements. The charter is reviewed annually to ensure
it remains consistent with the Board’s objectives and responsibilities.
Refer to the Group’s website at www.gwagroup.com.au for a copy of
the charter.
The main responsibilities of the Committee include:
• Review of the Group’s remuneration and incentive policies
• Review of executive and senior management remuneration packages
• Review of the Group’s recruitment, retention and termination
policies and procedures
• Review of the Group’s superannuation arrangements
• Reporting to the Board on the Committee’s role and responsibilities
covering all the functions in its charter
In performing its responsibilities, the Remuneration Committee
receives appropriate advice from independent external advisers.
During the year, the Remuneration Committee engaged the services
of Guerdon Associates to provide market benchmarking data to assist
with the FY15 executive remuneration review.
The Company Secretary prepares the draft minutes for each
Remuneration Committee meeting which are tabled at the next
Remuneration Committee meeting for review and approval. The draft
minutes are also included in the Board papers of the next Board
meeting following the Remuneration Committee meeting.
Remuneration PoliciesThe Board’s objective in setting the Group’s remuneration policies is
to provide maximum stakeholder benefit from the retention of a high
quality Board and executive team. This is achieved by remunerating
directors and executives fairly and appropriately based on relevant
market benchmarking data and the linking of the executives’
emoluments to the Group’s financial and operating performance
in order to align with shareholder wealth creation.
The Nomination Committee is responsible for determining the
remuneration for the non-executive directors, with the maximum
aggregate amount approved by shareholders. The non-executive
directors receive their remuneration by way of directors’ fees only
(including statutory superannuation) and are not able to participate
in the executive incentive schemes. There are no director retirement
benefits other than statutory superannuation.
The Remuneration Committee is responsible for reviewing and
determining the remuneration and incentive arrangements for
the executives. The Remuneration Committee obtains market
benchmarking data from an independent external adviser to assist
in determining market remuneration levels. The remuneration
and incentive arrangements have been structured to ensure that
performance is fairly rewarded and to attract, motivate and retain
a high quality executive team.
The Group has an equity based remuneration scheme for senior
executives which was approved by shareholders in 2008. For details of
the scheme, refer to the Remuneration Report. In accordance with the
rules of the scheme, participants must not enter into any transactions
or arrangements (whether through the use of derivatives or otherwise)
which reduces or limits the economic risk of participating in the scheme.
For details of the Group’s remuneration policies and disclosures, refer
to the Remuneration Report.

GWA GROUP LIMITED • 2014 ANNUAL REPORT
Your directors present their report on the consolidated
entity of GWA Group Limited (the Group) and the
entities it controlled during the financial year ended
30 June 2014.
DIRECTORSThe following persons were directors of the Group during the financial
year and up to the date of this report. Directors were in office this
entire period unless otherwise stated.
D D McDonough, Chairman and Non-Executive Director
J F Mulcahy, Deputy Chairman and Non-Executive Director
P C Crowley, Managing Director
R M Anderson, Non-Executive Director
W J Bartlett, Non-Executive Director
P A Birtles, Non-Executive Director
R J Thornton, Executive Director
G J McGrath, Non-Executive Director (retired 30 October 2013)
Details of the directors’ qualifications, experience and special
responsibilities are outlined in the director profiles in the Annual Report.
Details of the directorships of other listed companies held by each
director in the three years prior to the end of FY14, and the period for
which each directorship has been held, are outlined in the director
profiles in the Annual Report.
COMPANY SECRETARYMr R J Thornton was appointed Company Secretary of GWA Group
Limited in 2003. Mr Thornton continued in his role as Company
Secretary following his appointment as Executive Director in May
2009. Details of Mr Thornton’s qualifications and experience are
outlined in the director profiles in the Annual Report.
DIRECTORS’ INTERESTSThe relevant interest of each director in the share capital of the Group
as notified by the directors to the Australian Securities Exchange in
accordance with Section 205G(1) of the Corporations Act 2001 as at
the date of this report is shown in the following table:
Director Ordinary Shares
D D McDonough 107,905
J F Mulcahy 45,000
P C Crowley* 480,000
R M Anderson 8,118,442
W J Bartlett 33,194
P A Birtles 15,000
R J Thornton* 58,694
Total** 8,858,235
* The executive directors, Mr P C Crowley and Mr R J Thornton, are holders of Performance Rights under the GWA Group Limited Long Term Incentive Plan. For details of the Performance Rights held, please refer to section 5.2.1 of the Remuneration Report.
** Section 5.3.3 of the Remuneration Report sets out the number of shares held directly, indirectly or beneficially by directors or their related entities at balance date as prescribed in Accounting Standard AASB 124, this being 18,800,594 shares (last year 19,129,596 shares).
DIRECTORS’ MEETINGSThe number of meetings of directors (including meetings of
Committees of directors) held during the financial year ended
30 June 2014 and the number of meetings attended by each
director is outlined in the table on the following page.
PRINCIPAL ACTIVITIESThe principal activities during the year of the consolidated entity were
the research, design, manufacture, import and marketing of building
fixtures and fittings to residential and commercial premises and the
distribution of these various products through a range of distribution
channels in Australia, New Zealand and selected international markets.
There have been no significant changes in the nature of the activities
of the consolidated entity during the year.
OPERATING AND FINANCIAL REVIEW The Operating and Financial Review for the consolidated entity during
the financial year ended 30 June 2014 is provided in the Managing
Director’s Review of Operations, and forms part of this Directors’ Report.
DIRECTORS’ REPORT AS AT 30 JUNE 2014
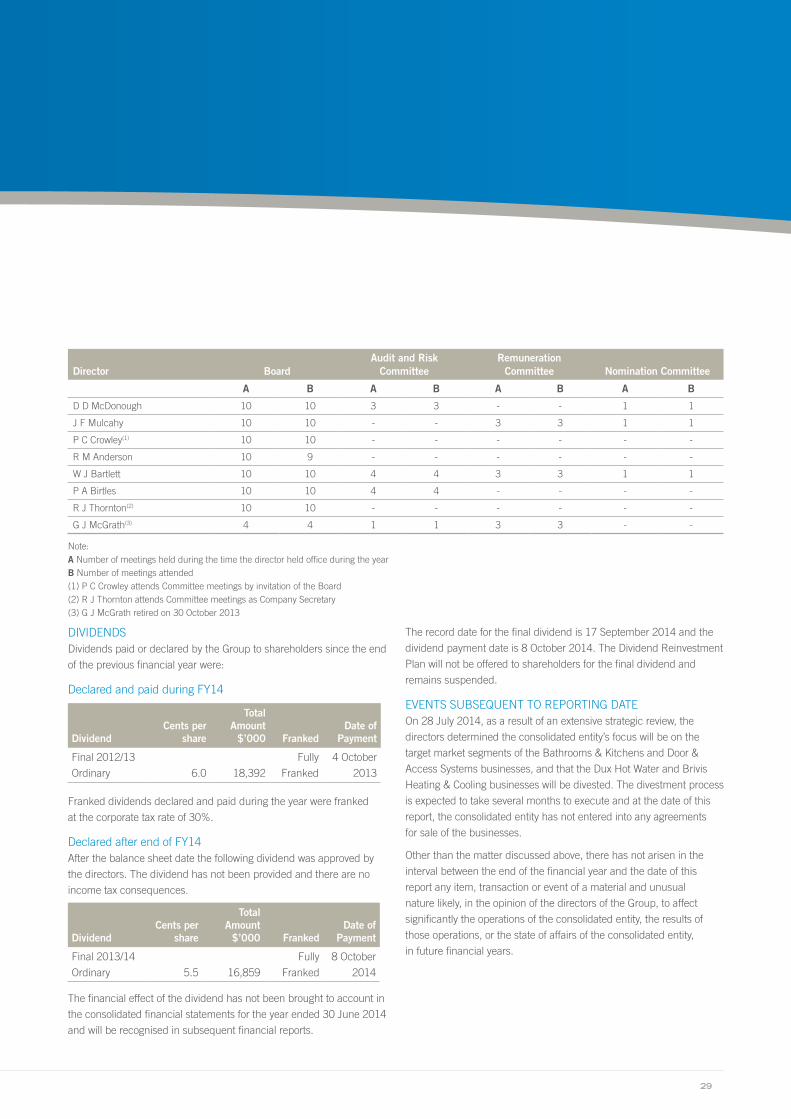
29
DIVIDENDSDividends paid or declared by the Group to shareholders since the end
of the previous financial year were:
Declared and paid during FY14
DividendCents per
share
Total Amount
$’000 FrankedDate of
Payment
Final 2012/13
Ordinary 6.0 18,392
Fully
Franked
4 October
2013
Franked dividends declared and paid during the year were franked
at the corporate tax rate of 30%.
Declared after end of FY14After the balance sheet date the following dividend was approved by
the directors. The dividend has not been provided and there are no
income tax consequences.
DividendCents per
share
Total Amount
$’000 FrankedDate of
Payment
Final 2013/14
Ordinary 5.5 16,859
Fully
Franked
8 October
2014
The financial effect of the dividend has not been brought to account in
the consolidated financial statements for the year ended 30 June 2014
and will be recognised in subsequent financial reports.
The record date for the final dividend is 17 September 2014 and the
dividend payment date is 8 October 2014. The Dividend Reinvestment
Plan will not be offered to shareholders for the final dividend and
remains suspended.
EVENTS SUBSEQUENT TO REPORTING DATEOn 28 July 2014, as a result of an extensive strategic review, the
directors determined the consolidated entity’s focus will be on the
target market segments of the Bathrooms & Kitchens and Door &
Access Systems businesses, and that the Dux Hot Water and Brivis
Heating & Cooling businesses will be divested. The divestment process
is expected to take several months to execute and at the date of this
report, the consolidated entity has not entered into any agreements
for sale of the businesses.
Other than the matter discussed above, there has not arisen in the
interval between the end of the financial year and the date of this
report any item, transaction or event of a material and unusual
nature likely, in the opinion of the directors of the Group, to affect
significantly the operations of the consolidated entity, the results of
those operations, or the state of affairs of the consolidated entity,
in future financial years.
Director BoardAudit and Risk
CommitteeRemuneration
Committee Nomination Committee
A B A B A B A B
D D McDonough 10 10 3 3 - - 1 1
J F Mulcahy 10 10 - - 3 3 1 1
P C Crowley(1) 10 10 - - - - - -
R M Anderson 10 9 - - - - - -
W J Bartlett 10 10 4 4 3 3 1 1
P A Birtles 10 10 4 4 - - - -
R J Thornton(2) 10 10 - - - - - -
G J McGrath(3) 4 4 1 1 3 3 - -
Note: A Number of meetings held during the time the director held office during the year B Number of meetings attended (1) P C Crowley attends Committee meetings by invitation of the Board (2) R J Thornton attends Committee meetings as Company Secretary (3) G J McGrath retired on 30 October 2013
GWA GROUP LIMITED • 2014 ANNUAL REPORT
LIKELY DEVELOPMENTSLikely developments and expected results of the operations of the
consolidated entity are provided in the Managing Director’s Review
of Operations.
Further information on likely developments and expected results of
the operations of the consolidated entity have not been included in
this report because the directors believe it would be likely to result
in unreasonable prejudice to the consolidated entity.
ENVIRONMENTAL REGULATION
Environmental LicensesThe consolidated entity holds licenses issued by environmental
protection and water authorities that specify limits for discharges to
the environment which arise from the operations of entities that it
controls. These licenses regulate the management of discharge to
air, storm water run-off, removal and transport of waste associated
with the manufacturing operations in Australia. Where appropriate,
an independent review of the consolidated entity’s compliance with
license conditions is made by external advisers.
The consolidated entity, in conjunction with external advisers, monitors
storage and treatment of hazardous materials within particular
operations. Prior to any discharge to sewers, effluent is treated and
monitored to ensure strict observance with license conditions. The
directors are not aware of any breaches of the consolidated entity’s
license conditions during the financial year ended 30 June 2014.
INDEMNIFICATION AND INSURANCE OF DIRECTORS AND OFFICERS
IndemnificationThe Group’s constitution provides that, to the extent permitted by
the law, every current (and former) director or secretary of the Group
shall be indemnified out of the assets of the Group against all costs,
expenses and liabilities which results directly or indirectly from facts
or circumstances relating to the person serving (or having served) in
their capacity as director or secretary of the Group, but excluding any
liability arising out of conduct involving a lack of good faith or conduct
known to the person to be wrongful or any liability to the Group or
related body corporate.
Insurance PremiumsThe Group has paid premiums in respect of insurance contracts which
provide cover against certain liabilities of every current (and former)
director and officer of the Group and its controlled entities. The contracts
of insurance prohibit disclosure of the total amount of the premiums
paid, or the nature of the liabilities covered under the policies.
Premiums were paid in respect of every current (and former) director
and officer of the Group and controlled entities, including the directors
named in the Directors’ Report, the Chief Financial Officer and all
persons concerned or taking part in the management of the Group
and its controlled entities.
NON-AUDIT SERVICESDuring the year KPMG, the consolidated entity’s auditor, has
performed certain other services in addition to the audit and
review of the financial statements.
The Board has considered the non-audit services provided during the
year by the auditor and in accordance with written advice provided
by resolution of the Audit and Risk Committee, is satisfied that the
provision of those non-audit services during the year by the auditor is
compatible with, and did not compromise, the auditor independence
requirements of the Corporations Act 2001 for the following reasons:
• All non-audit services were subject to the corporate governance
procedures adopted by the consolidated entity and have been
reviewed by the Audit and Risk Committee to ensure they do
not impact the integrity and objectivity of the auditor; and
• The non-audit services provided do not undermine the general
principles relating to auditor independence as set out in APES 110 Code of Ethics for Professional Accountants, as they did not
involve reviewing or auditing the auditor’s own work, acting in a
management or decision making capacity for the Group, acting
as an advocate for the Group or jointly sharing risks and rewards.
Details of the amounts paid to the auditor of the consolidated entity,
KPMG, and its network firms for audit and non-audit services provided
during the year are outlined in Note 7 of the financial statements.
Lead Auditor’s Independence DeclarationThe Lead Auditor’s Independence Declaration is set out in the Annual
Report and forms part of the Directors’ Report for the financial year
ended 30 June 2014.
RoundingThe Group is of a kind referred to in Class Order 98/100 issued by the
Australian Securities Investment Commission relating to the rounding
of amounts in the Directors’ Report.
Amounts in the Directors’ Report have been rounded off in
accordance with that Class Order to the nearest thousand dollars,
unless otherwise stated.
REMUNERATION REPORT – AUDITED
IntroductionThe report covers the following matters for FY14:
1. Board role in setting remuneration strategy and principles;
2. Relationship between remuneration policy and
Group performance;
3. Description of non-executive director remuneration;
4. Description of executive remuneration;
5. Details of director and executive remuneration; and
6. Key terms of employment contracts.
1. BOARD ROLE IN SETTING REMUNERATION STRATEGY AND PRINCIPLES
GWA’s remuneration strategy is designed to provide remuneration that
is fair and able to attract and retain management and directors with
the experience, knowledge, skills and judgment required for success.
The key principle is that remuneration varies between the median and
third quartiles or higher if warranted by superior performance relative
to companies of comparable size and operational scope to GWA.
DIRECTORS’ REPORT (CONT) AS AT 30 JUNE 2014

31
The Board engages with shareholders, management and other
stakeholders to continuously refine and improve executive and
director remuneration policies and practices.
The Board’s Nomination Committee is responsible for determining the
remuneration arrangements for the non-executive directors, with the
annual maximum aggregate amount approved by shareholders.
The Board’s Remuneration Committee deals with remuneration
matters for executives.
Both the Nomination Committee and the Remuneration Committee
have the authority to engage external professional advisers without
the approval of the Board or management.
During the reporting period, the Remuneration Committee obtained
market data from Guerdon Associates for the FY15 executive
remuneration review, and advice in relation to long term performance
measures. Guerdon Associates does not provide other services
to the Group and is otherwise independent. No remuneration
recommendations as defined under Division 1, Part 1.2.98 (1)
of the Corporations Act 2001, were made by Guerdon Associates.
In response to feedback from shareholders and following receipt
of advice from Guerdon Associates, important changes have been
implemented to remuneration after FY14 which are consistent with
the overall Group remuneration strategy. The changes are outlined
in section 1.1.
1.1 Executive remuneration – FY15 changesThe performance requirements under the Group’s long term incentive
plan (LTI) have been changed for grants of Performance Rights to
executives during FY15 year. The key concerns raised by shareholders
were that the performance requirements under the EPS hurdle
are not sufficiently challenging for executives compared to market
expectations of the Group’s future EPS growth and that a significant
proportion of Performance Rights vest at average performance levels.
The changes that have been made are outlined in section 4.4.3
and apply to grants of Performance Rights to executives in FY15 year.
In essence the changes are that:
• EPS growth will be assessed relative to growth in dwelling
completions obtained from the Australian Bureau of Statistics as
it is believed that growth in dwelling completions is a valid proxy
for overall growth of the market for the Group’s products. A strong
historical correlation exists between the Group’s EPS performance
and dwelling completions. It is also considered that assessing EPS
growth against dwelling completions growth will permit a fairer
assessment of the performance of management relative to market
opportunity; and
• Return on Funds Employed (ROFE) will replace relative TSR as the
second LTI performance measure. As a measure of capital efficiency,
the use of ROFE, together with the modified EPS growth hurdle will
permit a more complete assessment of management performance.
2. RELATIONSHIP BETWEEN REMUNERATION POLICY AND GROUP PERFORMANCE
Remuneration is linked to performance by:
• Applying challenging financial and non-financial measures
to assess performance; and
• Ensuring that these measures focus management on operational
and strategic business objectives that create shareholder value.
GWA measures performance on the following key corporate measures:
• Earnings per share (EPS) growth;
• Return on funds employed (ROFE);
• Total shareholder return (TSR) relative to companies with similar
scope, operations, customers or products;
• Trading earnings before interest and tax (EBIT) targets; and
• Operating cash flow targets.
Remuneration for all executives varies with performance on these
key measures together with achievement of key personal goals which
underpin delivery of the financial outcomes, and are linked to the
consolidated entity’s performance review process.
Jun 11 Jun 12Aug 11 Aug 12
Oct 12Dec 12
Feb 13Apr 13 Aug 13
Oct 13Dec 13
Feb 14Apr 14
Jun 14Jun 13Oct 11Dec 11
Feb 12Apr 12
GWA 3 Year Rolling TSR Peer Group 3 Year Rolling TSR 50th Percentile ^ Assuming 36 months in each rolling periodSource: Guerdon Associates
-40%
-20%
0%
20%
40%
60%
80%
100%
3 Year Rolling TSR^

GWA GROUP LIMITED • 2014 ANNUAL REPORT
The graph at the top of the previous page shows the Group’s relative
performance over a rolling 3 year period to 30 June 2014 compared
to the peer group companies used for the 2014 grant of Performance
Rights being Reece Australia Limited, Brickworks Limited, CSR Limited,
Goodman Fielder Limited, Super Retail Group Limited, Premier
Investments Limited, Breville Group Limited, GUD Holdings Limited,
Hills Industries Limited, Bradken Limited, Dulux Group Limited, Pacific
Brands Limited, Adelaide Brighton Limited and Ansell Limited.
The following is a summary of key statistics for the Group over the last
five years:
Financial Year
Trading EBIT* ($m)
Trading EPS*
(cents)
Total DPS
(cents)
Share Price ($)
2009/10** 94.5 18.5 18.0 3.01
2010/11** 99.9 19.6 18.0 2.75
2011/12** 75.4 15.1 18.0 2.10
2012/13 66.8 12.9 12.0 2.40
2013/14 72.3 14.3 5.5 2.63
*excludes significant items **excludes discontinued operations
The remuneration and incentive framework focuses executives on
sustaining short term operating performance coupled with moderate
long term strategic growth. This has contributed to the Group
generating less volatile shareholder returns and earnings than
peers despite low levels of building activity in recent years. This
has permitted a total of 71.5 cents in fully franked dividends paid
to shareholders over the last five financial years.
The improvement in the Group’s trading profitability performance in
FY14 was primarily driven by the strong performance of Bathrooms
& Kitchens (excluding Hot Water) and the gradual recovery in
residential dwelling construction following a number of years of
weak market activity.
The Group expects to benefit in future periods as the building recovery
gathers pace leading to increased demand for its products. The Group
will also benefit from the execution of its strategic plans leading to
improved profitability and cash flow performance enabling higher
returns to shareholders.
The remuneration and incentive framework has allowed the Group to
respond to cyclical dwelling construction activity. STI payments related
to performance improvement and restructuring during the recent
downturn encouraged management to respond quickly and make
long term decisions to sustain competitiveness and profitability.
This has placed the Group in a strong position to take advantage of the
recovery in dwelling activity that is underway and led to an improved
trading EBIT performance that was up 8% in FY14.
2.1 Managing Director’s key performance goals and outcomesAn assessment of the Managing Director’s key performance goals
and financial targets subject to STI incentive payments for FY14 is
provided in the following table:
FY14 Goals Results Assessment
Operational goals
Achieve leading safety
performance to work towards
an injury free workplace
The total injury frequency rate (TIFR) of 6.2 in FY14 was a significant improvement on the
targeted TIFR of 6.9 and represents a 19% improvement on the prior year. The outcome
continues the group’s strong safety performance and demonstrates the commitment to an
injury free workplace.
Improved working capital
management to maximise
operating cash flow
The higher inventory levels at Bathrooms & Kitchens and Gainsborough at 30 June 2014
meant that the operating cash flow target was not achieved. The higher stock levels will be
addressed in FY15.
Demonstrate improved
market service capabilities
through technology innovation
and measurable service
improvements
Salesforce.com has been successfully deployed across the Group to improve market
service capabilities. Plumber digital applications and specification tools have been
developed in Bathrooms & Kitchens to service key customer segments. Demand planning
system has also been implemented in Bathrooms & Kitchens.
Strategy and growth goals
Develop the group and
divisional strategies, the way
forward and longer term
financial projections
The Group strategy has been developed and has set the immediate future direction of
GWA. That development involved the Board, senior management, external research and
financial analysis. Divisional strategies have been developed which are aligned to the
overall Group strategy resulting in the adoption of major initiatives to focus the Group on
the growth of the core Bathrooms & Kitchens and Door & Access Systems divisions and
divestment of the non-core Brivis and Dux businesses with the aim of delivering higher
shareholder returns.
DIRECTORS’ REPORT (CONT) AS AT 30 JUNE 2014

33
FY14 Goals Results Assessment
Strategy and growth goals
Progress execution of the
strategic initiatives for
Bathrooms & Kitchens to
improve business performance
Bathrooms & Kitchens delivered a strong financial performance in FY14 following the
successful execution of the strategic initiatives approved by the Board in June 2013
and the cost savings in selling, general and administration expenses from the
restructuring in December 2012. Further improvement is expected in FY15 as
Bathrooms & Kitchens focuses on its target market segments and as the recovery
in the building sector gathers pace.
Ensure the turnaround of
Gliderol is completed and
generating acceptable returns
The financial performance of Gliderol in FY14 was disappointing with a $17 million
impairment expense in December 2013. Improvement plans are in place to address
the under-performance but progress has been slower than expected.
Supply chain goals
Progress supply chain
transformation to improve
demand management
processes and customer
service capabilities
New demand planning system has been implemented in Bathrooms & Kitchens during
FY14 to improve capabilities and tools in their demand management processes. The
supply issues in Gainsborough in FY14 resulted in lost sales and lost market share with
an estimated impact on trading EBIT of approximately $5 million. The supply issues in
Gainsborough have been resolved and risk mitigation plans have been put in place.
Financial targets
STI financial
performance targets
In FY14 the ‘reasonably achievable’ trading EBIT financial performance targets for
Bathrooms & Kitchens and Brivis were achieved but no other STI financial performance
targets were achieved.
= Fully achieved = Partially achieved = Not achieved
3. DESCRIPTION OF NON-EXECUTIVE DIRECTOR REMUNERATIONThere has been no change to non-executive director fees since the prior reporting period.
Fees for non-executive directors are fixed and are not linked to the financial performance of the Group to ensure non-executive directors
maintain their independence.
At the 2004 Annual General Meeting, shareholders approved non-executive director fees up to an annual maximum aggregate amount of
$1.09 million including statutory superannuation. The actual fees paid to the non-executive directors are outlined in the Remuneration
Tables: see section 5.1.
Non-executive director remuneration consists of base fees and statutory superannuation, plus an additional fee for each Board committee
on which a director sits. The payment of committee fees recognises the additional time commitment required by directors who serve on
one or more committees. Non-executive directors are not able to participate in the executive incentive schemes.
The Nomination Committee obtains market benchmarking data from an external remuneration adviser to ensure that the level and allocation of
non-executive director remuneration is market based and fairly represents the responsibilities and time spent by the directors on Group matters.
The benchmarking survey from Guerdon Associates in 2011 sampled the same companies used for executive remuneration benchmarking and
found the fees received by most non-executive directors were positioned at about the 60th percentile.
Retirement benefits other than statutory superannuation are not available for non-executive directors.
4. DESCRIPTION OF EXECUTIVE REMUNERATION
4.1 Executive remuneration structureExecutive remuneration has a fixed component and a component that varies with performance. The variable component ensures that total
pay varies with performance. The short term incentive (STI) provides rewards for performance over a 1 year period. The long term incentive
(LTI) provides rewards for performance over a 3 year period.
The maximum total remuneration that can be provided to an executive is capped, with maximum incentive payments expressed as a percentage
of total fixed remuneration. Total fixed remuneration for the purposes of the incentives includes superannuation and non-monetary benefits.
The STI and LTI maximum percentages are less than most market peers given the emphasis on stability of earnings, cash flow and dividends
and the relatively high fixed pay for some executives.

GWA GROUP LIMITED • 2014 ANNUAL REPORT
The remuneration structure implemented for all executives, including
the Managing Director, recognises the short term challenges posed by
cyclical factors, ability to sustain competitiveness, deliver value and
growth, and maintain cash flows for dividends. However, to ensure
sustainability of performance over time, there is a requirement that 50%
of the financial component of the STI be deferred and subject to further
testing and potential clawback with payment at the discretion of the
Board at the time of signing the following year’s annual audited financial
statements. The further testing involves the Board verifying the integrity
of the achievement of the STI financial targets. Interest at market rates
will be earned by the executives on the deferred component.
4.1.1 Managing Director remuneration structure
The FY14 incentives structure for the Managing Director is provided
in the following table:
Managing Director
Maximum STI as % of
fixed remuneration
Maximum LTI % of fixed remuneration
(grant date fair value)
Maximum total performance pay
as % of fixed remuneration
2013/14 80 40 120
The FY14 STI for the Managing Director is provided in the following table:
Managing Director
Reasonably Achievable -Personal Goals as
% of fixed remuneration
Reasonably Achievable -Financial Targets as % of fixed
remuneration
Total Reasonably Achievable
as % of fixed remuneration
Stretch – Financial Targets as % of fixed
remuneration
Maximum STI as % of fixed
remuneration
2013/14* 40 25 65 15 80
* The Managing Director’s STI structure for FY14 was revised by the Remuneration Committee to ensure the focus on the achievement of the key performance goals outlined in section 2.1. This resulted in a higher personal goal component and a lower financial target component to the STI structure for FY14 than in prior years in order to give greater weight to factors that are consistent with its focus on sustainable performance over time. There was no change to the maximum STI amount for the Managing Director for FY14.
The FY14 total performance pay outcomes for the Managing Director, as
reflected in the Remuneration Tables, are provided in the following table:
Managing Director
Achievement of STI and LTI as % of fixed remuneration
Forfeiture of STI and LTI as % of
fixed remuneration
Total potential performance pay
as % of fixed remuneration
STI 20 60 80
LTI* 30 30 60
Total 50 90 140
* This relates to the LTI plan prior to the changes implemented to the remuneration structure in FY12 as outlined in the 2012 Remuneration Report. Previously, the Managing Director was eligible to receive Performance Rights under the LTI plan to the value of 60% of his fixed remuneration. This was reduced to 40% of his fixed remuneration as part of the FY12 changes, together with graduated vesting scales and higher performance hurdles.
4.1.2 Other Executives remuneration structure
The FY14 incentives structure for other executives is provided in the
following table:
Other Executives
Maximum STI % of
fixed remuneration
Maximum LTI % of fixed remuneration
(grant date fair value)
Maximum total performance pay
as % of fixed remuneration
2013/14 50 30 80
The FY14 STI for the other executives is provided in the following table:
Other Executives
Reasonably Achievable – Personal Goals as
% of fixed remuneration
Reasonably Achievable – Financial Targets as % of fixed
remuneration
Total Reasonably Achievable
as % of fixed remuneration
Stretch – Financial Targets as % of fixed
remuneration
Maximum STI as
% of fixed remuneration
2013/14 20 20 40 10 50
4.2 Fixed remunerationFixed remuneration is the sum of salary and the direct cost of
providing employee benefits, including superannuation, motor
vehicles, car parking and fringe benefits tax.
The level of fixed remuneration is set:
• To retain proven performers with difficult to source experience
in manufacturing and global supply chain management;
• To attract external recruits with depth and breadth of expertise
usually acquired while working with larger companies; and
• In recognition of the short term challenges posed by cyclical factors
and the focus in recent years on conserving market leadership,
cash flow and dividends where opportunities for outperformance
and subsequent incentive payments are more limited.
The Board targets the setting of fixed remuneration for executives
between the median and third quartiles or higher if warranted by
superior performance and relative to companies of comparable
size and operational scope to GWA. The comparator companies are
primarily from the consumer discretionary and industrial sectors.
Based on an independent survey by Guerdon Associates for the
FY15 executive remuneration review, the fixed remuneration for
most executive positions at GWA are generally at or above the 50th
percentile for companies of comparable operational scope and size
to GWA. The 21 listed companies included in the survey provided
reliable and robust statistical remuneration benchmarking and shared
some common attributes with GWA, but few direct competitors and
good position matches exist for precise remuneration positioning.
Judgment was therefore exercised by the Remuneration Committee
in determining appropriate remuneration levels, having regard to the
background and experience of the individuals.
While market levels of remuneration are monitored on a regular basis,
there is no contractual requirement or expectation that pay will be
adjusted each year. Where these levels are above the 75th percentile,
fixed remuneration will either be frozen or increases will be below
market levels. Consistent with this approach, the Managing Director’s
fixed remuneration has been frozen since 2011 and remains frozen.
DIRECTORS’ REPORT (CONT) AS AT 30 JUNE 2014
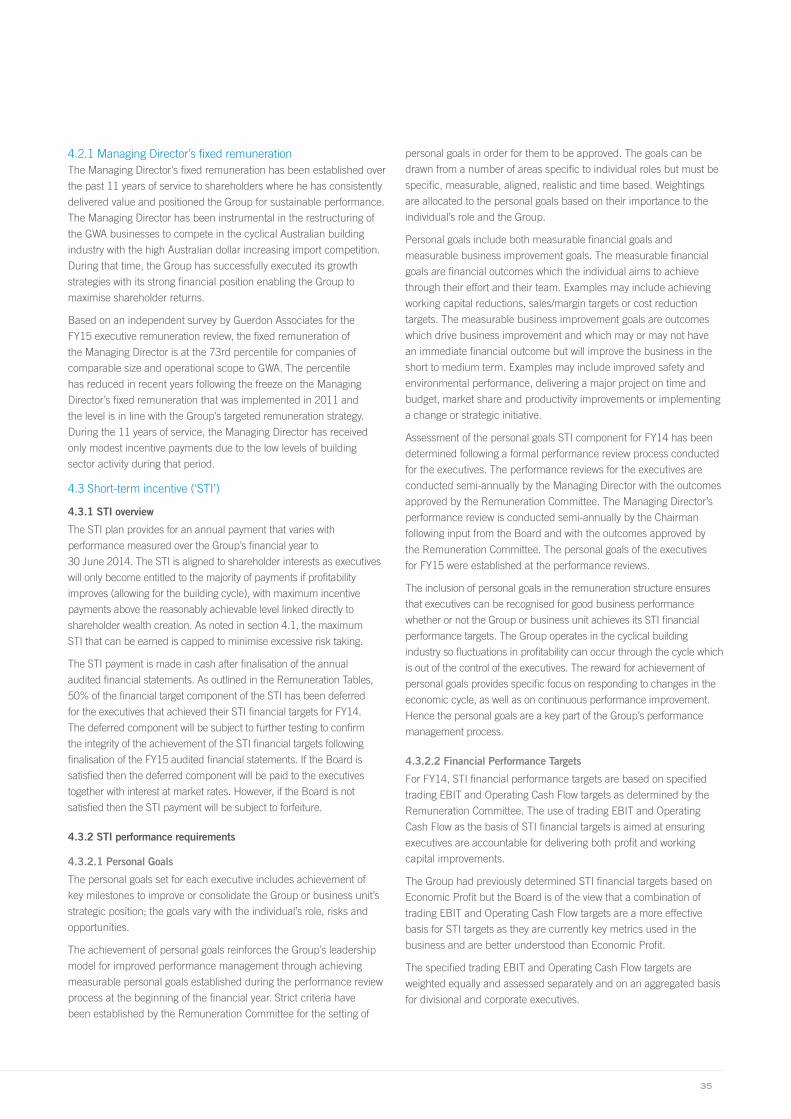
35
4.2.1 Managing Director’s fixed remunerationThe Managing Director’s fixed remuneration has been established over
the past 11 years of service to shareholders where he has consistently
delivered value and positioned the Group for sustainable performance.
The Managing Director has been instrumental in the restructuring of
the GWA businesses to compete in the cyclical Australian building
industry with the high Australian dollar increasing import competition.
During that time, the Group has successfully executed its growth
strategies with its strong financial position enabling the Group to
maximise shareholder returns.
Based on an independent survey by Guerdon Associates for the
FY15 executive remuneration review, the fixed remuneration of
the Managing Director is at the 73rd percentile for companies of
comparable size and operational scope to GWA. The percentile
has reduced in recent years following the freeze on the Managing
Director’s fixed remuneration that was implemented in 2011 and
the level is in line with the Group’s targeted remuneration strategy.
During the 11 years of service, the Managing Director has received
only modest incentive payments due to the low levels of building
sector activity during that period.
4.3 Short-term incentive (‘STI’)
4.3.1 STI overview
The STI plan provides for an annual payment that varies with
performance measured over the Group’s financial year to
30 June 2014. The STI is aligned to shareholder interests as executives
will only become entitled to the majority of payments if profitability
improves (allowing for the building cycle), with maximum incentive
payments above the reasonably achievable level linked directly to
shareholder wealth creation. As noted in section 4.1, the maximum
STI that can be earned is capped to minimise excessive risk taking.
The STI payment is made in cash after finalisation of the annual
audited financial statements. As outlined in the Remuneration Tables,
50% of the financial target component of the STI has been deferred
for the executives that achieved their STI financial targets for FY14.
The deferred component will be subject to further testing to confirm
the integrity of the achievement of the STI financial targets following
finalisation of the FY15 audited financial statements. If the Board is
satisfied then the deferred component will be paid to the executives
together with interest at market rates. However, if the Board is not
satisfied then the STI payment will be subject to forfeiture.
4.3.2 STI performance requirements
4.3.2.1 Personal Goals
The personal goals set for each executive includes achievement of
key milestones to improve or consolidate the Group or business unit’s
strategic position; the goals vary with the individual’s role, risks and
opportunities.
The achievement of personal goals reinforces the Group’s leadership
model for improved performance management through achieving
measurable personal goals established during the performance review
process at the beginning of the financial year. Strict criteria have
been established by the Remuneration Committee for the setting of
personal goals in order for them to be approved. The goals can be
drawn from a number of areas specific to individual roles but must be
specific, measurable, aligned, realistic and time based. Weightings
are allocated to the personal goals based on their importance to the
individual’s role and the Group.
Personal goals include both measurable financial goals and
measurable business improvement goals. The measurable financial
goals are financial outcomes which the individual aims to achieve
through their effort and their team. Examples may include achieving
working capital reductions, sales/margin targets or cost reduction
targets. The measurable business improvement goals are outcomes
which drive business improvement and which may or may not have
an immediate financial outcome but will improve the business in the
short to medium term. Examples may include improved safety and
environmental performance, delivering a major project on time and
budget, market share and productivity improvements or implementing
a change or strategic initiative.
Assessment of the personal goals STI component for FY14 has been
determined following a formal performance review process conducted
for the executives. The performance reviews for the executives are
conducted semi-annually by the Managing Director with the outcomes
approved by the Remuneration Committee. The Managing Director’s
performance review is conducted semi-annually by the Chairman
following input from the Board and with the outcomes approved by
the Remuneration Committee. The personal goals of the executives
for FY15 were established at the performance reviews.
The inclusion of personal goals in the remuneration structure ensures
that executives can be recognised for good business performance
whether or not the Group or business unit achieves its STI financial
performance targets. The Group operates in the cyclical building
industry so fluctuations in profitability can occur through the cycle which
is out of the control of the executives. The reward for achievement of
personal goals provides specific focus on responding to changes in the
economic cycle, as well as on continuous performance improvement.
Hence the personal goals are a key part of the Group’s performance
management process.
4.3.2.2 Financial Performance Targets
For FY14, STI financial performance targets are based on specified
trading EBIT and Operating Cash Flow targets as determined by the
Remuneration Committee. The use of trading EBIT and Operating
Cash Flow as the basis of STI financial targets is aimed at ensuring
executives are accountable for delivering both profit and working
capital improvements.
The Group had previously determined STI financial targets based on
Economic Profit but the Board is of the view that a combination of
trading EBIT and Operating Cash Flow targets are a more effective
basis for STI targets as they are currently key metrics used in the
business and are better understood than Economic Profit.
The specified trading EBIT and Operating Cash Flow targets are
weighted equally and assessed separately and on an aggregated basis
for divisional and corporate executives.
GWA GROUP LIMITED • 2014 ANNUAL REPORT
Under the STI framework, a divisional executive may receive an STI
payment if divisional financial targets are achieved, although the
overall corporate financial targets may not have been achieved, and
vice versa. The ‘reasonably achievable’ and ‘stretch’ STI financial
targets are determined by the Remuneration Committee at the
beginning of the financial year following approval of the divisional
and corporate budgets by the Board.
The budget performance levels are taken into consideration in setting
the financial targets but different targets may be set (either higher
or lower than budget) that ensure management is motivated while
reflecting the degree of difficulty in achieving the budget. Performance
between the ‘reasonably achievable’ and ‘stretch’ levels is rewarded
on a pro rata basis.
The Board retains the right to vary from policy in exceptional
circumstances. However, any variation from policy and the
reasons for it will be disclosed.
There were no variations from policy during FY14.
For FY14, Bathrooms & Kitchens and Brivis achieved their trading
EBIT STI financial targets at the ‘reasonably achievable’ level. No
other divisional or corporate STI financial targets were achieved by
the executives. 50% of the STI incentive payment has been deferred
for Bathrooms & Kitchens and Brivis executives and will be subject to
further testing and potential clawback under the STI plan rules. This is
reflected in the STI cash bonus amounts in the Remuneration Tables.
The deferred component of the STI incentive payment for FY13 for
Brivis executives was tested by the Board in August 2014 to confirm
the integrity of the achievement of the STI financial targets in FY13.
Following satisfaction with the testing, the Board approved the
payment of the deferred component to Brivis’ executives together
with interest at market rates.
4.4 Long-term incentive (‘LTI’)
4.4.1 LTI overview
Executives participate in a LTI plan. This is an equity based plan that
provides for a reward that varies with Group performance over three
year periods. Three years is considered to be the maximum time
period over which financial projections and detailed business plans
can reasonably be made, and reflects what the Board considers is
a reasonable period to require and test the sustainability of earnings
accretion from investments and working capital improvement given
the nature of the business.
The LTI is provided as Performance Rights, with each right entitling the
holder to an ordinary share in the Group (or in limited cases to a cash
payment), subject to meeting financial performance hurdles and the
holder remaining in employment with the Group until the nominated
vesting date.
If the vesting conditions and performance hurdles are achieved,
ordinary shares will be issued to the participants at no cost. Until
that time, the participants have no right to dividends or voting rights
on unvested Performance Rights. If the performance hurdles are
not met then the Performance Rights are cancelled. The LTI rules
do not allow for re-testing of the performance hurdles after the initial
performance period.
The performance hurdles for the LTI are selected by the Remuneration
Committee. Half of the Performance Rights are based on Total
Shareholder Returns (TSR) for GWA compared to a peer group of
companies (which is a relative performance requirement) and half
of the Performance Rights are based on growth in Earnings Per
Share (EPS) (which is an absolute performance requirement). The
EPS performance condition is calculated as net profit after tax as
set out in the Group’s annual audited financial statements divided
by the weighted average of ordinary shares on issue. The Board has
discretion to make reasonable adjustments to base year EPS where
it is unduly distorted by significant or abnormal events. Any such
adjustments will be disclosed.
A participant may not dispose of the ordinary shares issued under the
LTI until the seventh anniversary of the grant date and the shares are
subject to a holding lock upon issue. There are limited circumstances
where a participant may dispose of the shares before the end of the
seven year period, including cessation of employment with the Group
or where the Board grants approval. In considering an application from
a participant to dispose of the shares, the Board will consider whether
the sale is in the best interests of the Group, relevant policies and
regulations and other factors.
In accordance with the rules of the LTI plan, the executives are
prohibited from entering into hedging transactions or arrangements
which reduce or limit the economic risk of holding unvested
Performance Rights.
In the event of a change of control, the Board will determine in
its discretion the extent to which outstanding Performance Rights
granted to executives will vest and be exercised into ordinary shares.
In exercising its discretion the Board will consider whether the
vesting conditions are unlikely to be satisfied and the outstanding
Performance Rights should lapse. If the Board makes the decision
that not all outstanding Performance Rights will vest on a change of
control, then all remaining Performance Rights will lapse.
For the 2014 LTI grant, the proportion of Performance Rights that can
vest will be calculated and the shares will vest in August 2016 subject
to achieving the performance hurdles.
All unvested rights will be forfeited if the Board determines that
an executive has committed an act of fraud, defalcation or gross
misconduct or in other circumstances specified by the Board.
The maximum number of outstanding Performance Rights granted
to executives must not exceed 5% of the total number of shares on
issue by the Group. The total number of outstanding Performance
Rights granted to executives at 30 June 2014 was 2,017,000 which
represents 0.7% of the Group’s total issued shares.
4.4.2 LTI performance requirements
For the FY14 LTI grant, the performance hurdles continue to provide
for vesting scales graduated with performance and demanding
performance hurdles. The comparator group for the FY14 LTI plan
includes selected comparator group companies used by Guerdon
Associates for benchmarking executive fixed remuneration levels for
the FY14 remuneration review.
DIRECTORS’ REPORT (CONT) AS AT 30 JUNE 2014

37
4.4.2.1 TSR Hurdle
The performance hurdles and vesting proportions for the TSR
performance measure that applied to the 2014 LTI grant is outlined
in the following table:
TSR of GWA Group Limited relative to TSRs of Comparator Companies
Proportion of Performance Rights to Vest if
TSR hurdle is met
Less than the 50th percentile 0%
50th percentile 25%
Between the 50th percentile
and 75th percentile
Straight line vesting
between 25% and 50%
75th percentile or higher
50%
(i.e. 50% of total grant)
The group of comparator companies for the TSR hurdle includes
14 domestic ASX listed companies with comparable market
capitalisation or revenues, including:
Reece Australia Limited, Adelaide Brighton Limited, Ansell Limited,
Brickworks Limited, CSR Limited, Goodman Fielder Limited, Bradken
Limited, Dulux Group Limited, Super Retail Group Limited, Premier
Investments Limited, Pacific Brands Limited, GUD Holdings Limited,
Breville Group Limited and Hills Holdings Limited.
The Board has discretion to adjust the comparator group to take
into account events including, but not limited to, takeovers, mergers,
de-mergers and similar transactions that might occur over the
performance period.
4.4.2.2 EPS Hurdle
For the FY14 LTI grant, EPS growth is measured over the three years
from 1 July 2013 to 30 June 2016. The EPS hurdle is calculated as
net profit after tax, as set out in the Group’s annual audited financial
statements, divided by the weighted average number of ordinary shares
on issue. The base year EPS for the FY14 LTI grant was 12.7 cents.
The Board exercised its discretion to adjust the base year EPS by
excluding the significant items in FY13 year comprising restructuring
costs. This adjustment made the performance hurdle more demanding
as it increased the base year EPS from 10.6 cents to 12.7 cents to
ensure the hurdle was reflective of underlying trading performance.
The performance hurdles and vesting proportions for the EPS
performance measure that applied to the 2014 LTI grant is outlined
in the following table:
Compound annual EPS Growth
Proportion of Performance
Rights to Vest if EPS growth hurdle is met
Less than 3% per annum 0%
3% per annum 25%
Between 3% and
8% per annum
Straight line vesting
between 25% and 50%
8% or higher per annum
50%
(i.e. 50% of total grant)
4.4.3 LTI performance requirements – FY15 changes
Following shareholder feedback and advice from the Group’s
independent external remuneration adviser, Guerdon Associates,
a number of important changes were made to the LTI in FY14.
The changes will apply to grants of Performance Rights to executives
under the LTI in respect of FY15. The changes are as follows:
• EPS growth will be assessed relative to growth in dwelling
completions obtained from the Australian Bureau of Statistics.
Growth in dwelling completions is a valid proxy for overall growth
of the market for the Group’s products because a strong historical
correlation exists between the Group’s EPS performance and
dwelling completions. Assessing EPS growth against dwelling
completions growth permits a fairer assessment of management
performance relative to market opportunity.
• Return on Funds Employed (ROFE) will replace relative TSR as the
second LTI performance measure. As a measure of capital efficiency,
the use of ROFE, together with the modified EPS growth hurdle,
permits a more complete assessment of management performance.
The Board is satisfied that measuring EPS growth relative to market
growth as reflected in dwelling completions provides a more robust
benchmark for assessing relative performance than the relative TSR
hurdle used in previous LTI grants. EPS growth more directly focuses
on factors management can influence, so that results will be less likely
to fluctuate with general market sentiment.
4.4.3.1 LTI Performance Hurdles – FY15 Changes
The performance hurdles and vesting proportions for each measure
that will apply to the grant of Performance Rights during FY15 are:
GWA Group Limited EPS compound annual growth rate (CAGR) relative to dwelling completions growth over three year performance period
Proportion of Performance Rights
to Vest if EPS growth hurdle is met
EPS CAGR less than
dwelling completions CAGR 0%
EPS CAGR exceeding
dwelling completions CAGR 12.5%
EPS CAGR exceeding dwelling
completions CAGR up to 6%
Straight line
vesting between
12.5% and 50%
EPS CAGR equal to dwelling
completions CAGR plus 6% or higher
50%
(i.e. 50% of total grant)
GWA Group Limited ROFE over three year performance period
Proportion of Performance Rights to Vest if ROFE hurdle is
met
ROFE less than 15% per annum 0%
ROFE equal to 15% per annum 12.5%
ROFE between 15%
and 18% per annum
Straight line
vesting between
12.5% and 50%
ROFE equal to
18% or higher per annum
50%
(i.e. 50% of total grant)

GWA GROUP LIMITED • 2014 ANNUAL REPORT
5. DETAILS OF DIRECTOR AND EXECUTIVE REMUNERATION
5.1 Remuneration TablesDetails of the nature and amount of each element of remuneration of
each director of the Group and other key management personnel for the
year ended 30 June 2014 are outlined in the Remuneration Tables on
the opposite page.
Notes to the Remuneration Tables
(a) Salary and fees represents base salary and includes the
movement in annual and long service leave provisions.
(b) The Short Term Incentive (STI) cash bonus is for the performance
during the financial year ended 30 June 2014 based on the
achievement of personal goals and financial performance
targets. Bathrooms & Kitchens and Brivis achieved 50% of their
‘reasonably achievable’ STI financial performance targets during
the year and in accordance with the STI plan rules, 50% of the
amount has been deferred and will be subject to further testing
as outlined in the Remuneration Report. The STI cash bonuses
are paid annually following the end of the preceding financial
year. The amounts have been determined following individual
performance reviews and have been approved by
the Remuneration Committee.
(c) The short term non-monetary benefits include the provision of
motor vehicles, salary continuance and life insurance and any
applicable fringe benefits tax thereon.
(d) As outlined in the 2013 Remuneration Report, the legacy
Employee Share Plan was wound down in March 2013 and has
been discontinued. There have been no further share issues to
employees under the former plan.
(e) The Long Term Incentive (LTI) Plan was approved by shareholders
at the 2008 Annual General Meeting. The outstanding
Performance Rights at 30 June 2014 were granted to executives
in each of the years 30 June 2012, 2013 and 2014 and are
subject to vesting conditions and the achievement of the EPS
and TSR performance hurdles over the three year performance
periods. During the year, 50% of the Performance Rights in
respect of the 2011 LTI grant vested following the achievement
of the TSR hurdle and 50% of the Performance Rights lapsed
as the EPS hurdle was not achieved. The fair value of the
Performance Rights granted in each of the years were calculated
using Binomial option pricing model (EPS hurdle) and Monte Carlo
simulation (TSR hurdle) valuation methodologies and allocated to
each financial year evenly over the three year performance period.
If the EPS and TSR performance hurdles are not achieved, then
no benefits will be received by the executives under the LTI plan.
(f) Mr Darryl McDonough was appointed Chairman of GWA Group
Limited on 30 October 2013 following the retirement of the former
Chairman, Mr Geoff McGrath. Mr John Mulcahy was appointed
Deputy Chairman of GWA Group Limited on that date.
(g) The Managing Director, Mr Peter Crowley’s fixed remuneration
has been frozen since 2011 – refer Section 4.2.1 for further
details. The STI cash bonus for Mr Crowley for FY14 has
been approved by the Remuneration Committee based on
the achievement of key performance goals following a formal
performance review conducted by the Chairman – refer Section
2.1 for further details including Mr Crowley’s key performance
goals and outcomes. The STI corporate financial performance
targets for FY14 were not achieved and no amount is included in
Mr Crowley’s remuneration in respect of the achievement of STI
financial performance targets.
(h) Mr Celeste Camillo was appointed General Manager – Brivis on
1 December 2012 and is considered Key Management Personnel
from that date.
(i) The former Chief Executive – GWA Door & Access Systems,
Mr Geoff Oliver, retired on 11 October 2013 after 17 years service
to the Group and received a termination benefit representing
9 months salary. As part of Mr Oliver’s termination arrangements
he is also eligible to participate in the 2012 LTI grant which will
be tested in August 2014.
(j) The role of Chief Executive – GWA Door & Access Systems is
vacant following Mr Oliver’s retirement and the recruitment for
this position is progressing. The role is currently being overseen
by the Managing Director, Mr Peter Crowley.
DIRECTORS’ REPORT (CONT) AS AT 30 JUNE 2014

39
Short-term Long-term Post-employment
Sala
ry
& F
ees
STI
Cash
B
onus
Non
-Mon
etar
y
Empl
oyee
Sh
are
Plan
In
tere
st
Valu
e of
Sha
re-
Bas
ed A
war
ds
Supe
r-
annu
atio
n B
enefi
ts
Term
inat
ion
Ben
efits
Tota
l
Prop
ortio
n of
re
mun
erat
ion
perf
orm
ance
ba
sed
STI
Cash
B
onus
ves
ted
in y
ear
STI
Cash
B
onus
for
feite
d in
yea
r
$(a) $(b) $(c) $(d) $(e) $ $ $ % % %
Non-Executive Directors
D McDonough Chairman
2014 253,947 – – – – 34,999 – 288,946 – – –
2013 130,353 – – – – 24,999 – 155,352 – – –(Appointed 30 October 2013)(f) –
J Mulcahy Deputy Chairman
2014 138,225 – – – – 14,089 – 152,314 – – –
2013 112,861 – – – – 10,157 – 123,018 – – –(Appointed 30 October 2013)(f)
R Anderson Non-Executive Director
2014 83,563 – – – – 34,509 – 118,072 – – –
2013 75,415 – – – – 40,387 – 115,802 – – –
W Bartlett Non-Executive Director
2014 143,313 – – – – 14,607 – 157,920 – – –
2013 142,096 – – – – 12,789 – 154,885 – – –
P Birtles Non-Executive Director
2014 123,841 – – – – 12,623 – 136,464 – – –
2013 122,789 – – – – 11,051 – 133,840 – – –
G McGrath, Chairman (Retired 30 October 2013)(f)
2014 112,148 – – – – 5,924 – 118,072 – – –
2013 318,723 – – – – 28,685 – 347,408 – – –
Total – Non-Executive Directors
2014 855,037 – – – – 116,751 – 971,788
2013 902,237 – – – – 128,068 – 1,030,305
Executive Directors
P Crowley Managing Director (g)
2014 1,424,527 313,420 119,418 – 235,433 50,000 – 2,142,799 25.6 25 75
2013 1,438,646 171,600 88,648 38,080 160,633 50,000 – 1,947,607 17.1 14 86
R Thornton Executive Director
2014 377,043 79,522 1,364 – 47,542 17,774 – 523,245 24.3 40 60
2013 367,295 75,600 9,562 10,998 45,142 16,470 – 525,067 23.0 40 60
Total – Directors Remuneration
2014 2,656,607 392,942 120,782 – 282,975 184,525 – 3,637,832
2013 2,708,178 247,200 98,210 49,078 205,775 194,538 – 3,502,979
Executives
I Brannan Chief Financial Officer
2014 522,440 91,677 1,856 – 96,820 24,600 – 737,393 25.6 32 68
2013 645,063 275,000 8,864 – 62,720 22,550 – 1,014,197 33.3 100 –(Appointed 30 July 2012)
L Patterson Chief Executive – GWA Bathrooms & Kitchens
2014 529,986 146,522 2,905 – 65,692 24,999 – 770,104 27.6 54 46
2013 491,459 104,000 122,103 28,537 53,625 24,999 – 824,723 19.1 40 60
(Appointed 17 October 2012)
C Camillo General Manager – Brivis
2014 289,631 94,500 13,681 – 52,573 24,999 – 475,384 30.9 60 40
2013 204,658 145,500 – 1,875 33,973 9,913 – 395,919 45.3 97 3(Appointed 1 December 2012) (h)
G Oliver Chief Executive – GWA Door & Access Systems
2014 138,005 – – – (76,375) 35,000 349,195 445,825 -17.1 – –
2013 430,655 54,960 7,000 – 47,092 25,000 – 564,707 18.1 24 76
(Ceased employment 11 October 2013)(i)(j)
Total – Executives Remuneration
2014 1,480,062 332,699 18,442 – 138,710 109,598 349,195 2,428,706
2013 1,771,835 579,460 137,967 30,412 197,410 82,462 – 2,799,546
Total – Directors and Executives Remuneration
2014 4,136,669 725,641 139,224 – 421,685 294,123 349,195 6,066,538
2013 4,480,013 826,660 236,177 79,490 403,185 277,000 – 6,302,525
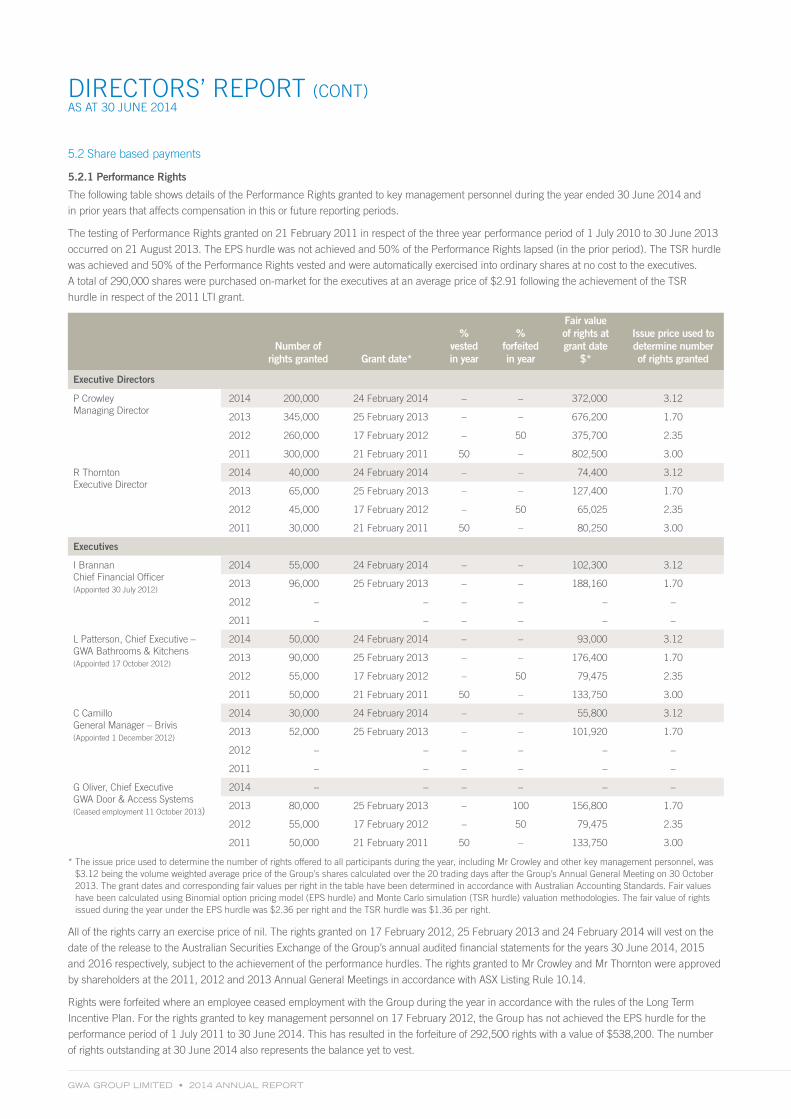
GWA GROUP LIMITED • 2014 ANNUAL REPORT
5.2 Share based payments
5.2.1 Performance Rights
The following table shows details of the Performance Rights granted to key management personnel during the year ended 30 June 2014 and
in prior years that affects compensation in this or future reporting periods.
The testing of Performance Rights granted on 21 February 2011 in respect of the three year performance period of 1 July 2010 to 30 June 2013
occurred on 21 August 2013. The EPS hurdle was not achieved and 50% of the Performance Rights lapsed (in the prior period). The TSR hurdle
was achieved and 50% of the Performance Rights vested and were automatically exercised into ordinary shares at no cost to the executives.
A total of 290,000 shares were purchased on-market for the executives at an average price of $2.91 following the achievement of the TSR
hurdle in respect of the 2011 LTI grant.
Number of rights granted Grant date*
% vested in year
% forfeited in year
Fair value of rights at grant date
$*
Issue price used to determine number of rights granted
Executive Directors
P Crowley Managing Director
2014 200,000 24 February 2014 – – 372,000 3.12
2013 345,000 25 February 2013 – – 676,200 1.70
2012 260,000 17 February 2012 – 50 375,700 2.35
2011 300,000 21 February 2011 50 – 802,500 3.00
R Thornton Executive Director
2014 40,000 24 February 2014 – – 74,400 3.12
2013 65,000 25 February 2013 – – 127,400 1.70
2012 45,000 17 February 2012 – 50 65,025 2.35
2011 30,000 21 February 2011 50 – 80,250 3.00
Executives
I Brannan Chief Financial Officer (Appointed 30 July 2012)
2014 55,000 24 February 2014 – – 102,300 3.12
2013 96,000 25 February 2013 – – 188,160 1.70
2012 – – – – – –
2011 – – – – – –
L Patterson, Chief Executive – GWA Bathrooms & Kitchens (Appointed 17 October 2012)
2014 50,000 24 February 2014 – – 93,000 3.12
2013 90,000 25 February 2013 – – 176,400 1.70
2012 55,000 17 February 2012 – 50 79,475 2.35
2011 50,000 21 February 2011 50 – 133,750 3.00
C Camillo General Manager – Brivis (Appointed 1 December 2012)
2014 30,000 24 February 2014 – – 55,800 3.12
2013 52,000 25 February 2013 – – 101,920 1.70
2012 – – – – – –
2011 – – – – – –
G Oliver, Chief Executive GWA Door & Access Systems (Ceased employment 11 October 2013)
2014 – – – – – –
2013 80,000 25 February 2013 – 100 156,800 1.70
2012 55,000 17 February 2012 – 50 79,475 2.35
2011 50,000 21 February 2011 50 – 133,750 3.00
* The issue price used to determine the number of rights offered to all participants during the year, including Mr Crowley and other key management personnel, was $3.12 being the volume weighted average price of the Group’s shares calculated over the 20 trading days after the Group’s Annual General Meeting on 30 October 2013. The grant dates and corresponding fair values per right in the table have been determined in accordance with Australian Accounting Standards. Fair values have been calculated using Binomial option pricing model (EPS hurdle) and Monte Carlo simulation (TSR hurdle) valuation methodologies. The fair value of rights issued during the year under the EPS hurdle was $2.36 per right and the TSR hurdle was $1.36 per right.
All of the rights carry an exercise price of nil. The rights granted on 17 February 2012, 25 February 2013 and 24 February 2014 will vest on the
date of the release to the Australian Securities Exchange of the Group’s annual audited financial statements for the years 30 June 2014, 2015
and 2016 respectively, subject to the achievement of the performance hurdles. The rights granted to Mr Crowley and Mr Thornton were approved
by shareholders at the 2011, 2012 and 2013 Annual General Meetings in accordance with ASX Listing Rule 10.14.
Rights were forfeited where an employee ceased employment with the Group during the year in accordance with the rules of the Long Term
Incentive Plan. For the rights granted to key management personnel on 17 February 2012, the Group has not achieved the EPS hurdle for the
performance period of 1 July 2011 to 30 June 2014. This has resulted in the forfeiture of 292,500 rights with a value of $538,200. The number
of rights outstanding at 30 June 2014 also represents the balance yet to vest.
DIRECTORS’ REPORT (CONT) AS AT 30 JUNE 2014

41
5.3 Key management personnel transactions
5.3.1 Loans to key management personnel and their related parties
No loans were made to key management personnel or their related parties during the year ended 30 June 2014 (2013: nil).
5.3.2 Other key management personnel transactions with the Group or its controlled entities
The consolidated entity purchased components and tooling of $67,905 (2013: $109,983) from Great Western Corporation Pty Ltd, a company of
which Mr Richard Thornton is a non-executive director. Mr Thornton had no involvement with the purchasing of the components and tooling from
Great Western Corporation Pty Ltd and amounts were billed based on normal market rates for such supplies and were due and payable under
normal payment terms.
Held at 1 July 2013
Granted as compensation Purchases Sales
Held at 30 June 2014
Directors: non-executive
D McDonough 107,905 – – – 107,905
J Mulcahy 45,000 – – – 45,000
R Anderson 18,404,803 – – 344,002 18,060,801
W Bartlett 33,194 – – – 33,194
P Birtles 15,000 – – – 15,000
G McGrath (retired 30 October 2013)
150,000 – – – n/a
Executive Directors
P Crowley 330,000 150,000 – – 480,000
R Thornton 43,694 15,000 – – 58,694
Executives
I Brannan – – – – –
L Patterson 52,500 25,000 – – 77,500
C Camillo – – – – –
G Oliver (ceased employment 11/10/2013)
244,175 25,000 – – n/a
Held at 1 July 2012
Granted as compensation Purchases Sales
Held at 30 June 2013
Directors: non-executive
D McDonough 100,495 – 7,410 – 107,905
J Mulcahy 45,000 – – – 45,000
R Anderson 18,404,803 – – – 18,404,803
W Bartlett 30,914 – 2,280 – 33,194
P Birtles 15,000 – – – 15,000
G McGrath 150,000 – – – 150,000
Executive Directors
P Crowley 750,000 152,500 – (572,500) 330,000
R Thornton 128,694 15,000 – (100,000) 43,694
Executives
I Brannan – – – – –
L Patterson 227,500 25,000 – (200,000) 52,500
C Camillo – – – – –
G Oliver 202,407 25,000 16,768 – 244,175
W Saxelby (ceased employment 31/10/2012)
350,000 – – – n/a
N Evans (ceased employment 17/10/2012)
– 37,500 – – n/a

GWA GROUP LIMITED • 2014 ANNUAL REPORT
The consolidated entity incurred legal fees of $712,246
(2013: $332,195) from Clayton Utz, a legal firm of which
Mr Darryl McDonough is an equity partner. Mr McDonough
had no involvement with the provision of the legal services by
Clayton Utz and the amounts were billed based on normal market
rates for such services and were due and payable under normal
payment terms. For further details of the legal services provided
by Clayton Utz, please refer to the disclosures in the Group’s
Corporate Governance Statement under Independence of Directors.
Amounts receivable from and payable to key management personnel
or to their related parties at reporting date arising from these
transactions were as follows:
in AUD 2014 2013
Trade creditors 116,391 29,801
From time to time, key management personnel of the Group or its
controlled entities, or their related entities, may purchase goods from
the consolidated entity. These purchases are on the same terms
and conditions as those entered into by other consolidated entity
employees or customers and are trivial or domestic in nature.
5.3.3 Movements in shares
The movement during the reporting period in the number of ordinary
shares in GWA Group Limited held, directly, indirectly or beneficially,
by each key management person, including their related parties, are
shown in the tables on previous page.
The relevant interest of each director in the share capital of the Group
as notified by the directors to the Australian Securities Exchange in
accordance with Section 205G(1) of the Corporations Act 2001 as at
30 June 2014 is listed in the Directors’ Report under Directors’ Interests.
During the reporting period, 215,000 shares were granted to
key management personnel as compensation (2013: 255,000).
The aggregate number of shares held by key management
personnel or their related parties at 30 June 2014 was 18,878,094
(2013: 19,426,271).
6. KEY TERMS OF EMPLOYMENT CONTRACTS
6.1 Notice and termination paymentsThe specified executives in the Directors’ Report are on open-ended
contracts, except for the Managing Director, Mr Peter Crowley, whose
employment contract specifies an initial term of twelve months with
subsequent rolling terms of twelve months.
The employment contract for Mr Crowley provides that if either the
Group or Mr Crowley wishes to terminate employment for any reason,
three months notice of termination is required. The Group retains the
right to terminate the employment contract of Mr Crowley immediately,
by making payment equal to three months salary in lieu of providing
notice. On termination by the Group, Mr Crowley will be entitled to
receive payment of twelve months salary.
For the other specified executives, the Group is required to give
reasonable notice of termination of up to six months. The Group retains
the right to terminate the employment contracts of the executives
immediately, by making payment equal to the relevant notice period
(of up to six months) in lieu of providing notice.
The executives are also entitled to receive on termination of
employment their statutory entitlements of accrued annual
and long service leave, together with any superannuation benefits.
The termination arrangements for the executives are specified in their
employment contracts and any other termination payments require
approval of the Remuneration Committee. Shareholder approval is
required for termination payments in excess of twelve months salary.
Performance Rights held by executives under the LTI plan will lapse
upon the cessation of employment with the Group, unless the Board
determines otherwise.
This Directors’ Report is made out in accordance with a resolution
of the directors:
J F Mulcahy P C Crowley
Director Director
Brisbane, 19 August 2014
DIRECTORS’ REPORT (CONT) AS AT 30 JUNE 2014

43
GWA GROUP LIMITED AND ITS CONTROLLED ENTITIES ABN 15 055 964 380
CONTENTS
Consolidated statement of profit or loss and other comprehensive income 44
Consolidated statement of financial position 45
Consolidated statement of cash flows 46
Consolidated statement of changes in equity 47
NOTE
1 Significant accounting policies 48
2 Operating segments 55
3 Other income 57
4 Other expenses 57
5 Significant items 58
6 Personnel expenses 59
7 Auditors’ remuneration 59
8 Net financing costs 59
9 Income tax expense 60
10 Earnings per share 61
11 Cash and cash equivalents 62
12 Trade and other receivables 62
13 Inventories 62
14 Current tax assets and liabilities 62
15 Deferred tax assets and liabilities 63
16 Property, plant and equipment 64
17 Intangible assets 65
18 Trade and other payables 67
19 Loans and borrowings 67
20 Employee benefits 69
21 Share-based payments 70
22 Provisions 71
23 Capital and reserves 72
24 Financial instruments and
financial risk management 73
25 Operating leases 80
26 Capital commitments 81
27 Contingencies 81
28 Deed of cross guarantee 81
29 Consolidated entities 84
30 Parent entity disclosures 85
31 Reconciliation of cash flows
from operating activities 86
32 Related parties 87
33 Subsequent events 87
Directors’ Declaration 88
Independent Auditor’s Report to the members of GWA Group Limited 89
GWA GROUP LIMITED
FINANCIAL REPORT

GWA GROUP LIMITED • 2014 ANNUAL REPORT
For the year ended 30 June 2014
In thousands of AUD Note 2014 2013
Continuing operations
Sales revenue 2 577,994 565,365
Cost of sales (382,820) (367,956)
Gross profit 195,174 197,409
Other income 3 1,295 6,720
Selling expenses (76,224) (84,062)
Administrative expenses (45,342) (48,682)
Other expenses 4 (31,080) (16,046)
Results from operating activities 43,823 55,339
Finance income 683 1,479
Finance expenses (11,884) (14,803)
Net financing costs 8 (11,201) (13,324)
Profit before tax 32,622 42,015
Income tax expense 9 (14,026) (9,625)
Profit for the period 18,596 32,390
Other comprehensive income
Items that may be reclassified subsequently to profit or loss:
Foreign currency translation differences for foreign operations, net of income tax 844 669
Effective portion of changes in fair value of cash flow hedges, net of income tax (1,619) 1,959
Other comprehensive income for the period, net of income tax (775) 2,628
Total comprehensive income for the period 17,821 35,018
Earnings per share
Basic earnings per share (cents per share) 10 6.07 10.64
Diluted earnings per share (cents per share) 10 6.04 10.59
The statement of profit or loss and other comprehensive income is to be read in conjunction with the notes to the financial statements set out on
pages 48 to 87.
GWA GROUP LIMITED AND ITS CONTROLLED ENTITIES ABN 15 055 964 380
CONSOLIDATED STATEMENT OF PROFIT OR LOSS AND OTHER COMPREHENSIVE INCOME
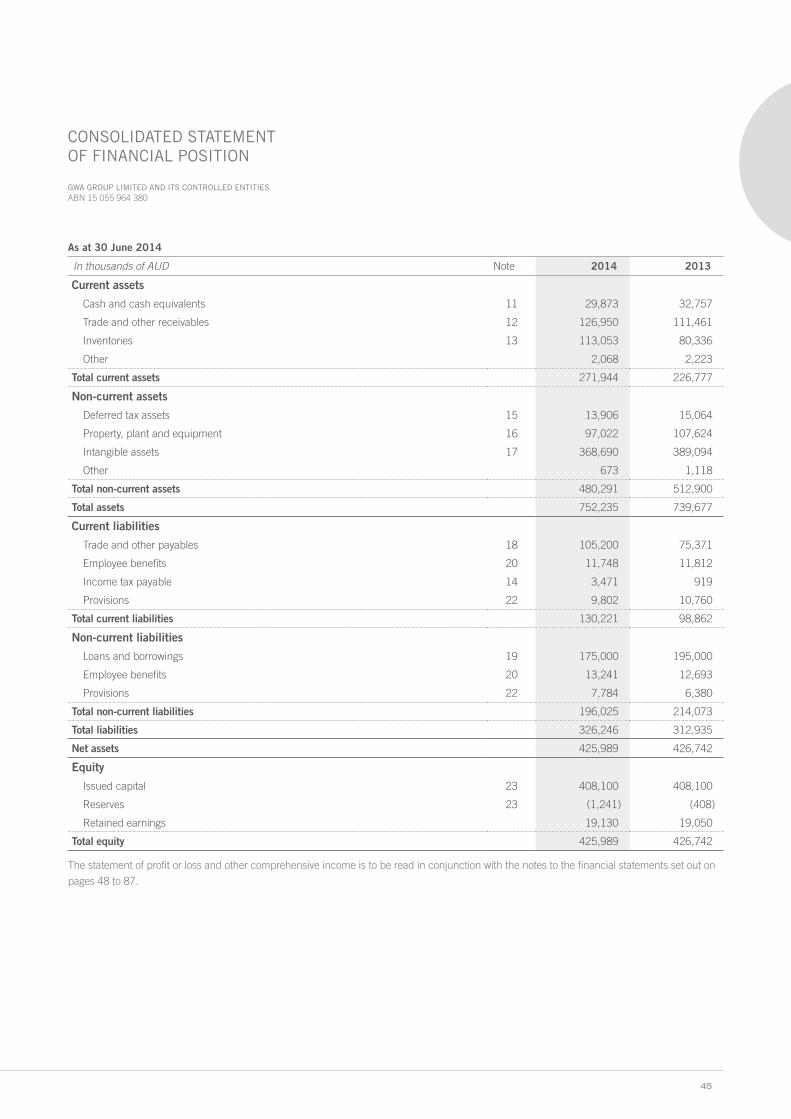
45
As at 30 June 2014
In thousands of AUD Note 2014 2013
Current assets
Cash and cash equivalents 11 29,873 32,757
Trade and other receivables 12 126,950 111,461
Inventories 13 113,053 80,336
Other 2,068 2,223
Total current assets 271,944 226,777
Non-current assets
Deferred tax assets 15 13,906 15,064
Property, plant and equipment 16 97,022 107,624
Intangible assets 17 368,690 389,094
Other 673 1,118
Total non-current assets 480,291 512,900
Total assets 752,235 739,677
Current liabilities
Trade and other payables 18 105,200 75,371
Employee benefits 20 11,748 11,812
Income tax payable 14 3,471 919
Provisions 22 9,802 10,760
Total current liabilities 130,221 98,862
Non-current liabilities
Loans and borrowings 19 175,000 195,000
Employee benefits 20 13,241 12,693
Provisions 22 7,784 6,380
Total non-current liabilities 196,025 214,073
Total liabilities 326,246 312,935
Net assets 425,989 426,742
Equity
Issued capital 23 408,100 408,100
Reserves 23 (1,241) (408)
Retained earnings 19,130 19,050
Total equity 425,989 426,742
The statement of profit or loss and other comprehensive income is to be read in conjunction with the notes to the financial statements set out on
pages 48 to 87.
GWA GROUP LIMITED AND ITS CONTROLLED ENTITIES ABN 15 055 964 380
CONSOLIDATED STATEMENT OF FINANCIAL POSITION

GWA GROUP LIMITED • 2014 ANNUAL REPORT
GWA GROUP LIMITED AND ITS CONTROLLED ENTITIES ABN 15 055 964 380
For the year ended 30 June 2014
In thousands of AUD Note 2014 2013
Cash flows from operating activities
Cash receipts from customers 649,233 628,637
Cash paid to suppliers and employees (595,099) (544,999)
Cash generated from operations 54,134 83,638
Interest and facility fees paid (11,319) (15,478)
Interest received 683 1,024
Income taxes paid (9,600) (5,835)
Net cash from operating activities 31 33,898 63,349
Cash flows from investing activities
Proceeds from sale of property, plant and equipment 6,738 2,278
Acquisition of property, plant and equipment (4,270) (11,374)
Acquisition of intangibles (1,300) (3,329)
Acquisition of subsidiary, net of cash acquired - (12,443)
Net cash from investing activities 1,168 (24,868)
Cash flows from financing activities
Repayment of employee share loans 263 8,284
Share listing fees paid - (22)
Repayment of bank bills (20,000) (10,000)
Dividends paid, net of dividend reinvestment plan (18,392) (34,761)
Net cash from financing activities (38,129) (36,499)
Net (decrease)/increase in cash and cash equivalents (3,063) 1,982
Cash and cash equivalents at 1 July 32,757 30,528
Effect of exchange rate fluctuations on cash held 179 247
Cash and cash equivalents at 30 June 11 29,873 32,757
The statement of profit or loss and other comprehensive income is to be read in conjunction with the notes to the financial statements set out on
pages 48 to 87.
CONSOLIDATED STATEMENT OF CASH FLOWS

47
GWA GROUP LIMITED AND ITS CONTROLLED ENTITIES ABN 15 055 964 380
For the year ended 30 June 2014
In thousands of AUD Share capital
Translation reserve
Hedging reserve
Equity compensation
reserve
Retained earnings Total
Balance at 1 July 2012 398,930 (2,654) (2,248) 2,413 30,543 426,984
Total comprehensive income for the period
Profit for the period – – – – 32,390 32,390
Other comprehensive income
Foreign currency translation differences for
foreign operations, net of income tax – 669 – – – 669
Effective portion of changes in fair value of
cash flow hedges, net of income tax – – 1,959 – – 1,959
Total other comprehensive income – 669 1,959 – – 2,628
Total comprehensive income for the period – 669 1,959 – 32,390 35,018
Transactions with owners, recorded directly in equity
Share-based payments, net of income tax – – – (547) 70 (477)
Dividends to shareholders – – – – (43,953) (43,953)
Issue of ordinary shares 9,170 – – – – 9,170
Total transactions with owners 9,170 – – (547) (43,883) (35,260)
Balance at 30 June 2013 408,100 (1,985) (289) 1,866 19,050 426,742
Balance at 1 July 2013 408,100 (1,985) (289) 1,866 19,050 426,742
Total comprehensive income for the period
Profit for the period – – – – 18,596 18,596
Other comprehensive income
Foreign currency translation differences for
foreign operations, net of income tax – 844 – – – 844
Effective portion of changes in fair value of
cash flow hedges, net of income tax – – (1,619) – – (1,619)
Total other comprehensive income – 844 (1,619) – – (775)
Total comprehensive income for the period – 844 (1,619) – 18,596 17,821
Transactions with owners, recorded directly in equity
Share-based payments, net of income tax – – – (58) (124) (182)
Dividends to shareholders – – – – (18,392) (18,392)
Total transactions with owners – – – (58) (18,516) (18,574)
Balance at 30 June 2014 408,100 (1,141) (1,908) 1,808 19,130 425,989
The statement of profit or loss and other comprehensive income is to be read in conjunction with the notes to the financial statements set out on
pages 48 to 87.
CONSOLIDATED STATEMENT OF CHANGES IN EQUITY

GWA GROUP LIMITED • 2014 ANNUAL REPORT
GWA GROUP LIMITED AND ITS CONTROLLED ENTITIES ABN 15 055 964 380
NOTES TO THE CONSOLIDATED FINANCIAL STATEMENTS
1. SIGNIFICANT ACCOUNTING POLICIES
GWA Group Limited (the ‘Company’) is a for-profit company domiciled
in Australia. The consolidated financial report of the Company for the
financial year ended 30 June 2014 comprises the Company and its
subsidiaries (together referred to as the ‘consolidated entity’). The
principal activities of the consolidated entity during the year were the
research, design, manufacture, import and marketing of building
fixtures and fittings to households and commercial premises and the
distribution of these various products through a range of distribution
channels in Australia, New Zealand and selected international markets.
The financial report was authorised for issue by the directors on
19 August 2014.
(a) Statement of complianceThe financial report is a general purpose financial report which has
been prepared in accordance with Australian Accounting Standards
(‘AASBs’) adopted by the Australian Accounting Standards Board
(‘AASB’) and the Corporations Act 2001. The consolidated entity’s
financial report complies with International Financial Reporting
Standards (‘IFRSs’) adopted by the International Accounting
Standards Board (‘IASB’).
(b) Basis of preparationThe financial report is presented in Australian dollars which is the
Company’s functional currency and the functional currency of the
majority of the consolidated entity. The entity has elected not to early
adopt any accounting standards or amendments.
The financial report is prepared on the historical cost basis except
for the following items that are measured at fair value:
i) derivative financial instruments
ii) trade and other receivables
iii) trade and other payables
The Company is of a kind referred to in ASIC Class Order 98/100
dated 10 July 1998 and in accordance with that Class Order,
amounts in the financial report and Directors’ Report have been
rounded off to the nearest thousand dollars, unless otherwise stated.
The preparation of a financial report requires management to make
judgements, estimates and assumptions that affect the application
of accounting policies and the reported amounts of assets, liabilities,
income and expenses. The estimates and associated assumptions
are based on historical experience and various other factors that
are believed to be reasonable under the circumstances, the results
of which form the basis of making the judgements about carrying
values of assets and liabilities that are not readily apparent from other
sources. Actual results may differ from these estimates.
The estimates and underlying assumptions are reviewed on an
ongoing basis. Revisions to accounting estimates are recognised in
the period in which the estimate is revised if the revision affects only
that period, or in the period of the revision and future periods if the
revision affects both current and future periods.
In particular, information about significant areas of estimation
uncertainty and critical judgements in applying accounting policies
that have the most significant effect on the amount recognised in the
financial statements are described in the following notes:
• note 17 – measurement of the recoverable amounts of
intangible assets
• note 21 – fair value of share-based payments
• note 22 and 27 – provisions and contingencies
• note 24 – valuation of financial instruments
The accounting policies set out below have been applied consistently
to all periods presented in the consolidated financial report.
The accounting policies have been applied consistently by all
entities in the consolidated entity.
(c) Basis of consolidation(i) Business combinations
The consolidated entity accounts for business combinations using
the acquisition method when control is transferred to the consolidated
entity. The consideration transferred in the acquisition is generally
measured at fair value, as are the identifiable net assets acquired.
Any goodwill that arises is tested annually for impairment. Transaction
costs are expensed as incurred.
(ii) Subsidiaries
Subsidiaries are entities controlled by the consolidated entity. The
consolidated entity controls an entity when it is exposed to, or has
rights to, variable returns from its involvement with the entity and has
the ability to affect those returns through its power over the entity. The
financial statements of subsidiaries are included in the consolidated
financial statements from the date on which control commences until
the date on which control ceases.
(iii) Transactions eliminated on consolidation
Intra-group balances and transactions, and any unrealised income
and expenses arising from intra-group transactions, are eliminated.
(d) Foreign currency(i) Foreign currency transactions
Transactions in foreign currencies are translated at the foreign
exchange rate ruling at the date of the transaction. Monetary assets
and liabilities denominated in foreign currencies at the reporting date
are retranslated to Australian dollars at the foreign exchange rate
ruling at that date. Foreign exchange differences arising on translation
are recognised in profit or loss. Non-monetary assets and liabilities
that are measured in terms of historical cost in a foreign currency are
49
GWA GROUP LIMITED AND ITS CONTROLLED ENTITIES ABN 15 055 964 380
NOTES TO THE CONSOLIDATED FINANCIAL STATEMENTS
retranslated to Australian dollars using the exchange rate at the date
of the transaction. Non-monetary assets and liabilities denominated
in foreign currencies that are stated at fair value are translated to
Australian dollars at foreign exchange rates ruling at the dates the
fair value was determined.
(ii) Financial statements of foreign operations
The assets and liabilities of foreign operations, including goodwill
and fair value adjustments arising on acquisition, are translated to
Australian dollars at foreign exchange rates ruling at the reporting
date. The revenues and expenses of foreign operations are
translated to Australian dollars at rates approximating to the foreign
exchange rates ruling at the dates of the transactions. Foreign
exchange differences arising on retranslation are recognised in
other comprehensive income, and presented in the foreign currency
translation reserve (FCTR) in equity.
When a foreign operation is disposed such that control, significant
influence or joint control is lost, the cumulative amount in the
translation reserve related to that foreign operation is reclassified
to profit or loss as part of the gain or loss on disposal.
(iii) Net investment in foreign operations
Foreign exchange differences arising from the retranslation of the net
investment in foreign operations (including monetary items neither
planned to be settled or likely to be settled in the foreseeable future),
and of related hedges are recognised in the FCTR to the extent that
the hedge is effective. They are released into profit or loss as part of
the gain or loss on disposal.
(e) Derivative financial instrumentsThe consolidated entity uses derivative financial instruments to hedge
its exposure to foreign exchange and interest rate risks arising from
operating, financing and investing activities. In accordance with
its treasury policy, the consolidated entity does not hold or issue
derivative financial instruments for trading purposes.
Derivative financial instruments are recognised initially at fair
value. Subsequent to initial recognition, derivative financial
instruments are stated at fair value. The gain or loss on
remeasurement to fair value is recognised in profit or loss,
unless the derivative qualifies for hedge accounting, in which
case the recognition of any resultant gain or loss depends on
the nature of the item being hedged (see accounting policy (f)).
The fair value of interest rate swaps is the estimated amount that the
consolidated entity would receive or pay to terminate the swap at
the reporting date, taking into account current interest rates and the
current creditworthiness of the swap counterparties. The fair value
of forward exchange contracts is their quoted market price at the
reporting date, being the present value of the quoted forward price.
(f) HedgingThe consolidated entity holds derivative financial instruments
to hedge its foreign currency and interest rate risk exposures.
Embedded derivatives are separated from the host contract and
accounted for separately if the economic characteristics and risks
of the host contract and the embedded derivative are not closely
related, a separate instrument with the same terms as the embedded
derivative would meet the definition of a derivative, and the combined
instrument is not measured at fair value through profit or loss.
On initial designation of the derivative as the hedging instrument, the
consolidated entity formally documents the relationship between the
hedging instrument and hedged item, including the risk management
objectives and strategy in undertaking the hedge transaction and the
hedged risk, together with the methods that will be used to assess
the effectiveness of the hedging relationship. The consolidated entity
makes an assessment, both at the inception of the hedge relationship
as well as on an ongoing basis, whether the hedging instruments
are expected to be highly effective in offsetting the changes in the
fair value or cash flows of the respective hedged items attributable
to hedged risk, and whether the actual results of each hedge are
within a range of 80-125 percent. For a cash flow hedge of a forecast
transaction, the transaction should be highly probably to occur and
should present an exposure to variations in cash flows that could
ultimately affect reported profit or loss.
Derivatives are recognised initially at fair value and attributable
transaction costs are recognised in profit or loss as incurred.
Subsequent to initial recognition, derivatives are measured at fair
value and changes therein are accounted for as described below.
(i) Cash flow hedges
When a derivative is designated as the hedging instrument in a
hedge of the variability in cash flows attributable to a particular risk
associated with a recognised asset or liability or a highly probable
forecast transaction that could affect profit or loss, the effective
portion of changes in the fair value of the derivative is recognised in
other comprehensive income and presented in the hedging reserve
in equity. Any ineffective portion of changes in the fair value of the
derivative is recognised immediately in profit or loss.
1. SIGNIFICANT ACCOUNTING POLICIES (CONTINUED)
(d) Foreign currency (continued)(i) Foreign currency transactions (continued)
GWA GROUP LIMITED • 2014 ANNUAL REPORT
GWA GROUP LIMITED AND ITS CONTROLLED ENTITIES ABN 15 055 964 380
NOTES TO THE CONSOLIDATED FINANCIAL STATEMENTS
When the hedged item is a non-financial asset, the amount
recognised in equity is included in the carrying amount of the asset
when the asset is recognised. In other cases the amount accumulated
in equity is reclassified to profit or loss in the same period the hedged
item affects profit or loss. If the hedging instrument no longer meets
the criteria for hedge accounting, expires or is sold, terminated or
exercised, or the designation is revoked, then hedge accounting is
discontinued prospectively. If the forecast transaction is no longer
expected to occur, then the balance in equity is reclassified to
profit or loss.
Separable embedded derivativesChanges in the fair value of separable embedded derivatives
are recognised immediately in profit or loss.
Other non-trading derivativesWhen a derivative financial instrument is not designated in a hedge
relationship that qualifies for hedge accounting, all changes in its fair
value are recognised immediately in profit or loss.
(ii) Hedge of monetary assets and liabilities
Where a derivative financial instrument is used to hedge economically
the foreign exchange exposure of a recognised monetary asset or
liability, no hedge accounting is applied and any gain or loss on the
hedging instrument is recognised in profit or loss.
(iii) Hedge of net investment in foreign operation
The portion of the gain or loss on an instrument used to hedge a net
investment in a foreign operation that is determined to be an effective
hedge is recognised in other comprehensive income, and presented
in the foreign currency translation reserve in equity. The ineffective
portion is recognised immediately in profit or loss.
(g) Property, plant and equipmentItems of property, plant and equipment are measured at cost less
accumulated depreciation and impairment losses. Cost includes
expenditure that is directly attributable to the acquisition of the asset.
The cost of self-constructed assets includes the cost of materials,
direct labour, the initial estimate, where relevant, of the costs of
dismantling and removing the items and restoring the site on which
they are located, and an appropriate proportion of production
overheads. Purchased software that is integral to the functionality
of the related equipment is capitalised as part of that equipment.
Where parts of an item of property, plant and equipment have
different useful lives, they are accounted for as separate items
of property, plant and equipment.
Gains and losses on disposal of an item of property, plant and
equipment are determined by comparing proceeds from disposal
with the carrying amount of property, plant and equipment and are
recognised net within “other income” or “other expenses” in profit
or loss.
(i) Subsequent costs
The consolidated entity recognises in the carrying amount of an
item of property, plant and equipment the cost of replacing part
of such an item when that cost is incurred if it is probable that the
future economic benefits embodied within the item will flow to the
consolidated entity and the cost of the item can be measured reliably.
The carrying amount of the replaced part is derecognised. All other
costs are recognised in profit or loss as an expense as incurred.
(ii) Depreciation
With the exception of freehold land, depreciation is recognised in
profit or loss as incurred on a straight-line basis over the estimated
useful lives of each part of an item of property, plant and equipment.
Land is not depreciated. The estimated useful lives in the current and
comparative periods are as follows:
• buildings 40 years
• plant and equipment 3-15 years
• motor vehicles 4-8 years
The residual value, the useful life and the depreciation method
applied to an asset are reassessed annually.
(h) Intangible assets(i) Research and development
Expenditure on research activities, undertaken with the prospect
of gaining new scientific or technical knowledge and understanding,
is recognised in profit or loss as incurred.
Expenditure on development activities, whereby research findings are
applied to a plan or design for the production of new or substantially
improved products and processes, is capitalised only if the product or
process is technically and commercially feasible and the consolidated
entity has sufficient resources to complete development. Capitalised
development expenditure is measured at cost less accumulated
amortisation and impairment losses.
(ii) Brand names
Acquired brand names are stated at cost. Expenditure incurred in
developing, maintaining or enhancing brand names is recognised in
profit or loss in the year in which it is incurred. The brand names are
not amortised as the directors believe that the brand names have an
indefinite useful life. The carrying values of brand names are tested
each year to ensure that no impairment exists.
1. SIGNIFICANT ACCOUNTING POLICIES (CONTINUED)
(f) Hedging (continued)(i) Cash flow hedges (continued)

51
GWA GROUP LIMITED AND ITS CONTROLLED ENTITIES ABN 15 055 964 380
NOTES TO THE CONSOLIDATED FINANCIAL STATEMENTS
(iii) Goodwill
Goodwill acquired in business combinations of the consolidated
entity is measured at cost less accumulated impairment losses.
Goodwill represents the excess of the cost of the acquisition over the
consolidated entity’s interest in the net fair value of the identifiable
assets, liabilities and contingent liabilities of the acquired business.
(iv) Other intangible assets
Other intangible assets that are acquired by the consolidated
entity are measured at cost less accumulated amortisation and
impairment losses.
(v) Subsequent expenditure
Subsequent expenditure on capitalised intangible assets is capitalised
only when it increases the future economic benefits embodied in
the specific asset to which it relates. All other expenditure is expensed
as incurred.
(vi) Amortisation
Amortisation is recognised in profit or loss on a straight-line basis
over the estimated useful lives of intangible assets unless such lives
are indefinite. Intangible assets with an indefinite useful life are
systematically tested for impairment at each balance date. Other
intangible assets are amortised from the date they are available
for use. The estimated useful lives in the current and comparative
periods are as follows:
• software 4 years
• brand names nil
• trade names 10-20 years
• designs 15 years
• patents 3-19 years (based on patent term)
• customer relationships 8 years
(i) Trade and other receivablesTrade and other receivables are initially measured at fair value and
subsequently at their amortised cost less impairment losses.
(j) InventoriesInventories are measured at the lower of cost and net realisable
value. Net realisable value is the estimated selling price in the
ordinary course of business, less the estimated costs of completion
and selling expenses.
The cost of inventories is based on the first-in first-out principle and
includes expenditure incurred in acquiring the inventories, production
or conversion costs and other costs incurred in bringing them to
their existing location and condition. In the case of manufactured
inventories and work in progress, cost includes an appropriate share
of production overheads based on normal operating capacity.
(k) Cash and cash equivalentsCash and cash equivalents comprise cash balances and call deposits
with an original maturity date of three months or less. Bank overdrafts
that are repayable on demand and form an integral part of the
consolidated entity’s cash management are included as a component
of cash and cash equivalents for the purpose of the statement of
cash flows.
(l) Impairment(i) Non-derivative financial assets
A financial asset not carried at fair value through profit or loss is
assessed at each reporting date to determine whether there is
objective evidence that it is impaired. A financial asset is impaired if
there is objective evidence of impairment as a result of one or more
events that occurred after the initial recognition of the asset, and that
the loss event(s) had an impact on the estimated future cash flows of
that asset that can be estimated reliably.
Objective evidence that financial assets are impaired includes default
or delinquency by a debtor, restructuring of an amount due to the
consolidated entity on terms that the consolidated entity would not
consider otherwise, indications that a debtor or issuer will enter
bankruptcy, the disappearance of an active market for a security.
In addition, for an investment in an equity security, a significant or
prolonged decline in its fair value below its cost is objective evidence
of impairment.
Financial assets measured at amortised costThe consolidated entity considers evidence of impairment for financial
assets measured at amortised cost (loans and receivables) at both a
specific asset and collective level. All individually significant assets are
assessed for specific impairment. Those found not to be specifically
impaired are then collectively assessed for any impairment that has
been incurred but not yet identified. Assets that are not individually
significant are collectively assessed for impairment by grouping
together assets with similar risk characteristics.
In assessing collective impairment the consolidated entity uses historical
trends of the probability of default, timing of recoveries and the amount
of loss incurred, adjusted for management’s judgement as to whether
current economic and credit conditions are such that the actual losses
are likely to be greater or less than suggested by historical trends.
An impairment loss in respect of a financial asset measured at
amortised cost is calculated as the difference between its carrying
amount and the present value of the estimated future cash flows
discounted at the asset’s original effective interest rate. Losses are
recognised in profit or loss and reflected in an allowance account
against receivables. Interest on the impaired asset continues to be
recognised through the unwinding of the discount. When an event
occurring after the impairment was recognised causes the amount
of impairment loss to decrease, the decrease in impairment loss is
reversed through profit or loss.
1. SIGNIFICANT ACCOUNTING POLICIES (CONTINUED)
(h) Intangible assets (continued)

GWA GROUP LIMITED • 2014 ANNUAL REPORT
GWA GROUP LIMITED AND ITS CONTROLLED ENTITIES ABN 15 055 964 380
NOTES TO THE CONSOLIDATED FINANCIAL STATEMENTS
Available-for-sale financial assetsImpairment losses on available-for-sale financial assets are recognised
by reclassifying the losses accumulated in the fair value reserve in
equity to profit or loss. The cumulative loss that is reclassified from
equity to profit or loss is the difference between the acquisition cost,
net of any principal repayment and amortisation, and the current fair
value, less any impairment loss recognised previously in profit or loss.
Changes in cumulative impairment losses attributable to application
of the effective interest method are reflected as a component of
interest income. If, in a subsequent period, the fair value of an
impaired available-for-sale debt security increases and the increase
can be related objectively to an event occurring after the impairment
loss was recognised, then the impairment loss is reversed, with the
amount of the reversal recognised in profit or loss. However, any
subsequent recovery in the fair value of an impaired available-for-sale
equity security is recognised in other comprehensive income.
(ii) Non-financial assets
The carrying amounts of the consolidated entity’s non-financial
assets, other than inventories and deferred tax assets, are reviewed
at each reporting date to determine whether there is any indication of
impairment. If any such indication exists, then the asset’s recoverable
amount is estimated. Goodwill and indefinite life intangible assets are
tested annually for impairment. An impairment loss is recognised if
the carrying amount of an asset or its related cash-generating unit
(CGU) exceeds its recoverable amount.
The recoverable amount of an asset or CGU unit is the greater of its
value in use and its fair value less costs to sell. In assessing value in
use, the estimated future cash flows are discounted to their present
value using a pre-tax discount rate that reflects current market
assessments of the time value of money and the risks specific to the
asset. For the purpose of impairment testing, assets that cannot be
tested individually are grouped together into the smallest group of
assets that generates cash inflows from continuing use that are largely
independent of the cash inflows of other assets or CGUs. Subject
to an operating segment ceiling test, CGUs to which goodwill has
been allocated are aggregated so that the level at which impairment
is tested reflects the lowest level at which goodwill is monitored
for internal reporting purposes. Goodwill acquired in a business
combination is allocated to groups of CGUs that are expected to
benefit from the synergies of the combination.
Impairment losses are recognised in profit or loss. Impairment losses
recognised in respect of CGUs are allocated first to reduce the
carrying amount of any goodwill allocated to the CGU (or group of
CGUs), and then to reduce the carrying amounts of the other assets
in the CGU (or group of CGUs) on a pro rata basis.
An impairment loss in respect of goodwill is not reversed. For other
assets, an impairment loss is reversed only to the extent that the
asset’s carrying amount does not exceed the carrying amount that
would have been determined, net of depreciation or amortisation,
if no impairment loss had been recognised.
(m) Share capital(i) Ordinary shares
Ordinary shares are classified as equity. Incremental costs directly
attributable to the issue of ordinary shares are recognised as a
deduction from equity, net of any tax effects.
(ii) Dividends
Dividends are recognised as a liability in the period in which they
are declared.
(iii) Transaction costs
Transaction costs of an equity transaction are accounted for as a
deduction from equity, net of any related income tax benefit.
(n) Interest-bearing borrowingsInterest-bearing borrowings are recognised initially at fair value
less attributable transaction costs. Subsequent to initial recognition,
interest-bearing borrowings are measured at amortised cost with
any difference between cost and redemption value being recognised
in profit or loss over the period of the borrowings on an effective
interest basis.
(o) Employee benefits(i) Defined contribution superannuation funds
A defined contribution superannuation fund is a post-employment
benefit plan under which an entity pays fixed contributions into a
separate entity and will have no legal or constructive obligation to pay
further amounts. Obligations for contributions to defined contribution
superannuation funds are recognised as an employee benefit
expense in profit or loss in the periods during which the services
are rendered by employees.
(ii) Other long-term employee benefits
The consolidated entity’s net obligation in respect of long-term
employee benefits is the amount of future benefit that employees
have earned in return for their service in the current and prior
periods. The benefit is calculated using expected future increases
in wage and salary rates including related on-costs and expected
settlement dates, and is discounted to present value.
1. SIGNIFICANT ACCOUNTING POLICIES (CONTINUED)
(l) Impairment (continued)(i) Non-derivative financial assets (continued)
53
GWA GROUP LIMITED AND ITS CONTROLLED ENTITIES ABN 15 055 964 380
NOTES TO THE CONSOLIDATED FINANCIAL STATEMENTS
(iii) Short-term benefits
Short-term employee benefits are expensed as the related service
is provided. A liability is recognised for the amount expected to be
paid if the consolidated entity has a present legal or constructive
obligation to pay this amount as a result of past service provided
by the employee and the obligation can be estimated reliably.
(iv) Share-based payment transactions
The grant date fair value of performance rights granted to employees
is recognised as a personnel expense, with a corresponding increase
in equity, over the specified period that the performance rights vest
to employees. The amount recognised as an expense is adjusted
to reflect the actual number of performance rights for which the
related service and non-market vesting hurdles are met, such that the
amount ultimately recognised as an expense is based on the number
of awards that do not meet the related service and non-market
performance conditions at the vesting date. For share-based payment
awards with non-vesting conditions, the grant date fair value of the
share-based payment is measured to reflect such conditions and there
is no true-up for differences between expected and actual outcomes.
(p) ProvisionsA provision is recognised when the consolidated entity has a present
legal or constructive obligation as a result of a past event that can
be estimated reliably, and it is probable that an outflow of economic
benefits will be required to settle the obligation. Provisions are
determined by discounting the expected future cash flows at a pre-tax
rate that reflects current market assessments of the time value of
money and, where appropriate, the risks specific to the liability.
(i) Warranties
A provision for warranties is recognised when the underlying
products or services are sold. The provision is based on historical
warranty data and a weighting of all possible outcomes against their
associated probabilities.
(ii) Restructuring
A provision for restructuring is recognised when the consolidated
entity has approved a detailed and formal restructuring plan, and the
restructuring has either commenced or has been announced publicly.
Future operating costs are not provided for.
(iii) Site restoration
A provision for restoration in respect of owned and leased premises
is recognised when the obligation to restore arises. The provision is
the best estimate of the present value of the expenditure required to
settle the restoration obligation at the reporting date. Future restoration
obligations are reviewed annually and any changes are reflected in the
present value of the provision at the end of the reporting period. The
unwinding of the effect of discounting on the provision
is recognised as a finance cost.
(q) Trade and other payablesTrade and other payables are initially measured at fair value and
subsequently at their amortised cost.
(r) RevenueGoods sold
Revenue from the sale of goods is measured at the fair value of
the consideration received or receivable, net of returns, discounts
and rebates. Revenue is recognised when the significant risks and
rewards of ownership have been transferred to the buyer which is
typically when goods are delivered to the customer, recovery of the
consideration is probable, the associated costs and possible return of
goods can be estimated reliably, there is no continuing management
involvement with the goods and the amount of revenue can be
measured reliably.
(s) Expenses(i) Cost of goods sold
Cost of good sold comprises the cost of manufacture and purchase of
goods including supply chain costs such as freight and warehousing.
(ii) Operating lease payments
Payments made under operating leases are recognised in profit
or loss on a straight-line basis over the term of the lease. Lease
incentives received are recognised as an integral part of the total
lease expense and spread over the lease term.
(iii) Net financing costs
Net financing costs comprise interest payable on borrowings
calculated using the effective interest method, interest receivable on
funds invested and gains and losses on hedging instruments that are
recognised in profit or loss. Borrowing costs are expensed as incurred
unless they relate to qualifying assets. Interest income is recognised
in profit or loss as it accrues, using the effective interest method.
(t) Income taxTax expense comprises current and deferred tax. Current and
deferred tax are recognised in profit or loss except to the extent that
it relates to a business combination, or items recognised directly in
equity or in other comprehensive income.
Current tax is the expected tax payable or receivable on the taxable
income or loss for the year, using tax rates enacted or substantively
enacted at the reporting date, and any adjustment to tax payable in
respect of previous years. Current tax payable also includes any tax
liability arising from the declaration of dividends.
1. SIGNIFICANT ACCOUNTING POLICIES (CONTINUED)
(o) Employee benefits (continued)

GWA GROUP LIMITED • 2014 ANNUAL REPORT
GWA GROUP LIMITED AND ITS CONTROLLED ENTITIES ABN 15 055 964 380
NOTES TO THE CONSOLIDATED FINANCIAL STATEMENTS
Deferred tax is recognised in respect of temporary differences
between the carrying amounts of assets and liabilities for financial
reporting purposes and the amounts used for taxation purposes.
Deferred tax is not recognised for:
• Temporary differences on the initial recognition of assets or
liabilities in a transaction that is not a business combination and
that affects neither accounting nor taxable profit or loss
• Temporary differences related to investments in subsidiaries and
associates and jointly controlled entities to the extent that it is
probable that they will not reverse in the foreseeable future
• Taxable temporary differences arising on the initial recognition
of goodwill
Deferred tax is measured at the tax rates that are expected to be
applied to temporary differences when they reverse, using tax rates
enacted or substantively enacted at the reporting date.
In determining the amount of current and deferred tax the consolidated
entity takes into account the impact of uncertain tax positions and
whether additional taxes and interest may be due. The consolidated
entity believes that its accruals for tax liabilities are adequate for all
open tax years based on its assessment of many factors, including
interpretations of tax law and prior experience. This assessment relies
on estimates and assumptions and may involve a series of judgements
about future events. New information may become available that
causes the consolidated entity to change its judgement regarding the
adequacy of existing tax liabilities; such changes to tax liabilities will
impact tax expense in the period that such a determination is made.
Deferred tax assets and liabilities are offset if there is a legally
enforceable right to offset current tax liabilities and assets, and they
relate to income taxes levied by the same tax authority on the same
taxable entity, or on different tax entities, but they intend to settle
current tax liabilities and assets on a net basis or their tax assets
and liabilities will be realised simultaneously.
A deferred tax asset is recognised for unused tax losses, tax credits
and deductible temporary differences, to the extent that it is probable
that future taxable profits will be available against which they can be
utilised. Deferred tax assets are reviewed at each reporting date and
are reduced to the extent that it is no longer probable that the related
tax benefit will be realised.
Additional income tax expenses that arise from the distribution of
cash dividends are recognised at the same time that the liability to
pay the related dividend is recognised. The consolidated entity does
not distribute non-cash assets as dividends to its shareholders.
The Company and its wholly-owned Australian resident entities are
part of a tax-consolidated group. As a consequence, all members
of the tax-consolidated group are taxed as a single entity. The head
entity within the tax-consolidated group is GWA Group Limited.
(u) Goods and services taxRevenue, expenses and assets are recognised net of the amount
of goods and services tax (GST), except where the amount of
GST incurred is not recoverable from the taxation authority.
In these circumstances, the GST is recognised as part of the
cost of acquisition of the asset or as part of the expense.
Receivables and payables are stated with the amount of GST
included. The net amount of GST recoverable from, or payable
to, the ATO is included as a current asset or liability in the
statement of financial position.
Cash flows are included in the statement of cash flows on a gross
basis. The GST components of cash flows arising from investing and
financing activities which are recoverable from, or payable to, the ATO
are classified as operating cash flows.
(v) Earnings per shareThe consolidated entity presents basic and diluted earnings per share
(EPS) data for its ordinary shares. Basic EPS is calculated by dividing
the profit or loss attributable to ordinary shareholders of the Company
by the weighted average number of ordinary shares outstanding
during the period. Diluted EPS is determined by adjusting the profit
or loss attributable to ordinary shareholders and the weighted average
number of ordinary shares outstanding for the effects of all dilutive
potential ordinary shares.
(w) Discontinued operationsA discontinued operation is a component of the consolidated entity’s
business that represents a separate line of business operations that has
been disposed of or is held for sale. Classification as a discontinued
operation occurs upon disposal or when the operation meets the criteria
to be classified as held for sale if earlier. When an operation is classified
as a discontinued operation, the comparative statement of profit or loss
and other comprehensive income is re-presented as if the operation had
been discontinued from the start of the period.
(x) Segment reportingSegment results that are reported to the CEO include items that
are directly attributable to a segment as well as those that can be
allocated on a reasonable basis. Unallocated items comprise mainly
corporate assets, head office expenses, loans and borrowings,
treasury financial instruments and income tax assets and liabilities.
(y) New standards and interpretations not yet adoptedA number of new standards, amendments to standards and
interpretations are effective for annual periods beginning after
1 July 2013, and have not been applied in preparing these
consolidated financial statements. Those which may be relevant
to the consolidated entity are set out below. The consolidated
entity does not plan to early adopt these standards.
1. SIGNIFICANT ACCOUNTING POLICIES (CONTINUED)
(t) Income tax (continued)
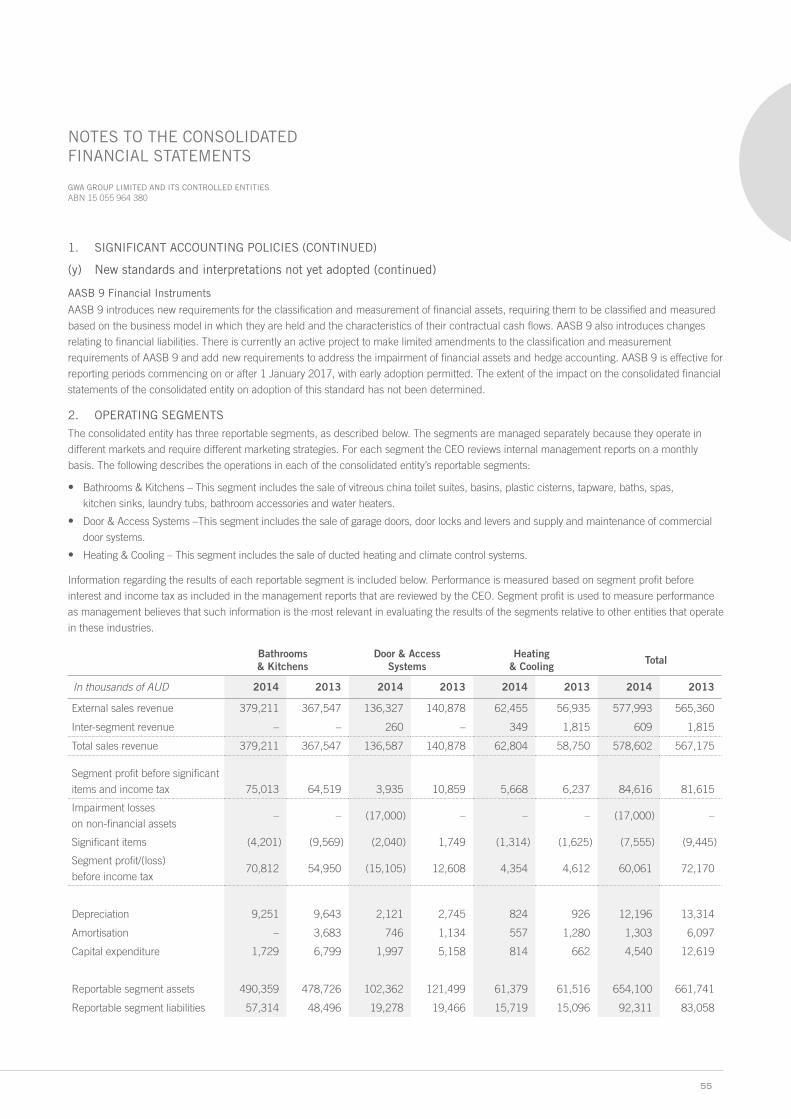
55
GWA GROUP LIMITED AND ITS CONTROLLED ENTITIES ABN 15 055 964 380
NOTES TO THE CONSOLIDATED FINANCIAL STATEMENTS
AASB 9 Financial Instruments
AASB 9 introduces new requirements for the classification and measurement of financial assets, requiring them to be classified and measured
based on the business model in which they are held and the characteristics of their contractual cash flows. AASB 9 also introduces changes
relating to financial liabilities. There is currently an active project to make limited amendments to the classification and measurement
requirements of AASB 9 and add new requirements to address the impairment of financial assets and hedge accounting. AASB 9 is effective for
reporting periods commencing on or after 1 January 2017, with early adoption permitted. The extent of the impact on the consolidated financial
statements of the consolidated entity on adoption of this standard has not been determined.
2. OPERATING SEGMENTS
The consolidated entity has three reportable segments, as described below. The segments are managed separately because they operate in
different markets and require different marketing strategies. For each segment the CEO reviews internal management reports on a monthly
basis. The following describes the operations in each of the consolidated entity’s reportable segments:
• Bathrooms & Kitchens – This segment includes the sale of vitreous china toilet suites, basins, plastic cisterns, tapware, baths, spas,
kitchen sinks, laundry tubs, bathroom accessories and water heaters.
• Door & Access Systems –This segment includes the sale of garage doors, door locks and levers and supply and maintenance of commercial
door systems.
• Heating & Cooling – This segment includes the sale of ducted heating and climate control systems.
Information regarding the results of each reportable segment is included below. Performance is measured based on segment profit before
interest and income tax as included in the management reports that are reviewed by the CEO. Segment profit is used to measure performance
as management believes that such information is the most relevant in evaluating the results of the segments relative to other entities that operate
in these industries.
Bathrooms & Kitchens
Door & Access Systems
Heating & Cooling Total
In thousands of AUD 2014 2013 2014 2013 2014 2013 2014 2013
External sales revenue 379,211 367,547 136,327 140,878 62,455 56,935 577,993 565,360
Inter-segment revenue – – 260 – 349 1,815 609 1,815
Total sales revenue 379,211 367,547 136,587 140,878 62,804 58,750 578,602 567,175
Segment profit before significant
items and income tax 75,013 64,519 3,935 10,859 5,668 6,237 84,616 81,615
Impairment losses
on non-financial assets– – (17,000) – – – (17,000) –
Significant items (4,201) (9,569) (2,040) 1,749 (1,314) (1,625) (7,555) (9,445)
Segment profit/(loss)
before income tax70,812 54,950 (15,105) 12,608 4,354 4,612 60,061 72,170
Depreciation 9,251 9,643 2,121 2,745 824 926 12,196 13,314
Amortisation – 3,683 746 1,134 557 1,280 1,303 6,097
Capital expenditure 1,729 6,799 1,997 5,158 814 662 4,540 12,619
Reportable segment assets 490,359 478,726 102,362 121,499 61,379 61,516 654,100 661,741
Reportable segment liabilities 57,314 48,496 19,278 19,466 15,719 15,096 92,311 83,058
1. SIGNIFICANT ACCOUNTING POLICIES (CONTINUED)
(y) New standards and interpretations not yet adopted (continued)

GWA GROUP LIMITED • 2014 ANNUAL REPORT
GWA GROUP LIMITED AND ITS CONTROLLED ENTITIES ABN 15 055 964 380
NOTES TO THE CONSOLIDATED FINANCIAL STATEMENTS
Reconciliations of reportable segment revenues, profit or loss, assets and liabilities
In thousands of AUD 2014 2013
Revenues
Total revenue for reportable segments 578,602 567,175
Unallocated amounts: corporate revenue 1 5
Elimination of inter-segment revenue (609) (1,815)
Consolidated revenue 577,994 565,365
Profit
Total profit for reportable segments 60,061 72,170
Significant items: corporate (3,962) (1,986)
Unallocated amounts: corporate expenses (12,276) (14,845)
Profit from operating activities 43,823 55,339
Net financing costs (11,201) (13,324)
Consolidated profit before tax 32,622 42,015
Assets
Total assets for reportable segments 654,100 661,741
Unallocated amounts: corporate assets* 98,135 77,936
Consolidated total assets 752,235 739,677
Liabilities
Total liabilities for reportable segments 92,311 83,058
Unallocated amounts: corporate liabilities* 233,935 229,877
Consolidated total liabilities 326,246 312,935
* Corporate assets include cash and cash equivalents, tax assets and treasury financial instruments at fair value. Corporate liabilities include loans and borrowings, tax liabilities and treasury financial instruments at fair value.
Reconciliations of other material items
In thousands of AUD 2014 2013
Depreciation
Total depreciation for reportable segments 12,196 13,314
Unallocated amounts: depreciation on corporate assets 619 429
Consolidated total depreciation 12,815 13,743
Amortisation
Total amortisation for reportable segments 1,303 6,097
Unallocated amounts: amortisation on corporate assets 3,445 558
Consolidated total amortisation 4,748 6,655
Capital expenditure
Total capital expenditure for reportable segments 4,540 12,619
Unallocated amounts: corporate capital expenditure 1,030 2,084
Consolidated total capital expenditure 5,570 14,703
2. OPERATING SEGMENTS (CONTINUED)

57
GWA GROUP LIMITED AND ITS CONTROLLED ENTITIES ABN 15 055 964 380
NOTES TO THE CONSOLIDATED FINANCIAL STATEMENTS
Geographical segments
The business segments are managed on a worldwide basis, but operate mainly in one geographical area being Australia. A sales office is also
operated in New Zealand. Sales revenue from geographical areas outside Australia comprised only 4% of the consolidated entity’s total sales
revenue for the current year (2013: 4%).
In presenting information on the basis of geographical segments, segment revenue is based on the geographical location of customers.
Segment assets are based on the geographical location of the assets.
Australia Unallocated Consolidated
In thousands of AUD 2014 2013 2014 2013 2014 2013
External sales revenue 555,172 544,331 22,822 21,034 577,994 565,365
Segment assets 745,152 733,498 7,083 6,179 752,235 739,677
Capital expenditure 5,539 14,597 31 106 5,570 14,703
Major customers
The consolidated entity conducts business with 3 customers where the net revenue generated from each customer exceeds 10% of the
consolidated entity’s total net revenue. Net revenue from these customers represent $100,355,000 (2013: $83,809,000), $71,924,000
(2013: $71,440,000) and $66,809,000 (2013: $62,592,000) respectively of the consolidated entity’s total net revenues for the current year
of $577,994,000 (2013: $565,365,000). The revenues from these customers are reported in the Bathrooms & Kitchens, Door & Access
Systems and the Heating & Cooling segments.
3. OTHER INCOME
In thousands of AUD Note 2014 2013
Foreign currency gains – realised 39 11
Foreign currency gains – unrealised 373 29
Significant items – gain on disposal of property 5 – 3,537
Compensation income – lease exit – 1,993
Other – scrap income, royalties, bad debts recovered 883 1,150
1,295 6,720
4. OTHER EXPENSES
In thousands of AUD Note 2014 2013
Foreign currency losses – realised 1,928 37
Net loss on disposal of property, plant and equipment and intangible assets 635 202
Significant items 5 28,517 14,968
Acquisition costs – 839
31,080 16,046
2. OPERATING SEGMENTS (CONTINUED)
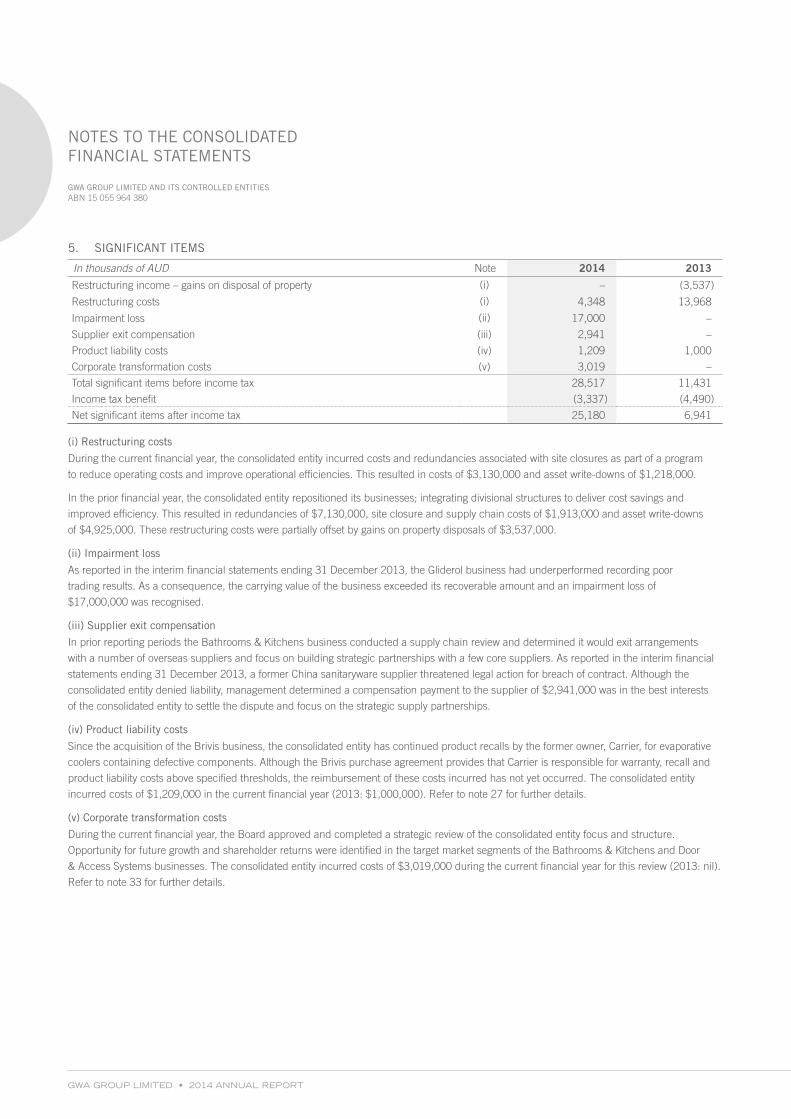
GWA GROUP LIMITED • 2014 ANNUAL REPORT
GWA GROUP LIMITED AND ITS CONTROLLED ENTITIES ABN 15 055 964 380
NOTES TO THE CONSOLIDATED FINANCIAL STATEMENTS
5. SIGNIFICANT ITEMS
In thousands of AUD Note 2014 2013
Restructuring income – gains on disposal of property (i) – (3,537)
Restructuring costs (i) 4,348 13,968
Impairment loss (ii) 17,000 –
Supplier exit compensation (iii) 2,941 –
Product liability costs (iv) 1,209 1,000
Corporate transformation costs (v) 3,019 –
Total significant items before income tax 28,517 11,431
Income tax benefit (3,337) (4,490)
Net significant items after income tax 25,180 6,941
(i) Restructuring costs
During the current financial year, the consolidated entity incurred costs and redundancies associated with site closures as part of a program
to reduce operating costs and improve operational efficiencies. This resulted in costs of $3,130,000 and asset write-downs of $1,218,000.
In the prior financial year, the consolidated entity repositioned its businesses; integrating divisional structures to deliver cost savings and
improved efficiency. This resulted in redundancies of $7,130,000, site closure and supply chain costs of $1,913,000 and asset write-downs
of $4,925,000. These restructuring costs were partially offset by gains on property disposals of $3,537,000.
(ii) Impairment loss
As reported in the interim financial statements ending 31 December 2013, the Gliderol business had underperformed recording poor
trading results. As a consequence, the carrying value of the business exceeded its recoverable amount and an impairment loss of
$17,000,000 was recognised.
(iii) Supplier exit compensation
In prior reporting periods the Bathrooms & Kitchens business conducted a supply chain review and determined it would exit arrangements
with a number of overseas suppliers and focus on building strategic partnerships with a few core suppliers. As reported in the interim financial
statements ending 31 December 2013, a former China sanitaryware supplier threatened legal action for breach of contract. Although the
consolidated entity denied liability, management determined a compensation payment to the supplier of $2,941,000 was in the best interests
of the consolidated entity to settle the dispute and focus on the strategic supply partnerships.
(iv) Product liability costs
Since the acquisition of the Brivis business, the consolidated entity has continued product recalls by the former owner, Carrier, for evaporative
coolers containing defective components. Although the Brivis purchase agreement provides that Carrier is responsible for warranty, recall and
product liability costs above specified thresholds, the reimbursement of these costs incurred has not yet occurred. The consolidated entity
incurred costs of $1,209,000 in the current financial year (2013: $1,000,000). Refer to note 27 for further details.
(v) Corporate transformation costs
During the current financial year, the Board approved and completed a strategic review of the consolidated entity focus and structure.
Opportunity for future growth and shareholder returns were identified in the target market segments of the Bathrooms & Kitchens and Door
& Access Systems businesses. The consolidated entity incurred costs of $3,019,000 during the current financial year for this review (2013: nil).
Refer to note 33 for further details.

59
GWA GROUP LIMITED AND ITS CONTROLLED ENTITIES ABN 15 055 964 380
NOTES TO THE CONSOLIDATED FINANCIAL STATEMENTS
6. PERSONNEL EXPENSES
In thousands of AUD 2014 2013
Wages and salaries – including superannuation contributions,
annual leave, long service leave and on-costs 144,197 148,892
Equity-settled share-based payment transactions 609 277
144,806 149,169
7. AUDITORS’ REMUNERATION
In AUD 2014 2013
Audit servicesAuditors of the Company
KPMG Australia:Audit and review of financial reports 455,000 466,000
Other regulatory services 3,500 3,500
Overseas KPMG Firms:Audit and review of financial reports 14,000 12,000
472,500 481,500
Other servicesAuditors of the Company
KPMG Australia:Taxation services 7,380 10,860
Overseas KPMG Firms:Taxation services 17,815 17,121
25,195 27,981
8. NET FINANCING COSTS
In thousands of AUD 2014 2013
Finance income
Interest income on call deposits 601 880
Unwinding of discount on loans and provisions – 455
Other 82 144
683 1,479
Finance expense
Interest expense on financial liabilities 5,172 7,119
Interest expense on swaps 1,727 1,892
Facility fees on financial liabilities 4,261 4,891
Establishment fee amortisation 720 854
Other 4 47
11,884 14,803
Net financing costs 11,201 13,324

GWA GROUP LIMITED • 2014 ANNUAL REPORT
GWA GROUP LIMITED AND ITS CONTROLLED ENTITIES ABN 15 055 964 380
NOTES TO THE CONSOLIDATED FINANCIAL STATEMENTS
9. INCOME TAX EXPENSE
Recognised in the statement of profit or loss and other comprehensive income
In thousands of AUD 2014 2013
Current tax expense
Current year 12,429 8,569
Adjustments for prior years (255) (560)
12,174 8,009
Deferred tax expense
Origination and reversal of temporary differences 1,852 1,616
Total income tax expense in statement of profit or loss and other comprehensive income 14,026 9,625
Numerical reconciliation between tax expense and pre-tax net profit
In thousands of AUD 2014 2013
Profit before tax 32,622 42,015
Income tax using the domestic tax rate of 30% (2013: 30%) 9,787 12,605
Increase in income tax expense due to:
Non-deductible expenses 97 170
Non-deductible impairment loss 5,100 –
Non-deductible acquisition and disposal costs – 55
Tax losses not recognised 88 25
Decrease in income tax expense due to:
Effect of tax rate in foreign jurisdictions (123) –
Capital gains offset with prior capital losses – (1,771)
Deductible share-based payments (17) (164)
Building depreciation allowance (16) (23)
Rebateable research and development (635) (712)
14,281 10,185
Over provided in prior years (255) (560)
Income tax expense on pre-tax net profit 14,026 9,625
Deferred tax recognised directly in equity
In thousands of AUD 2014 2013
Derivatives (694) 840
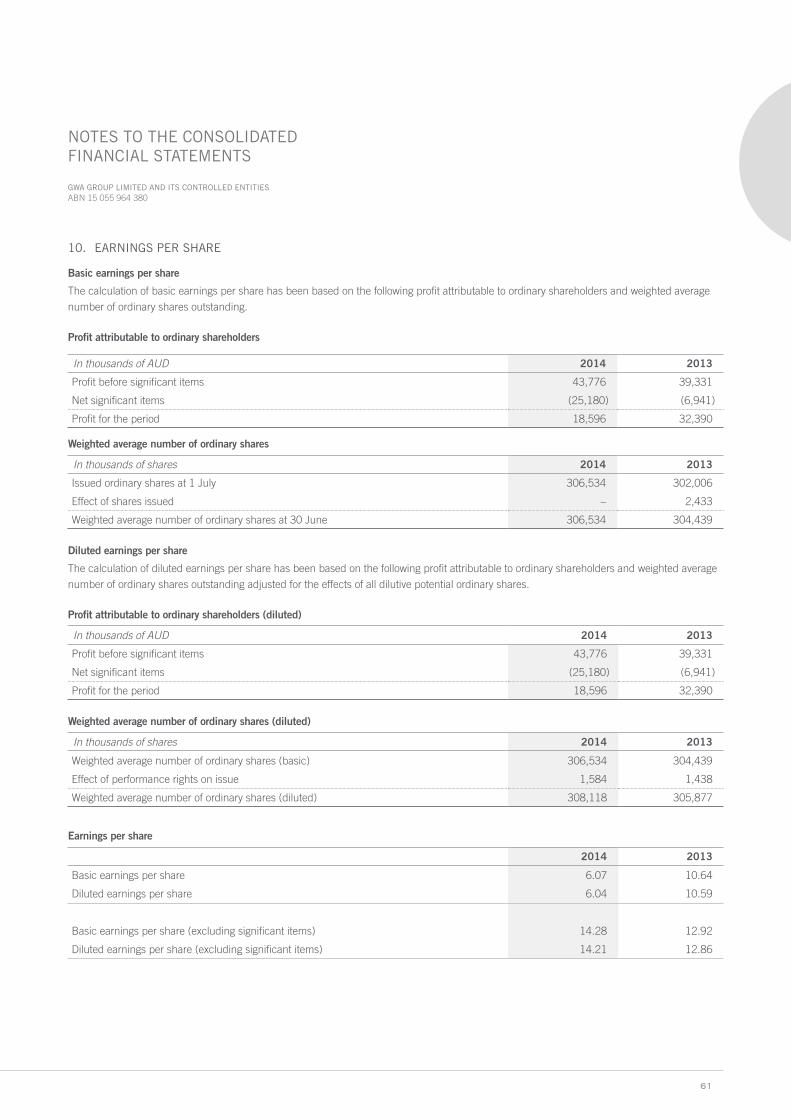
61
GWA GROUP LIMITED AND ITS CONTROLLED ENTITIES ABN 15 055 964 380
NOTES TO THE CONSOLIDATED FINANCIAL STATEMENTS
10. EARNINGS PER SHARE
Basic earnings per share
The calculation of basic earnings per share has been based on the following profit attributable to ordinary shareholders and weighted average
number of ordinary shares outstanding.
Profit attributable to ordinary shareholders
In thousands of AUD 2014 2013
Profit before significant items 43,776 39,331
Net significant items (25,180) (6,941)
Profit for the period 18,596 32,390
Weighted average number of ordinary shares
In thousands of shares 2014 2013
Issued ordinary shares at 1 July 306,534 302,006
Effect of shares issued – 2,433
Weighted average number of ordinary shares at 30 June 306,534 304,439
Diluted earnings per share
The calculation of diluted earnings per share has been based on the following profit attributable to ordinary shareholders and weighted average
number of ordinary shares outstanding adjusted for the effects of all dilutive potential ordinary shares.
Profit attributable to ordinary shareholders (diluted)
In thousands of AUD 2014 2013
Profit before significant items 43,776 39,331
Net significant items (25,180) (6,941)
Profit for the period 18,596 32,390
Weighted average number of ordinary shares (diluted)
In thousands of shares 2014 2013
Weighted average number of ordinary shares (basic) 306,534 304,439
Effect of performance rights on issue 1,584 1,438
Weighted average number of ordinary shares (diluted) 308,118 305,877
Earnings per share
2014 2013
Basic earnings per share 6.07 10.64
Diluted earnings per share 6.04 10.59
Basic earnings per share (excluding significant items) 14.28 12.92
Diluted earnings per share (excluding significant items) 14.21 12.86
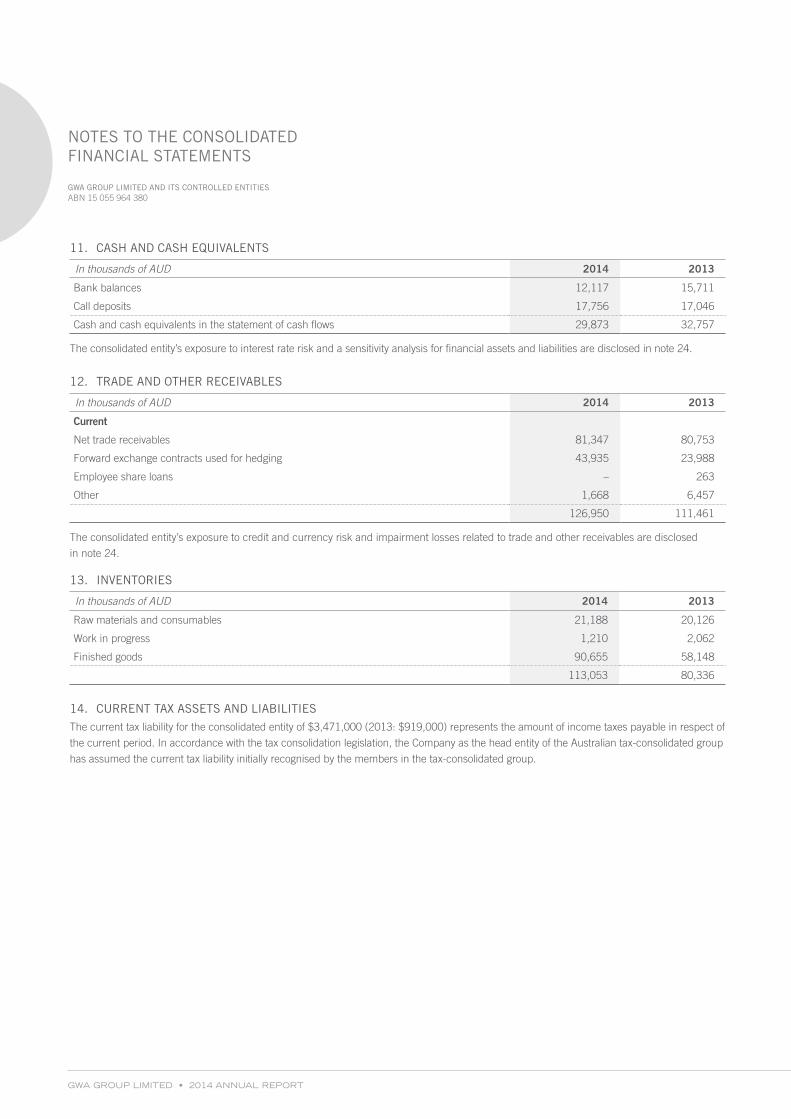
GWA GROUP LIMITED • 2014 ANNUAL REPORT
GWA GROUP LIMITED AND ITS CONTROLLED ENTITIES ABN 15 055 964 380
NOTES TO THE CONSOLIDATED FINANCIAL STATEMENTS
11. CASH AND CASH EQUIVALENTS
In thousands of AUD 2014 2013
Bank balances 12,117 15,711
Call deposits 17,756 17,046
Cash and cash equivalents in the statement of cash flows 29,873 32,757
The consolidated entity’s exposure to interest rate risk and a sensitivity analysis for financial assets and liabilities are disclosed in note 24.
12. TRADE AND OTHER RECEIVABLES
In thousands of AUD 2014 2013
Current
Net trade receivables 81,347 80,753
Forward exchange contracts used for hedging 43,935 23,988
Employee share loans – 263
Other 1,668 6,457
126,950 111,461
The consolidated entity’s exposure to credit and currency risk and impairment losses related to trade and other receivables are disclosed
in note 24.
13. INVENTORIES
In thousands of AUD 2014 2013
Raw materials and consumables 21,188 20,126
Work in progress 1,210 2,062
Finished goods 90,655 58,148
113,053 80,336
14. CURRENT TAX ASSETS AND LIABILITIES
The current tax liability for the consolidated entity of $3,471,000 (2013: $919,000) represents the amount of income taxes payable in respect of
the current period. In accordance with the tax consolidation legislation, the Company as the head entity of the Australian tax-consolidated group
has assumed the current tax liability initially recognised by the members in the tax-consolidated group.
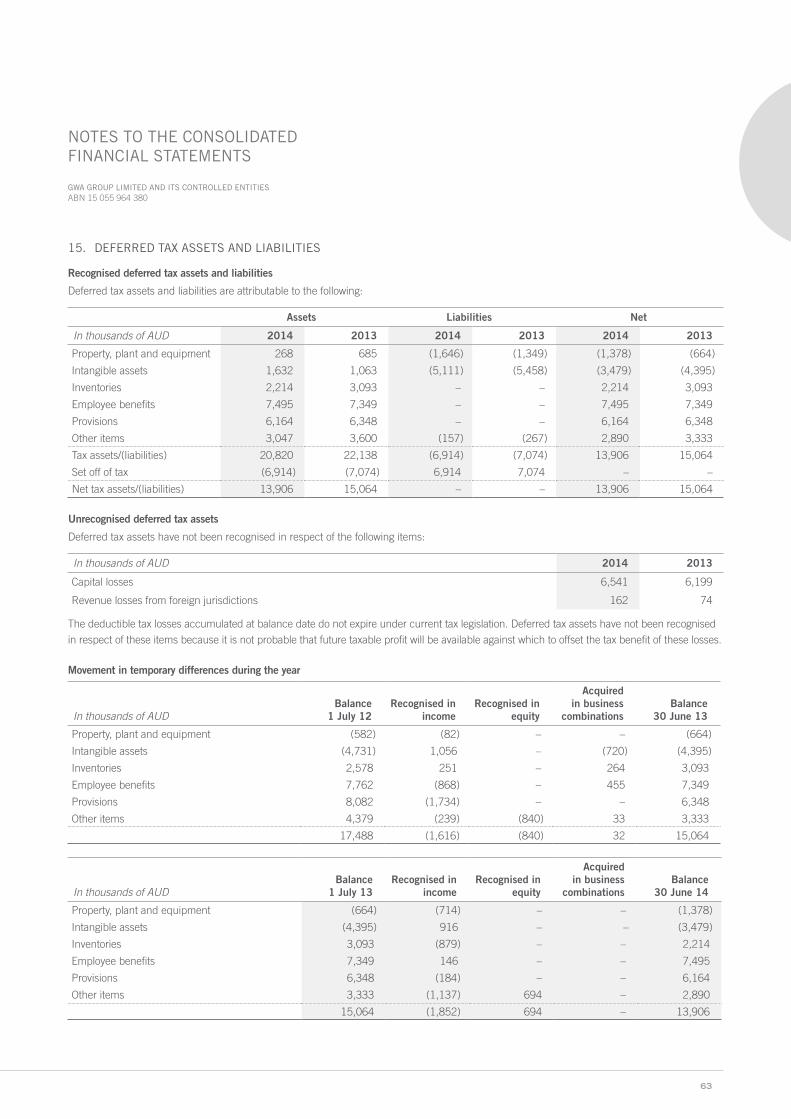
63
GWA GROUP LIMITED AND ITS CONTROLLED ENTITIES ABN 15 055 964 380
NOTES TO THE CONSOLIDATED FINANCIAL STATEMENTS
15. DEFERRED TAX ASSETS AND LIABILITIES
Recognised deferred tax assets and liabilities
Deferred tax assets and liabilities are attributable to the following:
Assets Liabilities Net
In thousands of AUD 2014 2013 2014 2013 2014 2013
Property, plant and equipment 268 685 (1,646) (1,349) (1,378) (664)
Intangible assets 1,632 1,063 (5,111) (5,458) (3,479) (4,395)
Inventories 2,214 3,093 – – 2,214 3,093
Employee benefits 7,495 7,349 – – 7,495 7,349
Provisions 6,164 6,348 – – 6,164 6,348
Other items 3,047 3,600 (157) (267) 2,890 3,333
Tax assets/(liabilities) 20,820 22,138 (6,914) (7,074) 13,906 15,064
Set off of tax (6,914) (7,074) 6,914 7,074 – –
Net tax assets/(liabilities) 13,906 15,064 – – 13,906 15,064
Unrecognised deferred tax assets
Deferred tax assets have not been recognised in respect of the following items:
In thousands of AUD 2014 2013
Capital losses 6,541 6,199
Revenue losses from foreign jurisdictions 162 74
The deductible tax losses accumulated at balance date do not expire under current tax legislation. Deferred tax assets have not been recognised
in respect of these items because it is not probable that future taxable profit will be available against which to offset the tax benefit of these losses.
Movement in temporary differences during the year
In thousands of AUDBalance
1 July 12Recognised in
incomeRecognised in
equity
Acquired in business
combinationsBalance
30 June 13
Property, plant and equipment (582) (82) – – (664)
Intangible assets (4,731) 1,056 – (720) (4,395)
Inventories 2,578 251 – 264 3,093
Employee benefits 7,762 (868) – 455 7,349
Provisions 8,082 (1,734) – – 6,348
Other items 4,379 (239) (840) 33 3,333
17,488 (1,616) (840) 32 15,064
In thousands of AUDBalance
1 July 13Recognised in
incomeRecognised in
equity
Acquired in business
combinationsBalance
30 June 14
Property, plant and equipment (664) (714) – – (1,378)
Intangible assets (4,395) 916 – – (3,479)
Inventories 3,093 (879) – – 2,214
Employee benefits 7,349 146 – – 7,495
Provisions 6,348 (184) – – 6,164
Other items 3,333 (1,137) 694 – 2,890
15,064 (1,852) 694 – 13,906
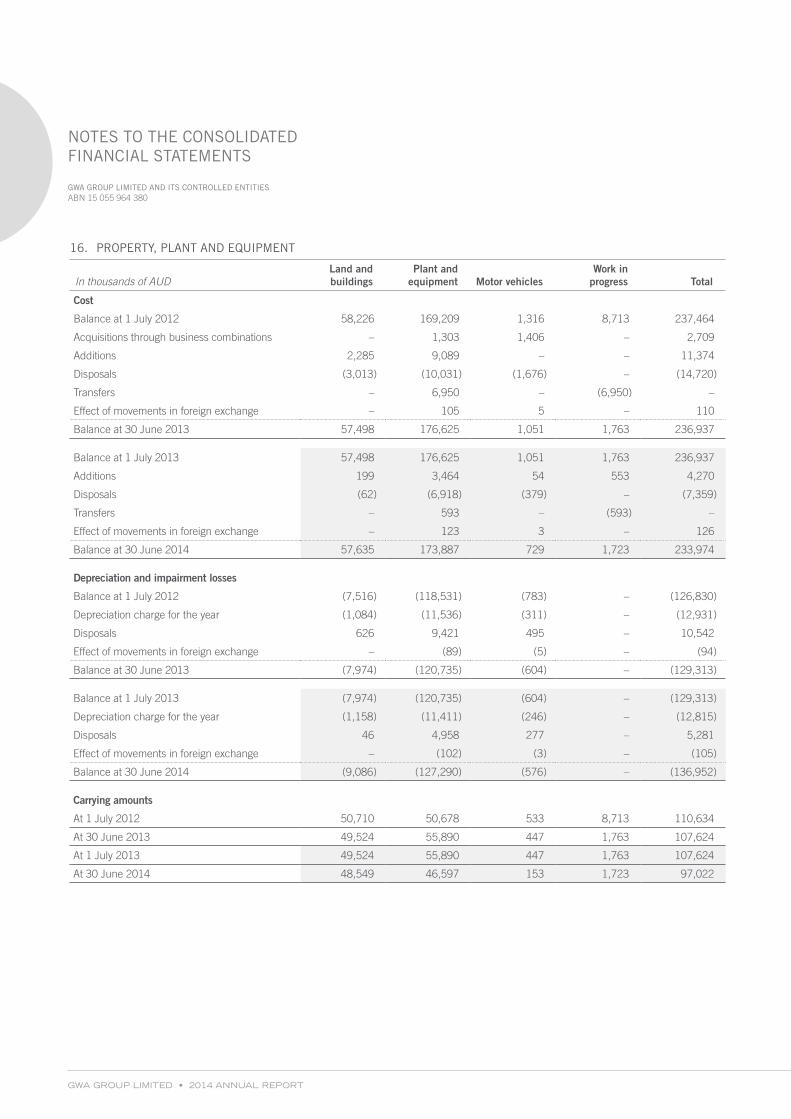
GWA GROUP LIMITED • 2014 ANNUAL REPORT
GWA GROUP LIMITED AND ITS CONTROLLED ENTITIES ABN 15 055 964 380
NOTES TO THE CONSOLIDATED FINANCIAL STATEMENTS
16. PROPERTY, PLANT AND EQUIPMENT
In thousands of AUDLand and buildings
Plant and equipment Motor vehicles
Work in progress Total
Cost
Balance at 1 July 2012 58,226 169,209 1,316 8,713 237,464
Acquisitions through business combinations – 1,303 1,406 – 2,709
Additions 2,285 9,089 – – 11,374
Disposals (3,013) (10,031) (1,676) – (14,720)
Transfers – 6,950 – (6,950) –
Effect of movements in foreign exchange – 105 5 – 110
Balance at 30 June 2013 57,498 176,625 1,051 1,763 236,937
Balance at 1 July 2013 57,498 176,625 1,051 1,763 236,937
Additions 199 3,464 54 553 4,270
Disposals (62) (6,918) (379) – (7,359)
Transfers – 593 – (593) –
Effect of movements in foreign exchange – 123 3 – 126
Balance at 30 June 2014 57,635 173,887 729 1,723 233,974
Depreciation and impairment losses
Balance at 1 July 2012 (7,516) (118,531) (783) – (126,830)
Depreciation charge for the year (1,084) (11,536) (311) – (12,931)
Disposals 626 9,421 495 – 10,542
Effect of movements in foreign exchange – (89) (5) – (94)
Balance at 30 June 2013 (7,974) (120,735) (604) – (129,313)
Balance at 1 July 2013 (7,974) (120,735) (604) – (129,313)
Depreciation charge for the year (1,158) (11,411) (246) – (12,815)
Disposals 46 4,958 277 – 5,281
Effect of movements in foreign exchange – (102) (3) – (105)
Balance at 30 June 2014 (9,086) (127,290) (576) – (136,952)
Carrying amounts
At 1 July 2012 50,710 50,678 533 8,713 110,634
At 30 June 2013 49,524 55,890 447 1,763 107,624
At 1 July 2013 49,524 55,890 447 1,763 107,624
At 30 June 2014 48,549 46,597 153 1,723 97,022

65
GWA GROUP LIMITED AND ITS CONTROLLED ENTITIES ABN 15 055 964 380
NOTES TO THE CONSOLIDATED FINANCIAL STATEMENTS
17. INTANGIBLE ASSETS
In thousands of AUD Software Brand names
Trade names, designs,
patents and customer
relationships Goodwill Total
Cost
Balance at 1 July 2012 29,373 308,717 21,547 46,358 405,995
Acquisitions through business combinations 53 – 2,400 4,556 7,009
Additions 3,329 – – – 3,329
Disposals (78) – – – (78)
Effect of movements in foreign exchange – 29 – – 29
Balance at 30 June 2013 32,677 308,746 23,947 50,914 416,284
Balance at 1 July 2013 32,677 308,746 23,947 50,914 416,284
Additions 896 – 404 – 1,300
Effect of movements in foreign exchange – 42 3 – 45
Balance at 30 June 2014 33,573 308,788 24,354 50,914 417,629
Amortisation
Balance at 1 July 2012 (16,988) – (2,812) – (19,800)
Amortisation for the year (6,113) – (1,354) – (7,467)
Disposals 77 – – – 77
Balance at 30 June 2013 (23,024) – (4,166) – (27,190)
Balance at 1 July 2013 (23,024) – (4,166) – (27,190)
Amortisation for the year (3,445) – (1,303) – (4,748)
Impairment losses – – – (17,000) (17,000)
Effect of movements in foreign exchange – – (1) – (1)
Balance at 30 June 2014 (26,469) – (5,470) (17,000) (48,939)
Carrying amounts
At 1 July 2012 12,385 308,717 18,735 46,358 386,195
At 30 June 2013 9,653 308,746 19,781 50,914 389,094
At 1 July 2013 9,653 308,746 19,781 50,914 389,094
At 30 June 2014 7,104 308,788 18,884 33,914 368,690

GWA GROUP LIMITED • 2014 ANNUAL REPORT
GWA GROUP LIMITED AND ITS CONTROLLED ENTITIES ABN 15 055 964 380
NOTES TO THE CONSOLIDATED FINANCIAL STATEMENTS
Carrying value of brand names and goodwill for each cash generating unit and segment
In thousands of AUD 2014 2013
CaromaDorf 284,188 284,146
Dux 6,000 6,000
Bathrooms & Kitchens 290,188 290,146
API Locksmiths 4,556 4,556
Gainsborough 20,049 20,049
Gliderol 7,075 24,075
Door & Access Systems 31,680 48,680
Heating & Cooling 20,834 20,834
342,702 359,660
Impairment testing for brand names and goodwill
The recoverable amounts of all brand names and goodwill were assessed at 30 June 2014 based on internal value in use calculations and
no impairment was identified for any cash generating units (2013: nil for all cash generating units).
Value in use was determined by discounting the future cash flows to be generated from the continuing use of the business unit and to which
the brand or goodwill is attached and was based on the following assumptions:
• Cash flows were projected based on actual operating results and business plans of the units approved by the Board, with projected cash
flows to five years before a terminal value was calculated. Maintainable earnings were adjusted for an allocation of corporate overheads.
• Management used a constant growth rate of 2.5% (2013: 2.5%) in calculating terminal values of the units, which does not exceed the
long-term average growth rate for the industry.
• Pre-tax discount rates between 14.3% – 14.9% were used (2013: 12.30%).
The key assumptions relate to dwelling completions, economic activity and market share. The values assigned to the key assumptions represent
management’s assessment of future trends in the Bathrooms & Kitchens, Door & Access Systems and Heating & Cooling industries and are
based on both external sources and internal sources (historical data). The recoverable amount of the cash generating units exceeds their
carrying values at 30 June 2014.
The recoverable amount of the Gliderol business exceeds its carrying value by $3,300,000, following a $17,000,000 impairment recorded at
31 December 2013. A reduction in forecast dwelling completions that reduce the forecast earnings before interest and tax (EBIT) by 13% would
reduce the recoverable amount of the Gliderol business to its carrying value. Management believe no other reasonably probable changes to the
key assumptions used in the calculations would cause the carrying amount to exceed the recoverable amount of the cash generating units.
The recoverable amount of the Dux business exceeds its carrying value by $2,800,000. A reduction in forecast dwelling completions that
reduce forecast EBIT by 7% would reduce the recoverable amount of the Dux business to its carrying value. Management believe no other
reasonably probable changes to the key assumptions used in the calculations would cause the carrying amount to exceed the recoverable
amount of the cash generating units.
17. INTANGIBLE ASSETS (CONTINUED)
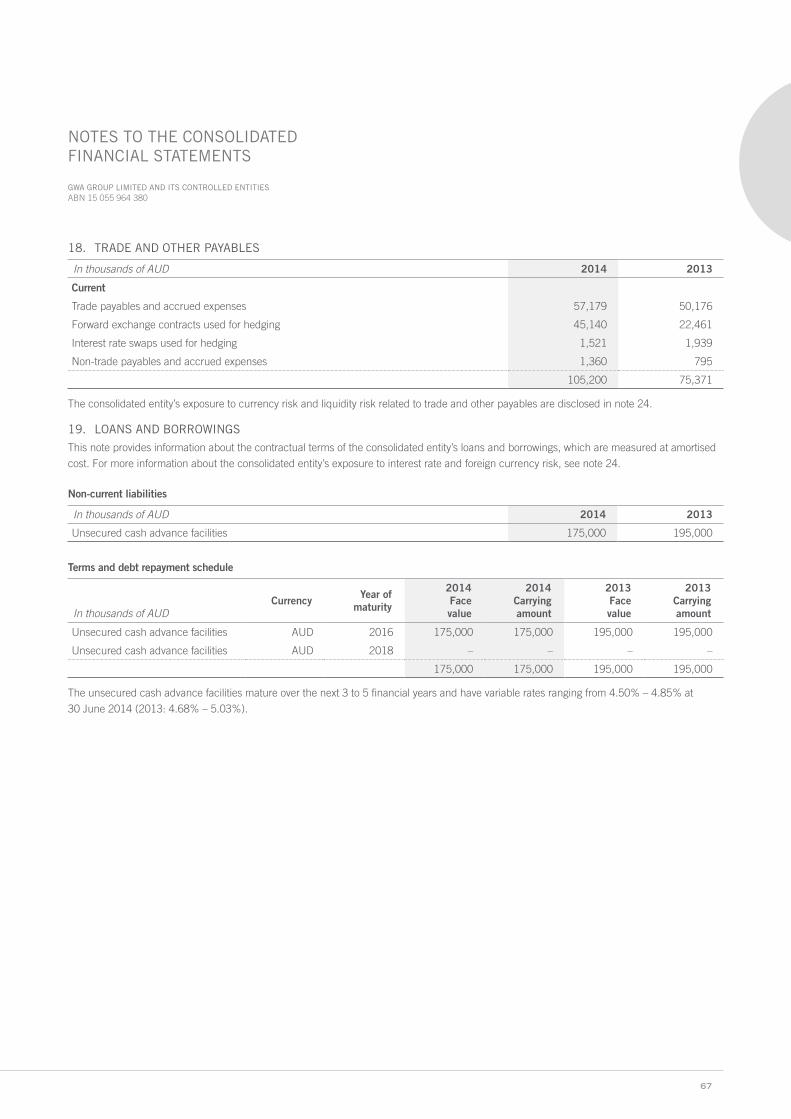
67
GWA GROUP LIMITED AND ITS CONTROLLED ENTITIES ABN 15 055 964 380
NOTES TO THE CONSOLIDATED FINANCIAL STATEMENTS
18. TRADE AND OTHER PAYABLES
In thousands of AUD 2014 2013
Current
Trade payables and accrued expenses 57,179 50,176
Forward exchange contracts used for hedging 45,140 22,461
Interest rate swaps used for hedging 1,521 1,939
Non-trade payables and accrued expenses 1,360 795
105,200 75,371
The consolidated entity’s exposure to currency risk and liquidity risk related to trade and other payables are disclosed in note 24.
19. LOANS AND BORROWINGS
This note provides information about the contractual terms of the consolidated entity’s loans and borrowings, which are measured at amortised
cost. For more information about the consolidated entity’s exposure to interest rate and foreign currency risk, see note 24.
Non-current liabilities
In thousands of AUD 2014 2013
Unsecured cash advance facilities 175,000 195,000
Terms and debt repayment schedule
In thousands of AUDCurrency Year of
maturity
2014 Face value
2014 Carrying amount
2013 Face value
2013 Carrying amount
Unsecured cash advance facilities AUD 2016 175,000 175,000 195,000 195,000
Unsecured cash advance facilities AUD 2018 – – – –
175,000 175,000 195,000 195,000
The unsecured cash advance facilities mature over the next 3 to 5 financial years and have variable rates ranging from 4.50% – 4.85% at
30 June 2014 (2013: 4.68% – 5.03%).
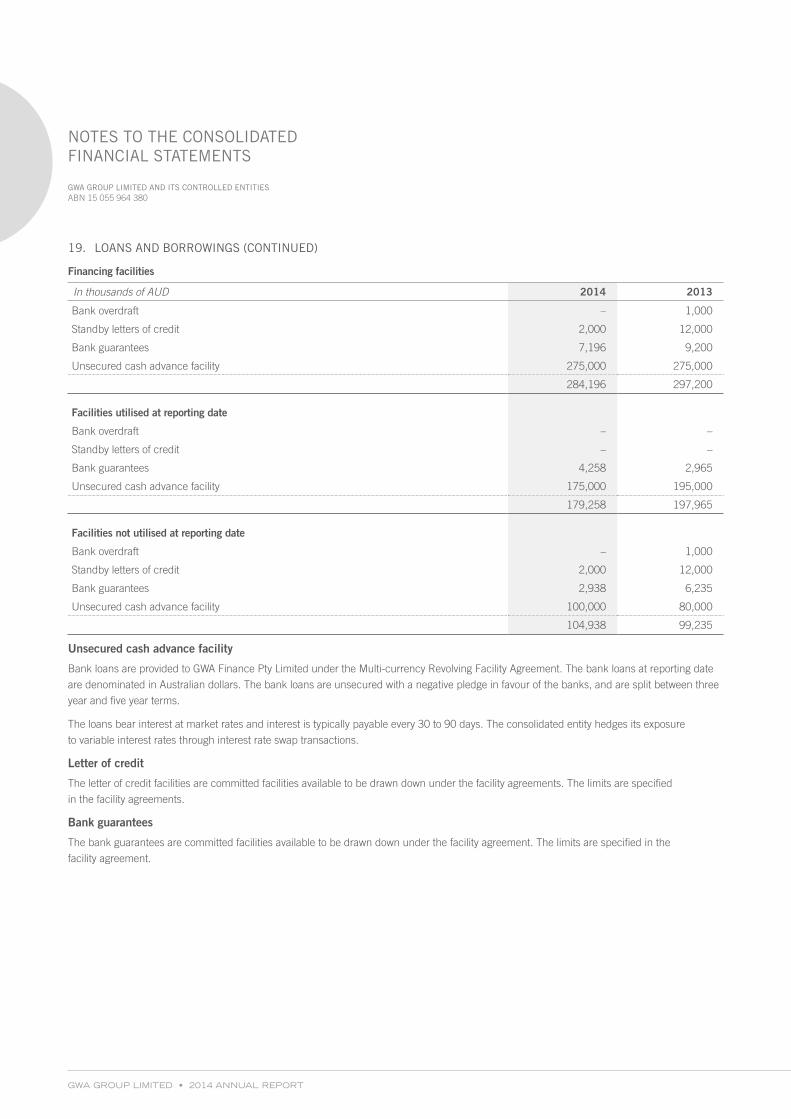
GWA GROUP LIMITED • 2014 ANNUAL REPORT
GWA GROUP LIMITED AND ITS CONTROLLED ENTITIES ABN 15 055 964 380
NOTES TO THE CONSOLIDATED FINANCIAL STATEMENTS
Financing facilities
In thousands of AUD 2014 2013
Bank overdraft – 1,000
Standby letters of credit 2,000 12,000
Bank guarantees 7,196 9,200
Unsecured cash advance facility 275,000 275,000
284,196 297,200
Facilities utilised at reporting date
Bank overdraft – –
Standby letters of credit – –
Bank guarantees 4,258 2,965
Unsecured cash advance facility 175,000 195,000
179,258 197,965
Facilities not utilised at reporting date
Bank overdraft – 1,000
Standby letters of credit 2,000 12,000
Bank guarantees 2,938 6,235
Unsecured cash advance facility 100,000 80,000
104,938 99,235
Unsecured cash advance facility
Bank loans are provided to GWA Finance Pty Limited under the Multi-currency Revolving Facility Agreement. The bank loans at reporting date
are denominated in Australian dollars. The bank loans are unsecured with a negative pledge in favour of the banks, and are split between three
year and five year terms.
The loans bear interest at market rates and interest is typically payable every 30 to 90 days. The consolidated entity hedges its exposure
to variable interest rates through interest rate swap transactions.
Letter of credit
The letter of credit facilities are committed facilities available to be drawn down under the facility agreements. The limits are specified
in the facility agreements.
Bank guarantees
The bank guarantees are committed facilities available to be drawn down under the facility agreement. The limits are specified in the
facility agreement.
19. LOANS AND BORROWINGS (CONTINUED)

69
GWA GROUP LIMITED AND ITS CONTROLLED ENTITIES ABN 15 055 964 380
NOTES TO THE CONSOLIDATED FINANCIAL STATEMENTS
20. EMPLOYEE BENEFITS
In thousands of AUD 2014 2013
Current
Liability for annual leave 9,374 9,588
Liability for long-service leave 2,374 2,224
11,748 11,812
Non-current
Liability for long-service leave 13,241 12,693
Defined contribution superannuation funds
The consolidated entity makes contributions to a defined contribution superannuation fund. Contributions are charged against income as they
are made based on various percentages of each employee’s gross salaries. The amount recognised as expense was $9,769,000 for the financial
year ended 30 June 2014 (2013: $9,723,000).

GWA GROUP LIMITED • 2014 ANNUAL REPORT
GWA GROUP LIMITED AND ITS CONTROLLED ENTITIES ABN 15 055 964 380
NOTES TO THE CONSOLIDATED FINANCIAL STATEMENTS
21. SHARE-BASED PAYMENTS
The Long Term Incentive (Equity) Plan was approved by shareholders at the 2008 Annual General Meeting. Under the plan, the Board may offer
performance rights to participants which entitle the holder to ordinary shares in the Company (or in limited cases cash payments made), subject
to meeting certain financial performance hurdles and the holder remaining in employment with the Company until the nominated vesting date.
The performance hurdles are subject to financial performance conditions which measure Total Shareholder Returns (TSR) compared to a
peer group of companies, and growth in Earnings Per Share (EPS). The performance hurdles are challenging but achievable and focus senior
executives on sustained long term growth consistent with shareholder wealth creation. The plan runs over a three year performance period
and the rights will only vest if the performance hurdles are achieved based on a 50% allocation of each grant to the two performance hurdles.
If the vesting conditions and performance hurdles are achieved, ordinary shares will be issued to the participants at no cost. If the performance
hurdles are not met, then the rights are cancelled after three years.
For performance rights granted to executives in the 2013/14 year, the performance hurdles and vesting proportions for the EPS performance
measure is outlined in the table below. The base year EPS for the 2014 Long Term Incentive (Equity) Plan grant was 12.7 cents.
Compound annual EPS Growth Proportion of Performance Rights to Vest if EPS growth hurdle is met
Less than 3% per annum 0%
3% per annum 25%
Between 3% and 8% per annum Straight line vesting between 25% and 50%
8% or higher per annum 50% (i.e. 50% of total grant)
For performance rights granted to executives in the 2013/14 year, the performance hurdles and vesting proportions for the TSR performance
measure are outlined in the table below.
TSR of GWA Group Limited relative to TSRs of Comparator Companies Proportion of Performance Rights to Vest if TSR hurdle is met
Less than the 50th percentile 0%
50th percentile 25%
Between the 50th percentile and 75th percentile Straight line vesting between 25% and 50%
75th percentile or higher 50% (i.e. 50% of total grant)
For further details of the Long Term Incentive (Equity) Plan, please refer to the Remuneration Report section of the Directors’ Report.
Tranche Grant date Expiry dateBalance at
beginning of the year
Granted during
the year
Cancelled during the
year
Vested during the
year
Forfeited during the
year
Balance at end of the
year
Number Number Number Number Number Number
2014
(i) 21/02/2011 30/06/2013 290,000 – – (290,000) – –
(ii) 17/02/2012 30/06/2014 585,000 – – – (292,500) 292,500
(iii) 25/02/2013 30/06/2015 972,000 – (80,000) – – 892,000
(iv) 24/02/2014 30/06/2016 – 540,000 – – – 540,000
1,847,000 540,000 (80,000) (290,000) (292,500) 1,724,500
2013
(i) 12/03/2010 30/06/2012 375,000 – – (375,000) – –
(ii) 21/02/2011 30/06/2013 680,000 – (100,000) – (290,000) 290,000
(iii) 17/02/2012 30/06/2014 780,000 – (195,000) – – 585,000
(iv) 25/02/2013 30/06/2015 – 972,000 – – – 972,000
1,835,000 972,000 (295,000) (375,000) (290,000) 1,847,000
No performance rights were vested and exercisable at 30 June 2014.
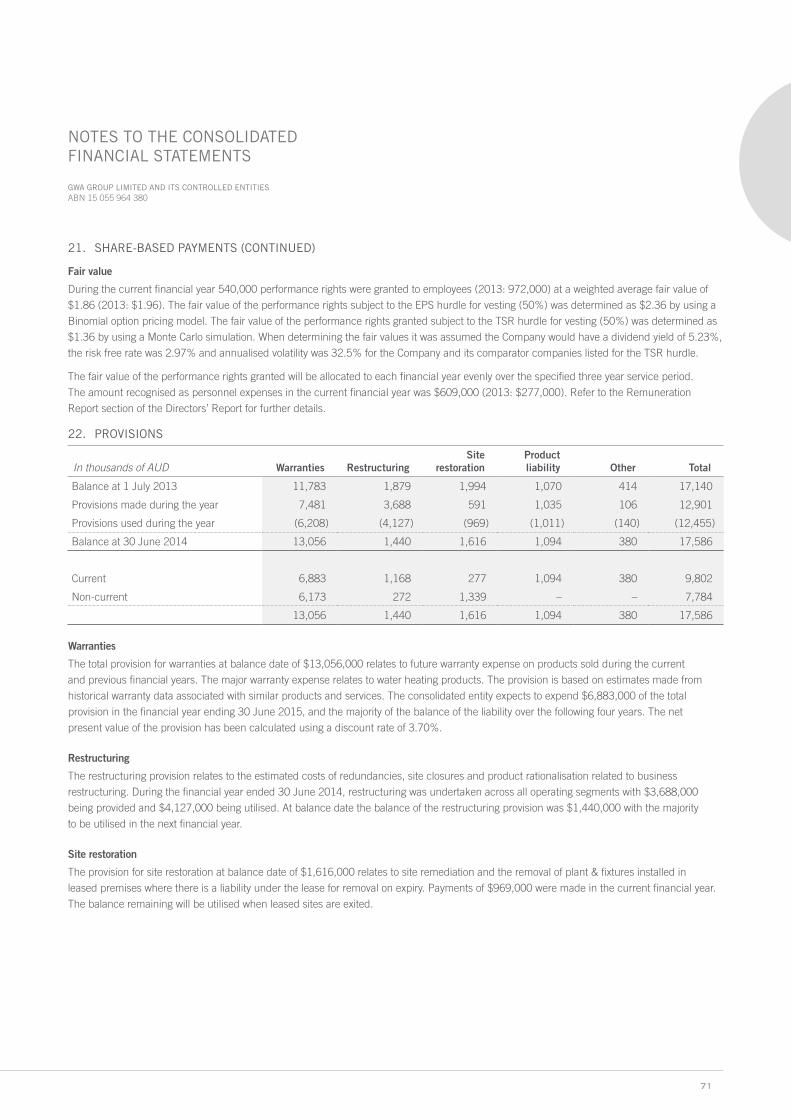
71
GWA GROUP LIMITED AND ITS CONTROLLED ENTITIES ABN 15 055 964 380
NOTES TO THE CONSOLIDATED FINANCIAL STATEMENTS
Fair value
During the current financial year 540,000 performance rights were granted to employees (2013: 972,000) at a weighted average fair value of
$1.86 (2013: $1.96). The fair value of the performance rights subject to the EPS hurdle for vesting (50%) was determined as $2.36 by using a
Binomial option pricing model. The fair value of the performance rights granted subject to the TSR hurdle for vesting (50%) was determined as
$1.36 by using a Monte Carlo simulation. When determining the fair values it was assumed the Company would have a dividend yield of 5.23%,
the risk free rate was 2.97% and annualised volatility was 32.5% for the Company and its comparator companies listed for the TSR hurdle.
The fair value of the performance rights granted will be allocated to each financial year evenly over the specified three year service period.
The amount recognised as personnel expenses in the current financial year was $609,000 (2013: $277,000). Refer to the Remuneration
Report section of the Directors’ Report for further details.
22. PROVISIONS
In thousands of AUD Warranties RestructuringSite
restorationProduct liability Other Total
Balance at 1 July 2013 11,783 1,879 1,994 1,070 414 17,140
Provisions made during the year 7,481 3,688 591 1,035 106 12,901
Provisions used during the year (6,208) (4,127) (969) (1,011) (140) (12,455)
Balance at 30 June 2014 13,056 1,440 1,616 1,094 380 17,586
Current 6,883 1,168 277 1,094 380 9,802
Non-current 6,173 272 1,339 – – 7,784
13,056 1,440 1,616 1,094 380 17,586
Warranties
The total provision for warranties at balance date of $13,056,000 relates to future warranty expense on products sold during the current
and previous financial years. The major warranty expense relates to water heating products. The provision is based on estimates made from
historical warranty data associated with similar products and services. The consolidated entity expects to expend $6,883,000 of the total
provision in the financial year ending 30 June 2015, and the majority of the balance of the liability over the following four years. The net
present value of the provision has been calculated using a discount rate of 3.70%.
Restructuring
The restructuring provision relates to the estimated costs of redundancies, site closures and product rationalisation related to business
restructuring. During the financial year ended 30 June 2014, restructuring was undertaken across all operating segments with $3,688,000
being provided and $4,127,000 being utilised. At balance date the balance of the restructuring provision was $1,440,000 with the majority
to be utilised in the next financial year.
Site restoration
The provision for site restoration at balance date of $1,616,000 relates to site remediation and the removal of plant & fixtures installed in
leased premises where there is a liability under the lease for removal on expiry. Payments of $969,000 were made in the current financial year.
The balance remaining will be utilised when leased sites are exited.
21. SHARE-BASED PAYMENTS (CONTINUED)
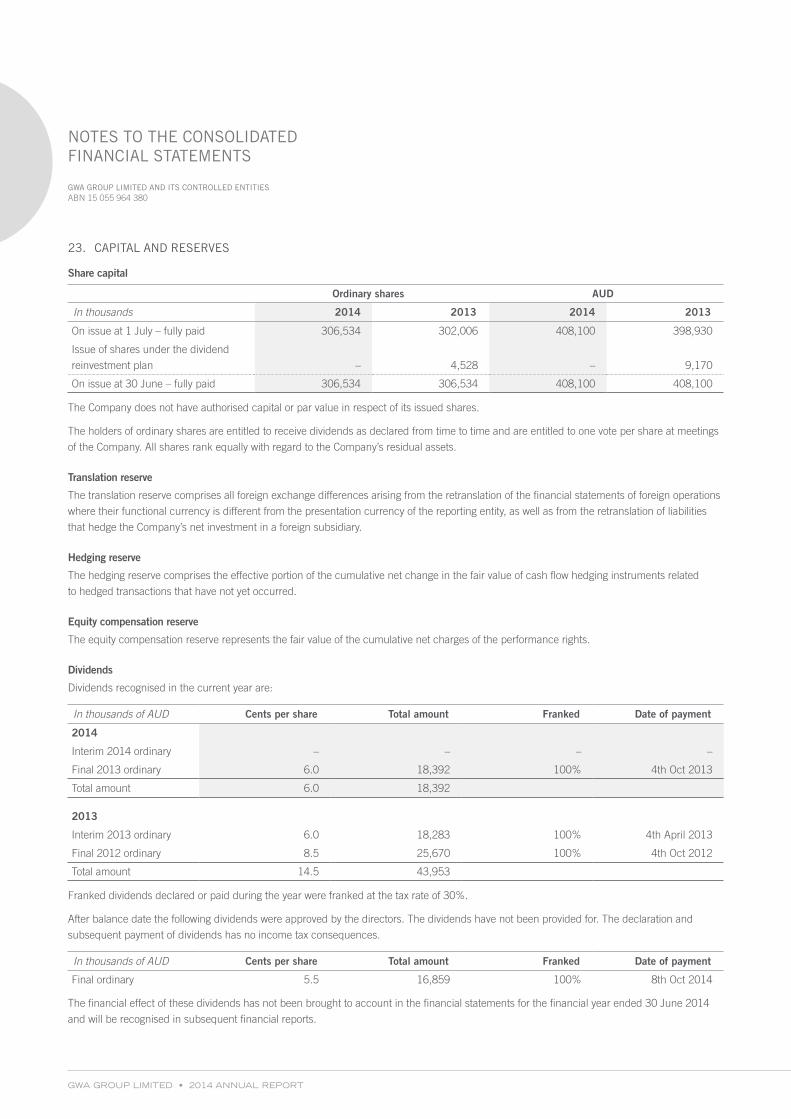
GWA GROUP LIMITED • 2014 ANNUAL REPORT
GWA GROUP LIMITED AND ITS CONTROLLED ENTITIES ABN 15 055 964 380
NOTES TO THE CONSOLIDATED FINANCIAL STATEMENTS
23. CAPITAL AND RESERVES
Share capital
Ordinary shares AUD
In thousands 2014 2013 2014 2013
On issue at 1 July – fully paid 306,534 302,006 408,100 398,930
Issue of shares under the dividend
reinvestment plan – 4,528 – 9,170
On issue at 30 June – fully paid 306,534 306,534 408,100 408,100
The Company does not have authorised capital or par value in respect of its issued shares.
The holders of ordinary shares are entitled to receive dividends as declared from time to time and are entitled to one vote per share at meetings
of the Company. All shares rank equally with regard to the Company’s residual assets.
Translation reserve
The translation reserve comprises all foreign exchange differences arising from the retranslation of the financial statements of foreign operations
where their functional currency is different from the presentation currency of the reporting entity, as well as from the retranslation of liabilities
that hedge the Company’s net investment in a foreign subsidiary.
Hedging reserve
The hedging reserve comprises the effective portion of the cumulative net change in the fair value of cash flow hedging instruments related
to hedged transactions that have not yet occurred.
Equity compensation reserve
The equity compensation reserve represents the fair value of the cumulative net charges of the performance rights.
Dividends
Dividends recognised in the current year are:
In thousands of AUD Cents per share Total amount Franked Date of payment
2014
Interim 2014 ordinary – – – –
Final 2013 ordinary 6.0 18,392 100% 4th Oct 2013
Total amount 6.0 18,392
2013
Interim 2013 ordinary 6.0 18,283 100% 4th April 2013
Final 2012 ordinary 8.5 25,670 100% 4th Oct 2012
Total amount 14.5 43,953
Franked dividends declared or paid during the year were franked at the tax rate of 30%.
After balance date the following dividends were approved by the directors. The dividends have not been provided for. The declaration and
subsequent payment of dividends has no income tax consequences.
In thousands of AUD Cents per share Total amount Franked Date of payment
Final ordinary 5.5 16,859 100% 8th Oct 2014
The financial effect of these dividends has not been brought to account in the financial statements for the financial year ended 30 June 2014
and will be recognised in subsequent financial reports.
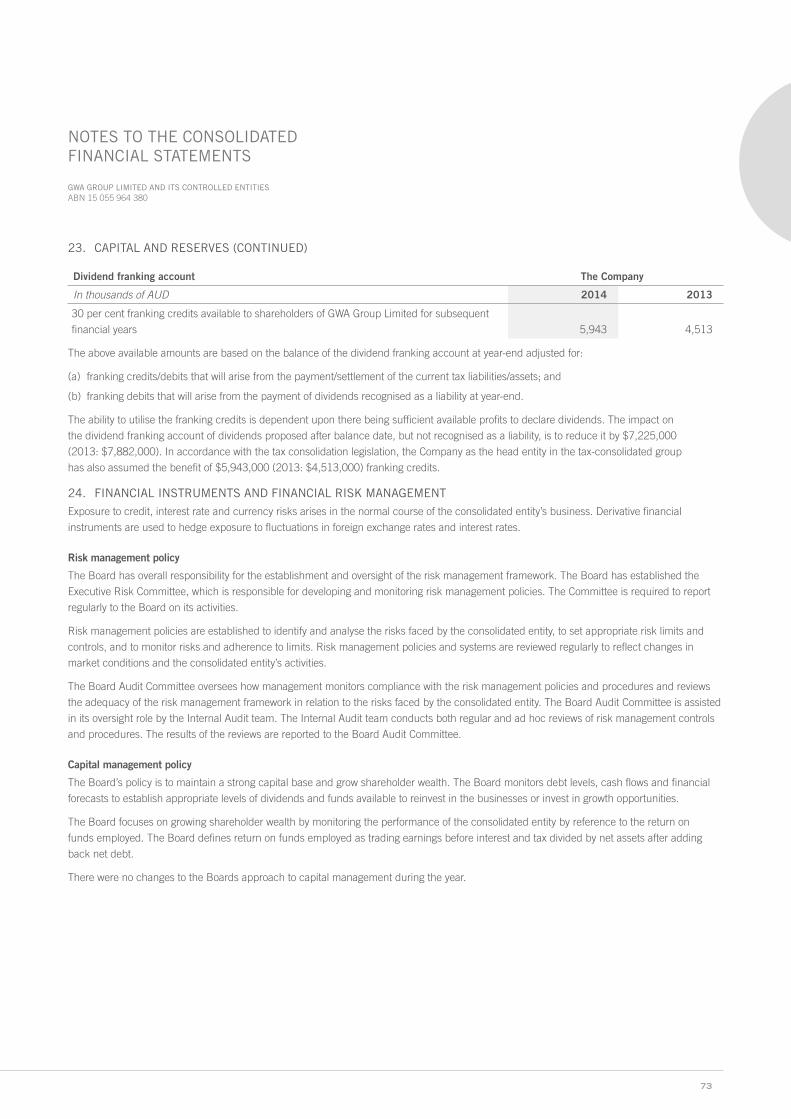
73
GWA GROUP LIMITED AND ITS CONTROLLED ENTITIES ABN 15 055 964 380
NOTES TO THE CONSOLIDATED FINANCIAL STATEMENTS
Dividend franking account The Company
In thousands of AUD 2014 2013
30 per cent franking credits available to shareholders of GWA Group Limited for subsequent
financial years 5,943 4,513
The above available amounts are based on the balance of the dividend franking account at year-end adjusted for:
(a) franking credits/debits that will arise from the payment/settlement of the current tax liabilities/assets; and
(b) franking debits that will arise from the payment of dividends recognised as a liability at year-end.
The ability to utilise the franking credits is dependent upon there being sufficient available profits to declare dividends. The impact on
the dividend franking account of dividends proposed after balance date, but not recognised as a liability, is to reduce it by $7,225,000
(2013: $7,882,000). In accordance with the tax consolidation legislation, the Company as the head entity in the tax-consolidated group
has also assumed the benefit of $5,943,000 (2013: $4,513,000) franking credits.
24. FINANCIAL INSTRUMENTS AND FINANCIAL RISK MANAGEMENT
Exposure to credit, interest rate and currency risks arises in the normal course of the consolidated entity’s business. Derivative financial
instruments are used to hedge exposure to fluctuations in foreign exchange rates and interest rates.
Risk management policy
The Board has overall responsibility for the establishment and oversight of the risk management framework. The Board has established the
Executive Risk Committee, which is responsible for developing and monitoring risk management policies. The Committee is required to report
regularly to the Board on its activities.
Risk management policies are established to identify and analyse the risks faced by the consolidated entity, to set appropriate risk limits and
controls, and to monitor risks and adherence to limits. Risk management policies and systems are reviewed regularly to reflect changes in
market conditions and the consolidated entity’s activities.
The Board Audit Committee oversees how management monitors compliance with the risk management policies and procedures and reviews
the adequacy of the risk management framework in relation to the risks faced by the consolidated entity. The Board Audit Committee is assisted
in its oversight role by the Internal Audit team. The Internal Audit team conducts both regular and ad hoc reviews of risk management controls
and procedures. The results of the reviews are reported to the Board Audit Committee.
Capital management policy
The Board’s policy is to maintain a strong capital base and grow shareholder wealth. The Board monitors debt levels, cash flows and financial
forecasts to establish appropriate levels of dividends and funds available to reinvest in the businesses or invest in growth opportunities.
The Board focuses on growing shareholder wealth by monitoring the performance of the consolidated entity by reference to the return on
funds employed. The Board defines return on funds employed as trading earnings before interest and tax divided by net assets after adding
back net debt.
There were no changes to the Boards approach to capital management during the year.
23. CAPITAL AND RESERVES (CONTINUED)

GWA GROUP LIMITED • 2014 ANNUAL REPORT
GWA GROUP LIMITED AND ITS CONTROLLED ENTITIES ABN 15 055 964 380
NOTES TO THE CONSOLIDATED FINANCIAL STATEMENTS
Credit risk
Credit risk is the risk of financial loss to the consolidated entity if a customer or other counterparty to a financial instrument fails to discharge
their obligations.
Management has a credit policy in place and the exposure to credit risk is monitored on an ongoing basis. A risk assessment process is used
for customers requiring credit and credit insurance is utilised for major concentrations of trade debts. Goods are sold subject to retention of title
clauses in most circumstances. The consolidated entity does not require collateral in respect of financial assets.
The consolidated entity maintains an allowance for impairment that represents its estimate of incurred losses in respect of trade receivables.
Transactions involving derivative financial instruments are with counterparties with sound credit ratings. Given their high credit ratings,
management does not expect any counterparty to fail to meet its obligations.
The consolidated entity has three major customers which comprise 44% of the trade receivables carrying amount at 30 June 2014
(2013: 40%). At balance date there were no material uninsured concentrations of credit risk.
The carrying amount of financial assets represents the maximum credit exposure of the consolidated entity. The maximum exposure
to credit risk at balance date was:
In thousands of AUD 2014 2013
Cash and cash equivalents 29,873 32,757
Net trade receivables 81,347 80,753
Other receivables 1,668 6,457
Employee share loans – 263
Forward exchange contracts used for hedging 43,935 23,988
156,823 144,218
The ageing of trade receivables for the consolidated entity at balance date is as follows:
In thousands of AUD2014
Receivable2014
Impairment2013
Receivable2013
Impairment
Not yet due 64,351 (100) 61,663 (70)
Past due 0-30 days 39,510 (86) 33,913 (40)
Past due 31-60 days 2,129 (20) 2,904 (4)
Past due 61-120 days 784 (51) 755 (80)
Past due 120+ days 1,632 (1,066) 2,458 (1,295)
Less accrued rebates and credit claims (25,736) – (19,451) –
82,670 (1,323) 82,242 (1,489)
There were no trade receivables with re-negotiated terms.
The movement in the allowance for impairment in respect of trade receivables during the year for the consolidated entity was as follows:
In thousands of AUD 2014 2013
Balance at 1 July (1,489) (1,666)
Impairment loss recognised (268) (610)
Impairment losses applied 436 949
Acquired through business combinations – (162)
Effect of movements in foreign exchange (2) –
Balance at 30 June (1,323) (1,489)
24. FINANCIAL INSTRUMENTS AND FINANCIAL RISK MANAGEMENT (CONTINUED)

75
GWA GROUP LIMITED AND ITS CONTROLLED ENTITIES ABN 15 055 964 380
NOTES TO THE CONSOLIDATED FINANCIAL STATEMENTS
Liquidity risk
Liquidity risk is the risk that the consolidated entity will not be able to meet its financial obligations as they fall due. The consolidated entity
prepares cash flow forecasts and maintains financing facilities with a number of institutions to ensure sufficient funds will be available to meet
obligations without incurring excessive costs. The cash flows of the consolidated entity are controlled by management and reported monthly to
the Board who is ultimately responsible for maintaining liquidity.
The contractual maturities of financial liabilities and derivatives that are cash flow hedges of the consolidated entity, including estimated
interest payments are as follows:
Maturity analysis
In thousands of AUDCarrying amount
Contractual cash flows
Less than 6 months
6–12 months
1–2 years
3–5 years
5+ years
2014
Non-derivative financial liabilities
Unsecured cash advance facilities (175,000) (193,292) (4,472) (4,472) (8,944) (175,404) –
Trade and other payables (58,539) (58,539) (58,491) (48) – – –
Derivative financial liabilities
Interest rate swaps designated
as hedges (1,521) (1,899) (509) (435) (646) (309) –
Forward exchange contracts
designated as hedges – outflow (45,140) (45,140) (45,140) – – – –
Forward exchange contracts
designated as hedges – inflow 43,935 43,935 43,935 – – – –
Total at 30 June 2014 (236,265) (254,935) (64,677) (4,955) (9,590) (175,713) –
2013
Non-derivative financial liabilities
Unsecured cash advance facilities (195,000) (226,906) (5,040) (5,040) (10,081) (206,745) –
Trade and other payables (50,176) (50,176) (50,176) – – – –
Derivative financial liabilities
Interest rate swaps designated
as hedges (1,939) (2,014) (770) (619) (448) (177) –
Forward exchange contracts
designated as hedges – outflow (22,461) (22,461) (22,461) – – – –
Forward exchange contracts
designated as hedges – inflow 23,988 23,988 23,988 – – – –
Total at 30 June 2013 (245,588) (277,569) (54,459) (5,659) (10,529) (206,922) –
The unsecured cash advance facilities are split between three year and five year terms. The periods in which the cash flows associated
with derivatives arise match the periods of profit and loss impact.
24. FINANCIAL INSTRUMENTS AND FINANCIAL RISK MANAGEMENT (CONTINUED)
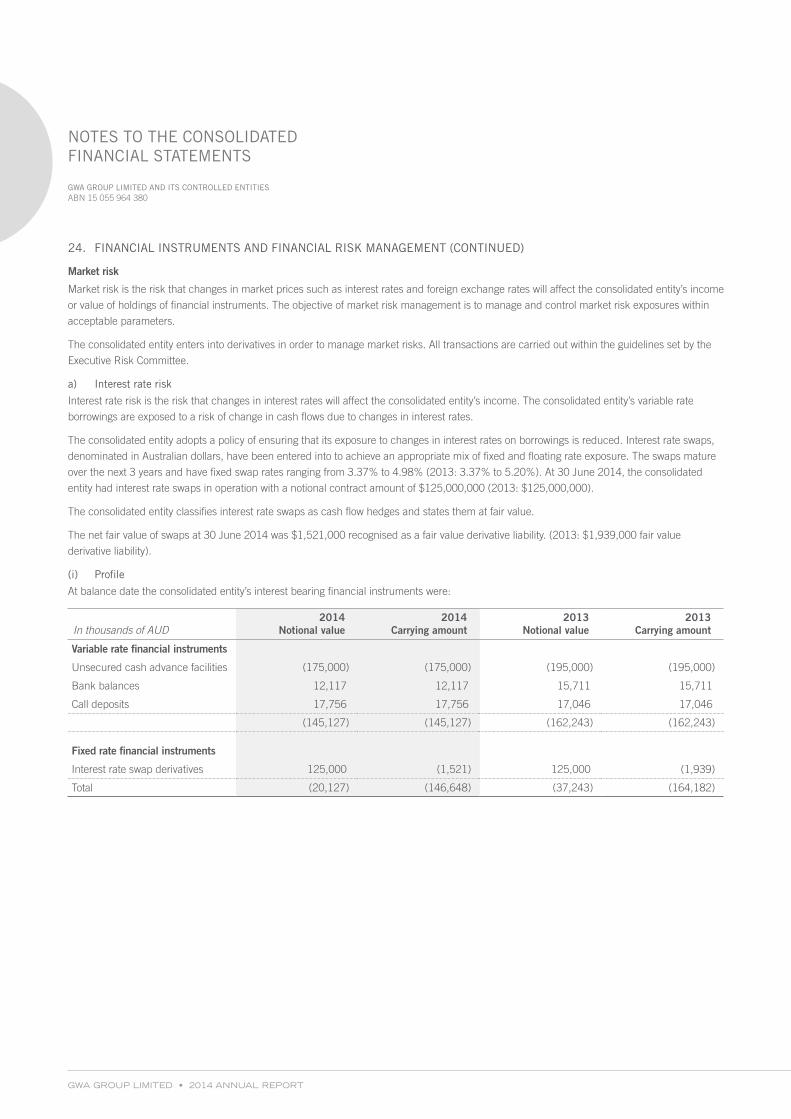
GWA GROUP LIMITED • 2014 ANNUAL REPORT
GWA GROUP LIMITED AND ITS CONTROLLED ENTITIES ABN 15 055 964 380
NOTES TO THE CONSOLIDATED FINANCIAL STATEMENTS
Market risk
Market risk is the risk that changes in market prices such as interest rates and foreign exchange rates will affect the consolidated entity’s income
or value of holdings of financial instruments. The objective of market risk management is to manage and control market risk exposures within
acceptable parameters.
The consolidated entity enters into derivatives in order to manage market risks. All transactions are carried out within the guidelines set by the
Executive Risk Committee.
a) Interest rate risk
Interest rate risk is the risk that changes in interest rates will affect the consolidated entity’s income. The consolidated entity’s variable rate
borrowings are exposed to a risk of change in cash flows due to changes in interest rates.
The consolidated entity adopts a policy of ensuring that its exposure to changes in interest rates on borrowings is reduced. Interest rate swaps,
denominated in Australian dollars, have been entered into to achieve an appropriate mix of fixed and floating rate exposure. The swaps mature
over the next 3 years and have fixed swap rates ranging from 3.37% to 4.98% (2013: 3.37% to 5.20%). At 30 June 2014, the consolidated
entity had interest rate swaps in operation with a notional contract amount of $125,000,000 (2013: $125,000,000).
The consolidated entity classifies interest rate swaps as cash flow hedges and states them at fair value.
The net fair value of swaps at 30 June 2014 was $1,521,000 recognised as a fair value derivative liability. (2013: $1,939,000 fair value
derivative liability).
(i) Profile
At balance date the consolidated entity’s interest bearing financial instruments were:
In thousands of AUD2014
Notional value2014
Carrying amount2013
Notional value2013
Carrying amount
Variable rate financial instruments
Unsecured cash advance facilities (175,000) (175,000) (195,000) (195,000)
Bank balances 12,117 12,117 15,711 15,711
Call deposits 17,756 17,756 17,046 17,046
(145,127) (145,127) (162,243) (162,243)
Fixed rate financial instruments
Interest rate swap derivatives 125,000 (1,521) 125,000 (1,939)
Total (20,127) (146,648) (37,243) (164,182)
24. FINANCIAL INSTRUMENTS AND FINANCIAL RISK MANAGEMENT (CONTINUED)

77
GWA GROUP LIMITED AND ITS CONTROLLED ENTITIES ABN 15 055 964 380
NOTES TO THE CONSOLIDATED FINANCIAL STATEMENTS
(ii) Fair value sensitivity analysis for fixed rate instruments
The consolidated entity does not account for fixed rate financial assets and liabilities at fair value through profit or loss. Therefore a change
in interest rates at the reporting date would not affect profit or loss.
A change of 100 basis points in interest rates at balance date would have affected the consolidated entity’s equity and financial assets
and liabilities as follows:
In thousands of AUD 2014 2013
Increase of 100 basis points
Hedging reserve (increase)/decrease (2,484) (2,135)
Financial assets increase/(decrease) 963 196
Financial liabilities (increase)/decrease 1,521 1,939
– –
Decrease of 100 basis points
Hedging reserve (increase)/decrease 2,334 2,181
Financial assets increase/(decrease) – –
Financial liabilities (increase)/decrease (2,334) (2,181)
– –
(iii) Cash flow sensitivity analysis for fixed and variable rate instruments
A change of 100 basis points in interest rates during the period would have affected the consolidated entity’s profit or loss as follows:
In thousands of AUD 2014 2013
Increase of 100 basis points
Unsecured cash advance facilities (AUD) (2,000) (2,259)
Bank balances 34 157
Interest rate swap derivatives 1,369 1,388
Call deposits variable rate 227 266
Call deposits fixed rate – 39
(370) (409)
Decrease of 100 basis points
Unsecured cash advance facilities (AUD) 2,000 2,259
Bank balances (34) (157)
Interest rate swap derivatives (1,369) (1,388)
Call deposits variable rate (227) (266)
Call deposits fixed rate – (39)
370 409
24. FINANCIAL INSTRUMENTS AND FINANCIAL RISK MANAGEMENT (CONTINUED)
Market risk (continued)
a) Interest rate risk (continued)
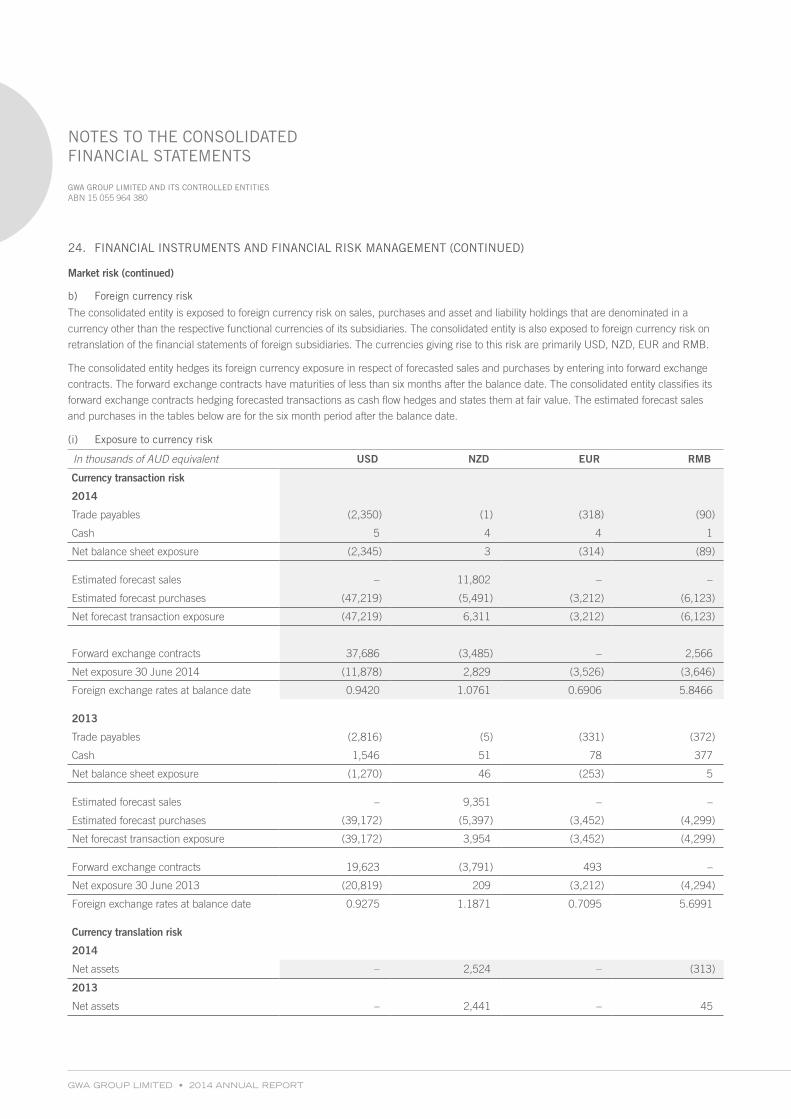
GWA GROUP LIMITED • 2014 ANNUAL REPORT
GWA GROUP LIMITED AND ITS CONTROLLED ENTITIES ABN 15 055 964 380
NOTES TO THE CONSOLIDATED FINANCIAL STATEMENTS
b) Foreign currency risk
The consolidated entity is exposed to foreign currency risk on sales, purchases and asset and liability holdings that are denominated in a
currency other than the respective functional currencies of its subsidiaries. The consolidated entity is also exposed to foreign currency risk on
retranslation of the financial statements of foreign subsidiaries. The currencies giving rise to this risk are primarily USD, NZD, EUR and RMB.
The consolidated entity hedges its foreign currency exposure in respect of forecasted sales and purchases by entering into forward exchange
contracts. The forward exchange contracts have maturities of less than six months after the balance date. The consolidated entity classifies its
forward exchange contracts hedging forecasted transactions as cash flow hedges and states them at fair value. The estimated forecast sales
and purchases in the tables below are for the six month period after the balance date.
(i) Exposure to currency risk
In thousands of AUD equivalent USD NZD EUR RMB
Currency transaction risk
2014
Trade payables (2,350) (1) (318) (90)
Cash 5 4 4 1
Net balance sheet exposure (2,345) 3 (314) (89)
Estimated forecast sales – 11,802 – –
Estimated forecast purchases (47,219) (5,491) (3,212) (6,123)
Net forecast transaction exposure (47,219) 6,311 (3,212) (6,123)
Forward exchange contracts 37,686 (3,485) – 2,566
Net exposure 30 June 2014 (11,878) 2,829 (3,526) (3,646)
Foreign exchange rates at balance date 0.9420 1.0761 0.6906 5.8466
2013
Trade payables (2,816) (5) (331) (372)
Cash 1,546 51 78 377
Net balance sheet exposure (1,270) 46 (253) 5
Estimated forecast sales – 9,351 – –
Estimated forecast purchases (39,172) (5,397) (3,452) (4,299)
Net forecast transaction exposure (39,172) 3,954 (3,452) (4,299)
Forward exchange contracts 19,623 (3,791) 493 –
Net exposure 30 June 2013 (20,819) 209 (3,212) (4,294)
Foreign exchange rates at balance date 0.9275 1.1871 0.7095 5.6991
Currency translation risk
2014
Net assets – 2,524 – (313)
2013
Net assets – 2,441 – 45
24. FINANCIAL INSTRUMENTS AND FINANCIAL RISK MANAGEMENT (CONTINUED)
Market risk (continued)
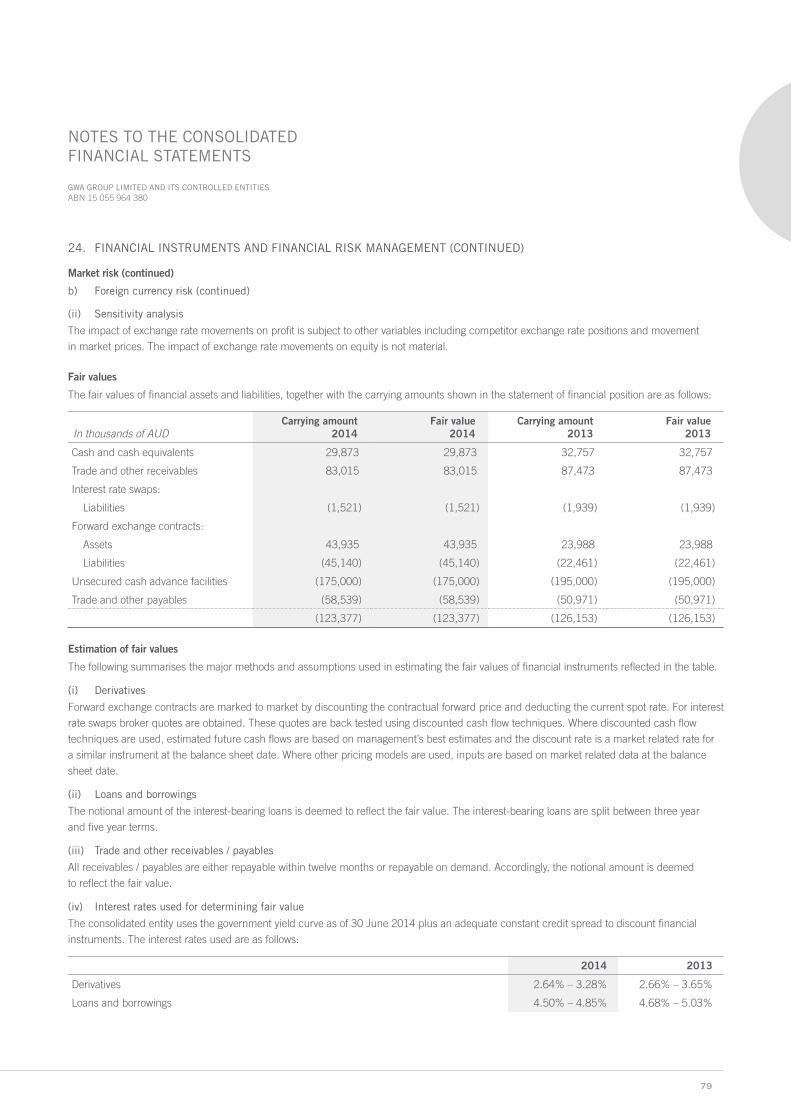
79
GWA GROUP LIMITED AND ITS CONTROLLED ENTITIES ABN 15 055 964 380
NOTES TO THE CONSOLIDATED FINANCIAL STATEMENTS
(ii) Sensitivity analysis
The impact of exchange rate movements on profit is subject to other variables including competitor exchange rate positions and movement
in market prices. The impact of exchange rate movements on equity is not material.
Fair values
The fair values of financial assets and liabilities, together with the carrying amounts shown in the statement of financial position are as follows:
In thousands of AUDCarrying amount
2014Fair value
2014Carrying amount
2013Fair value
2013
Cash and cash equivalents 29,873 29,873 32,757 32,757
Trade and other receivables 83,015 83,015 87,473 87,473
Interest rate swaps:
Liabilities (1,521) (1,521) (1,939) (1,939)
Forward exchange contracts:
Assets 43,935 43,935 23,988 23,988
Liabilities (45,140) (45,140) (22,461) (22,461)
Unsecured cash advance facilities (175,000) (175,000) (195,000) (195,000)
Trade and other payables (58,539) (58,539) (50,971) (50,971)
(123,377) (123,377) (126,153) (126,153)
Estimation of fair values
The following summarises the major methods and assumptions used in estimating the fair values of financial instruments reflected in the table.
(i) Derivatives
Forward exchange contracts are marked to market by discounting the contractual forward price and deducting the current spot rate. For interest
rate swaps broker quotes are obtained. These quotes are back tested using discounted cash flow techniques. Where discounted cash flow
techniques are used, estimated future cash flows are based on management’s best estimates and the discount rate is a market related rate for
a similar instrument at the balance sheet date. Where other pricing models are used, inputs are based on market related data at the balance
sheet date.
(ii) Loans and borrowings
The notional amount of the interest-bearing loans is deemed to reflect the fair value. The interest-bearing loans are split between three year
and five year terms.
(iii) Trade and other receivables / payables
All receivables / payables are either repayable within twelve months or repayable on demand. Accordingly, the notional amount is deemed
to reflect the fair value.
(iv) Interest rates used for determining fair value
The consolidated entity uses the government yield curve as of 30 June 2014 plus an adequate constant credit spread to discount financial
instruments. The interest rates used are as follows:
2014 2013
Derivatives 2.64% – 3.28% 2.66% – 3.65%
Loans and borrowings 4.50% – 4.85% 4.68% – 5.03%
24. FINANCIAL INSTRUMENTS AND FINANCIAL RISK MANAGEMENT (CONTINUED)
Market risk (continued)
b) Foreign currency risk (continued)

GWA GROUP LIMITED • 2014 ANNUAL REPORT
GWA GROUP LIMITED AND ITS CONTROLLED ENTITIES ABN 15 055 964 380
NOTES TO THE CONSOLIDATED FINANCIAL STATEMENTS
(v) Fair value hierarchy
The consolidated entity recognises the fair value of its financial instruments using the level 2 valuation method. The different levels have
been defined as follows:
• Level 1: quoted prices (unadjusted) in active markets for identical assets or liabilities
• Level 2: inputs other than quoted prices included within Level 1 that are observable for the asset or liability, either directly (i.e. as prices)
or indirectly (i.e. derived from prices)
• Level 3: inputs for the asset or liability that are not based on observable market data (unobservable inputs)
In thousands of AUD Level 1 Level 2 Level 3 Total
30 June 2014
Forward exchange contracts used for hedging – 43,935 – 43,935
Interest rate swaps used for hedging – – – –
– 43,935 – 43,935
Forward exchange contracts used for hedging – (45,140) – (45,140)
Interest rate swaps used for hedging – (1,521) – (1,521)
– (46,661) – (46,661)
30 June 2013
Forward exchange contracts used for hedging – 23,988 – 23,988
Interest rate swaps used for hedging – – – –
– 23,988 – 23,988
Forward exchange contracts used for hedging – (22,461) – (22,461)
Interest rate swaps used for hedging – (1,939) – (1,939)
– (24,400) – (24,400)
25. OPERATING LEASES
Leases as lessee
Non-cancellable operating lease rentals are payable as follows:
In thousands of AUD 2014 2013
Less than one year 13,374 13,017
Between one and five years 23,255 28,678
More than five years 1,029 3,132
37,658 44,827
The consolidated entity leases warehouse, factory and office facilities and motor vehicles under operating leases. These leases typically run
for a period of 2 to 8 years, with an option to renew the lease after that date. None of the leases include contingent rentals.
During the financial year ended 30 June 2014, $15,347,000 (2013: $16,576,000) was recognised as an expense in profit or loss in respect
of operating leases.
24. FINANCIAL INSTRUMENTS AND FINANCIAL RISK MANAGEMENT (CONTINUED)
Estimation of fair values (continued)
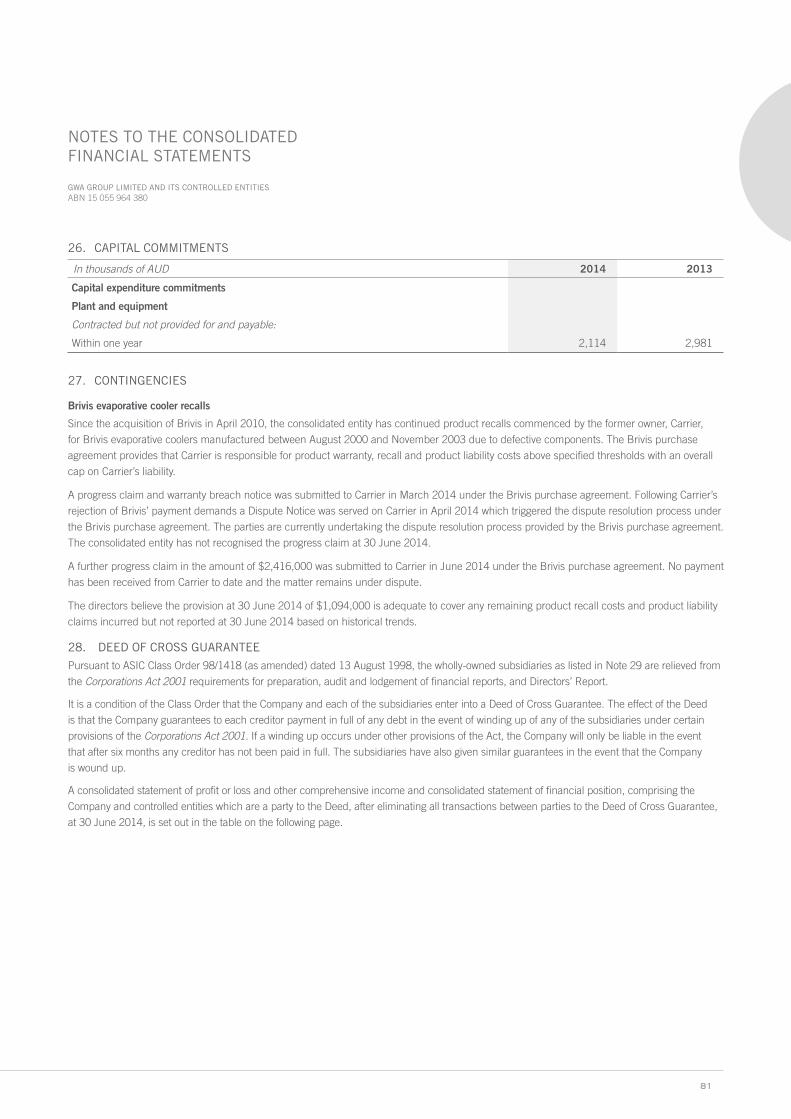
81
GWA GROUP LIMITED AND ITS CONTROLLED ENTITIES ABN 15 055 964 380
NOTES TO THE CONSOLIDATED FINANCIAL STATEMENTS
26. CAPITAL COMMITMENTS
In thousands of AUD 2014 2013
Capital expenditure commitments
Plant and equipment
Contracted but not provided for and payable:
Within one year 2,114 2,981
27. CONTINGENCIES
Brivis evaporative cooler recalls
Since the acquisition of Brivis in April 2010, the consolidated entity has continued product recalls commenced by the former owner, Carrier,
for Brivis evaporative coolers manufactured between August 2000 and November 2003 due to defective components. The Brivis purchase
agreement provides that Carrier is responsible for product warranty, recall and product liability costs above specified thresholds with an overall
cap on Carrier’s liability.
A progress claim and warranty breach notice was submitted to Carrier in March 2014 under the Brivis purchase agreement. Following Carrier’s
rejection of Brivis’ payment demands a Dispute Notice was served on Carrier in April 2014 which triggered the dispute resolution process under
the Brivis purchase agreement. The parties are currently undertaking the dispute resolution process provided by the Brivis purchase agreement.
The consolidated entity has not recognised the progress claim at 30 June 2014.
A further progress claim in the amount of $2,416,000 was submitted to Carrier in June 2014 under the Brivis purchase agreement. No payment
has been received from Carrier to date and the matter remains under dispute.
The directors believe the provision at 30 June 2014 of $1,094,000 is adequate to cover any remaining product recall costs and product liability
claims incurred but not reported at 30 June 2014 based on historical trends.
28. DEED OF CROSS GUARANTEE
Pursuant to ASIC Class Order 98/1418 (as amended) dated 13 August 1998, the wholly-owned subsidiaries as listed in Note 29 are relieved from
the Corporations Act 2001 requirements for preparation, audit and lodgement of financial reports, and Directors’ Report.
It is a condition of the Class Order that the Company and each of the subsidiaries enter into a Deed of Cross Guarantee. The effect of the Deed
is that the Company guarantees to each creditor payment in full of any debt in the event of winding up of any of the subsidiaries under certain
provisions of the Corporations Act 2001. If a winding up occurs under other provisions of the Act, the Company will only be liable in the event
that after six months any creditor has not been paid in full. The subsidiaries have also given similar guarantees in the event that the Company
is wound up.
A consolidated statement of profit or loss and other comprehensive income and consolidated statement of financial position, comprising the
Company and controlled entities which are a party to the Deed, after eliminating all transactions between parties to the Deed of Cross Guarantee,
at 30 June 2014, is set out in the table on the following page.
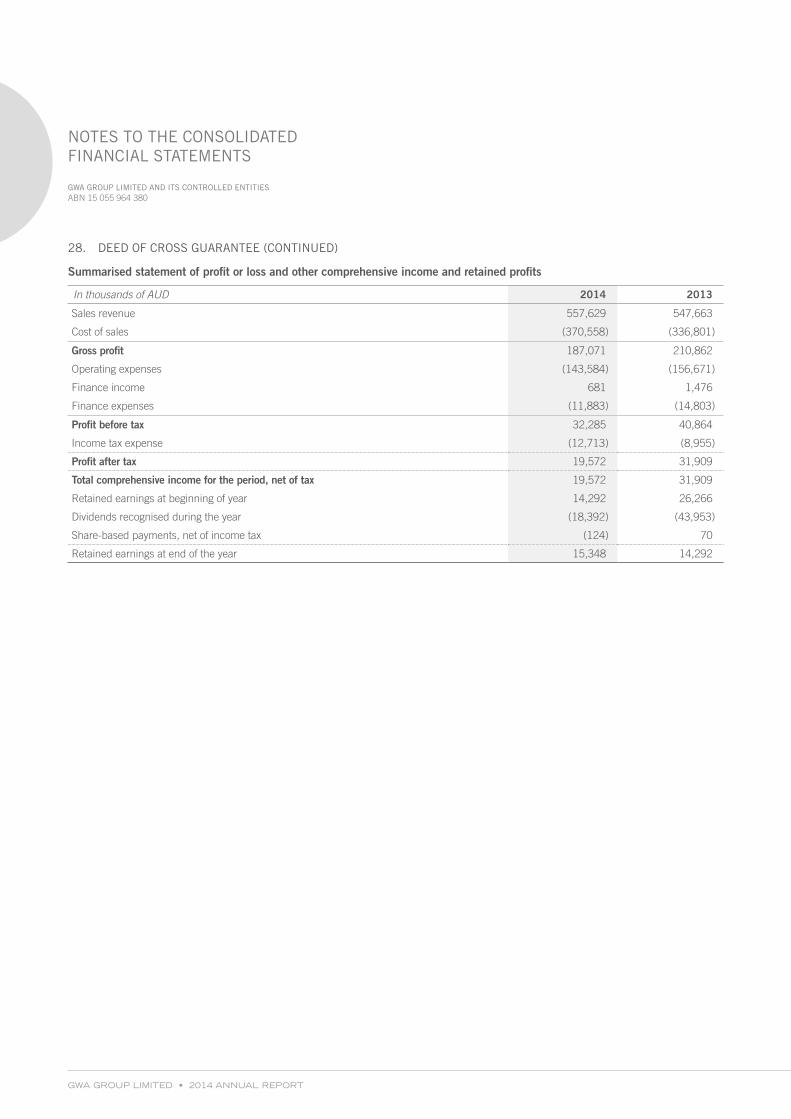
GWA GROUP LIMITED • 2014 ANNUAL REPORT
GWA GROUP LIMITED AND ITS CONTROLLED ENTITIES ABN 15 055 964 380
NOTES TO THE CONSOLIDATED FINANCIAL STATEMENTS
Summarised statement of profit or loss and other comprehensive income and retained profits
In thousands of AUD 2014 2013
Sales revenue 557,629 547,663
Cost of sales (370,558) (336,801)
Gross profit 187,071 210,862
Operating expenses (143,584) (156,671)
Finance income 681 1,476
Finance expenses (11,883) (14,803)
Profit before tax 32,285 40,864
Income tax expense (12,713) (8,955)
Profit after tax 19,572 31,909
Total comprehensive income for the period, net of tax 19,572 31,909
Retained earnings at beginning of year 14,292 26,266
Dividends recognised during the year (18,392) (43,953)
Share-based payments, net of income tax (124) 70
Retained earnings at end of the year 15,348 14,292
28. DEED OF CROSS GUARANTEE (CONTINUED)
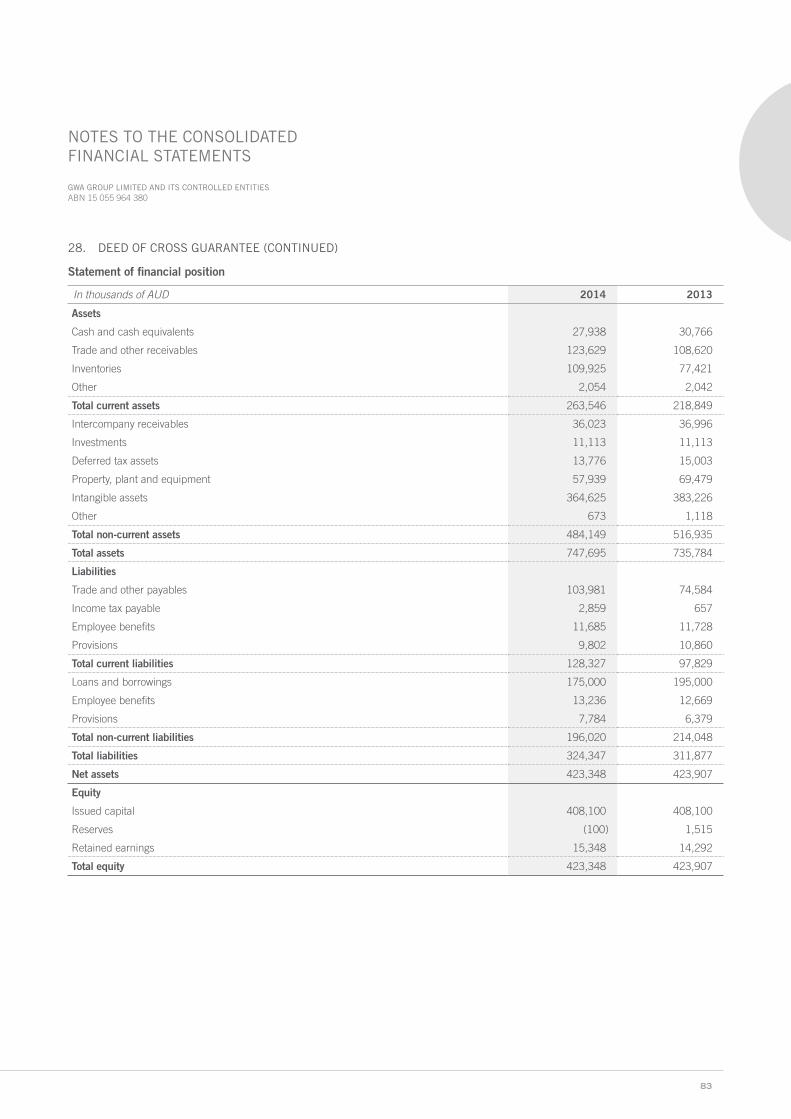
83
GWA GROUP LIMITED AND ITS CONTROLLED ENTITIES ABN 15 055 964 380
NOTES TO THE CONSOLIDATED FINANCIAL STATEMENTS
Statement of financial position
In thousands of AUD 2014 2013
Assets
Cash and cash equivalents 27,938 30,766
Trade and other receivables 123,629 108,620
Inventories 109,925 77,421
Other 2,054 2,042
Total current assets 263,546 218,849
Intercompany receivables 36,023 36,996
Investments 11,113 11,113
Deferred tax assets 13,776 15,003
Property, plant and equipment 57,939 69,479
Intangible assets 364,625 383,226
Other 673 1,118
Total non-current assets 484,149 516,935
Total assets 747,695 735,784
Liabilities
Trade and other payables 103,981 74,584
Income tax payable 2,859 657
Employee benefits 11,685 11,728
Provisions 9,802 10,860
Total current liabilities 128,327 97,829
Loans and borrowings 175,000 195,000
Employee benefits 13,236 12,669
Provisions 7,784 6,379
Total non-current liabilities 196,020 214,048
Total liabilities 324,347 311,877
Net assets 423,348 423,907
Equity
Issued capital 408,100 408,100
Reserves (100) 1,515
Retained earnings 15,348 14,292
Total equity 423,348 423,907
28. DEED OF CROSS GUARANTEE (CONTINUED)

GWA GROUP LIMITED • 2014 ANNUAL REPORT
GWA GROUP LIMITED AND ITS CONTROLLED ENTITIES ABN 15 055 964 380
NOTES TO THE CONSOLIDATED FINANCIAL STATEMENTS
29. CONSOLIDATED ENTITIES
Parties to cross guarantee
Country of incorporation Ownership interest
2014 2013
Parent entity
GWA Group Limited Y Australia
Subsidiaries
API Services and Solutions Pty Limited Y Australia 100% 100%
Austral Lock Pty Ltd Y Australia 100% 100%
Brivis Climate Systems Pty Ltd Y Australia 100% 100%
Canereb Pty Ltd N Australia 100% 100%
Caroma Holdings Limited Y Australia 100% 100%
Caroma Industries Limited Y Australia 100% 100%
Caroma Industries (NZ) Limited N New Zealand 100% 100%
Caroma International Pty Ltd Y Australia 100% 100%
Corille Limited Y Australia 100% 100%
Dorf Clark Industries Ltd Y Australia 100% 100%
Dorf Industries (NZ) Ltd N New Zealand 100% 100%
Dux Manufacturing Limited Y Australia 100% 100%
G Subs Pty Ltd Y Australia 100% 100%
Gainsborough Hardware Industries Limited Y Australia 100% 100%
Gliderol International Pty Limited Y Australia 100% 100%
GWA Finance Pty Limited Y Australia 100% 100%
GWA Group Holdings Limited Y Australia 100% 100%
GWAIL (NZ) Ltd N New Zealand 100% 100%
GWA Taps Manufacturing Limited Y Australia 100% 100%
GWA Trading (Shanghai) Co Ltd N China 100% 100%
Industrial Mowers (Australia) Limited Y Australia 100% 100%
McIlwraith Davey Pty Ltd Y Australia 100% 100%
Sebel Furniture Holdings Pty Ltd Y Australia 100% 100%
Starion Tapware Pty Ltd Y Australia 100% 100%
Stylus Pty Ltd Y Australia 100% 100%
Warapave Pty Ltd N Australia 100% 100%
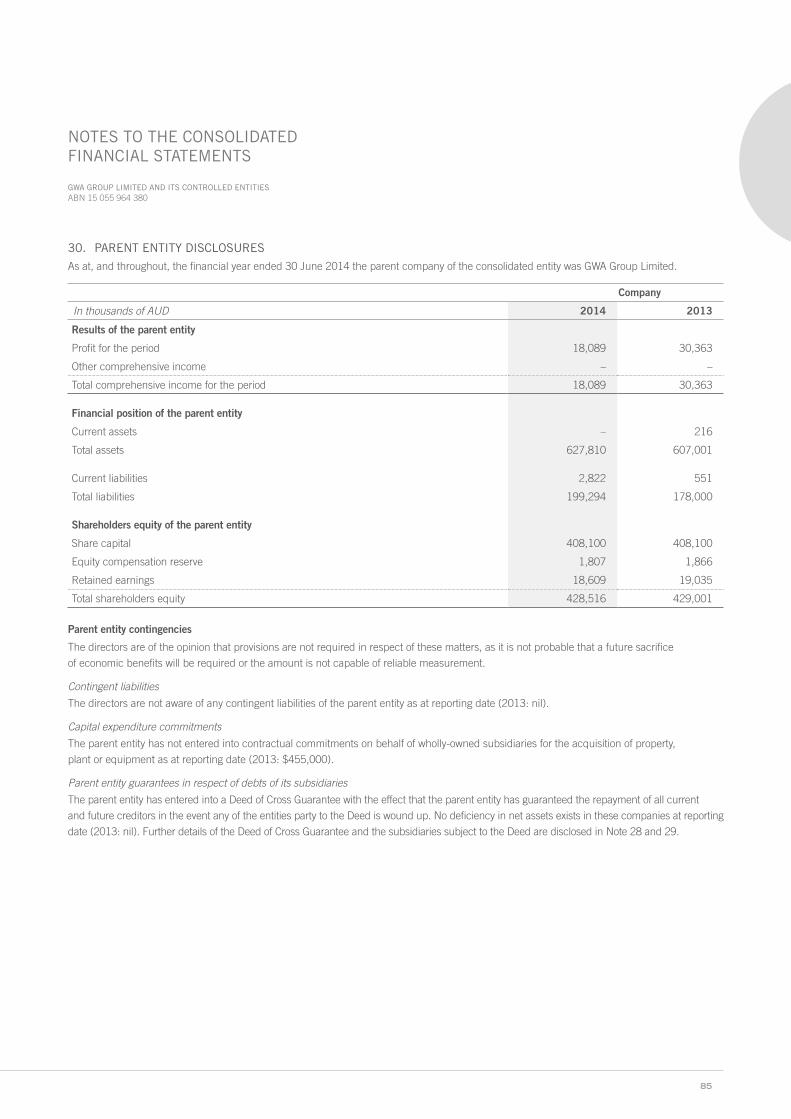
85
GWA GROUP LIMITED AND ITS CONTROLLED ENTITIES ABN 15 055 964 380
NOTES TO THE CONSOLIDATED FINANCIAL STATEMENTS
30. PARENT ENTITY DISCLOSURES
As at, and throughout, the financial year ended 30 June 2014 the parent company of the consolidated entity was GWA Group Limited.
Company
In thousands of AUD 2014 2013
Results of the parent entity
Profit for the period 18,089 30,363
Other comprehensive income – –
Total comprehensive income for the period 18,089 30,363
Financial position of the parent entity
Current assets – 216
Total assets 627,810 607,001
Current liabilities 2,822 551
Total liabilities 199,294 178,000
Shareholders equity of the parent entity
Share capital 408,100 408,100
Equity compensation reserve 1,807 1,866
Retained earnings 18,609 19,035
Total shareholders equity 428,516 429,001
Parent entity contingencies
The directors are of the opinion that provisions are not required in respect of these matters, as it is not probable that a future sacrifice
of economic benefits will be required or the amount is not capable of reliable measurement.
Contingent liabilitiesThe directors are not aware of any contingent liabilities of the parent entity as at reporting date (2013: nil).
Capital expenditure commitmentsThe parent entity has not entered into contractual commitments on behalf of wholly-owned subsidiaries for the acquisition of property,
plant or equipment as at reporting date (2013: $455,000).
Parent entity guarantees in respect of debts of its subsidiariesThe parent entity has entered into a Deed of Cross Guarantee with the effect that the parent entity has guaranteed the repayment of all current
and future creditors in the event any of the entities party to the Deed is wound up. No deficiency in net assets exists in these companies at reporting
date (2013: nil). Further details of the Deed of Cross Guarantee and the subsidiaries subject to the Deed are disclosed in Note 28 and 29.
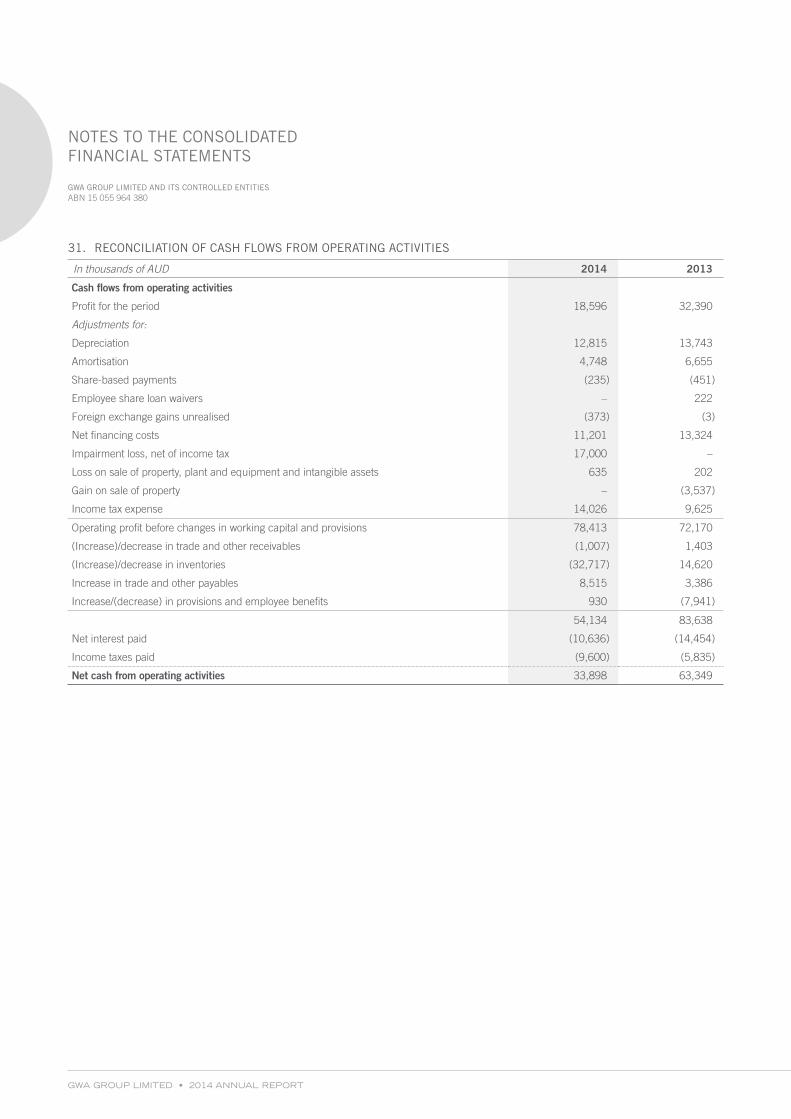
GWA GROUP LIMITED • 2014 ANNUAL REPORT
GWA GROUP LIMITED AND ITS CONTROLLED ENTITIES ABN 15 055 964 380
NOTES TO THE CONSOLIDATED FINANCIAL STATEMENTS
31. RECONCILIATION OF CASH FLOWS FROM OPERATING ACTIVITIES
In thousands of AUD 2014 2013
Cash flows from operating activities
Profit for the period 18,596 32,390
Adjustments for:
Depreciation 12,815 13,743
Amortisation 4,748 6,655
Share-based payments (235) (451)
Employee share loan waivers – 222
Foreign exchange gains unrealised (373) (3)
Net financing costs 11,201 13,324
Impairment loss, net of income tax 17,000 –
Loss on sale of property, plant and equipment and intangible assets 635 202
Gain on sale of property – (3,537)
Income tax expense 14,026 9,625
Operating profit before changes in working capital and provisions 78,413 72,170
(Increase)/decrease in trade and other receivables (1,007) 1,403
(Increase)/decrease in inventories (32,717) 14,620
Increase in trade and other payables 8,515 3,386
Increase/(decrease) in provisions and employee benefits 930 (7,941)
54,134 83,638
Net interest paid (10,636) (14,454)
Income taxes paid (9,600) (5,835)
Net cash from operating activities 33,898 63,349
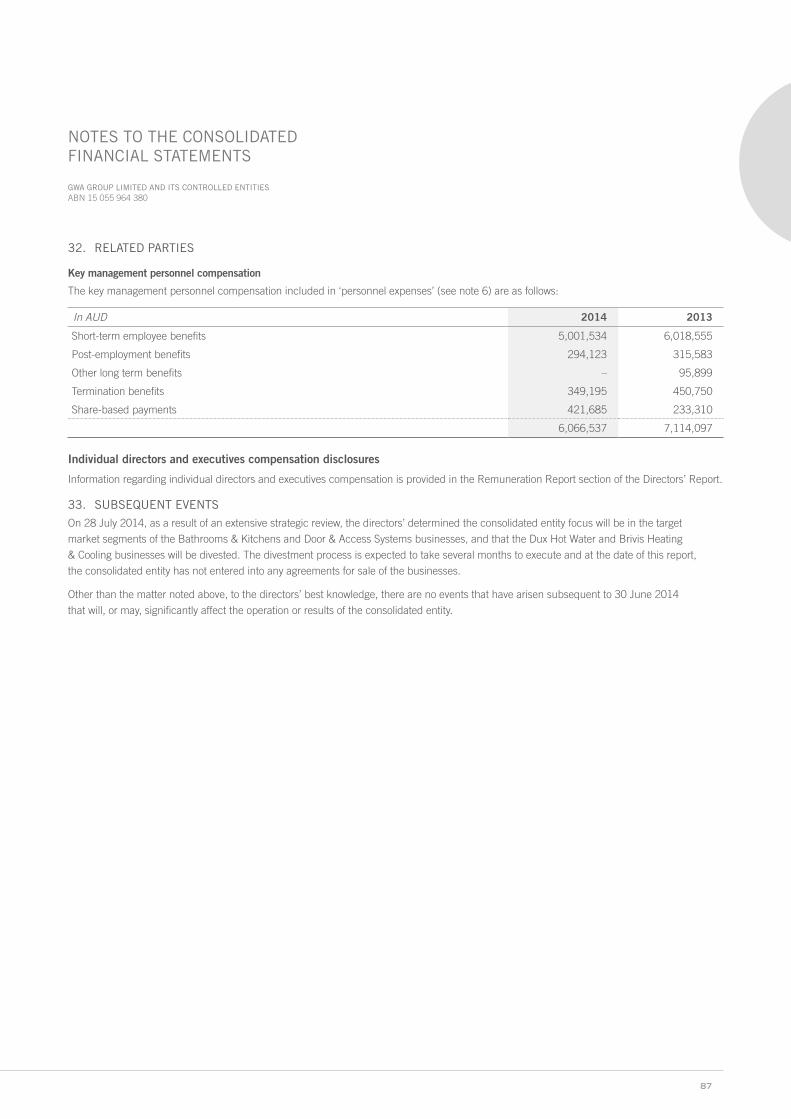
87
GWA GROUP LIMITED AND ITS CONTROLLED ENTITIES ABN 15 055 964 380
NOTES TO THE CONSOLIDATED FINANCIAL STATEMENTS
32. RELATED PARTIES
Key management personnel compensation
The key management personnel compensation included in ‘personnel expenses’ (see note 6) are as follows:
In AUD 2014 2013
Short-term employee benefits 5,001,534 6,018,555
Post-employment benefits 294,123 315,583
Other long term benefits – 95,899
Termination benefits 349,195 450,750
Share-based payments 421,685 233,310
6,066,537 7,114,097
Individual directors and executives compensation disclosures
Information regarding individual directors and executives compensation is provided in the Remuneration Report section of the Directors’ Report.
33. SUBSEQUENT EVENTS
On 28 July 2014, as a result of an extensive strategic review, the directors’ determined the consolidated entity focus will be in the target
market segments of the Bathrooms & Kitchens and Door & Access Systems businesses, and that the Dux Hot Water and Brivis Heating
& Cooling businesses will be divested. The divestment process is expected to take several months to execute and at the date of this report,
the consolidated entity has not entered into any agreements for sale of the businesses.
Other than the matter noted above, to the directors’ best knowledge, there are no events that have arisen subsequent to 30 June 2014
that will, or may, significantly affect the operation or results of the consolidated entity.
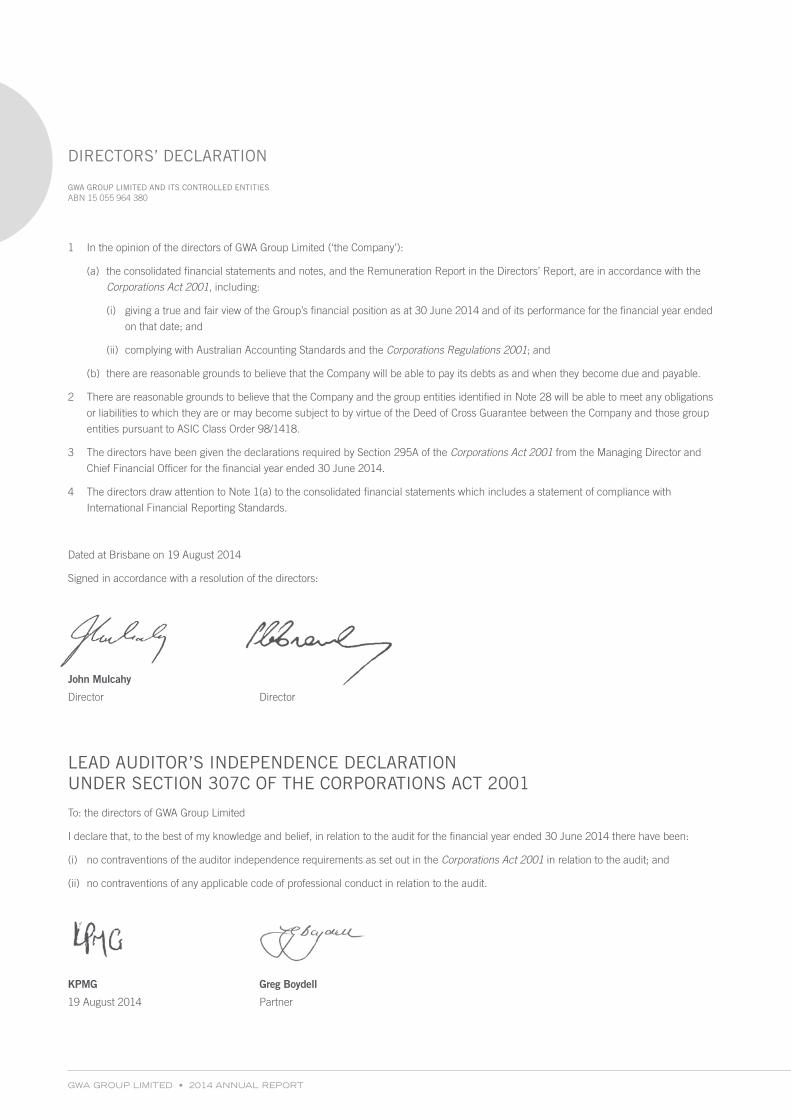
GWA GROUP LIMITED • 2014 ANNUAL REPORT
GWA GROUP LIMITED AND ITS CONTROLLED ENTITIES ABN 15 055 964 380
1 In the opinion of the directors of GWA Group Limited (‘the Company’):
(a) the consolidated financial statements and notes, and the Remuneration Report in the Directors’ Report, are in accordance with the
Corporations Act 2001, including:
(i) giving a true and fair view of the Group’s financial position as at 30 June 2014 and of its performance for the financial year ended
on that date; and
(ii) complying with Australian Accounting Standards and the Corporations Regulations 2001; and
(b) there are reasonable grounds to believe that the Company will be able to pay its debts as and when they become due and payable.
2 There are reasonable grounds to believe that the Company and the group entities identified in Note 28 will be able to meet any obligations
or liabilities to which they are or may become subject to by virtue of the Deed of Cross Guarantee between the Company and those group
entities pursuant to ASIC Class Order 98/1418.
3 The directors have been given the declarations required by Section 295A of the Corporations Act 2001 from the Managing Director and
Chief Financial Officer for the financial year ended 30 June 2014.
4 The directors draw attention to Note 1(a) to the consolidated financial statements which includes a statement of compliance with
International Financial Reporting Standards.
Dated at Brisbane on 19 August 2014
Signed in accordance with a resolution of the directors:
John Mulcahy Peter Crowley
Director Director
LEAD AUDITOR’S INDEPENDENCE DECLARATION UNDER SECTION 307C OF THE CORPORATIONS ACT 2001
To: the directors of GWA Group Limited
I declare that, to the best of my knowledge and belief, in relation to the audit for the financial year ended 30 June 2014 there have been:
(i) no contraventions of the auditor independence requirements as set out in the Corporations Act 2001 in relation to the audit; and
(ii) no contraventions of any applicable code of professional conduct in relation to the audit.
KPMG Greg Boydell
19 August 2014 Partner
DIRECTORS’ DECLARATION

89
GWA GROUP LIMITED AND ITS CONTROLLED ENTITIES ABN 15 055 964 380
REPORT ON THE FINANCIAL REPORT
We have audited the accompanying financial report of GWA Group
Limited (the Company), which comprises the consolidated statement
of financial position as at 30 June 2014, and consolidated statement
of profit and loss and other comprehensive income, consolidated
statement of changes in equity or consolidated statement of cash
flows for the year ended on that date, notes 1 to 33 comprising a
summary of significant accounting policies and other explanatory
information and the directors’ declaration of the Group comprising
the Company and the entities it controlled at the year’s end or from
time to time during the financial year.
Directors’ responsibility for the financial report
The directors of the Company are responsible for the preparation of
the financial report that gives a true and fair view in accordance with
Australian Accounting Standards and the Corporations Act 2001 and
for such internal control as the directors determine is necessary to
enable the preparation of the financial report that is free from material
misstatement whether due to fraud or error. In Note 1, the directors
also state, in accordance with Australian Accounting Standard AASB
101 Presentation of Financial Statements, that the financial statements
of the Group comply with International Financial Reporting Standards.
Auditor’s responsibility
Our responsibility is to express an opinion on the financial report based
on our audit. We conducted our audit in accordance with Australian
Auditing Standards. These Auditing Standards require that we comply
with relevant ethical requirements relating to audit engagements and
plan and perform the audit to obtain reasonable assurance whether
the financial report is free from material misstatement.
An audit involves performing procedures to obtain audit evidence
about the amounts and disclosures in the financial report. The
procedures selected depend on the auditor’s judgement, including
the assessment of the risks of material misstatement of the
financial report, whether due to fraud or error. In making those risk
assessments, the auditor considers internal control relevant to the
entity’s preparation of the financial report that gives a true and fair
view in order to design audit procedures that are appropriate in the
circumstances, but not for the purpose of expressing an opinion on
the effectiveness of the entity’s internal control. An audit also includes
evaluating the appropriateness of accounting policies used and the
reasonableness of accounting estimates made by the directors, as
well as evaluating the overall presentation of the financial report.
We performed the procedures to assess whether in all material
respects the financial report presents fairly, in accordance with
the Corporations Act 2001 and Australian Accounting Standards,
a true and fair view which is consistent with our understanding
of the Group’s financial position and of its performance.
We believe that the audit evidence we have obtained is sufficient
and appropriate to provide a basis for our audit opinion.
Independence
In conducting our audit, we have complied with the independence
requirements of the Corporations Act 2001.
Auditor’s opinion
In our opinion:
(a) the financial report of the Group is in accordance with the
Corporations Act 2001, including:
(i) giving a true and fair view of the Group’s financial position
as at 30 June 2014 and of its performance for the year
ended on that date; and
(ii) complying with Australian Accounting Standards and
the Corporations Regulations 2001; and
(b) the financial report also complies with International Financial
Reporting Standards as disclosed in Note 1.
Report on the remuneration report
We have audited the Remuneration Report included in pages
30 to 42 of the directors’ report for the year ended 30 June 2014.
The directors of the Company are responsible for the preparation
and presentation of the remuneration report in accordance with
Section 300A of the Corporations Act 2001. Our responsibility is
to express an opinion on the remuneration report, based on our
audit conducted in accordance with auditing standards.
Auditor’s opinion
In our opinion, the remuneration report of GWA Group Limited for
the year ended 30 June 2014, complies with Section 300A of the
Corporations Act 2001.
KPMG Greg Boydell
Sydney Partner
19 August 2014
INDEPENDENT AUDITOR’S REPORT TO THE MEMBERS OF GWA GROUP LIMITED
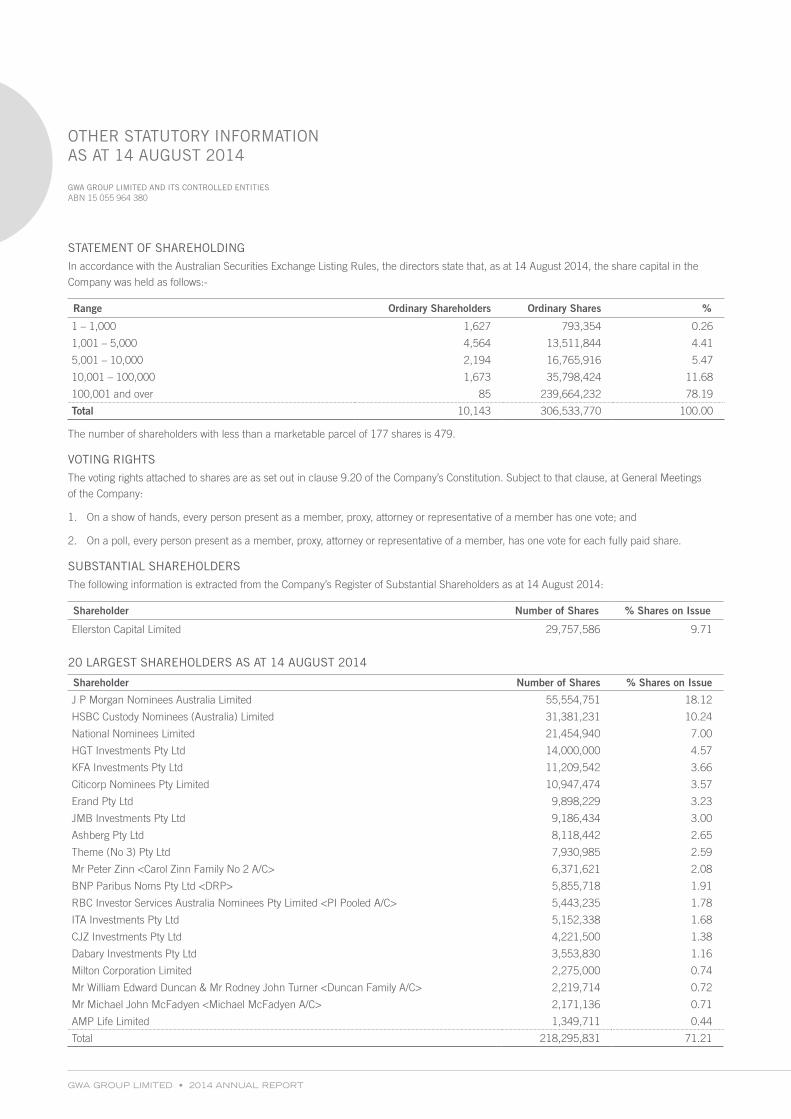
GWA GROUP LIMITED • 2014 ANNUAL REPORT
GWA GROUP LIMITED AND ITS CONTROLLED ENTITIES ABN 15 055 964 380
STATEMENT OF SHAREHOLDING
In accordance with the Australian Securities Exchange Listing Rules, the directors state that, as at 14 August 2014, the share capital in the
Company was held as follows:-
Range Ordinary Shareholders Ordinary Shares %
1 – 1,000 1,627 793,354 0.26
1,001 – 5,000 4,564 13,511,844 4.41
5,001 – 10,000 2,194 16,765,916 5.47
10,001 – 100,000 1,673 35,798,424 11.68
100,001 and over 85 239,664,232 78.19
Total 10,143 306,533,770 100.00
The number of shareholders with less than a marketable parcel of 177 shares is 479.
VOTING RIGHTS
The voting rights attached to shares are as set out in clause 9.20 of the Company’s Constitution. Subject to that clause, at General Meetings
of the Company:
1. On a show of hands, every person present as a member, proxy, attorney or representative of a member has one vote; and
2. On a poll, every person present as a member, proxy, attorney or representative of a member, has one vote for each fully paid share.
SUBSTANTIAL SHAREHOLDERS
The following information is extracted from the Company’s Register of Substantial Shareholders as at 14 August 2014:
Shareholder Number of Shares % Shares on Issue
Ellerston Capital Limited 29,757,586 9.71
20 LARGEST SHAREHOLDERS AS AT 14 AUGUST 2014
Shareholder Number of Shares % Shares on Issue
J P Morgan Nominees Australia Limited 55,554,751 18.12
HSBC Custody Nominees (Australia) Limited 31,381,231 10.24
National Nominees Limited 21,454,940 7.00
HGT Investments Pty Ltd 14,000,000 4.57
KFA Investments Pty Ltd 11,209,542 3.66
Citicorp Nominees Pty Limited 10,947,474 3.57
Erand Pty Ltd 9,898,229 3.23
JMB Investments Pty Ltd 9,186,434 3.00
Ashberg Pty Ltd 8,118,442 2.65
Theme (No 3) Pty Ltd 7,930,985 2.59
Mr Peter Zinn <Carol Zinn Family No 2 A/C> 6,371,621 2.08
BNP Paribus Noms Pty Ltd <DRP> 5,855,718 1.91
RBC Investor Services Australia Nominees Pty Limited <PI Pooled A/C> 5,443,235 1.78
ITA Investments Pty Ltd 5,152,338 1.68
CJZ Investments Pty Ltd 4,221,500 1.38
Dabary Investments Pty Ltd 3,553,830 1.16
Milton Corporation Limited 2,275,000 0.74
Mr William Edward Duncan & Mr Rodney John Turner <Duncan Family A/C> 2,219,714 0.72
Mr Michael John McFadyen <Michael McFadyen A/C> 2,171,136 0.71
AMP Life Limited 1,349,711 0.44
Total 218,295,831 71.21
OTHER STATUTORY INFORMATION AS AT 14 AUGUST 2014

91
GWA GROUP LIMITED AND ITS CONTROLLED ENTITIES ABN 15 055 964 380
ANNUAL GENERAL MEETING
The Annual General Meeting of GWA Group Limited will be held in
The Conference Room, Emporium Hotel, 1000 Ann Street, Fortitude
Valley on Friday 24 October 2014 commencing at 10:30am.
Shareholders will be mailed their Notice of Annual General Meeting
and Proxy Form during September 2014.
SHAREHOLDER ENQUIRIES
Shareholders with enquiries about their shareholding or
dividend payments should contact the Company’s share registry,
Computershare Investor Services Pty Limited, on 1300 850505
or write to GPO Box 2975 Melbourne Victoria Australia 3001.
Alternatively, you can view details of your holding or make changes
to your personal information online at www.computershare.com.au.
CHANGE OF ADDRESS
Shareholders who have changed their address should immediately
notify the Company’s share registry in writing or online at
www.computershare.com.au.
CONSOLIDATION OF SHAREHOLDINGS
Shareholders who wish to consolidate their separate shareholdings
into one holding should notify the Company’s share registry in writing.
ANNUAL REPORTS
Annual Reports are made available to shareholders on the Company’s
website at www.gwagroup.com.au. Shareholders wishing to be
mailed a copy of the Annual Report should notify the Company’s
share registry in writing or online at www.computershare.com.au.
Shareholders will be mailed the Notice of Annual General Meeting
and Proxy Form which will include details on accessing the online
Annual Report.
DIVIDENDS
Dividends are determined by the Board having regard to the financial
circumstances of the Company. Dividends are normally paid in April
and October each year following the release of the Company’s half
and full year results to the market. The latest dividend details can
be found on the Company’s website at www.gwagroup.com.au.
DIRECT CREDIT OF DIVIDENDS
To minimise cost and ensure fast and efficient payment of dividends
to shareholders, the Company mandates direct credit for payment of
dividends. Dividends may be paid directly to a bank, building society
or credit union account in Australia. Payments are electronically
credited on the dividend payment date and confirmed by an advice
mailed to shareholders on that date, or emailed where shareholders
have requested this form of communication. Direct credit application
forms can be obtained from the Company’s share registry or online at
www.computershare.com.au.
DIVIDEND REINVESTMENT PLAN
The Dividend Reinvestment Plan was suspended by the Board
in August 2013. At the present time the Company has access to
sufficient capital to meet its funding requirements. The Board keeps
this position under review.
SECURITIES EXCHANGE LISTING
The Company’s shares are listed on the Australian Securities
Exchange under the ASX code: GWA. Details of the trading activity
of the Company’s shares are published in most daily newspapers,
generally under the abbreviation GWA Grp.
SHAREHOLDER TIMETABLE 2014
30 June
Financial year end
19 August
Year end result and final dividend announcement
15 September
Ex dividend date for final dividend
17 September
Record date for determining final dividend entitlement
19 September
Notice of Annual General Meeting and Proxy Form mailed
to shareholders
8 October
Final ordinary dividend paid
22 October
Proxy returns close 10:30am Brisbane time
24 October
Annual General Meeting
31 December
Half year end
SHAREHOLDER INFORMATION
HEAD OFFICE LOCATIONS
GWA Group LimitedLevel 2, HQ South Tower 520 Wickham Street Fortitude Valley QLD 4006 AUSTRALIA
Telephone: 61 7 3109 6000 Facsimile: 61 7 3852 2201
www.gwagroup.com.au
GWA Bathrooms & KitchensCaroma Industries Limited Level 1, 7-9 Irvine Place Bella Vista NSW 2153 AUSTRALIA
Telephone: 61 2 8825 4400 Facsimile: 61 2 8825 4567
www.caroma.com.au specify.caroma.com.au www.fowler.com.au www.dorf.com.au www.stylus.com.au www.clark.com.au www.radiantstainless.com.au www.epure.com.au www.irwell.com.au www.starionaust.com.au
Dux Manufacturing Limited Lackey Road Moss Vale NSW 2577 AUSTRALIA
Telephone: 61 2 4868 0200 Facsimile: 61 2 4868 2014
www.dux.com.au www.ecosmart.com.au
GWA Heating & CoolingBrivis Climate Systems Pty Limited 61 Malcolm Road Braeside VIC 3195 AUSTRALIA
Telephone: 61 3 9264 9555 Facsimile: 61 3 9264 9400
www.brivis.com.au
GWA Door & Access SystemsGainsborough Hardware Industries Limited 31-33 Alfred Street Blackburn VIC 3130 AUSTRALIA
Telephone: 61 3 9877 1555 Facsimile: 61 3 9894 1599
www.gainsboroughhardware.com.au www.ausloc.com
Gliderol International Pty Limited 31-33 Alfred Street Blackburn VIC 3130 AUSTRALIA
Telephone: 61 3 9877 1555 Facsimile: 61 3 9894 1599
www.gliderol.com.au
API Services and Solutions Pty Limited 248 Normanby Road South Melbourne VIC 3205 AUSTRALIA
Telephone: 131KEY(539) Facsimile: 61 3 9644 5887
www.apisec.com.au

Printed using Forestry Stewardship Council (FSC) certified paper. All paper sourced from responsibly managed plantation forests. ISO14001 environmental management system in use.
CORPORATE DIRECTORY
DirectorsD D McDonough, Chairman
J F Mulcahy, Deputy Chairman
P C Crowley, Managing Director
R M Anderson, Non-Executive Director
W J Bartlett, Non-Executive Director
P A Birtles, Non-Executive Director
R J Thornton, Executive Director
Chief Financial OfficerI Brannan, ACMA MBA
Company SecretaryR J Thornton, CA B Com (Acc) LLB (Hons) LLM
Registered OfficeLevel 2, HQ South Tower 520 Wickham Street Fortitude Valley QLD 4006 AUSTRALIA
Telephone: 61 7 3109 6000 Facsimile: 61 7 3852 2201
www.gwagroup.com.au
ASX code: GWA
AuditorKPMG
10 Shelley Street Sydney NSW 2000 AUSTRALIA
Telephone: 61 2 9335 7000 Facsimile: 61 2 9335 7001
Share RegistryComputershare Investor Services Pty Limited
117 Victoria Street West End QLD 4101 AUSTRALIA
GPO Box 2975 Melbourne VIC 3001 AUSTRALIA
(within Australia) 1300 850 505 (outside Australia) 61 3 9415 4000
www.computershare.com.au
Group BankersCommonwealth Bank of Australia Australia and New Zealand Banking Group HSBC Bank Australia Westpac Banking Corporation

2014 ANNUAL REPORT
Level 2, HQ South Tower 520 Wickham Street Fortitude Valley, QLD 4006AUSTRALIA
Telephone: 61 7 3109 6000 Facsimile: 61 7 3852 2201
Website: www.gwagroup.com.au
GW
A G
RO
UP
| AN
NU
AL R
EP
OR
T 20
14