gwendolyn louise rehrig in partial fulfillment of the...
TRANSCRIPT

DRAWING COMPARISONS BETWEEN DRAWING PERFORMANCE AND
DEVELOPMENTAL ASSESSMENTS
By
GWENDOLYN LOUISE REHRIG
A thesis submitted to the
Graduate School-New Brunswick
Rutgers, The State University of New Jersey
In partial fulfillment of the requirements
For the degree of
Master of Science
Graduate Program in Psychology
Written under the direction of
Dr. Karin Stromswold
And approved by
_____________________________________
_____________________________________
_____________________________________
New Brunswick, New Jersey
January, 2015

ii
ABSTRACT OF THE THESIS
Drawing Comparisons between Drawing Performance and Developmental Assessments
by GWENDOLYN LOUISE REHRIG
Thesis director:
Dr. Karin Stromswold
Human figure drawing tasks like the Draw-A-Person (DAP) task have long been used to
assess intelligence (Goodenough, 1926). To what extent are these tasks valid as measures
of cognitive ability? What other skills, if any, do DAP intelligence tests measure? This
study investigates the skills tapped by drawing and investigates risk factors associated
with poor drawing. Self-portraits of 345 preschool children were scored using the
DAP:IQ rubric (Reynolds & Hickman, 2004) and were scored for overall aesthetic
quality by artists. Analyses of children’s fine motor, gross motor, social, cognitive, and
language skills revealed fine motor and cognitive skills predicted aesthetic scores, but
only fine motor skills predicted DAP:IQ scores. Being male and born with low birth
weight were risk factors for poor drawing skills. These findings suggest that the DAP:IQ
could be used as an easy way to screen for fine motor disturbances in at-risk children.
Furthermore, researchers who use human figure drawing tasks to measure intelligence
should compare performance on said tasks with measures of fine motor skill in addition
to standard measures of intelligence.

iii
Acknowledgements
I would like to thank my advisor, Karin Stromswold, for her guidance and support
in writing this thesis. Without her I would be lost. I also thank my committee members,
Jacob Feldman and Kimberly Brenneman, for their helpful feedback and insight. I am
indebted to Carine Abraham, Chandni Patel, and Alnida Espinosa, who volunteered
hundreds of hours of their time to code children’s drawings and enter data. I thank
Gabriela Bess and Melinh Lai for their help with data entry. To members of the Language
Acquisition and Language Processing Laboratory not otherwise named here, I thank you
for your helpful feedback and support over the course of this project.
This work would not have been possible without funding from the National
Science Foundation for the Social, Behavioral, and Economic Sciences (SBE BCS-
0002010, BCS-0042561, BCS-0124095, and BCS-0446838) and the Integrative Graduate
Education and Research Traineeship (DGE IGERT 0549115). This work was also
generously supported by the Busch Biomedical Research Fund and the Bamford-Lahey
Children’s Foundation.
Lastly, I would like to thank my family for their love and support through the
many challenges I have faced over the course of this thesis, both personal and
professional. Special thanks to my loving husband, Andrew Rehrig, for tolerating the
many hours I spent analyzing data and writing around-the-clock.

iv
Dedication
In memory of Rosemary Hamilton, talented artist and dedicated educator, who believed
in me even when I did not believe in myself.

v
Table of Contents
Abstract ............................................................................................................................... ii
Acknowledgements ............................................................................................................ iii
Dedication .......................................................................................................................... iv
Table of Contents ................................................................................................................ v
List of Tables ..................................................................................................................... vi
List of Figures ................................................................................................................... vii
1. Introduction ..................................................................................................................... 1
2. Methods........................................................................................................................... 6
2.1 Participants. ........................................................................................................... 6
2.2 DAP:IQ scores. ...................................................................................................... 8
2.3 Aesthetic scores. .................................................................................................... 8
2.4 Developmental assessments. ................................................................................. 9
3. Results ........................................................................................................................... 10
3.1 Demographic Analyses ........................................................................................ 12
3.2 Developmental Skills. .......................................................................................... 14
4. Discussion ..................................................................................................................... 16
Appendix ........................................................................................................................... 21
Bibliography ..................................................................................................................... 22

vi
List of Tables
1. Participants Demographics ............................................................................................. 7
2. Multiple Regression Analysis for DAP:IQ and Birth Demographics ........................... 13
3. Multiple Regression Analysis for Aesthetic Scores and Birth Demographics ............. 14
4. Multiple Regression Analyses comparing DAP:IQ Scores and Ability Assessments .. 15
5. Multiple Regression Analyses comparing Aesthetic Scores and Ability Assessments 16

vii
List of Figures
1. Example Drawings. ......................................................................................................... 9
2. Comparison between Aesthetic Scores and DAP:IQ Scores. ....................................... 10
3. Comparison between Aesthetic Scores and Age. ......................................................... 11
4.Comparison between DAP:IQ Scores and Age ............................................................. 11
5. Mean DAP:IQ and Aesthetic Scores by Sex................................................................. 12

1
Introduction
Children's drawings have been associated with verbal ability (Toomela, 2002),
socioemotional development (Naglieri, MacNeish, & Bardos, 1991; Laak, de Goede,
Aleva, & van Rijswijk, 2005), cognitive and fine motor skills (Schepers, Deković, &
Feltze, 2012), and general intelligence (Goodenough, 1926; Goodenough, 1928). Human
figure drawing tasks—and the Draw-A-Person (DAP) task in particular—have been used
to assess children's intelligence for nearly a century (Abell, Wood, & Liebman, 2001;
Goodenough, 1926; Naglieri, 1988).
When children draw, the images they produce differ from their real-world
counterparts in appearance, even when instructed to draw from a model (Goodenough,
1928). From this, early researchers have concluded that children's drawings reflect their
world knowledge, and that drawing tasks could be used to measure children's
intelligence. Others have taken this finding to reflect the developmental course of
cognitive flexibility; younger children are more likely to draw a prototypical version of
an object without integrating the unique features of the model object, demonstrating low
cognitive flexibility (Bremner & Moore, 1984; Picard & Durand, 2005; Taylor &
Bacharach, 1982).
Picard and Duran (2005) tested children ages 4 to 6 in a drawing task and found
that older children (six-year-olds) were better able to accurately draw a saucepan as seen
from an atypical viewing position than younger children, but that younger children (four-
year-olds) could achieve more accurate drawings when given less depth information (2D
or 2½D model). Taylor & Bacharach (1982) showed that young children (five-year-olds)
can integrate unique features of a model object into their drawings, but do so with greater

2
difficulty than older children (eight-year-olds). Similarly, Bremner & Moore (1984)
showed that six-year-olds were more likely to draw a prototypical version of a mug
(depicting the handle even when hidden from view) when linguistic labels were used in
the instructions to describe the object, but were able to accurately draw the mug from
their viewpoint (handle occluded) when the object was not named. Both camps posit that
children’s drawings in one way or another tap semantic knowledge about the subject, and
both use said drawings to make inferences about children’s cognitive abilities.
Another body of evidence for the use of drawing tasks to measure intelligence is
that human figure drawing tasks have been validated against standardized measures of
full scale intelligence. Abell, Wood, and Liebman (2001) have found relationships
between full scale intelligence measures (Wechsler Intelligence Scale for Children-
Revised [WISC-R], Wechsler, 1974; Wechsler Intelligence Scale for Children [WISC-
III], Wechsler, 1991) and human figure drawing intelligence tasks designed by
Goodenough and Harris (1963), Naglieri (1988), and Ayres and Reid (1966). The
DAP:IQ (Reynolds & Hickman, 2004) has been normed against two full scale
intelligence measures: the WISC-III (Wechsler, 1991) and the Reynolds Intellectual
Assessment Scales (RIAS; Reynolds & Kamphaus, 2003). Williams, Fall, Eaves, &
Woods-Groves (2005) examined reliability for the DAP:IQ (Reynolds & Hickman, 2004)
and found that reliability for the test was high, but cautioned that some of the scoring
criteria were more ambiguous than others, resulting in lower inter-rater reliability than
reported by the test developers1. Recently, a large twin study (Arden, Trzaskowski,
Garfield, & Plomin, 2014) found that drawing performance and intelligence are both
1Inter-rater reliability on the DAP:IQ reported by Williams et al. (2005) was r = 0.83, whereas the test
developers (Reynolds & Hickman, 2004) report inter-rater reliability measures of r = .95 for drawings by
older children and adults (age range 11-75), and r = .91 for younger children (age range 6-11).

3
heritable, and found a relationship between DAP task performance at age four and
intelligence at age fourteen, ten years later.
Although human figure drawing tasks continue to be used to measure intelligence,
the validity of these tasks as measures of intelligence has been challenged (Imuta, Scarf,
Pharo, & Hayne, 2013; Motta, Little, & Tobin, 1993a). Motta et al. (1993a) criticized the
use of human figure drawing tasks in testing personality, emotional disturbance, and—of
relevance to the current study—intelligence. In their criticisms, the authors cite
inconsistent, low relationships between human figure drawing tasks of intelligence and
standardized measures of intelligence, and the poor ability of these tasks to predict
academic performance. They further suggest that ease of administration of human figure
drawing tasks may be the only argument for their use, though it is not enough to
compensate for poor task validity. These criticisms sparked a raging debate between
researchers defending human figure drawing tasks (Bardos, 1993; Holtzman, 1993;
Naglieri, 1993) and researchers opposing their use despite insufficient empirical support
(Gresham, 1993; Kamphaus, 1993; Knoff, 1993; Motta, Little, & Tobin, 1993b). The
controversy, however, did not halt the use of human figure drawing assessments by
researchers. In some cases (e.g., Ezenwosu, Emodi, Ikefuna, & Chukwu, 2013), DAP2
tasks have been used as the sole measure of intelligence where intelligence is a key study
variable.
In recent years this debate has been revived by Imuta, Scarf, Pharo, and Hayne
(2013), who cite additional concerns on the use of human figure drawing tasks to
measure intelligence. Imuta et al. compared the performance of four- and five-year-old
2DAP used here to refer to any Draw-A-Person task with a scoring system designed to convert drawing
scores into IQ scores or mental age equivalents. This includes the DAP QSS (Naglieri, 1988), the DAP:IQ
(Reynolds & Hickman, 2004), and the Goodenough-Harris drawing test (Goodenough & Harris, 1963).

4
children on the DAP:IQ to the children’s performance on the Wechsler Preschool and
Primary Scale of Intelligence ([WPPSI-III], Wechsler, 2002) and the performance of
adults on the DAP:IQ and the Wechsler Abbreviated Scale of Intelligence Full scale IQ
Two-Subtest ([WASI FSIQ-2], Wechsler, 1999). For children, the authors found a
correlation between DAP:IQ scores and WPPSI-III performance; however, when DAP:IQ
scores were compared with performance on individual subtests of the WPPSI-III, a
significant correlation was found only for the Coding subtask—a nonverbal task that
involves copying shapes—and not for any of the other subtests. High false positive rates
and high false negative rates were found when using the DAP:IQ to screen for low
intellectual functioning. The DAP:IQ was shown to be similarly poor for identifying
gifted children, again demonstrating high false positive and false negative rates for high
intellectual functioning. For adults, DAP:IQ scores were not correlated with WASI full
scale IQ scores and the DAP:IQ performed poorly for identifying gifted adults. The
authors further relate evidence that older DAP tasks did not fare well as measures of
intelligence or as screening tasks for low and high intellectual functioning.
However, all of the above studies compared performance on these tasks with
commonly used measures of full scale IQ. Because these studies do not compare DAP
performance with a wide-ranging battery of skill assessments, they cannot determine the
extent to which cognitive ability and DAP performance are related relative to other skills.
A notable exception that does not share the above mentioned shortcomings is a study by
Schepers, Deković, and Feltze (2012) in which premature children's DAP performance
was compared to a measure of motor and cognitive development.

5
Schepers et al. (2012) compared drawing ability at age five as measured by
performance on the DAP:QSS (Naglieri, 1988) for self-portraits drawn by children born
very preterm (gestational age at birth < 32 weeks). From birth until age 5, periodic
assessments of cognitive (at ½, 2, and 5 years of age) and motor development (at 1, 2,
and 5 years of age) were recorded for the very preterm children. Cognitive development
was assessed at ½ and 2 years of age using the Bayley Developmental Scale mental
development index ([BOS 2-30], Van der Meulen & Smrkovsky, 1983) and at 5 years of
age using the Revised Amsterdam Child Intelligence Test ([RAKIT], Bleichrodt, Drenth,
Zaal, & Resing, 1984). Motor development was assessed at 1 and 2 years of age using the
BOS 2-30 psychomotor development index (Van der Meulen & Smrkovsky, 1983),
which combines fine motor and gross motor skills, and at age 5 using the Motor
Assessment Battery for Children ([M-ABC], Smits-Engelsman, 1992) which similarly
collapses gross and fine motor development into a measure of overall motor
development. A combined measure of cognitive and motor development, along with risk
factors for delayed development at birth, were then compared with DAP performance to
determine the relative contributions of each to drawing ability at age 5. Cognitive and
motor development were found to predict drawing performance, but having multiple risk
factors at birth was not. Note that the potential contributions of age and sex were not
assessed in the model.
Schepers et al. (2012) compared DAP performance to skill assessments rather
than to standardized IQ tests, but did not include assessments of other key areas of
development (e.g., social development, language development, etc.), nor did they assess
the relative contributions of fine motor and gross motor skills independent of one another.

6
The current study investigates the skills tapped by figure drawing and risk factors for
poor figure drawing. Performance on the DAP:IQ (Reynolds & Hickman, 2004) will be
compared on the basis of gestational age at birth and birth weight to determine risk
factors for poor drawing performance. Furthermore, drawing performance will be
compared with assessments of fine motor, gross motor, language, social, and cognitive
development to determine the relative contributions of each on drawing ability. Drawings
will be measured using DAP:IQ standard scores and using a measure of overall aesthetic
quality. If DAP:IQ scores tap cognitive ability and control for fine motor ability, as the
test developers claim (Reynolds & Hickman, 2004), it is expected that cognitive
assessments will strongly predict DAP:IQ scores.
Methods
Participants. The participants were 345 four- and-five-year olds who participated
in a broader longitudinal twin study. Overall, 49% of the participants were born low birth
weight (< 2500 g) with a mean birth weight of 2444 grams and 57% of participants were
born premature (gestational age at birth < 37 weeks) with a mean gestational age at birth
of 35.5 weeks (see Table 1 for complete participant demographics). Age at testing was
calculated using each child's due date, not birth date, in order to correct for prematurity
(henceforth called GA-corrected age). Parents provided background information about
their family and the medical history of each child participating in the study.

7
Table 1
Participant Demographics
M SE % of Sample
Gestational age at birth (weeks) 35.5 0.16
Birth weight (g) 2444 35.10
Age at testing (months) 60.80 0.02
Sex (% male) 51%
Twins 94.2%
Monozygotic 33.9%
Dizygotic 60.3%
Mother's education level
High school graduate 1.2%
Some college or technical school 14.8%
College graduate (B.A. or B.S.) 46.4%
Advanced degree (M.A., Ph.D., or M.D.) 37.1%
Ethnicity (% non-hispanic) 94.5%
Race (% Caucasian) 95.4%
Annual household income
Less than $50,000 12.2%
Between $50,000 and $100,000 49.3%
Over $100,000 33.9%

8
Children were given a Draw-A-Person task drawing form and were instructed to
draw a realistic self-portrait depicting the entire figure as seen from the front.3 Inter-rater
reliability was calculated using approximately 100 drawings that were scored by each
coder, sampled from all participants who completed the DAP task and not limited to the
cross-section of 4 and 5 year olds.
DAP:IQ scores. DAP:IQ raw scores were determined by four experimenters
using the DAP:IQ scoring rubric (Reynolds & Hickman, 2004), with possible scores
ranging from 0-49. DAP:IQ raw scores were converted to standard scores using
gestational age corrected age at testing, these DAP:IQ scores ranged from 51-144. Inter-
rater reliability for DAP:IQ scores for 300 drawings was very high (r(298) = 0.94, p <
.0001).
Aesthetic scores. Drawings were also coded on a 0-10 aesthetic scale by two
experimenters with fine arts training. Each of the two experimenters coded drawings
separately for aesthetic quality and did not discuss criteria with one another during the
scoring process. Aesthetic scores assigned to drawings made by 4- and 5-year-olds
ranged from 0-3. Once all drawings were scored, each experimenter separately outlined
the criteria used during scoring4 (see Appendix for post-hoc description of aesthetic
criteria). Scores given by the two experimenters were highly correlated (r(95) = 0.86, p <
.0001).
3 Exact instructions were as follows, taken from the DAP:IQ test manual (Reynolds & Hickman, 2004):
I want you to draw a picture of yourself. Be sure to draw your whole body, not just your head, and
draw how you look from the front, not the side. Do not draw a cartoon or stick figure. Draw the
very best picture of yourself that you can. Take your time and work carefully. Go ahead. (p. 5) 4 I acknowledge that this system is subjective. While scoring, the two aesthetic scorers used gut intuitions
to avoid overthinking scores. We do not expect that novice artists would come to the same judgments using
the criteria that we explicitly declared after scoring, nor do we expect that inter-rater reliability measures
would be as high for non-experts.

9
Figure 1. Drawings created by children in this study.
Developmental assessments. Children’s developmental skills were assessed in
three ways. First, children’s fine motor, gross motor, language, social, and cognitive
abilities5 were assessed using Ages & Stages Questionnaire (ASQ) scores (Bricker et al.,
1999). ASQ scores for each age category (48 months – 53.99 months, 54 months – 59.99
months, and 60 months) were transformed into z-scores so that comparisons could be
made across age categories. Second, we used parents’ ratings6 of their children’s abilities
relative to other children of the same age. These parental assessments used a five-point
scale ranging from 1 ("Very Delayed") to 5 ("Very Advanced"). Third, we assessed
whether children received therapeutic intervention7 within the most recent year that
targeted any of these areas. Having received occupational therapy in the most recent year
indicated the presence of fine motor problems. If a child received physical therapy within
the most recent year, the child had gross motor problems. Receiving speech language
therapy was taken to indicate language issues. Social problems were indicated by
receiving behavioral therapy within the most recent year. Cognitive delays were indicated
by having received educational interventions within the most recent year, including the
5 For the ASQ, cognitive ability will be used to refer to performance on the problem solving portion of the
ASQ, and language ability to refer to the communication portion of the ASQ. 6 The term parent rating will be used throughout the thesis to refer to this assessment.
7 For simplicity, the term therapy will be used to identify this assessment.

10
services of a reading or math specialist, a classroom aide, or having recently repeated a
grade in school.
Results
DAP:IQ scores and aesthetic scores were highly correlated (r(343) = .64, p <
.0001; see Figure 2). GA-corrected age was significantly correlated with aesthetic scores
(r(343) = .31; p < .0001; see Figure 3) and marginally correlated with DAP:IQ scores (p
< .05, alpha criterion = .01; see Figure 4). The latter finding, though marginal, is
nonetheless surprising given that converting DAP:IQ raw scores to standard scores is
designed to correct for age.
Figure 2. Scatterplot comparing aesthetic scores with DAP:IQ scores. Best-fit line is
superimposed with equation displayed above in red.

11
Figure 3. Scatterplot comparing aesthetic scores with GA-corrected age. Best-fit line is
superimposed with equation displayed above in red.
Figure 4. Scatterplot comparing DAP:IQ scores with GA-corrected age. Best-fit line is
superimposed with equation displayed above in red.

12
Demographic Analyses
Sex. A significant sex difference was found for figure drawings. Girls’ DAP:IQ
scores were on average 8.2 points higher than boys’ (F(1,343) = 28.02, p < .0001; see
Figure 5A). Girls’ drawings also received higher aesthetic scores than boys (F(1,343) =
24.68, p < .0001; Figure 5B).
Figure 5. A) Mean DAP:IQ scores for males and females. B) Mean aesthetic scores for
males and females. Error bars indicate standard error of the mean.
Prematurity and Birth Weight. For DAP:IQ scores, no effect of birth weight or
gestational age at birth was found when participants were collapsed across sex. Multiple
regression analyses with birth weight and gestational age as independent variables
revealed that higher birth weight was a marginally significant predictor of higher DAP:IQ
scores for boys (β = .31, p < .05), but neither birth weight nor gestational age was even a
marginal predictor of DAP:IQ scores for girls (Table 2).

13
Table 2
Multiple Regression Analysis for DAP:IQ and Birth Demographics
All Children
(N = 345)
Girls
(N = 169)
Boys
(N = 176)
β p β p β p
Age at testing .14 .007 .07 ns .20 .006
Sex .29 < .0001 - - - -
Birth Weight .13 ns -.002 ns .31 .04
Gestational Age at
Birth -.12 ns -.14 ns -.19 ns
For aesthetic scores, a marginal effect of gestational age at birth was found when
participants were collapsed across sex. The effect of birth weight and prematurity on
girls' and boys' drawings was even more pronounced (Table 3) with both birth weight (β
= .45, p = .002) and gestational age (-.44, p = .003) being independent predictors of
aesthetic scores for boys (ps < .005) but not for girls (ns).
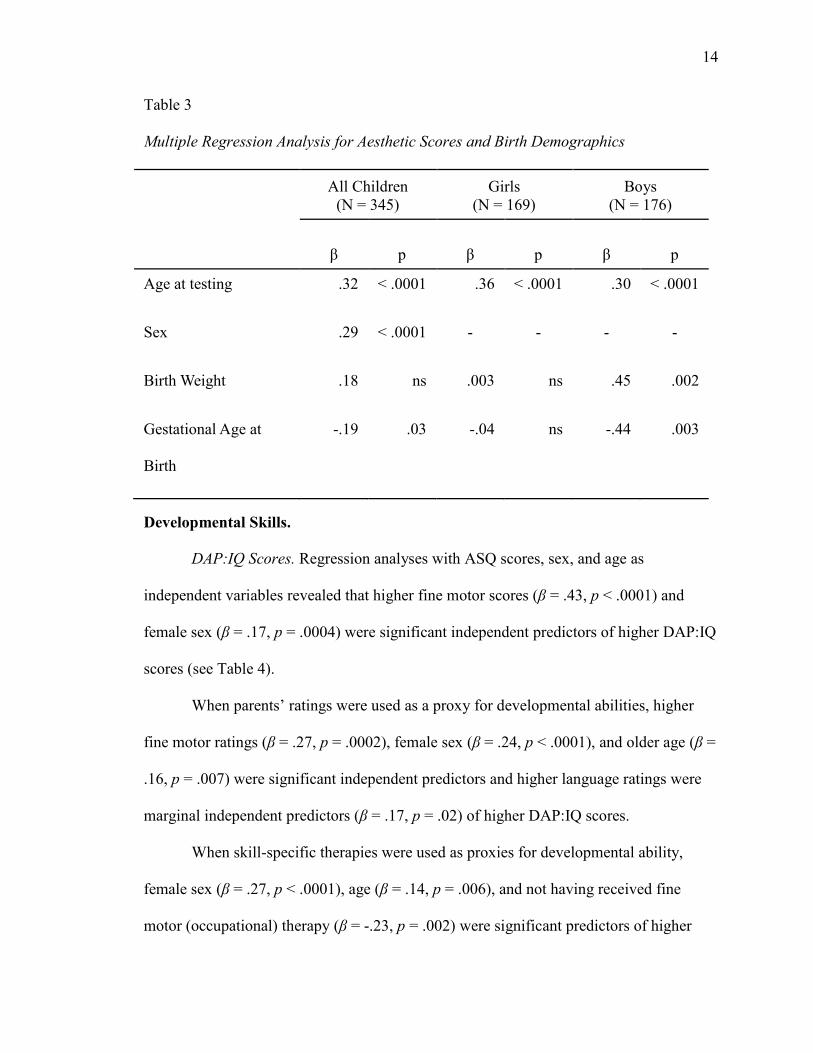
14
Table 3
Multiple Regression Analysis for Aesthetic Scores and Birth Demographics
All Children (N = 345)
Girls (N = 169)
Boys (N = 176)
β p β p β p
Age at testing .32 < .0001 .36 < .0001 .30 < .0001
Sex .29 < .0001 - - - -
Birth Weight .18 ns .003 ns .45 .002
Gestational Age at
Birth
-.19 .03 -.04 ns -.44 .003
Developmental Skills.
DAP:IQ Scores. Regression analyses with ASQ scores, sex, and age as
independent variables revealed that higher fine motor scores (β = .43, p < .0001) and
female sex (β = .17, p = .0004) were significant independent predictors of higher DAP:IQ
scores (see Table 4).
When parents’ ratings were used as a proxy for developmental abilities, higher
fine motor ratings (β = .27, p = .0002), female sex (β = .24, p < .0001), and older age (β =
.16, p = .007) were significant independent predictors and higher language ratings were
marginal independent predictors (β = .17, p = .02) of higher DAP:IQ scores.
When skill-specific therapies were used as proxies for developmental ability,
female sex (β = .27, p < .0001), age (β = .14, p = .006), and not having received fine
motor (occupational) therapy (β = -.23, p = .002) were significant predictors of higher

15
DAP:IQ scores. Surprisingly, having received gross motor (physical) therapy was
marginally associated with higher DAP:IQ scores (β = .14, p = .03).
Table 4
Multiple Regression Analyses comparing DAP:IQ Scores and Ability Assessments
ASQ scores
(N = 345)
Parent rating
(N = 272)
Therapy
(N=345)
β p β p β p
Age at Testing .09 .05 .16 .007 .14 .006
Sex .17 .0004 .24 < .0001 .27 < .0001
Fine Motor .43 < .0001 .27 .0002 -.23 .002
Gross Motor -.10 ns -.02 ns .14 .03
Language .07 ns .17 .02 -.03 ns
Cognitive .06 ns -.09 ns -.0007 ns
Social -.03 ns -.04 ns -.02 ns
Aesthetic Scores. Regression analyses with ASQ scores, sex, and age as
independent variables revealed that age (β = .28, p < .0001), female sex (β = .18, p =
.0001), and higher fine motor scores (β = .36, p < .0001) were independent predictors of
higher aesthetic scores, and that higher cognitive scores were a marginal independent
predictor of higher aesthetic scores (β = .11, p = .047). Interestingly, lower gross motor
scores marginally predicted higher aesthetic scores (β = -.11, p = .03).

16
In the parent rating and therapy regression analyses, no developmental skill was
an independent predictor of aesthetic scores, although in both analyses older age and
female sex predicted higher aesthetic scores (see Table 5).
Table 5
Multiple Regression Analyses comparing Aesthetic Scores and Ability Assessments
ASQ scores
(N = 345)
Parent rating
(N = 272)
Therapy
(N=345)
β p β p β p
Age at Testing .28 < .0001 .32 < .0001 .33 < .0001
Sex .18 .0001 .26 < .0001 .25 < .0001
Fine Motor .36 < .0001 .09 ns -.11 ns
Gross Motor -.11 .03 -.04 ns .04 ns
Language .02 ns .13 ns -.11 ns
Cognitive .11 .047 .04 ns .05 ns
Social .0005 ns .006 ns -.03 ns
Discussion
Demographics. Our findings demonstrate that DAP:IQ performance was
marginally predicted by birth weight for boys, but not for girls. The overall aesthetic
quality of drawings was predicted by both birth weight and gestational age at birth for
boys, but again neither of these predicted the aesthetic quality of girls’ drawings. For all
three measures of developmental skills, higher DAP:IQ scores were predicted by older
age, female sex, and higher measures of fine motor skills; no relationship was found

17
between DAP:IQ scores and measures of cognitive ability. Aesthetic quality of drawings
was consistently predicted by older age and female sex; for ASQ scores only higher
aesthetic quality was predicted by higher fine motor scores and marginally predicted by
higher cognitive scores. Lower gross motor scores marginally predicted higher aesthetic
quality.
Consistent with Schepers et al. (2012), a sex difference was found such that
females outperformed males on both drawing measures. Although we found that low
birth weight was a risk factor for low DAP scores in boys (but not girls), contrary to the
findings of Schepers et al. (2012) gestational age was not an independent predictor of
either boys’ or girls’ DAP:IQ scores in the current study.
This discrepancy may reflect a number of methodological differences between the
current study and that of Schepers et al. (2012). First, age was a strong predictor of
drawing performance in our study, yet the Schepers et al. did not assess the potential
contribution of age. Second, Schepers’ preterm children were chronologically 4 months
younger than their full term children. This coupled with the fact that they did not correct
for prematurity means that Schepers’ preterm children were biologically 7 months
younger than their full term children. Third, the discrepancy may reflect that Schepers et
al. performed categorical analyses of very preterm (gestational age < 32 weeks) vs. full
term children’s DAP scores, whereas we performed multiple regression analyses. Fourth,
they did not include sex as a factor in the model despite finding significant sex
differences in a separate analysis. Finally, the discrepancy between our findings and that
of Schepers et al. may reflect that birth weight was not included in their analysis, but was
included in ours.

18
Another discrepancy between the current study and that of Schepers et al. (2012)
is that, whereas we found no relationship between cognitive development and DAP
performance, Schepers et al. found a relationship between a combined measure of
cognitive and motor development and drawing ability. Schepers et al. used motor
development indices (Bayley Developmental Scales [BOS 2-30], Van der Meulen &
Smrkovsky, 1983; Movement Assessment Battery for Children [M-ABC], Smits-
Engelsman, 1992) that collapse gross and fine motor development into one measure. In
our study, gross motor development had no impact on DAP:IQ scores. For aesthetic
scores, gross motor development had a marginally negative impact on aesthetic quality.
Given these findings, it is possible Schepers et al. found that cognitive and motor
development predicted drawing ability because the independent contribution of fine
motor development was not assessed, and the contribution of fine motor development in
the motor development indices they used may have been attenuated by the gross motor
portions of said assessments. Our findings suggest that measures of fine motor skills and
gross motor skills should not be collapsed when assessing the contribution of motor
development to drawing performance.
Skills Tapped by Drawing. For all three types of developmental measures,
DAP:IQ scores were related to fine motor ability and not cognitive ability. Why then
have some reported that DAP scores are good measures of non-verbal IQ? It is possible
that cognitive ability and drawing ability develop in parallel,8 in which case previous
research may have found an association between human figure drawing and intelligence
because other abilities were not included in the comparison. This possibility can be
8 See Leslie & Thaiss (1992) for a similar argument regarding an illusory relationship between the
development of drawing ability and theory of mind development.

19
illustrated using our data: when multiple regression analysis were conducted with
DAP:IQ as the dependent variable and age, sex, and ASQ cognitive scores as the
independent variables, higher cognitive ability strongly predicted higher DAP:IQ scores
(β = .21, p < .0001). However, when the same analysis was repeated with the addition of
ASQ fine motor scores as an independent variable, the predictive contribution of
cognitive ability disappeared entirely (β = .04, p = .44). This is not to say that there are
no cognitive aspects of drawing, or that drawings cannot be used to assess any aspect of
cognition. Rather, it indicates that human figure drawing tasks like the DAP that are
designed to measure general intelligence are not primarily tapping cognitive ability,
despite claims to the contrary.
Another possibility raised by Imuta et al. (2013) is that portions of the IQ tasks
administered by Reynolds & Hickman (2004) and the DAP:IQ task capture similar
abilities, but the relationship between the full scale IQ scores and DAP:IQ performance
are nonexistent or weak. Recall that they only found a relationship between DAP:IQ
scores and the WPPSI-III Coding subtest, which involves identifying and drawing shapes
(Wechsler, 2002). Imuta et al. found that the relationship between DAP:IQ scores and
scores on the Coding subtest was sufficient to drive an apparent relationship between
DAP:IQ scores and WPPSI-III full scale IQ scores. A skeptical interpretation would be
that it is entirely unsurprising; it only shows that both tasks require drawing and therefore
tap the same abilities. In the interest of fairness, the Coding subtest of the WPPSI-III is
one of several subtests designed to assess nonverbal (or performance) intelligence. Such
tasks are useful for avoiding cultural biases and working with atypical populations (e.g.,
mentally impaired or language delayed individuals), but as Motta et al. (1993) argue, the
20
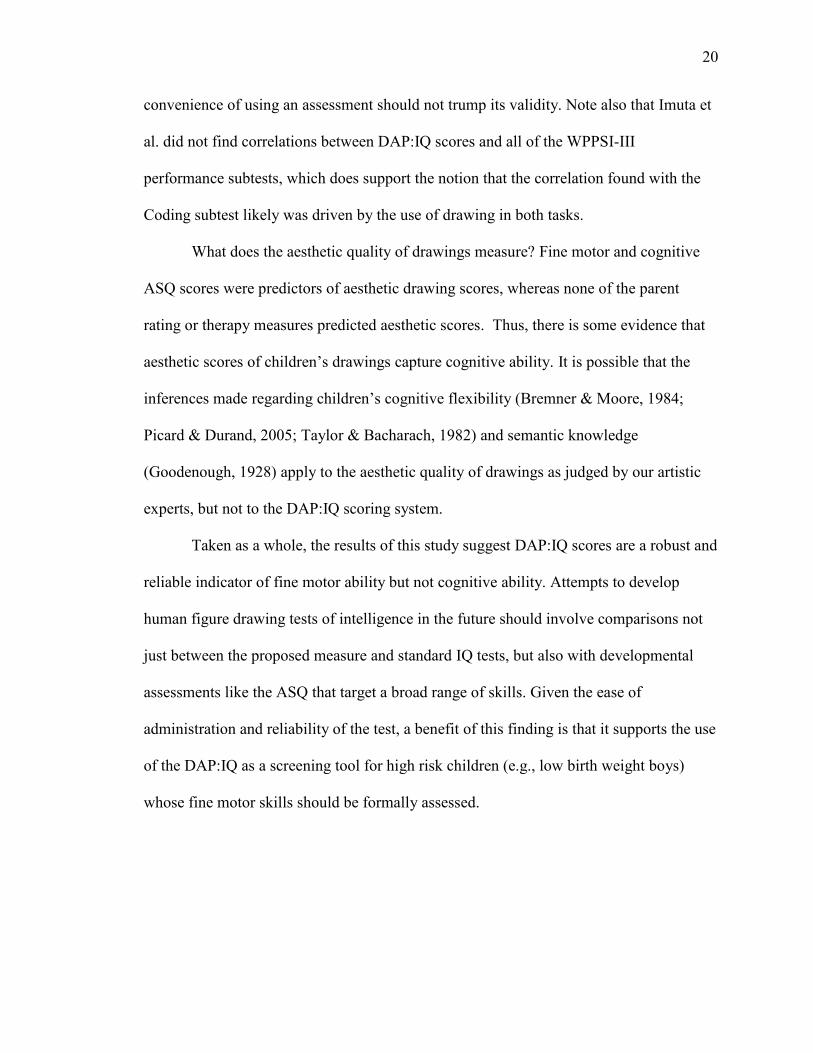
convenience of using an assessment should not trump its validity. Note also that Imuta et
al. did not find correlations between DAP:IQ scores and all of the WPPSI-III
performance subtests, which does support the notion that the correlation found with the
Coding subtest likely was driven by the use of drawing in both tasks.
What does the aesthetic quality of drawings measure? Fine motor and cognitive
ASQ scores were predictors of aesthetic drawing scores, whereas none of the parent
rating or therapy measures predicted aesthetic scores. Thus, there is some evidence that
aesthetic scores of children’s drawings capture cognitive ability. It is possible that the
inferences made regarding children’s cognitive flexibility (Bremner & Moore, 1984;
Picard & Durand, 2005; Taylor & Bacharach, 1982) and semantic knowledge
(Goodenough, 1928) apply to the aesthetic quality of drawings as judged by our artistic
experts, but not to the DAP:IQ scoring system.
Taken as a whole, the results of this study suggest DAP:IQ scores are a robust and
reliable indicator of fine motor ability but not cognitive ability. Attempts to develop
human figure drawing tests of intelligence in the future should involve comparisons not
just between the proposed measure and standard IQ tests, but also with developmental
assessments like the ASQ that target a broad range of skills. Given the ease of
administration and reliability of the test, a benefit of this finding is that it supports the use
of the DAP:IQ as a screening tool for high risk children (e.g., low birth weight boys)
whose fine motor skills should be formally assessed.

21
Appendix
Aesthetic Scoring Criteria
Score Criteria
0 No identifiable person/figure, random dots or patterns only
1 Some identifiable person or figure, in whole or in part
2 Meets criteria for 1 but resembles a complete human form and is cleanly
drawn
3 Minimal stick-figure representations, proportions are not haphazard and
lines are clean
4 Has fairly detailed clothing, hair, etc.
5 Cartoonish in appearance, body proportions are nearly appropriate for a
human figure
6 Proportional features appropriate for a human figure
7 Shows detailed facial features, figure is well-drawn
8 Very well drawn, features are slightly realistic
9 Somewhat realistic drawing with some flaws that reduce realism
10 A fairly realistic drawing
22
Bibliography
Abell, S. C., Wood, W., & Liebman, S. J. (2001). Children's human figure drawings as
measures of intelligence: the comparative validity of three scoring systems.
Journal of Psychoeducational Assessment, 19(3), 204-215.
Arden, R., Trzaskowski, M., Garfield, V., & Plomin, R. (2014). Genes influence young
children's human figure drawing and their association with intelligence a decade
later. Psychological Science, 25(10), 1843-1850.
Bardos, A. N. (1993). Human figure drawings: Abusing the abused. School Psychology
Quarterly, 8(3), 177-181.
Bleichrodt, N., Drenth, P. J., Zaal, J. N., & Resing, W. C. (1984). Revision Amsterdam
Child Intelligence Test. Lisse: Swets & Zeitlinger.
Bremner, J. G., & Moore, S. (1984). Prior visual inspection and object naming: Two
factors that enhance hidden feature inclusion in young children's drawings. British
Journal of Developmental Psychology, 2(4), 371-376.
Ezenwosu, O., Emodi, I., Ikefuna, A., & Chukwu, B. (2013). Academic performance and
intelligence scores of primary school-aged children with sickle cell anemia.
Pediatric Hematology and Oncology, 30, 733-741.
Goodenough, F. (1926). Measurement of Intelligence by Drawings. Oxford, England:
World Book Co.
Goodenough, F. (1928). Studies in the psychology of children's drawings. Psychological
Bulletin, 25(5), 272.
Goodenough, F., & Harris, D. B. (1963). The Goodenough-Harris Drawing Test. New
York: Harcourt, Brace, and World.
Gresham, F. M. (1993). "What's wrong in this picture?": Response to Motta et al.'s
review of human figure drawings. School Psychology Quarterly, 8(3), 182-186.
Holtzman, W. H. (1993). An unjustified, sweeping indictment by Motta et al. of human
figure drawings for assessing psychological functioning. School Psychology
Quarterly, 8(3), 189-190.
Imuta, K., Scarf, D., Pharo, H., & Hayne, H. (2013). Drawing a close to the use of human
figure drawings as a projective measure of intelligence. PLoS ONE, 8(3), e58991.
Kamphaus, R. W. (1993). Comment on "the use and abuse of human figure drawings".
School Psychology Quarterly, 8(3), 187-188.
Knoff, H. M. (1993). The utility of human figure drawings in personality and intellectual
assessment: Why ask why? School Psychology Quarterly, 8(3), 191-196.

23
Laak, J. ter, de Goede, M., Aleva, A., & van Rijswijk, P. (2005). The Draw-A-Person
test: An indicator of children's cognitive and socioemotional adaptation? The
Journal of Genetic Psychology, 166(1), 77-93.
Leslie, A., & Thaiss, L. (1992). Domain specificity in conceptual development:
Neuropsychological evidence from autism. Cognition, 43, 225-251.
Motta, R. W., Little, S. G., & Tobin, M. I. (1993a). The use and abuse of human figure
drawings. School Psychology Quarterly, 8(3), 162-169.
Motta, R. W., Little, S. G., & Tobin, M. I. (1993b). A picture is worth less than a
thousand words: Response to reviewers. School Psychology Quarterly, 8(3), 197-
199.
Naglieri, J. A. (1988). Draw A Person: A Quantitative Scoring System. San Antonio,
Texas: Psychological Corporation.
Naglieri, J. A. (1993). Human figure drawings in perspective. School Psychology
Quarterly, 8(3), 170-176.
Naglieri, J. A., MacNeish, T. J., & Bardos, A. (1991). Draw a Person: Screening
Procedure for Emotional Disturbance; DAP: SPED. Austin, Texas: Pro-Ed.
Picard, D., & Durand, K. (2005). Are young children's drawings canonically based?
Journal of Experimental Child Psychology, 90, 48-64.
Reynolds, C. R., & Hickman, J. A. (2004). Draw-A-Person Intellectual Ability Test for
Children, Adolescents, and Adults: Examiner's manual. Austin, Texas: Pro-Ed.
Reynolds, C. R., & Kamphaus, R. W. (2003). Reynolds Intellectual Assessment Scales.
Lutz, Florida: Psychological Assessment Resources.
Schepers, S., Deković, M., & Feltze, M. (2012). Drawings of very preterm-born children
at 5 years of age: A first impression of cognitive and motor development?
European Journal of Pediatrics, 171, 43-50.
Smits-Engelsman, B. M. (1992). Movement ABC; Dutch Guide. Lisse: Swets and
Zeitlinger.
Taylor, M., & Bacharach, V. R. (1982). Constrains on the visual accuracy of drawings
produced by young children. Journal of Experimental Child Psychology, 34, 311-
329.
Toomela, A. (2002). Drawing as a verbally mediated activity: A study of relationships
between verbal, motor, and visuospatial skills and drawing in children.
International Journal of Behavioral Development, 26(3), 234-247.

24
Van der Meulen, B. F., & Smrkovsky, M. (1983). BOS 2-30: Bayley Developmental
Scales. Lisse: Swets and Zeitlinger.
Wechsler, D. (1991). The Wechsler Intelligence Scale for Children (third ed.). San
Antonio, Texas: The Psychological Corporation.
Wechsler, D. (1999). Wechsler Abbreviated Scale of Intelligence. San Antonio, Texas:
The Psychological Corporation.
Wechsler, D. (2002). Wechsler Preschool and Primary Scale of Intelligence (Third ed.).
San Antonio, Texas: The Psychological Corporation.
Weschler, D. (1974). Weschler Intelligence Scale for Children-Revised. San Antonio,
Texas: The Psychological Corporation.
Williams, T. O., Fall, A. M., Eaves, R. C., & Woods-Groves, S. (2006). The reliability of
scores for the Draw-A-Person intellectual ability test for children, adolescents,
and adults. Journal of Psychoeducational Assessment, 24, 137-144.