gwinnett comprehensive accountability and assessment system georgia’s changing landscape april...
TRANSCRIPT
Gwinnett Comprehensive Accountability and Assessment System
Georgia’s Changing Landscape
April 2014

Assessment Update
• This update pertains to anticipated changes to Georgia’s Student Assessment Program for the future.– As more information and details become
available, we will follow-up to keep everyone informed.
• Please Note: This update does not pertain to assessments administered this school year.

Federal Requirements
• Based on College & Career Ready standards and expectations
• Assessments in grades 3 – 8 and high school– capable of measuring student growth over the course
of the academic year– accessible for all students, including SWD and EL
• Administer no later than 2014 – 2015

A New Assessment System
Comprehensive– single program, not series of tests (e.g., CRCT; EOCT; WA)
Coherent – consistent expectations and rigor to position Georgia students to
compete with peers nationally and internationally– consistent signal about student preparedness for the next level,
be it the next grade, course, or college/career– consistent signal about student achievement both within system
(across grades and courses) and with external measures (NAEP; PSAT; SAT; ACT)
Consolidate– will combine reading, language arts, and writing into a single
measure to align to the standards

Coherency – Consistency
Achievement of Georgia Students in Mathematics
2013•NAEP – Grade 8: 29% at/above proficient•CRCT – Grade 8: 83% met/exceeded•Coordinate Algebra EOCT: 37% met/exceeded•SAT – Class of 2013: 42% college ready benchmark*
•ACT – Class of 2013: 38% college ready benchmark**
2012•PSAT – sophomores: 37% on track to be CCR
*SAT data represent 71% of Class of 2013**ACT data represent 51% of Class of 2013
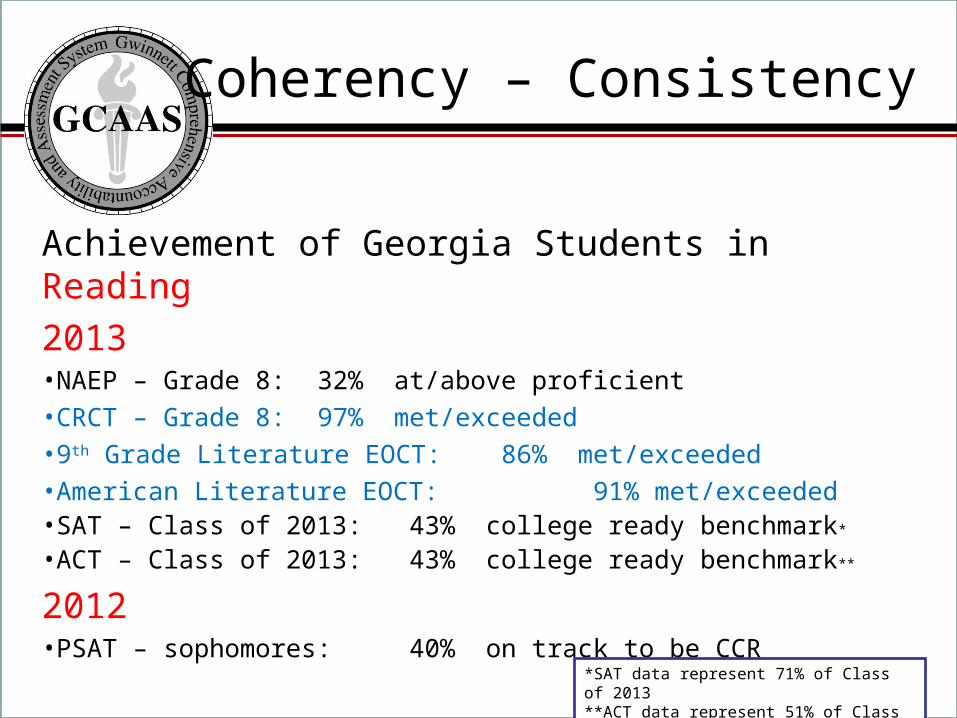
Coherency – Consistency
Achievement of Georgia Students in Reading
2013•NAEP – Grade 8: 32% at/above proficient•CRCT – Grade 8: 97% met/exceeded•9th Grade Literature EOCT: 86% met/exceeded•American Literature EOCT: 91% met/exceeded•SAT – Class of 2013: 43% college ready benchmark*
•ACT – Class of 2013: 43% college ready benchmark**
2012•PSAT – sophomores: 40% on track to be CCR
*SAT data represent 71% of Class of 2013**ACT data represent 51% of Class of 2013

Lexiles

Lexiles

Georgia’s New Assessment System
As we begin to build a new assessment system, the plan is:
to consolidate reading, language arts, and writing into a single measure to align to the standards;
to embed norm-referenced items to provide a national comparison; to share items with other states; to align expectations with other external measures to send
consistent signal of how Georgia students are doing compared to their peers; and
to involve USG and TCSG in the development to ensure the assessments signal college and career readiness.

Georgia’s Plan
• To accomplish this plan, Georgia must:– include a variety of item types – more than
just multiple choice;– increase expectations for student learning and
achievement; and– continue to – and accelerate – transition to
online administration

Guiding principles stipulate the new system must:be sufficiently rigorous to ensure Georgia students are well positioned to compete with other students across the United States and internationally; be intentionally designed across grade levels to send a clear signal of student progress/growth and preparedness for the next level, be it the next grade level, course, or college or career;be accessible to all students, including those with disabilities or limited English proficiency, at all achievement levels; support and inform educator effectiveness initiatives, ensuring items and forms are appropriately sensitive to quality instructional practices; and accelerate the transition to online administration, allowing – over time – for the inclusion of innovative technology-enhanced items.
Georgia’s New Assessment System

Knowns and Partial Knowns
Knowns
•New program‒ end of grade/end of course‒ will include language arts,
mathematics, science, social studies‒ will no longer be solely multiple-
choice•IT requirements – follows PARCC•Online transition over time
- Year 1 (30% online)- Year 3 (80% online)- Year 5 (100% online)
•Accommodations•CRCT-M discontinued•Growth (SGPs) will continue•Georgia educators will be involved in design/development
Partial Knowns
•Test blueprint•Testing windows•Administration protocols•Reporting timelines
‒ scores will be delayed in year 1 due to technical work and standard setting
‒ requirement to hand-score some items may impact ability to report as quickly as we have in the past
•Timing of ancillary material availability (i.e. Study Guides, Content Weights)•Impact of the review of content standards•Calculator policy specifics

Resources
• Even with many of the specifics of the new assessment system unknown at this time, there are many, many resources that will prepare educators and students:– Content standards
• frameworks, formative lessons, PARCC evidence statements
– Sample items: PARCC; SBAC; Georgia OAS; other states (KY, NY); NAEP released items
– CRCT Readiness Indicators– Lexiles

CRCT Readiness Indicators:Reading, ELA, Mathematics
For instructional planning and decision making:Indicators were designed to send a signal to stakeholders about where students are relative to where they need to be headedIndicators provide feedback about our preparedness for the increase in rigor and expectation for student achievement that is on the horizonFeedback consists of the percent of students who achieved each readiness level – state , district, and school levels

• For accountability purposes - at the student (promotion/retention), school, district, and state levels (CCRPI) - we will continue to use 800 and 850 for the 2013-2014 school year.
• It is strongly advised, however, that schools use the scale scores associated with the Readiness Indicators as targets - we need to be working actively to get students to these levels because we believe the new tests will be more in line with those expectations than the 800 / 850.
• The readiness indicators will be provided during the interim as additional feedback to districts and schools so they have "better" information about where students are in relation to where they need to be in 2014-2015 (with the increased rigor). Bottom line: shooting for 800 isn't going to be sufficient in future years.
CRCT Readiness Indicators:Reading, ELA, Mathematics

Formative Assessment InitiativesBringing a Balanced Assessment Focus to the Classroom
1600 new items loaded
Statewide launch in summer 2013
Phase I available February 2014; Phase II pilot in winter 2014

Formative Assessment Pilot
• GCPS was a participant in Phase 1 and 2 as RT3 district• Approximately 40 schools from GCPS participated in
each phase• Included grades 3 – 8 and high school in all core content
areas• Both phases were administered primarily online• Four item types included: selected response, short
answer, constructed response, and performance task

Stimulus: I f the stimulus is to contain art, complete the art page provided. I n the stimulus box below place the art where applicable
Please read both selections below and then answer the questions that follow.
Bacterial Warfare
We are at war with bacteria! We are using antibacterial sprays to disinfect surfaces, antibacterial soaps to wash our dishes, clothes, and bodies, and now we even carry little bottles of antibacterial gel called hand sanitizer so that we can clean our hands when soap and water are not available! We are so determined to kill the bacteria in our environment because they are germs and germs are bad, right? Well, that is not entirely true. While some bacteria can be harmful, others are actually helpful. Bacteria are unicellular organisms that can enter and reproduce inside of other organisms, called host organisms. Some bacteria infect their host organism by attacking cells or producing toxins that make the host sick. Bacteria are responsible for causing illnesses and diseases such as strep throat, ear infections, and food poisoning in humans and other animals. Disease-causing bacteria are the true germs, and they are the bacteria we are attempting to kill with all of our antibacterial cleaning products and antibiotic medications. However, some of these cleaning products are killing bacteria that are beneficial to the environment in which they live. The anti-bacterial cleaning products we use can enter our water systems and can seep into the ground. Even the medications we take can kill helpful bacteria that we need in order to keep our bodies functioning properly. There are bacteria that live in our bodies and help us to digest our food. Scientists have found many ways to use bacteria for helping people and the environment. Medical experts make medicines and vaccines from bacteria. They even use some types of bacteria to make antibiotics that help kill harmful bacteria. We also use bacteria to help clean up oil spills and to purify dirty water. Nitrogen-fixing bacteria live in the soil and in the roots of some plants where they create a kind of nitrogen that the plants can use for nourishment. These plants then make proteins that we can eat. Other beneficial types of bacteria that live in the soil are decomposers, meaning that they get their food by decomposing or breaking down dead organisms. Without decomposers like bacteria, the Earth would be covered with piles of dead plant and animal matter. Knowing that there are so many good, helpful bacteria living among us, maybe we should reconsider the war we are waging against these so-called germs.
I rradiated Food
"I am afraid that the experiments you quote, M. Pasteur, will turn against you. The world into which you wish to take us is really too fantastic."
Sample Performance Task: ELA
Students may be required to examine paired passages to make comparisons and connections
Passage 1

Sample Performance Task: ELA
Passage 2

Sample Performance Task: ELA
Question based on passages 1 and 2

Sample Performance Task: Math

ELA Phase I Pilot Summary Data
Grade
Number and Percent of Students Achieving Each Score PointTotal student
N/ % 0 1 2 3 4
3 475 1613 713 202 45 3048
15.60% 52.90% 23.40% 6.60% 1.50% 100%4 323 1518 814 199 83 2937
11.00% 51.70% 27.70% 6.80% 2.80% 100%5 367 1100 901 518 125 3011
12.20% 36.50% 29.90% 17.20% 4.20% 100%6 155 960 811 418 111 2455
6.30% 39.10% 33.00% 17.00% 4.50% 100%7 218 1387 1275 617 146 3643
6.00% 38.10% 35.00% 16.90% 4.00% 100%8 264 1140 1029 338 89 2860
9.20% 39.90% 36.00% 11.80% 3.10% 100%9 - 10 175 1016 783 361 81 2416
7.20% 42.10% 32.40% 14.90% 3.40% 100%11 - 12 376 1018 763 196 46 2399
15.70% 42.40% 31.80% 8.20% 1.90% 100%

Grade
Number and Percent of Students Achieving Each Score Point
Total Student N/ %0 1 2 3 4
3 812 1107 762 174 26 2881
28.18% 38.42% 26.45% 6.04% 0.90% 100%
4 906 1145 765 168 63 3047
29.73% 37.58% 25.11% 5.51% 2.07% 100%
5 839 948 1294 537 183 3801
22.07% 24.94% 34.04% 14.13% 4.81% 100%
6 626 1467 1028 408 86 3615
17.32% 40.58% 28.44% 11.29% 2.38% 100%
7 695 1002 1035 515 140 3387
20.52% 29.58% 30.56% 15.21% 4.13% 100%
8 1116 1534 827 391 80 3948
28.27% 38.86% 20.95% 9.90% 2.03% 100%
9 - 10 1262 1816 559 106 9 3752
33.64% 48.40% 14.90% 2.83% 0.24% 100%
11 - 12 739 1389 1175 388 131 3822
19.34% 36.34% 30.74% 10.15% 3.43% 100%
ELA Phase II Pilot Summary Data

Mathematics Phase I Pilot Summary Data
Grade Number and Percent of Students Achieving Each Score Point Total student N/ %
0 1 2 3 4 3 771 667 373 81 36 1928
40.00% 34.60% 19.30% 4.20% 1.90% 100%4 795 800 360 87 58 2100
37.90% 38.10% 17.10% 4.10% 2.80% 100%5 548 513 252 124 44 1481
37.00% 34.60% 17.00% 8.40% 3.00% 100%6 927 768 269 65 14 2043
45.40% 37.60% 13.20% 3.20% 0.70% 100%7 896 632 243 62 11 1844
48.60% 34.30% 13.20% 3.40% 0.60% 100%8 984 791 314 100 51 2240
43.90% 35.30% 14.00% 4.50% 2.30% 100%9-10 798 697 186 45 27 1753
45.50% 39.80% 10.60% 2.60% 1.50% 100%11-12 690 602 178 63 9 1542
44.70% 39.00% 11.50% 4.10% 0.60% 100%

Grade
Number and Percent of Students Achieving Each Score Point
Total Student N / %0 1 2 3 4
3 1378 1152 539 121 47 3237
42.57% 35.59% 16.65% 3.74% 1.45% 100%
4 1323 1264 325 83 25 3020
43.81% 41.85% 10.76% 2.75% 0.83% 100%
5 1351 1049 391 64 15 2870
47.07% 36.55% 13.62% 2.23% 0.52% 100%
6 1579 1171 370 135 53 3308
47.73% 35.40% 11.19% 4.08% 1.60% 100%
7 1602 856 219 72 36 2785
57.52% 30.74% 7.86% 2.59% 1.29% 100%
8 1529 1049 619 217 88 3502
43.66% 29.95% 17.68% 6.20% 2.51% 100%
9 - 12 2570 1435 299 59 23 4386
58.60% 32.72% 6.82% 1.35% 0.52% 100%
Mathematics Phase II Pilot Summary Data

Key Findings from Pilots: Open-Ended Items
• Overall performance shortfalls– Students are not familiar with these types of items
• Many respond “dnk” – as in ‘do not know’• Didn’t know how to approach the items or how to organize (show)
their responses/answers
– Didn’t seem to understand the need to “show” their work, detail their thoughts, rationales, cite evidence to support their answer or claim
• Tendency is to cite answer only – as if they were multiple-choice items
– Didn’t read carefully and answer all parts of the question– Didn’t answer all parts of questions or label appropriately
Where is GCPS Now?
• Communication through webinars, school visits, cluster meetings, Test Coordinator meetings, weekly updates (C&I and A&A)
• Instructional Readiness cuts • Collaboration with C&I• Resources for schools – sample items,
anchors, and rubrics• Formative Instructional Practices Modules