h & m hennes & mauritz nine-month report q3 2021
TRANSCRIPT
H & M Hennes & Mauritz AB
Nine-month report
Nine months (1 December 2020 – 31 August 2021)
• The H&M group’s net sales in local currencies increased by 13 percent in the first nine months of the financial year compared with the corresponding period last year. Converted into SEK the group’s net sales amounted to SEK 142,154 m (134,482). The pandemic led to reduced footfall as a result of continued restrictions and store closures. At the most, around 1,800 stores were temporarily closed.
• Profit after financial items increased to SEK 8,297 m (-1,613). The group’s profit after tax amounted to SEK 6,389 m (-1,242), corresponding to SEK 3.86 (-0.75) per share.
• Cash flow from operating activities increased to SEK 37,210 m (15,995).
• Financial net cash increased to SEK 24,874 m (-5,853). Cash and cash equivalents plus undrawn credit facilities amounted to SEK 55,408 m (41,413).
Third quarter (1 June 2021 – 31 August 2021)
• The H&M group’s net sales in local currencies increased by 14 percent in the third quarter 2021 compared with the corresponding period last year. Converted into SEK net sales increased to SEK 55,585 m (50,870). At the start of the quarter around 180 stores were temporarily closed and at the end around 100 stores remained closed.
• Online sales increased by 22 percent in local currencies and 17 percent in SEK. Store sales have started to recover as restrictions have been eased in many markets.
• Gross profit increased by 19 percent to SEK 29,559 m (24,851). This corresponds to a gross margin of 53.2 percent (48.9).
• Profit after financial items increased by 158 percent to SEK 6,093 m (2,365).
• The operating margin was 11.3 percent (5.3).
• Profit after tax increased to SEK 4,692 m (1,821), corresponding to SEK 2.83 (1.10) per share.
• The stock-in-trade decreased to SEK 36,867 m (42,076).
• The board of directors is proposing that a cash dividend of SEK 6.50 per share is paid in November 2021. This is based on significantly improved profitability, a strong financial position with financial net cash of SEK 24,874 m, more stable market conditions and a good outlook. There has been no resolution on a dividend since spring 2019. A dividend proposal in January 2020 was withdrawn in March 2020 due to the pandemic.
• The new autumn collections have been well received. Sales in September 2021 were slightly higher than in the corresponding month the previous year in local currencies, even though demand was not able to be fully met because of disruption and delays in product flow. Currently around 50 stores are temporarily closed.
• H&M online will launch in Chile in autumn 2021 and in Peru, Colombia and Uruguay in the first half of 2022.
• Five new H&M markets will launch in 2022. Ecuador, North Macedonia and Kosovo, and via franchise in Costa Rica and Cambodia.
“The H&M group’s increase in profit for the quarter is mainly a result of well-received collections with more full-price sales, lower markdowns and good cost control. With our continued transformation and our well-positioned customer offering we are optimistic that we will see long-term, profitable and sustainable growth for the H&M group,” says Helena Helmersson, CEO.
Q3
Financial net cash
SEK 24,874 m 31 August 2021
Cash flow from operating activities
SEK 37,210 m Nine months 2021
Profit after financial items
SEK 6,093 m Third quarter 2021

Nine-month report 2021 (1 Dec 2020 – 31 Aug 2021)
2
Comments by Helena Helmersson, CEO
“The H&M group’s increase in profit shows that the strong recovery is continuing – despite sales being partly affected by restrictions and delays associated with the pandemic. The results are explained by much-appreciated collections, lower markdowns and good cost control combined with the initiatives implemented in areas such as tech and the supply chain. As restrictions have been eased in many markets store sales have started to pick up again, all while online sales have continued to grow.
To further strengthen our competitiveness the group continues to work to constantly improve both the customer offering and the customer experience in response to customers’ increased expectations, such as being able to shop in a smooth and convenient way – when, where and how they choose.
Our customer offering makes it possible for many to access sustainable fashion and express their own personal style. Our financial strength and long-term approach give us the ability to invest in innovations within tech development, materials and sustainable initiatives, with an ambition to lead the change in the fashion industry towards becoming circular and renewable. This was recognised recently when the H&M group was named as the only retail company in the world to live up to the UN Global Compact sustainability principles.
The pandemic and its consequences are not yet over and we are humbled by the many challenges in the world around us that affect our business, which call for a high level of flexibility and drive. We have quickly adapted by prioritising cash flow, cost control and flexibility. With our continued transformation and our well-positioned customer offering – to meet customers’ ever increasing expectations of good value and sustainable fashion – we are optimistic that we will see long-term, profitable and sustainable growth for the H&M group.”
Read more about our initiatives in the section Initiatives for an improved customer experience on page 12.
Nine-month report 2021 (1 Dec 2020 – 31 Aug 2021)
3
Sales
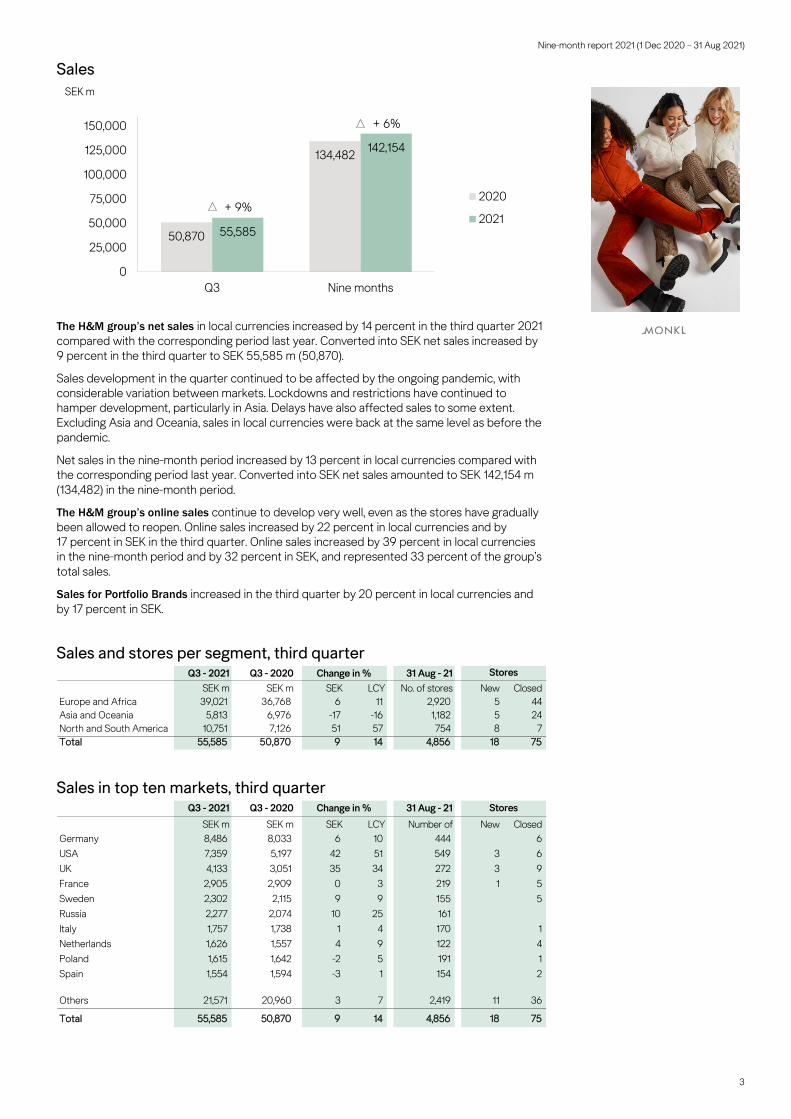
The H&M group’s net sales in local currencies increased by 14 percent in the third quarter 2021 compared with the corresponding period last year. Converted into SEK net sales increased by 9 percent in the third quarter to SEK 55,585 m (50,870).
Sales development in the quarter continued to be affected by the ongoing pandemic, with considerable variation between markets. Lockdowns and restrictions have continued to hamper development, particularly in Asia. Delays have also affected sales to some extent. Excluding Asia and Oceania, sales in local currencies were back at the same level as before the pandemic.
Net sales in the nine-month period increased by 13 percent in local currencies compared with the corresponding period last year. Converted into SEK net sales amounted to SEK 142,154 m (134,482) in the nine-month period.
The H&M group’s online sales continue to develop very well, even as the stores have gradually been allowed to reopen. Online sales increased by 22 percent in local currencies and by 17 percent in SEK in the third quarter. Online sales increased by 39 percent in local currencies in the nine-month period and by 32 percent in SEK, and represented 33 percent of the group’s total sales.
Sales for Portfolio Brands increased in the third quarter by 20 percent in local currencies and by 17 percent in SEK.
Sales and stores per segment, third quarter
Sales in top ten markets, third quarter
50,870
134,482
55,585
142,154
+ 9%
+ 6%
0
25,000
50,000
75,000
100,000
125,000
150,000
Q3 Nine months
SEK m
2020
2021
Q3 - 2021 Q3 - 2020 31 Aug - 21SEK m SEK m SEK LCY No. of stores New Closed
Europe and Africa 39,021 36,768 6 11 2,920 5 44Asia and Oceania 5,813 6,976 -17 -16 1,182 5 24North and South America 10,751 7,126 51 57 754 8 7Total 55,585 50,870 9 14 4,856 18 75
Change in % Stores
Q3 - 2021 Q3 - 2020 31 Aug - 21SEK m SEK m SEK LCY Number of
New Closed
Germany 8,486 8,033 6 10 444 6USA 7,359 5,197 42 51 549 3 6UK 4,133 3,051 35 34 272 3 9France 2,905 2,909 0 3 219 1 5Sweden 2,302 2,115 9 9 155 5Russia 2,277 2,074 10 25 161Italy 1,757 1,738 1 4 170 1Netherlands 1,626 1,557 4 9 122 4Poland 1,615 1,642 -2 5 191 1Spain 1,554 1,594 -3 1 154 2
Others 21,571 20,960 3 7 2,419 11 36
Total 55,585 50,870 9 14 4,856 18 75
Change in % Stores

Nine-month report 2021 (1 Dec 2020 – 31 Aug 2021)
4
Gross profit and gross margin Gross profit and gross margin are a result of many factors, internal as well as external, and are mostly affected by the decisions that the H&M group takes in line with its strategy to always have the best customer offering in each individual market – based on the combination of fashion, quality, price and sustainability.
Gross profit increased by 19 percent to SEK 29,559 m (24,851) in the third quarter, corresponding to a gross margin of 53.2 percent (48.9). For the nine-month period, gross profit increased to SEK 73,665 m (66,169), corresponding to a gross margin of 51.8 percent (49.2).
Costs for markdowns in relation to sales decreased by around 2,5 percentage points in the third quarter of 2021 compared with the same quarter the previous year. This is a result of a combination of much-appreciated collections and successful transformation, as well as other initiatives – particularly within tech and the supply chain.
Despite substantially higher shipping and raw materials prices, for the third quarter the market situation as regards external factors that influence purchasing costs was slightly positive overall compared with the same purchasing period the previous year. Increased prices for shipping and raw materials were offset by a more advantageous US dollar exchange rate.
As the positive US dollar effect subsides and the high shipping and raw materials prices remain, the overall market situation for purchasing costs in the fourth quarter will gradually become less positive.
24,851
66,169
29,559
73,665
0
15,000
30,000
45,000
60,000
75,000
Q3 Nine months
SEK m
2020
202148.9% 53.2%
51.8%49.2%
Nine-month report 2021 (1 Dec 2020 – 31 Aug 2021)
5
Selling and administrative expenses
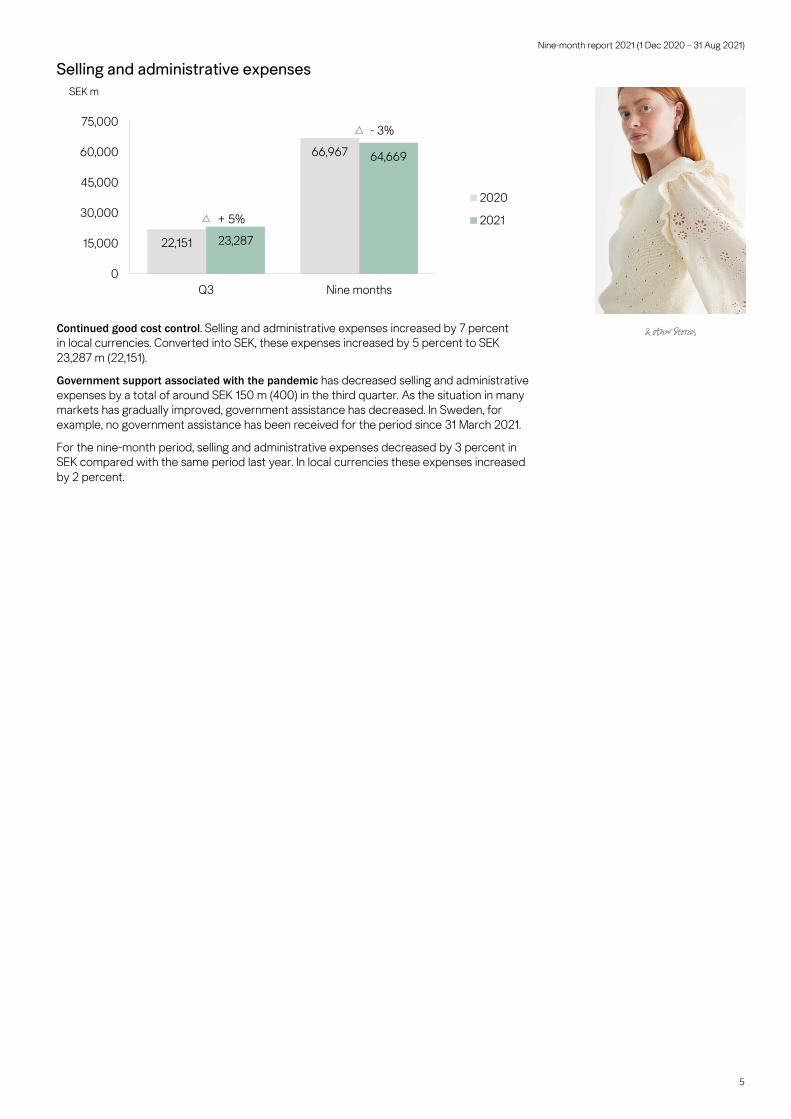
Continued good cost control. Selling and administrative expenses increased by 7 percent in local currencies. Converted into SEK, these expenses increased by 5 percent to SEK 23,287 m (22,151).
Government support associated with the pandemic has decreased selling and administrative expenses by a total of around SEK 150 m (400) in the third quarter. As the situation in many markets has gradually improved, government assistance has decreased. In Sweden, for example, no government assistance has been received for the period since 31 March 2021.
For the nine-month period, selling and administrative expenses decreased by 3 percent in SEK compared with the same period last year. In local currencies these expenses increased by 2 percent.
22,151
66,967
23,287
64,669
+ 5%
- 3%
0
15,000
30,000
45,000
60,000
75,000
Q3 Nine months
SEK m
2020
2021
Nine-month report 2021 (1 Dec 2020 – 31 Aug 2021)
6
Profit after financial items
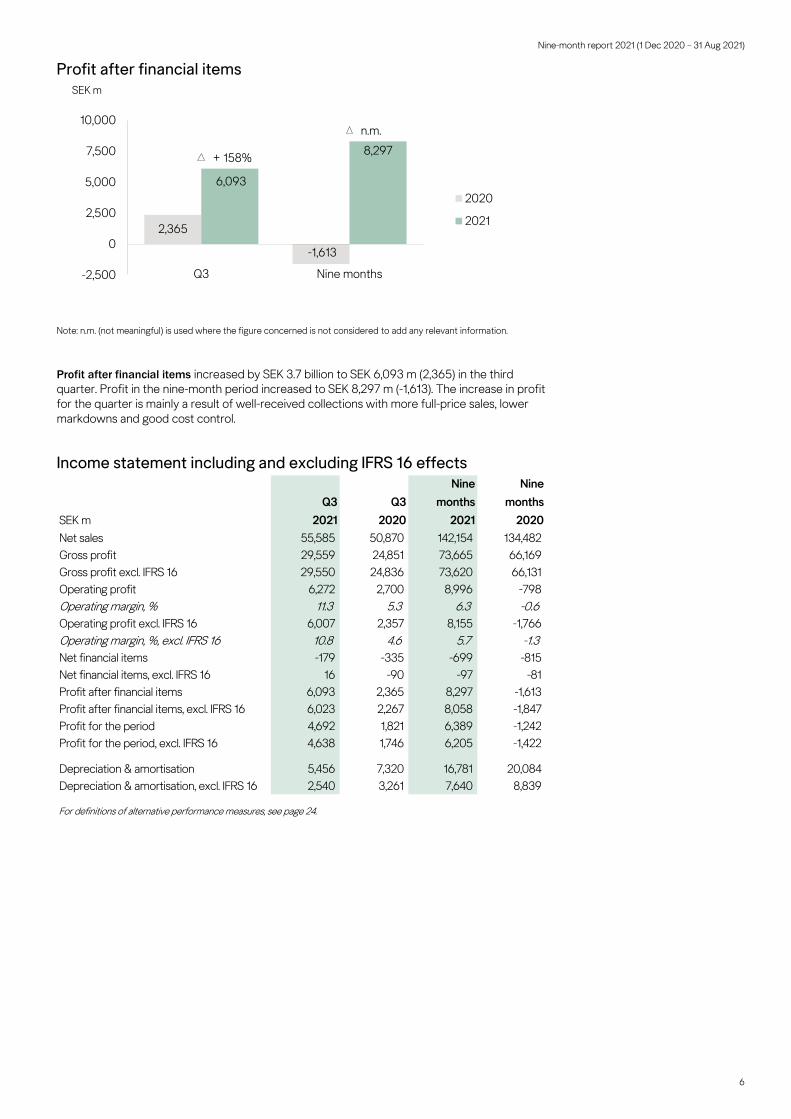
Note: n.m. (not meaningful) is used where the figure concerned is not considered to add any relevant information.
Profit after financial items increased by SEK 3.7 billion to SEK 6,093 m (2,365) in the third quarter. Profit in the nine-month period increased to SEK 8,297 m (-1,613). The increase in profit for the quarter is mainly a result of well-received collections with more full-price sales, lower markdowns and good cost control.
Income statement including and excluding IFRS 16 effects
2,365
-1,613
6,093
8,297+ 158%
n.m.
-2,500
0
2,500
5,000
7,500
10,000
Q3 Nine months
SEK m
2020
2021
SEK mQ3
2021Q3
2020
Nine months
2021
Nine months
2020Net sales 55,585 50,870 142,154 134,482Gross profit 29,559 24,851 73,665 66,169Gross profit excl. IFRS 16 29,550 24,836 73,620 66,131Operating profit 6,272 2,700 8,996 -798Operating margin, % 11.3 5.3 6.3 -0.6Operating profit excl. IFRS 16 6,007 2,357 8,155 -1,766Operating margin, %, excl. IFRS 16 10.8 4.6 5.7 -1.3Net financial items -179 -335 -699 -815Net financial items, excl. IFRS 16 16 -90 -97 -81Profit after financial items 6,093 2,365 8,297 -1,613Profit after financial items, excl. IFRS 16 6,023 2,267 8,058 -1,847Profit for the period 4,692 1,821 6,389 -1,242Profit for the period, excl. IFRS 16 4,638 1,746 6,205 -1,422
Depreciation & amortisation 5,456 7,320 16,781 20,084Depreciation & amortisation, excl. IFRS 16 2,540 3,261 7,640 8,839
For definitions of alternative performance measures, see page 24.

Nine-month report 2021 (1 Dec 2020 – 31 Aug 2021)
7
Stock-in-trade
The carrying amount of the stock-in-trade in SEK decreased by 12 percent compared with the corresponding point in the previous year and amounted to SEK 36,867 m (42,076). Currency adjusted the stock-in-trade decreased by around 3 percent.
The stock-in-trade in SEK represented 18.9 percent (21.4) of sales for the rolling twelve months, which amounted to SEK 194,703 m (196,176).
The cost of markdowns in relation to sales is expected to increase slightly in the fourth quarter compared with the corresponding quarter the previous year.
The ongoing transformation – including a more efficient supply chain and further integration of the sales channels – combined with a gradual improvement in the Covid-19 situation provides a good basis for continued lower stock levels going forward.
Growth and expansion through integrated channels The pandemic has accelerated the already ongoing transformation of the industry, with increased digitalisation that has rapidly changed customers’ behaviour. The current situation has changed the preconditions for, among other things, rental terms for stores. The H&M group is continuing to renegotiate a large number of leases as part of the company’s intensified store optimisation, which also involves rebuilds and adjustment of the number of stores and of store space to ensure the best store portfolio in each market. The H&M group’s contracts allow around a third of leases to be renegotiated or exited each year.
In the current financial year the H&M group has opened 68 (85) new stores and closed 230 (118) stores. For the fourth quarter 2021 the plan is to open around 40 new stores and close around 95 stores. In total this will result in around 108 new stores and 325 closed stores for the financial year, making a net decrease of around 215 stores. Most of the openings will be in growth markets, while the closures will mainly be in established markets.
The first H&M store in Panama opened successfully in September via franchise.
In autumn 2021 Monki will launch on the e-commerce platform Zalora in the Philippines and & Other Stories will launch on Nordstrom in the US.
H&M online will launch in Chile during autumn 2021 and in Peru, Colombia and Uruguay in the first half of 2022.
In 2022 H&M will launch in five new markets: the brand’s first stores will open in Ecuador, North Macedonia and Kosovo, and via franchise in Costa Rica and Cambodia.
COS plans to launch online in Australia at the start of 2022.
For more information see the heading Initiatives for an improved customer experience on page 12.
42,07636,867
- 12%
0
10,000
20,000
30,000
40,000
31 August
SEK m
2020
2021

Nine-month report 2021 (1 Dec 2020 – 31 Aug 2021)
8
Store count by brand As at 31 August 2021 the H&M group had 4,856 (5,043) stores, i.e. the total number of stores has decreased by 187 compared with 31 August 2020. In the current financial year 68 (85) new stores have opened and 230 (118) stores have closed. A total of 268 (278) of the group’s stores are operated by franchise partners.
Store count by segment
Expansion2021
Brand Store Online New markets
H&M 74 53 Store: Panama (franchise)**Online: Qatar (franchise)*, Chile
COS 46 34 Store: Greece*, Estonia*, Philippines*
Monki 20 31 -
Weekday 16 30 -
& Other Stories 22 33 Store: Israel, China**
ARKET 8 31 Store: South Korea*, China**, Russia
Afound 1 4 -
H&M HOME 51 42 Store: Thailand (franchise)
COS, Weekday, Monki, Weekday, & Other Stories and ARKET offer Global selling which enables customers in around 70 additional markets to shop online. The exact number of markets per brand that have this service varies.
** Opened in September 2021
No. of markets31 Aug - 2021
* Opened until 31 August 2021
Brand Q3 Nine months 31 Aug - 2021 31 Aug - 2020
H&M -43 -140 4,289 4,455
COS -7 -15 276 294
Monki -5 -15 108 124
Weekday -1 0 57 55
& Other Stories 0 1 75 72
ARKET 0 2 23 21
Afound -2 -3 3 6
H&M HOME* 1 8 25 16
Total -57 -162 4,856 5,043
* Concept stores. H&M HOME is also included with shop-in-shop in 394 H&M stores.
New Stores 2021 (net) Total No of stores
Region Q3 Nine months 31 Aug - 2021 31 Aug - 2020
Europe & Africa -39 -108 2,920 3,041
Asia & Oceania -19 -29 1,182 1,223
North & South America 1 -25 754 779
Total -57 -162 4,856 5,043
New Stores 2021 (net) Total No of stores

Nine-month report 2021 (1 Dec 2020 – 31 Aug 2021)
9
Financing and liquidity The H&M group aims to secure financial flexibility and freedom of action on the best possible terms. The financial position has been strengthened further during the quarter through increased net cash, improved working capital and more efficient financing.
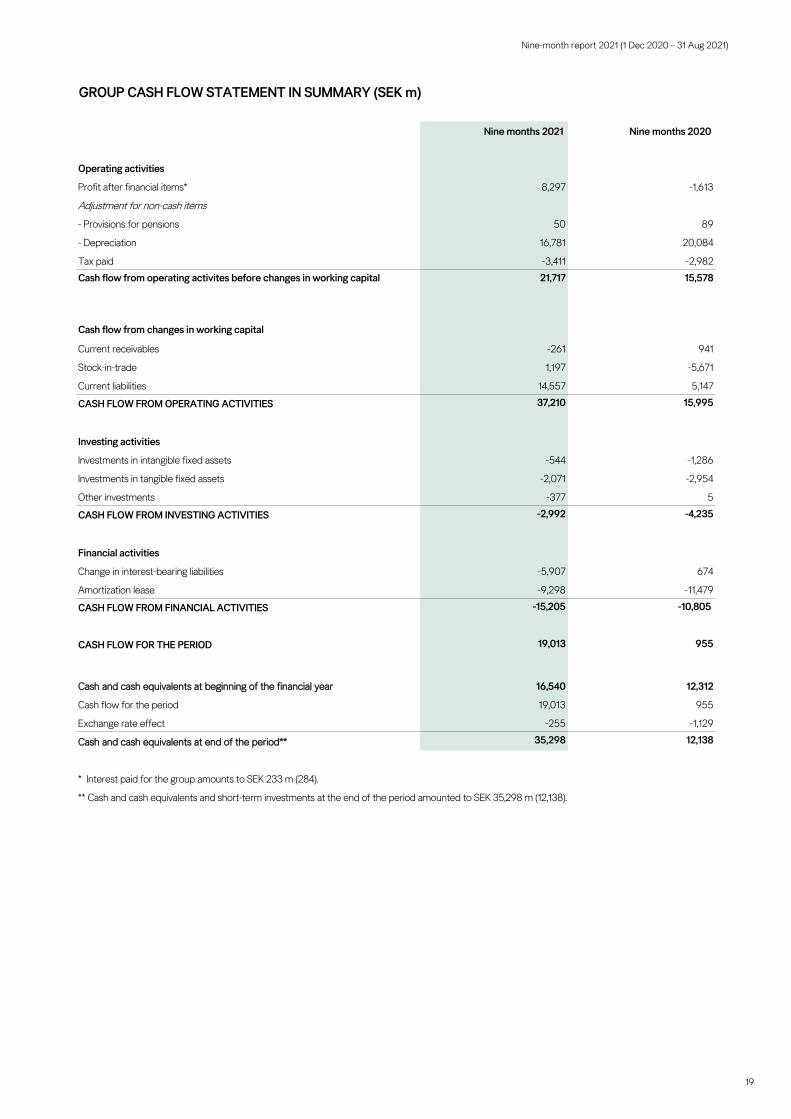
Cash flow and working capital Cash flow from operating activities in the nine-month period amounted to SEK 37,210 m (15,995). Excluding IFRS 16 cash flow from operating activities amounted to SEK 27,913 m (4,516).
The cash flow is a result of positive development in sales and earnings and of continued improvements in working capital achieved by decreasing inventories and by streamlining invoice management and payment processes. Liquidity and debt financing The H&M group’s liquidity remains very good. As at 31 August 2021 cash and cash equivalents amounted to SEK 35,298 m (12,138). In addition, the group has undrawn credit facilities of SEK 20,110 m (29,275). The total liquidity buffer, i.e. cash and cash equivalents plus undrawn credit facilities, amounted to SEK 55,408 m (41,413).
As at 31 August 2021 the group had interest-bearing liabilities of SEK 10,424 m (17,991) in the form of commercial papers, bonds and loans from credit institutions. The average maturity of interest-bearing liabilities was 5.3 (2.2) years. The financial net debt became financial net cash during the year, which amounted to SEK 24,874 m (-5,853).
Excluding IFRS 16 net debt including provisions for pensions in relation to EBITDA amounted to -1.1 (0.4).
A maturity analysis of outstanding interest-bearing liabilities and undrawn credit facilities is given in the table below.
YearCommercial
papersBonds
(EMTN)Loans from
credit institutionsUnused credit
facilities
2021 800 - 75 5,000
2022 275 - 165 -
2023 - - 2,031 4,000
2024 - - - 7,110
2025 - - - 4,000
2026 - - 2,000 -
2027 - - - -
2028 - - - -
2029 - 5,078 - -
Total SEK m 1,075 5,078 4,271 20,110

Nine-month report 2021 (1 Dec 2020 – 31 Aug 2021)
10
Tax In the first three quarters of the year a tax rate of 23 percent is used to calculate tax expense on the result of each period.
Current quarter The new autumn collections have been well received. Sales in September 2021 were slightly higher than in the corresponding month the previous year in local currencies, even though demand was not able to be fully met because of disruption and delays in product flow. Currently around 50 stores are temporarily closed.
The cost of markdowns in relation to sales is expected to increase slightly in the fourth quarter compared with the corresponding quarter the previous year.
Dividend comment There has been no resolution on a dividend since spring 2019. A dividend proposal in January 2020 was withdrawn in March 2020 due to the pandemic. The board of directors is now proposing that a cash dividend of SEK 6.50 per share is paid in November 2021. This is based on significantly improved profitability, a strong financial position with financial net cash of SEK 24,874 m, more stable market conditions and a good outlook. Even after the dividend now proposed, the company will be financially strong and able to continue investing in the customer offering and the business, thereby strengthening its position further. An extraordinary general meeting will be held on 28 October 2021; see separate press release for more information.
Accounting principles The group applies International Financial Reporting Standards (IFRS) and interpretations by the IFRS Interpretations Committee as adopted by the EU. This report has been prepared according to IAS 34 Interim Financial Reporting, the Swedish Financial Reporting Board’s Recommendation RFR 1 Supplementary Rules for Consolidated Financial Statements and the Swedish Annual Accounts Act.
The parent company applies the Swedish Annual Accounts Act and the Swedish Financial Reporting Board’s recommendation RFR 2 Accounting for Legal Entities, which essentially involves applying IFRS. In accordance with RFR 2, the parent company does not apply IFRS 9 when measuring financial instruments, nor does it capitalise development costs. IFRS 16 is also not applied in the parent company.
Other than as stated below regarding non-current financial assets, the accounting principles and calculation methods applied in this report are unchanged from those used in the preparation of the annual report and consolidated financial statements for 2020. No new or revised IFRS standards or interpretations applied from 1 December 2020 have had any significant impact on the consolidated financial statements.
For a more detailed description of the accounting principles applied to the group and the parent company in this interim report see pages 64–65 of the annual report for the 2020 financial year.
Non-current financial assets The H&M group has previously assessed cost as being a reasonable approximation of the value of all investments in companies. During the year this assessment was reviewed in light of changed market conditions, which has meant a faster increase in value than expected and also that the increase in value was assessed to be permanent in the sense that the price is still variable but within a higher expected range. As of the third quarter, therefore, the H&M group has revalued those interests where the increase in value is assessed to be affected by this; primarily Klarna and Renewcell. The assessment has led to an increase of SEK 3,347 m. In view of the strategic nature of the interests, this is recognised in other comprehensive income and is also reflected in financial assets in the balance sheet. The valuation of Renewcell is based on the share price as at 31 August 2021 (level 1). The valuation of Klarna is based on the latest performed funding round in Klarna (level 3).
Government assistance in connection with the Covid-19 situation IAS 20 Accounting for Government Grants and Disclosure of Government Assistance – due to the extraordinary situation brought about by the pandemic the H&M group received government assistance in various markets, mainly in respect of rents and staffing.
The H&M group has chosen to report these grants as a reduction in the cost of the items to which the grants relate. The grants are reported in the income statement and balance sheet when it is reasonably certain that the grants will be received.

Nine-month report 2021 (1 Dec 2020 – 31 Aug 2021)
11
Financial instruments The H&M group’s financial instruments consist mainly of accounts receivable, other receivables, cash and cash equivalents, accounts payable, interest-bearing securities and liabilities, and currency derivatives.
Currency derivatives are measured at fair value based on Level 2 inputs in the IFRS 13 hierarchy. As of 31 August 2021, forward contracts with a positive market value amount to SEK 664 m (1,255), which is reported under other current receivables. Forward contracts with a negative market value amount to SEK 387 m (801), which is recognised in other current liabilities. Equity instruments are measured at fair value, either through profit or loss or through other comprehensive income. Where equity interests are assessed to be strategic, the H&M group has chosen to recognise changes in value in other comprehensive income.
Other financial assets and liabilities are measured at amortised cost. Liabilities to credit institutions accrue interest at rates which essentially correspond to current market rates, and therefore the fair values of these and other financial instruments are assessed to be approximately equal to their book values.
Risks and uncertainties Risks may be due to events in the outside world and affect a certain sector or market, or they may be associated with the group’s own business. The H&M group carries out regular risk analysis for both operational and financial risks. Operational risks are mainly associated with the business and the external risks that affect the group. Business decisions determine whether action is to be taken to reduce the likelihood of the risk in question occurring and if so, to what extent. Business decisions also determine the extent to which the consequences of a risk that has occurred may be mitigated.
There are external risks and uncertainties affecting the H&M group that are related to the shift in the industry, fashion, competitors, information security and cybersecurity, sustainability issues, weather, macroeconomics and geopolitical events, pandemics, foreign currencies, taxes, customs duty, and various regulations and ordinances, but also in connection with expansion into new markets, the launch of new concepts and how the brands are managed. More detailed information concerning the financial risks is given in H&M Group’s annual report.
Nine-month report 2021 (1 Dec 2020 – 31 Aug 2021)
12
Initiatives for an improved customer experience Customer behaviour is changing rapidly, and the H&M group works continually on improvements in order to offer customers the best possible shopping experience. Here are some examples of ongoing initiatives:
• H&M’s customer loyalty programme rewards members not just for purchases, but also for commitment – such as bringing in old clothes for H&M’s garment collecting, choosing climate-smart delivery options, bringing their own bag when shopping and choosing products made from more sustainable materials.
• More payment options. Members of H&M can pay now or later through the H&M app, whether shopping in store or online.
• Digital receipts. Customers can receive digital receipts in the H&M app in most markets.
• Visual Search. Image recognition helps customers by making recommendations and suggesting potential buys based on pictures that the customer has taken or been
inspired by.
• Next day delivery and express delivery continue to be rolled out in more markets.
• Climate-smart delivery options. H&M customers in the Netherlands, Sweden, Italy and France can opt to receive and return items using a bicycle delivery service, a solution that is much appreciated by customers. Combined with using biogas vehicles from the logistics centre, this reduces CO2 emissions. Various kinds of climate-smart deliveries are offered in different markets.
• Find in Store. On seeing an item online, customers can use their mobile to find it quickly and easily in the size they want in a physical store as well as online.
• Scan & Buy. Customers can scan the QR code on a product in store to find and buy the item online in the size and colour they want.
• In-Store Mode allows customers to see on their mobiles which items are in the store they are currently in, as well as online.
• Click & Collect allows customers to pick up online purchases in store.
• Online returns in store is a service that continues to be rolled out during 2021.
• #HMxME enables customers to share their own fashion stories from Instagram while also providing an easy way to buy the items.
• Recommended Size helps customers find the right size online based on past purchases.
• Rate & Review lets customers rate and review H&M products.
RFID (Radio Frequency Identification) means items with a digital price tag can be located quickly, to get precise information on an item’s availability.
Self-service checkouts have been much appreciated by customers and are being rolled out to more markets.
• Instagram – in the US, H&M customers can shop directly from inspirational images and videos on Instagram and get notifications on Instagram when H&M releases new collections.
• H&M HOME X Augmented Reality. H&M is continuously seeking new ways to engage its customers and reduce its carbon footprint. One example of this is the group’s augmented reality pilot. Customers can preview selected H&M HOME products by virtually “placing” them in their own environment simply using the camera on their mobile.
• Creator Studio, a new B2B service offering on-demand print services within the H&M group. Creator Studio offers a global platform for the merchandise industry that allows external brands and content creators to offer good quality merchandise by utilising the H&M group’s lean production process, international logistics networks, advanced made-to-order digital printing and integrated e-com setup. Creator Studio is starting on a small scale to begin with.

Nine-month report 2021 (1 Dec 2020 – 31 Aug 2021)
13
Product flow The pandemic has accelerated the need for flexibility between different sales channels, and so the H&M group is continuing to integrate the channels into a fully omni model. This encompasses the entire flow of goods and how to ensure that the right product is in the right place at the right time, at the right cost. Important elements include the group’s tech investments in AI and logistics systems, but also work on logistics centres and an increased focus on innovation.
In the US two highly automated logistics centres have been taken into use in the past year. In Perris outside Los Angeles on the West Coast a newly developed, highly automated logistics centre was taken into operation in the second half of 2020. A further highly automated logistics centre was put into operation in Robbinsville, New Jersey, on the East Coast in the first half of 2021.
A new highly automated logistics centre is under construction in Ajax, Canada. This will supplement the logistics centres that have opened on the US East and West Coasts, creating further capacity for the H&M group’s continued expansion in North America. The new logistics centre is scheduled for completion in late 2022/early 2023.
Sustainability The H&M group’s sustainability vision is to lead the transition to circular, climate positive fashion as a fair and equal company across the entire value chain.
H&M Group announced as UN Global Compact LEAD for its ongoing commitment to the United Nations Global Compact and its Ten Principles for responsible business. H&M Group, which is a signatory of the program since 2001, was identified as the highest level of engagement within the retail business. Global Compact is a collaboration between UN and businesses that are committed to aligning their operations and strategies with ten universally accepted principles concerning human rights, labour, environment and anti-corruption. With its participation in UN Global Compact, H&M Group is working together with businesses, Global Compact local networks, leading experts, civil society, governments and UN partners, to solve complex issues and innovate around the sustainable development goals.
Investment in renewable energy. H&M Group has entered partnerships with renewable energy developers and is committed to source 100 percent renewable electricity in own operations no later than 2030 while raising the bar on its energy sourcing criteria. Through the membership in RE100 H&M Group works to increase the use of renewable electricity also in the supply chain. The company´s ambitions are always to have a science-based approach in order to achieve its long-term goal of having a climate positive value chain latest 2040. The focus on energy efficiency, renewable energy, and shifting to a circular business model remain the main cornerstones of H&M Group’s climate strategy.
Transparency Index 2021. H&M Group is amongst the highest scoring brands in Fashion Transparency Index 2021 which ranks multiple companies according to how much information they disclose about their suppliers, supply chain policies and practices, as well as social and environmental impact. This year H&M has ranked 2nd out of 250 brands. Transparency is a key part of H&M Groups sustainability strategy and the group was the first global fashion retailer to publish its supplier list in 2013. The group has also committed to further disclose information on its work and results related to the strategy to become circular and climate positive by joining the Green Consumption Pledge Initiative, initiated by the European Commission.
Investment in regenerated textile fiber. H&M Group leads new investment round in Infinited Fiber Company to fuel a circular fashion industry. H&M Group has also signed a multiyear agreement to secure access to its regenerated textile fiber Infinna™. Existing investors, as well as new ones, have joined H&M Group in backing the fast-growing fashion and textile technology company as it seeks to close the loop in fashion. Their pioneering technology used to turn waste into a new premium textile fiber, not only helps H&M Group in achieving its own sustainability goals, but also has the potential to have an impact that spans the entire textile industry.
H&M Group has joined the 2025 Recycled Polyester Challenge. UN’s “Textile Exchange and the Fashion Industry Charter for Climate Action”, has launched a joint initiative to spur further a shift in the market towards the uptake of recycled polyester and the associated reduction in greenhouse gases. The 2025 Recycled Polyester Challenge serves as an essential catalyst for change in the apparel and textile industry. H&M Group has set a leading individual goal to only use recycled polyester by 2025, and further scaling textile to textile recycling. It is an important milestone on the company’s journey towards 100 percent recycled or other sustainably sourced materials by 2030. It will help to decrease the impact on the environment, lowering its carbon footprint and saving resources like water, energy and chemicals.

Nine-month report 2021 (1 Dec 2020 – 31 Aug 2021)
14
Fire and building safety. H&M Group has signed a new agreement, the “International Accord for Health and Safety in the Textile and Garment Industry”, together with trade unions and other brands. The agreement is a continuation of the previous legally binding Accord and will ensure joint efforts for a safe work environment in the Bangladesh garment industry.
H&M Foundation’s Global Change Award. The world’s largest innovation challenge to transform the fashion industry is open. The Global Change Award 2022 is seeking early-stage innovations contributing to a planet positive fashion industry by addressing the earth’s global commons: land, water, oceans, climate and biodiversity. A panel of experts will select five winners who get to share a EUR 1 million provided by the H&M Foundation and get access to a yearlong accelerator program in collaboration with Accenture and KTH Royal Institute of Technology. The winners will be announced in April 2022.
H&M Rewear is a new resell platform where customers in Canada can buy and sell garments and thereby give garments a second life to, regardless of brand. The resell platform helps to pro-long the life span of garments and will push circularity and help close the loop leading to a more sustainable future, one of H&M Group's top priorities.
& Other Stories second-hand pop-up store. The pop-up store “Treasures” in Stockholm offers a selection of & Other Stories fashions from previous collections at a reduced price.. Weekday and & Other Stories offer rental collections on Gemme Collective. Weekday and & Other Stories are offering parts of their product assortment on Gemme Collective, a digital fashion community in Sweden where members can rent and rent out garments and accessories between each other.
Read more about many of the initiatives taken and our sustainability work at hmgroup.com.

Nine-month report 2021 (1 Dec 2020 – 31 Aug 2021)
15
Calendar 28 October 2021 Extraordinary general meeting
15 December 2021 Sales development in the fourth quarter, 1 Sep 2021 – 30 Nov 2021
28 January 2022 Full-year report, 1 Dec 2020 – 30 Nov 2021
15 March 2022 Sales development in the first quarter, 1 Dec 2021 – 28 Feb 2022
31 March 2022 Three-month report, 1 Dec 2021 – 28 Feb 2022
4 May 2022 Annual general meeting
15 June 2022 Sales develooment in the second quarter, 1 Mar 2022 – 31 May 2022
29 June 2022 Six-month report, 1 Dec 2021 – 31 May 2022
Stockholm, 30 September 2021 Board of Directors
Communication in conjunction with the nine-month report The nine-month report, i.e. 1 December 2020 – 31 August 2021, will be published at 08:00 CEST on 30 September 2021 and will be followed by a telephone conference at 09:00 CEST for the financial market and media hosted by CEO Helena Helmersson, CFO Adam Karlsson and Head of IR Nils Vinge. The telephone conference will be held in English.
For log in details for the telephone conference please register at hmgroup.com or via this link: http://emea.directeventreg.com/registration/6370107.
To book interviews with CEO Helena Helmersson, CFO Adam Karlsson and Head of IR Nils Vinge in conjunction with the nine-month report on 30 September 2021, please contact: Kristina Stenvinkel, telephone: +46 8 796 39 08, e-mail: [email protected]
Contact Nils Vinge, Head of IR +46 8 796 52 50 Helena Helmersson, CEO +46 8 796 55 00 (switchboard) Adam Karlsson, CFO +46 8 796 55 00 (switchboard)
H & M Hennes & Mauritz AB (publ) SE-106 38 Stockholm Phone: +46-8-796 55 00, fax: +46-8-20 99 19, e-mail: [email protected] Registered office: Stockholm, Reg. No. 556042-7220
For more information about the H&M group visit hmgroup.com.

Nine-month report 2021 (1 Dec 2020 – 31 Aug 2021)
16
Review report H & M Hennes & Mauritz AB (Publ), corporate identity number 556042-7220
Introduction We have reviewed the interim report for H&M Hennes & Mauritz AB (publ) for the period December 1, 2020 – August 31, 2021. The Board of Directors and the President are responsible for the preparation and presentation of this interim report in accordance with IAS 34 and the Annual Accounts Act. Our responsibility is to express a conclusion on this interim report based on our review.
Scope of Review We conducted our review in accordance with the International Standard on Review Engagements ISRE 2410, Review of Interim Financial Information Performed by the Independent Auditor of the Entity. A review consists of making inquiries, primarily of persons responsible for financial and accounting matters, and applying analytical and other review procedures. A review has a different focus and is substantially less in scope than an audit conducted in accordance with ISA and other generally accepted auditing practices. The procedures performed in a review do not enable us to obtain a level of assurance that would make us aware of all significant matters that might be identified in an audit. Therefore, the conclusion expressed based on a review does not give the same level of assurance as a conclusion expressed based on an audit.
Conclusion Based on our review, nothing has come to our attention that causes us to believe that the interim report is not, in all material respects, prepared for the Group in accordance with IAS 34 and the Annual Accounts Act, and for the Parent Company in accordance with the Annual Accounts Act.
Stockholm, September 30, 2021
Deloitte AB
Didrik Roos
Authorized Public Accountant
Information in this interim report is that which H & M Hennes & Mauritz AB (publ) is required to disclose under the EU Market Abuse Regulation (EU) No 596/2014. The information was submitted for publication by the abovementioned persons at 08:00 (CEST) on 30 September 2021. This interim report and other information about the H&M group, is available at hmgroup.com.
H & M Hennes & Mauritz AB (publ) was founded in Sweden in 1947 and is quoted on Nasdaq Stockholm. H&M’s business idea is to offer fashion and quality at the best price in a sustainable way. In addition to H&M, the group includes the brands COS, Monki, Weekday, & Other Stories, H&M HOME and ARKET as well as Afound. The H&M group has 53 online markets and approximately 4,850 stores in 75 markets including franchise markets. In 2020, net sales were SEK 187 billion. The number of employees amounts to approximately 153,000. For further information, visit hmgroup.com.

Nine-month report 2021 (1 Dec 2020 – 31 Aug 2021)
17
Q3 2021 Q3 2020 Nine months
2021 Nine months
2020 1 Dec 2019-
30 Nov 2020
Net sales 55,585 50,870 142,154 134,482 187,031
Cost of goods sold -26,026 -26,019 -68,489 -68,313 -93,487
GROSS PROFIT 29,559 24,851 73,665 66,169 93,544
Gross margin, % 53.2 48.9 51.8 49.2 50.0
Selling expenses -20,956 -20,040 -57,868 -60,306 -81,425
Administrative expenses -2,331 -2,111 -6,801 -6,661 -9,020
OPERATING PROFIT 6,272 2,700 8,996 -798 3,099
Operating margin, % 11.3 5.3 6.3 -0.6 1.7
Net financial items -179 -335 -699 -815 -1,047
PROFIT AFTER FINANCIAL ITEMS 6,093 2,365 8,297 -1,613 2,052
Tax -1,401 -544 -1,908 371 -809
PROFIT FOR THE PERIOD 4,692 1,821 6,389 -1,242 1,243
All profit for the year is attributable to the shareholders of the parent company H & M Hennes & Mauritz AB.
Earnings per share, SEK* 2.83 1.10 3.86 -0.75 0.75
Number of shares, thousands* 1,655,072 1,655,072 1,655,072 1,655,072 1,655,072
Depreciation, total 5,456 7,320 16,781 20,084 25,953
of which cost of goods sold 392 586 1,260 1,483 1,949
of which selling expenses 4,851 6,282 14,878 17,683 22,755
of which administrative expenses 213 452 643 918 1,249
* Before and after dilution.
CONSOLIDATED STATEMENT OF COMPREHENSIVE INCOME IN SUMMARY (SEK m)
Q3 2021 Q3 2020 Nine months
2021 Nine months
2020 1 Dec 2019-
30 Nov 2020
PROFIT FOR THE PERIOD 4,692 1,821 6,389 -1,242 1,243
Other comprehensive income
Items that are or may be reclassified to profit or loss
Translation differences 627 -2,151 310 -3,276 -3,673
Change in hedging reserves 155 447 -316 299 92
Tax attributable to change in hedging reserves -52 -98 56 -64 -21
Items that will not be reclassified to profit or loss
Remeasurement of defined benefit pension plans - - - - -113
Tax related to the above remeasurement - - - - 26
Revaluation of financial assets 3,347 - 3,347 - -
OTHER COMPREHENSIVE INCOME 4,077 -1,802 3,397 -3,041 -3,689
TOTAL COMPREHENSIVE INCOME FOR THE PERIOD 8,769 19 9,786 -4,283 -2,446
All comprehensive income is attributable to the shareholders of the parent company H & M Hennes & Mauritz AB.
GROUP INCOME STATEMENT IN SUMMARY (SEK m)

Nine-month report 2021 (1 Dec 2020 – 31 Aug 2021)
18
GROUP BALANCE SHEET IN SUMMARY (SEK m)
ASSETS
31 Aug - 2021 31 Aug - 2020 30 Nov - 2020
Non-current assets
Intangible non-current assets 9,792 10,796 10,432
Property, plant and equipment 27,184 33,820 31,639
Right of use assets 51,889 65,355 59,535
Non-current financial assets 4,605 701 786
Other non-current assets 6,805 5,324 6,621
100,275 115,996 109,013
Current assets
Stock-in-trade 36,867 42,076 38,209
Current receivables 12,849 10,633 10,609
Cash and cash equivalents 35,298 12,138 16,540
85,014 64,847 65,358
TOTAL ASSETS 185,289 180,843 174,371
EQUITY AND LIABILITIES
Equity 64,409 52,786 54,623
Long-term liabilities* 13,899 17,558 13,033
Long-term leasing liabilities* 44,132 55,687 50,458
Current liabilities** 51,165 41,166 42,982
Current leasing liabilities** 11,684 13,646 13,275
TOTAL EQUITY AND LIABILITIES 185,289 180,843 174,371
CHANGE IN GROUP EQUITY IN SUMMARY (SEK m)
31 Aug - 2021 31 Aug - 2020 30 Nov - 2020
Shareholders' equity at the beginning of the period 54,623 57,069 57,069
Total comprehensive income for the period 9,786 -4,283 -2,446
Dividend - - -
Shareholders' equity at the end of the period 64,409 52,786 54,623
* Interest-bearing long-term liabilities including leasing amounts to SEK 54,060 m (68,908).
** Interest-bearing current liabilities including leasing amounts to SEK 12,844 m (18,984).
Nine-month report 2021 (1 Dec 2020 – 31 Aug 2021)
19
Nine months 2021 Nine months 2020
Operating activities
Profit after financial items* 8,297 -1,613
Adjustment for non-cash items
- Provisions for pensions 50 89
- Depreciation 16,781 20,084
Tax paid -3,411 -2,982Cash flow from operating activites before changes in working capital 21,717 15,578
Cash flow from changes in working capital
Current receivables -261 941
Stock-in-trade 1,197 -5,671
Current liabilities 14,557 5,147
CASH FLOW FROM OPERATING ACTIVITIES 37,210 15,995
Investing activities
Investments in intangible fixed assets -544 -1,286
Investments in tangible fixed assets -2,071 -2,954
Other investments -377 5
CASH FLOW FROM INVESTING ACTIVITIES -2,992 -4,235
Financial activities
Change in interest-bearing liabilities -5,907 674
Amortization lease -9,298 -11,479
CASH FLOW FROM FINANCIAL ACTIVITIES -15,205 -10,805
CASH FLOW FOR THE PERIOD 19,013 955
Cash and cash equivalents at beginning of the financial year 16,540 12,312
Cash flow for the period 19,013 955
Exchange rate effect -255 -1,129
Cash and cash equivalents at end of the period** 35,298 12,138
* Interest paid for the group amounts to SEK 233 m (284).
** Cash and cash equivalents and short-term investments at the end of the period amounted to SEK 35,298 m (12,138).
GROUP CASH FLOW STATEMENT IN SUMMARY (SEK m)
Nine-month report 2021 (1 Dec 2020 – 31 Aug 2021)
20
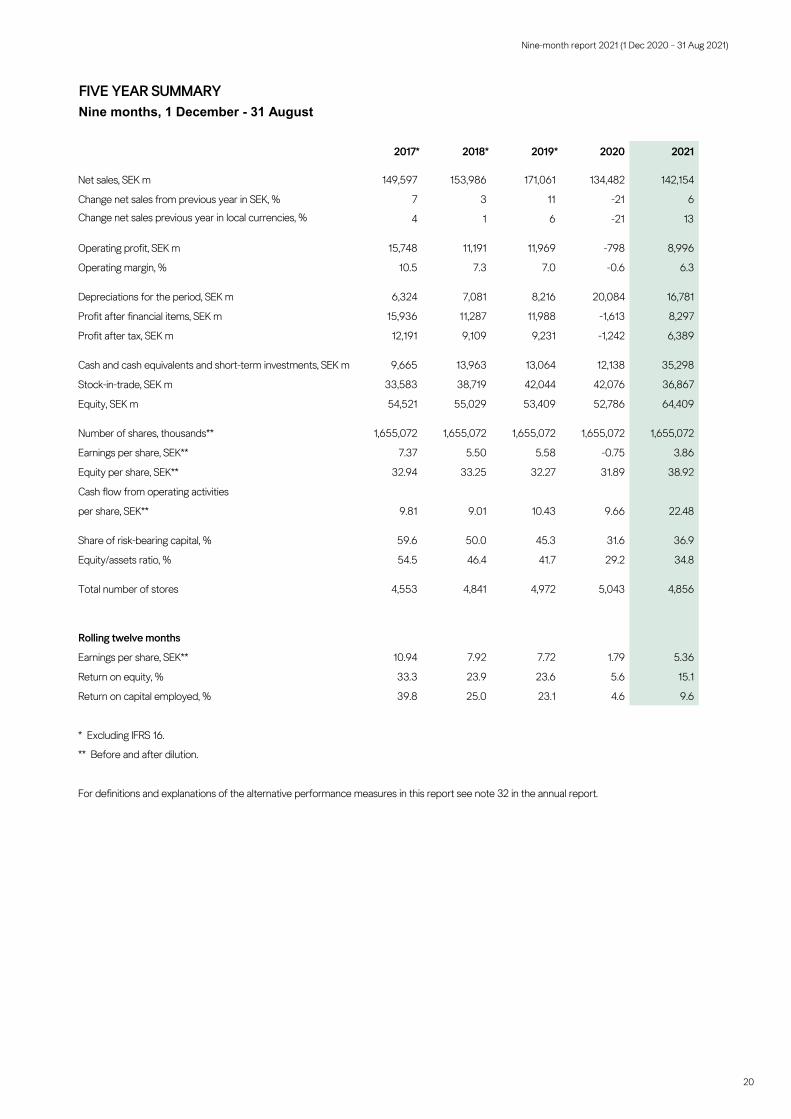
FIVE YEAR SUMMARYNine months, 1 December - 31 August
2017* 2018* 2019* 2020 2021
Net sales, SEK m 149,597 153,986 171,061 134,482 142,154
Change net sales from previous year in SEK, % 7 3 11 -21 6
Change net sales previous year in local currencies, % 4 1 6 -21 13
Operating profit, SEK m 15,748 11,191 11,969 -798 8,996
Operating margin, % 10.5 7.3 7.0 -0.6 6.3
Depreciations for the period, SEK m 6,324 7,081 8,216 20,084 16,781
Profit after financial items, SEK m 15,936 11,287 11,988 -1,613 8,297
Profit after tax, SEK m 12,191 9,109 9,231 -1,242 6,389
Cash and cash equivalents and short-term investments, SEK m 9,665 13,963 13,064 12,138 35,298
Stock-in-trade, SEK m 33,583 38,719 42,044 42,076 36,867
Equity, SEK m 54,521 55,029 53,409 52,786 64,409
Number of shares, thousands** 1,655,072 1,655,072 1,655,072 1,655,072 1,655,072
Earnings per share, SEK** 7.37 5.50 5.58 -0.75 3.86
Equity per share, SEK** 32.94 33.25 32.27 31.89 38.92
Cash flow from operating activities
per share, SEK** 9.81 9.01 10.43 9.66 22.48
Share of risk-bearing capital, % 59.6 50.0 45.3 31.6 36.9
Equity/assets ratio, % 54.5 46.4 41.7 29.2 34.8
Total number of stores 4,553 4,841 4,972 5,043 4,856
Rolling twelve months
Earnings per share, SEK** 10.94 7.92 7.72 1.79 5.36
Return on equity, % 33.3 23.9 23.6 5.6 15.1
Return on capital employed, % 39.8 25.0 23.1 4.6 9.6
* Excluding IFRS 16.
** Before and after dilution.
For definitions and explanations of the alternative performance measures in this report see note 32 in the annual report.
Nine-month report 2021 (1 Dec 2020 – 31 Aug 2021)
21
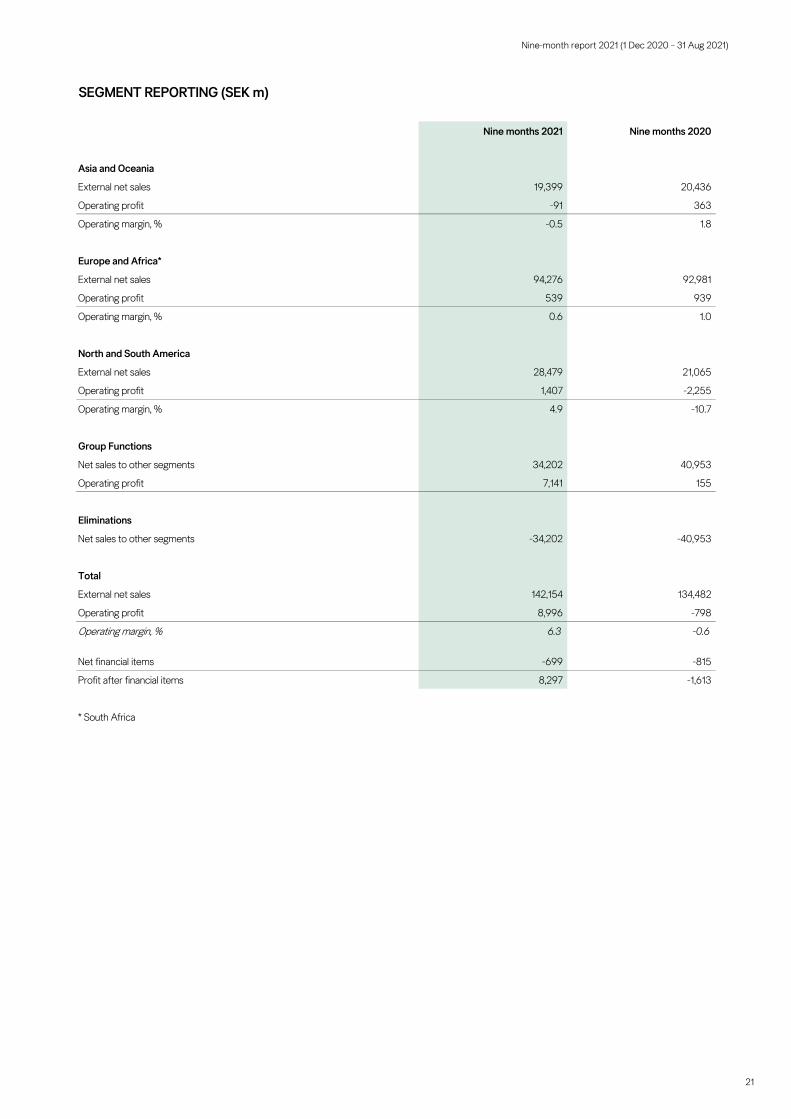
SEGMENT REPORTING (SEK m)
Nine months 2021 Nine months 2020
Asia and Oceania
External net sales 19,399 20,436
Operating profit -91 363
Operating margin, % -0.5 1.8
Europe and Africa*
External net sales 94,276 92,981
Operating profit 539 939
Operating margin, % 0.6 1.0
North and South America
External net sales 28,479 21,065
Operating profit 1,407 -2,255
Operating margin, % 4.9 -10.7
Group Functions
Net sales to other segments 34,202 40,953
Operating profit 7,141 155
Eliminations
Net sales to other segments -34,202 -40,953
Total
External net sales 142,154 134,482
Operating profit 8,996 -798
Operating margin, % 6.3 -0.6
Net financial items -699 -815
Profit after financial items 8,297 -1,613
* South Africa

Nine-month report 2021 (1 Dec 2020 – 31 Aug 2021)
22
PARENT COMPANY INCOME STATEMENT IN SUMMARY (SEK m)
Q32021
Q32020
Nine months2021
Nine months2020
1 Dec 2019-30 Nov 2020
Net sales 1,102 1,000 2,827 2,495 3,605
GROSS PROFIT 1,102 1,000 2,827 2,495 3,605
Administrative expenses -29 -33 -84 -93 -111
OPERATING PROFIT 1,073 967 2,743 2,402 3,494
Net financial items* -39 -126 -179 -656 2,669
PROFIT AFTER FINANCIAL ITEMS 1,034 841 2,564 1,746 6,163
Year-end appropriations - - - - -3,439
Tax -223 -180 -550 -471 -16
PROFIT FOR THE PERIOD 811 661 2,014 1,275 2,708
Q32021
Q32020
Nine months2021
Nine months2020
1 Dec 2019-30 Nov 2020
PROFIT FOR THE PERIOD 811 661 2,014 1,275 2,708
Other comprehensive incomeItems that have not been and will not be reclassified to profit or loss
Remeasurement of defined benefit pension plans - - - - -3
Tax related to the above remeasurement - - - - 1
OTHER COMPREHENSIVE INCOME - - - - -2
TOTAL COMPREHENSIVE INCOME FOR THE PERIOD 811 661 2,014 1,275 2,706
* Non received dividend income due to Covid-19 in the quarter consists of SEK 0 m (0) and in the nine-month period of SEK 0 m (-455).
PARENT COMPANY STATEMENT OF COMPREHENSIVE INCOME (SEK m)

Nine-month report 2021 (1 Dec 2020 – 31 Aug 2021)
23
PARENT COMPANY BALANCE SHEET IN SUMMARY (SEK m)
31 Aug - 2021 31 Aug - 2020 30 Nov 2020
ASSETS
Non-current assets
Property, plant and equipment 178 207 189
Other non-current assets 1,091 2,166 1,090
1,269 2,373 1,279
Current assets
Current receivables 31,942 39,000 35,241
Cash and cash equivalents 0 - -
31,942 39,000 35,241
TOTAL ASSETS 33,211 41,373 36,520
EQUITY AND LIABILITIES
Equity 21,887 18,442 19,873
Untaxed reserves 38 57 38
Long-term liabilities* 9,403 12,758 8,637
Current liabilities** 1,883 10,116 7,972
TOTAL EQUITY AND LIABILITIES 33,211 41,373 36,520
* All long-term liabilities are interest-bearing.
** Interest-bearing current liabilities amounts to SEK 1,075 m (4,846).

Nine-month report 2021 (1 Dec 2020 – 31 Aug 2021)
24
ALTERNATIVE PERFORMANCE MEASURES For other alternative performance measures see note 32 in the annual report.
Financial net debt/net cashNine months
2021Nine months
2020
Interest-bearing liabilities excluding lease liabilities and provisions for pensions 10,424 17,991
Cash and cash equivalents -35,298 -12,138
Financial net debt (+) / net cash (-) -24,874 5,853
Reason for use: Used to display the net value of the company's borrowings and cash and cash equivalents.
Gross profit excl IFRS 16
Q3 - 2021 Q3 - 2020Nine months
2021Nine months
2020
Gross profit 6,093 2,365 8,297 -1,613
IFRS 16 effect -70 -98 -239 -234
Gross profit excl IFRS 16 6,023 2,267 8,058 -1,847
Definition: Gross profit adjusted with the effect from IFRS 16.Reason for use: To create comparability in analyses where years prior to IFRS 16 are included.
Operating profit excl IFRS 16
Q3 - 2021 Q3 - 2020Nine months
2021Nine months
2020
Operating profit 6,272 2,700 8,996 -798
IFRS 16 effect -265 -343 -841 -968
Operating profit excl IFRS 16 6,007 2,357 8,155 -1,766
Definition: Operating profit adjusted with the effect from IFRS 16.Reason for use: To create comparability in analyses where years prior to IFRS 16 are included.
Net financial items excl IFRS 16
Q3 - 2021 Q3 - 2020Nine months
2021Nine months
2020
Net financial items -179 -335 -699 -815
IFRS 16 effect 195 245 602 734
Net financial items excl IFRS 16 16 -90 -97 -81
Definition: Net financial items adjusted with the effect from IFRS 16.Reason for use: To create comparability in analyses where years prior to IFRS 16 are included.
Profit after financial items excl IFRS 16
Q3 - 2021 Q3 - 2020Nine months
2021Nine months
2020
Profit after financial items 6,093 2,365 8,297 -1,613
IFRS 16 effect -70 -98 -239 -234
Profit after financial items excl IFRS 16 6,023 2,267 8,058 -1,847
Definition: Profit after financial items adjusted with the effect from IFRS 16.Reason for use: To create comparability in analyses where years prior to IFRS 16 are included.
Profit for the period excl IFRS 16
Q3 - 2021 Q3 - 2020Nine months
2021Nine months
2020
Profit for the period 4,692 1,821 6,389 -1,242
IFRS 16 effect -54 -75 -184 -180
Profit for the period excl IFRS 16 4,638 1,746 6,205 -1,422
Definition: Profit for the period adjusted with the effect from IFRS 16.Reason for use: To create comparability in analyses where years prior to IFRS 16 are included.
Definition: Interest-bearing liabilities excluding lease liabilities and provisions for pensions reduced by cash and cash equivalents.