h014/01 geology sample question paper
TRANSCRIPT

© OCR 2016 H014/01 Turn over 603/0783/3 F100023/2.0
AS Level Geology H014/01 Geology Sample Question Paper
Date – Morning/Afternoon Version 2.1
Time allowed: 2 hours 30 minutes
You must have:
• a protractor
• a ruler (cm/mm)
• a pencil
You may use:
• a scientific or graphical calculator
* 0 0 0 0 0 0 *
First name
Last name
Centre number
Candidate
number
INSTRUCTIONS
• Use black ink. You may use an HB pencil for graphs and diagrams.
• Complete the boxes above with your name, centre number and candidate number.
• Answer all the questions.
• Where appropriate, your answers should be supported with working. Marks
may be given for a correct method even if the answer is incorrect.
• Write your answer to each question in the space provided. If additional space isrequired, use the lined page(s) at the end of this booklet. The question number(s) mustbe clearly shown.
• Do not write in the barcodes.
INFORMATION
• The total mark for this paper is 120.
• The marks for each question are shown in brackets [ ].
• Quality of extended responses will be assessed in questions marked with anasterisk (*).
• This document consists of 40 pages.
SPECIMEN

2
© OCR 2016 H014/01
Section A
You should spend a maximum of 30 minutes on this section.
Write your answer to each question in the box provided.
Answer all the questions.
1 The diagram below shows two igneous intrusions.
The thin section of rock below is taken from rock shown on the diagram.
Which rock shown on the diagram, A, B, C or D, does the thin section come from?
Your answer [1]
magnification ×5
crystals of calcite
SPECIMEN

3
© OCR 2016 H014/01 Turn over
2 The diagram below shows a thin section drawing of a metamorphic rock containing garnet
crystals.
magnification ×4
What is the actual diameter of the garnet crystal labelled E?
A 0.43 mm
B 6.80 mm
C 0.24 mm
D 4.25 mm
Your answer [1]
3 Which factor provides evidence that igneous rocks were once molten?
A The presence of a crystalline texture.
B The presence of quartz.
C The presence of mica.
D The presence of feldspar.
Your answer [1]
E
SPECIMEN

4
© OCR 2016 H014/01
4 Carbonate minerals react with hydrochloric acid.
A geologist tested the mineral strontianite (SrCO3) with a 10% aqueous solution of cold
hydrochloric acid.
What would the result of this test be?
A bubbling observed
B precipitation formed
C colour change observed
D no reaction
Your answer [1]
5 Which texture best describes obsidian?
A smooth
B flow banded
C glassy
D ropey
Your answer [1]
SPECIMEN

5
© OCR 2016 H014/01 Turn over
6 The graph below shows data for a sediment that has been sieved.
The –2 (phi) sieve contains the coarsest particles.
Which statement best describes the degree of sorting shown?
A very well sorted
B well sorted
C poorly sorted
D moderately sorted
Your answer [1]
7 Where would you expect to find sediment showing this grain size distribution?
A glacial till
B river deposits
C aeolian sands
D beach deposits
Your answer [1]
Weight
(relative %)
Sieve size
(phi)
SPECIMEN

6
© OCR 2016 H014/01
8 The elements gold (Au), silver (Ag) and platinum (Pt) are known as the noble metals. They have
low crustal abundance.
Which statement about the noble metals is correct?
A They are lithophile elements because they oxidise easily.
B They are chalcophiles which form strong bonds with sulfur and are found in the mantle.
C Their crustal concentration factor is 1.0 compared with chrondite meteorites.
D They are resistant to oxidation, and while they form sulfides they prefer to alloy with other metals.
Your answer [1]
9 The map below shows some tectonic features in the North and South American regions.
Which letter, A, B, C or D, is located at a deep ocean trench?
Your answer [1]
A B
C
D
SPECIMEN

7
© OCR 2016 H014/01 Turn over
10 The map below shows a number of islands in the Hawaiian chain. The age of the island (Ma) is
shown in brackets.
With reference to the islands of Hawaii and Kauai, which of the following represents the average
rate of plate movement during the last 5.1 Ma?
A 8 cm year–1
B 10 cm year–1
C 12 cm year–1
D 14 cm year–1
Your answer [1]
11 What type of fault is shown in the diagram below?
A normal
B reverse
C thrust
D strike-slip
Your answer [1]
SPECIMEN

8
© OCR 2016 H014/01
12 What type of rock is shown below?
A intrusive igneous
B extrusive igneous
C metamorphic
D sedimentary
Your answer [1]
13 The temperature of lava within a volcano varies with depth.
A reading of 1323 K was taken at the surface of the lava lake in a volcano. 13 m below the
surface at the bottom of the lake, a second reading of 1443 K was taken.
Calculate the percentage decrease in temperature from the bottom to the top of the lava lake.
A 9.1%
B 8.3%
C 12.0%
D 15.6%
Your answer [1]
groundmass of mafic minerals and
plagioclase feldspar
plagioclase feldspar
10 mm
SPECIMEN

9
© OCR 2016 H014/01 Turn over
14 A diagnostic property of the rock-forming mineral quartz is the absence of cleavage.
Which statement about quartz best explains this property?
A Silicon–oxygen tetrahedra are very strong.
B The quartz lattice contains Si–O covalent bonds in all directions.
C The quartz lattice contains Si–O ionic bonds in all directions.
D Quartz is a framework silicate mineral.
Your answer [1]
15 Gold is a highly desirable mineral used in the production of jewellery and coins as well as in
other fields including electronics and dentistry.
The density (ρ) of gold is ~1.9 × 10⁴ kg m–3. A jeweller has 20 g of pure gold.
Calculate the volume of the gold.
A 0.001 m3
B 1.053 m3
C 1.05 × 10⁻⁶ m3
D 0.011 m3
Your answer [1]
SPECIMEN

10
© OCR 2016 H014/01
16 What term is used to describe an ancient ocean crust?
A oolites
B ophiolites
C xenolith
D kimberlite
Your answer [1]
17 What is a rheid?
A An ultramafic igneous rock composed of the mineral olivine.
B An area of partial melting deep within the lithosphere.
C A less dense stony meteorite similar to the mantle.
D A solid material that flows.
Your answer [1]
18 About 80% of the copper mined today is extracted from sulfide ores.
The mineral chalcocite (Cu2S) is a copper sulfide ore. If the molar mass of copper is 63.5 g mol–1
and the molar mass of sulfur is 32.1 g mol–1, what is the percentage by mass of copper in
chalcocite?
A 63.5%
B 79.8%
C 66.4%
D 50.6%
Your answer [1]
SPECIMEN

11
© OCR 2016 H014/01 Turn over
19 Which of the following could not be found in an ancient desert deposit?
A Red colour formed by iron oxide.
B Evaporites and clays formed in lakes.
C Well sorted and well-rounded sand grains.
D Bands of flint formed by diagenesis.
Your answer [1]
20 The environment in which sediments are deposited is a major factor in the resulting sedimentary
rock. Fossils are of value to the oil and gas industry as indicators of rocks which may be
potential reservoirs of hydrocarbon deposits.
Which of the following features of a fossil does not give information about its
palaeoenvironment?
A thickness of shell
B shell ornamentation
C stratigraphic age
D detail of preservation
Your answer [1]
SPECIMEN

12
© OCR 2016 H014/01
BLANK PAGE
SECTION B STARTS ON THE NEXT PAGE
SPECIMEN

13
© OCR 2016 H014/01 Turn over
Section B
Answer all the questions.
21 This question is about geological structures.
(a) The photograph below shows a geological feature exposed in a roadside cutting in
Cumbria.
In the space below draw a labelled sketch to show the main features of the geological
structure.
[3]
SPECIMEN
14
© OCR 2016 H014/01
(b) Explain in detail how an angular unconformity is formed.
…………………………………………………………………………………………………..........
…………………………………………………………………………………………………..........
…………………………………………………………………………………………………..........
…………………………………………………………………………………………………..........
…………………………………………………………………………………………………..........
……………………………………………………………………………………………..…….… [3]
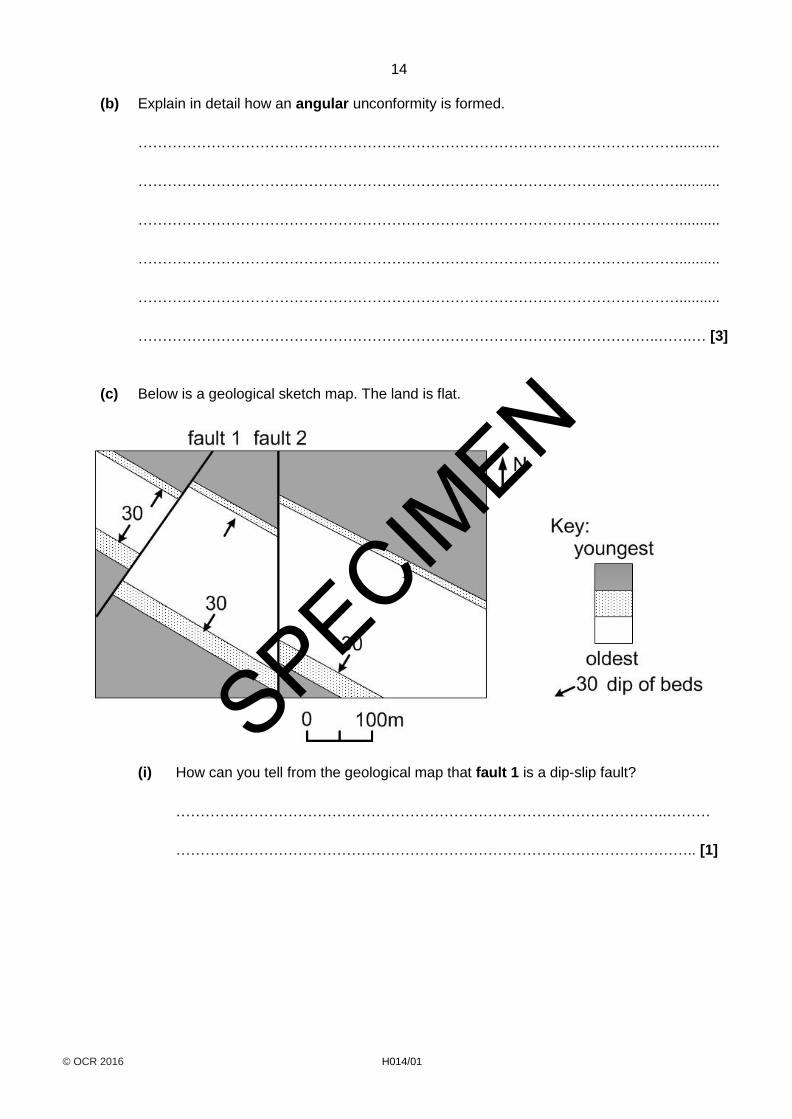
(c) Below is a geological sketch map. The land is flat.
(i) How can you tell from the geological map that fault 1 is a dip-slip fault?
………………………………………………………………………………………..………
…………………………………………………………………………………………….. [1]
SPECIMEN

15
© OCR 2016 H014/01 Turn over
(ii) Which side of fault 1 is the downthrow side. Explain your answer.
………………………………………………………………………………………..………
……………………………………………………………………………………………….
……………………………………………………………………………………………….
………………………………………………………………………………………..…….[2]
(iii) Use the scale to measure the displacement of fault 2.
…………………………………………………………………………………………….. [1]
SPECIMEN
16
© OCR 2016 H014/01
22 Geologists need to be able to date the formation of different rocks in order to understand the
processes that shaped the Earth.
Methods include numerical dating and relative dating.
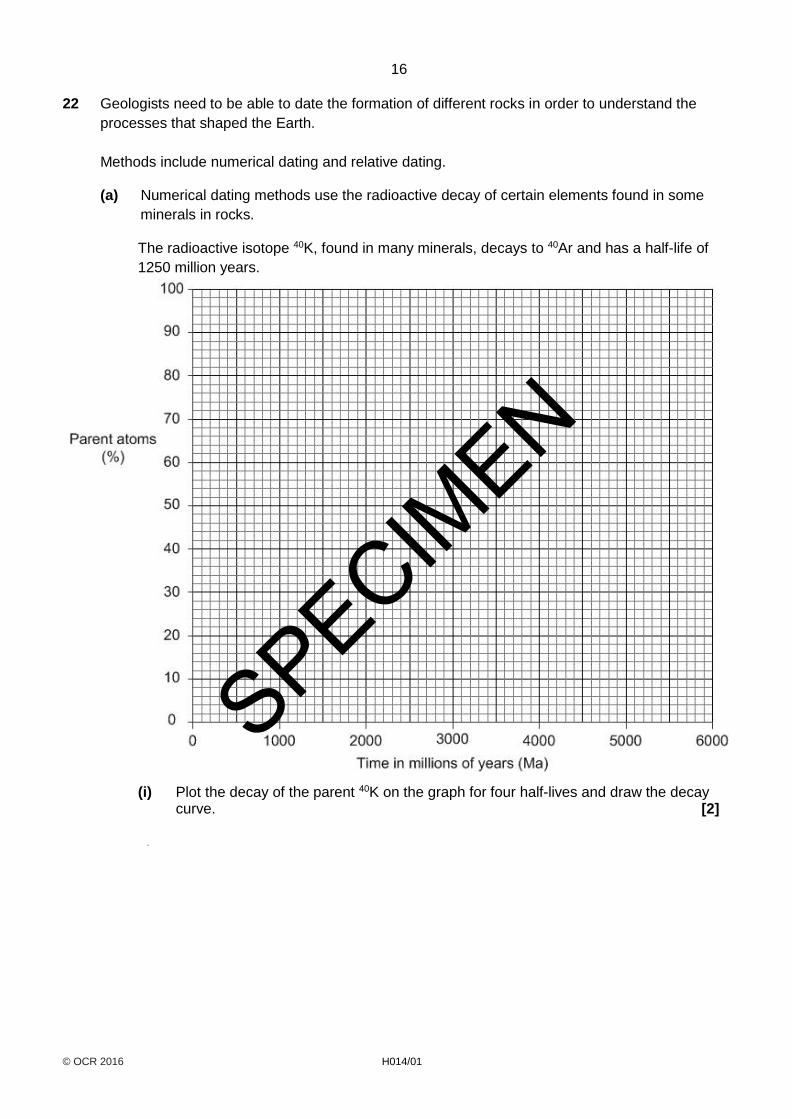
(a) Numerical dating methods use the radioactive decay of certain elements found in some
minerals in rocks.
The radioactive isotope 40K, found in many minerals, decays to 40Ar and has a half-life of
1250 million years.
(i) Plot the decay of the parent 40K on the graph for four half-lives and draw the decay curve. [2]
(ii)
SPECIMEN

17
© OCR 2016 H014/01 Turn over
(ii) A whole rock analysis was found to have a ratio of 40K : 40Ar of 1 : 4. Use your graph to
describe and explain how this radiometric decay can be used to calculate the age of
this rock.
…………………………………………………………………………………………………
…………………………………………………………………………………………………
…………………………………………………………………………………………………
…………………………………………………………………………………………………
…………………………………………………………………………………………………
…………………………………………………………………………………………………
…………………………………………………………………………………………………
…………………………………………………………………………………………….... [4]
(iii) The discovery of radioactivity in 1896 led to major changes in Earth science in the
twentieth century.
Explain the ways in which the discovery and use of radioactivity led to the
development of geological understanding over the last 100 years.
…………………………………………………………………………………………………
…………………………………………………………………………………………………
…………………………………………………………………………………………………
…………………………………………………………………………………………………
…………………………………………………………………………………………………
…………………………………………………………………………………………….... [3]
SPECIMEN
18
© OCR 2016 H014/01
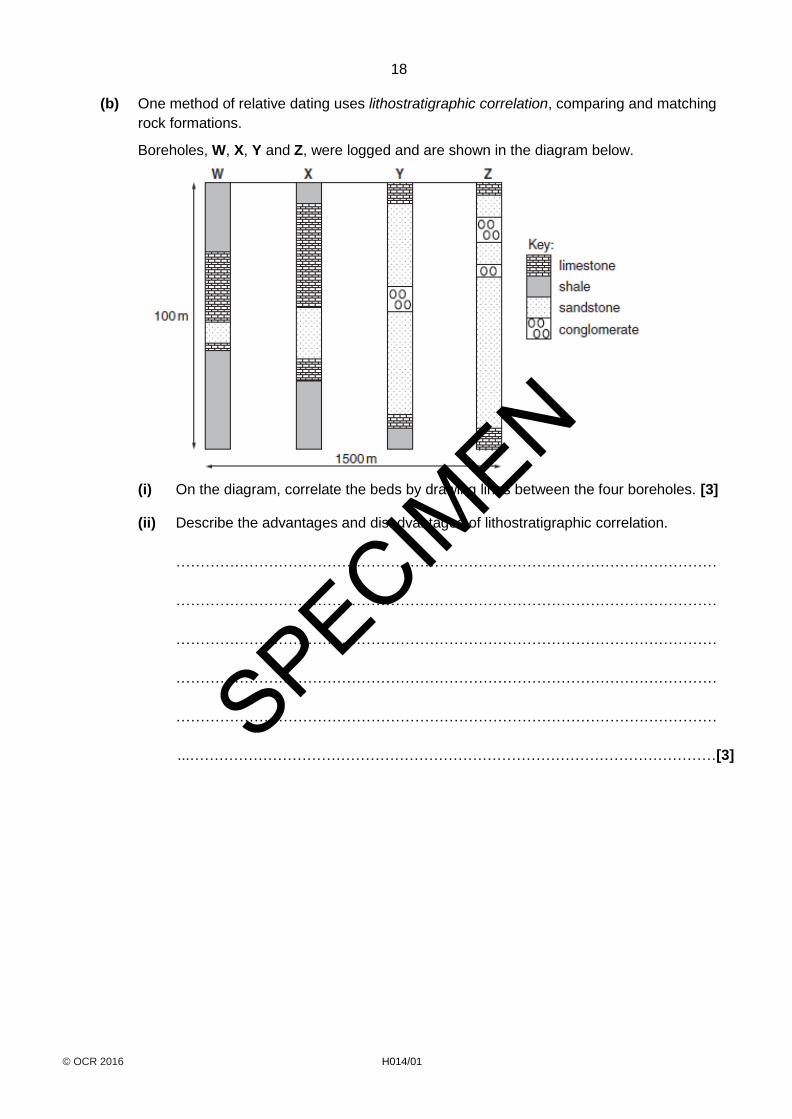
(b) One method of relative dating uses lithostratigraphic correlation, comparing and matching
rock formations.
Boreholes, W, X, Y and Z, were logged and are shown in the diagram below.
(i) On the diagram, correlate the beds by drawing lines between the four boreholes. [3]
(ii) Describe the advantages and disadvantages of lithostratigraphic correlation.
…………………………………………………………………………………………………
…………………………………………………………………………………………………
…………………………………………………………………………………………………
…………………………………………………………………………………………………
…………………………………………………………………………………………………
...………………………………………………………………………………………………[3]
SPECIMEN

19
© OCR 2016 H014/01 Turn over
(c) Temperature measurements down the boreholes in part (b) showed that the temperature
increased with depth.
Geothermal gradient describes how temperature changes with depth inside the Earth.
The geothermal gradient for a region, Q, has been plotted on the graph below.
Temperature (°C)
(i) Calculate the geothermal gradient between 100 km and 400 km for region Q.
Include units in your answer.
geothermal gradient………………….……… units……………….… [2]
(ii) Explain why geothermal gradient changes with depth.
………………………………………………………………………………………..………
……………………………………………………………………………………………….
……………………………………………………………………………………………….
………………………………………………………………………………………..…….[2]
0
50
100
150
200
250
300
350
400
0 500 1000 1500 2000
Depth
(km)
SPECIMEN

20
© OCR 2016 H014/01
23 The table below shows temperature readings measured in a sandstone country rock around two
igneous intrusions of the same composition but of different size.
Distance from intrusion (m) Temperature of rocks (°C)
Intrusion E Intrusion F
0 650 650
100 420 520
200 250 390
300 150 280
400 100 190
500 100 120
600 100 100
(a) Using data from the table, identify which is the larger intrusion and suggest why the
temperature change in the country rock may vary with the size of the intrusion.
………………………………………………………………………………………………………..
………………………………………………………………………………………………………..
………………………………………………………………………………………………………..
………………………………………………………………………………………………………..
………………………………………………………………………………………………………..
...……………………………………………………………………………………………….… [3]
(b) The diagram below shows a pressure/temperature plot for four different rocks.
(i) On the diagram, shade the area where regional metamorphism takes place. [1]
Pressure
(kbar)
Temperature (°C)
SPECIMEN

21
© OCR 2016 H014/01 Turn over
(ii) The table below lists some properties of the four rocks.
Complete the table below with the names of the four rock types shown on the
diagram. You may use each rock type once, more than once or not at all.
Formed at the greatest depth
…………………………………
Been re-crystallised by contact metamorphism
…………………………………
Has a cleavage
…………………………………
A coarse banded texture
…………………………………
No preferred orientation of its minerals
…………………………………
Parallel alignment of muscovite mica crystals
…………………………………
[2]
SPECIMEN

22
© OCR 2016 H014/01
(c) The diagram below shows a metamorphic aureole around a granite intrusion.
Explain why the width of the metamorphic aureole may vary.
………………………………………………………………………………………………………..
………………………………………………………………………………………………………..
………………………………………………………………………………………………………..
………………………………………………………………………………………………………..
………………………………………………………………………………………………………..
...………………………………………………………………………………………………...… [3]
(d) When geologists reconstruct the conditions of contact and regional metamorphism, they
concentrate on pelitic (fine grained siliciclastic) rocks. Explain why geologists prefer to
investigate some types of metamorphosed sedimentary rocks and not others.
……………………………………………………………………………………….……..………
………………………………………………………………………………………………..…….
………………………………………………………………………………………………..…….
…………………………………………………………………………………………………….[2]
SPECIMEN

23
© OCR 2016 H014/01 Turn over
24 Sediment transport processes not only affect the characteristics of the sediments themselves, but
can also produce structures which suggest the nature of the sedimentary environment.
The diagram below shows how sediments are transported by a river.
(a) Describe the importance of river velocity in determining the method by which sediment is
transported downstream?
……………………………………………………………………………………….……..………
………………………………………………………………………………………………..…….
………………………………………………………………………………………………..…….
…………………………………………………………………………………………………….[2]
(b) The photograph below shows sediment in a river bed.
Some students collected 15 clasts from two points in a river by systematically sampling
across the river bed. They measured the length and width (to the sharpest point) of each
clast to investigate how sediment changes as it is transported downstream.
The table on the next page shows the data they collected.
SPECIMEN

24
© OCR 2016 H014/01
(i) Calculate the mean width of the upstream clasts.
mean = …………………………… mm [1]
(ii) An approximate measure of the roundness of the clasts can be calculated using the
formula
1000a
2 r b
R
Where br is half the clast width (measured to the sharpest point) and a is the clast
length.
The mean roundness of the downstream clasts is 628.
Using the formula, calculate the mean roundness of the upstream clasts.
R = …………………………… [2]
Downstream Upstream
Clast Length (mm) Running mean of
length (mm)
Width (mm) (to sharpest
point) Length (mm)
Running mean of
length (mm)
Width (mm) (to sharpest
point)
1 32 32 14 56 56 15
2 27 30 20 39 48 14
3 45 35 34 98 64 35
4 58 41 42 78 68 39
5 60 44 39 108 76 40
6 40 44 20 64 74 20
7 52 45 22 78 74 22
8 42 45 25 56 72 15
9 52 45 29 87 74 31
10 30 44 23 92 76 24
11 23 42 12 36 72 12
12 45 42 33 78 73 35
13 43 42 27 68 72 28
14 56 43 34 92 74 35
15 39 43 26 71 73 27
Mean 43 27 73
SPECIMEN

25
© OCR 2016 H014/01 Turn over
(iii) Comment on the validity of the samples the students collected.
………………………………………………………………………………………………..….
…………………………………………………………………………………………………[1]
(iv) The students’ data is plotted on the graph below.
Length (mm)
Using the graph and your answer to (ii), discuss the data collected and draw a
conclusion about how river bedload changes as it is transported downstream. Explain
your answer.
……………………………………………………………………………………….……..……
………………………………………………………………………………………………..….
……………………………………………………………………………………….……..……
………………………………………………………………………………………………..….
……………………………………………………………………………………….……..……
………………………………………………………………………………………………..….
………………………………………………………………………………………………..….
…………………………………………………………………………………………………[4]
0
5
10
15
20
25
30
35
40
45
50
0 20 40 60 80 100 120
Downstream pebbles
Upstream pebbles
Width
(mm) Downstream clasts
Upstream clasts
SPECIMEN

26
© OCR 2016 H014/01
(c)* The students then studied a nearby cliff section of sedimentary rock. Their geological guide
book said that the sedimentary rocks may have been deposited by a river flowing into a
playa lake, and that later tectonic processes had turned the whole sequence upside down.
Discuss possible sedimentary structures that might be recognised in the outcrop which
would support the proposed environment of deposition and also possible evidence for the
sequence being overturned.
Explain your decisions. You may find the use of diagrams helps your answer. [6]
……………………………………………………………………………………………………
……………………………………………………………………………………………………
……………………………………………………………………………………………………
……………………………………………………………………………………………………
……………………………………………………………………………………………………
……………………………………………………………………………………………………
……………………………………………………………………………………………………
……………………………………………………………………………………………………
……………………………………………………………………………………………………
……………………………………………………………………………………………………
……………………………………………………………………………………………………
……………………………………………………………………………………………………
……………………………………………………………………………………………………
……………………………………………………………………………………………………
……………………………………………………………………………………………………
SPECIMEN
27
© OCR 2016 H014/01 Turn over
Additional answer space if required.
……………………………………………………………………………………………………
……………………………………………………………………………………………………
……………………………………………………………………………………………………
……………………………………………………………………………………………………
……………………………………………………………………………………………………
……………………………………………………………………………………………………
……………………………………………………………………………………………………
……………………………………………………………………………………………………
……………………………………………………………………………………………………
……………………………………………………………………………………………………
……………………………………………………………………………………………………
……………………………………………………………………………………………………
SPECIMEN
28
© OCR 2016 H014/01
25 Minerals help geologists distinguish between igneous, sedimentary and metamorphic rocks.
(a) (i) For each rock group, name a mineral that is found in that rock group only.
Igneous ………………………………...........................................................................
Sedimentary …………………………………………………………………………….....
Metamorphic …………………………………………………………………………..…..
[2]
(ii) Give two reasons why the mineral quartz is common in all three groups of rock.
1…………………………………………………………………………………………………
...……………………………………………………………………………………………….…
2…………………………………………………………………………………………………
...………………………………………………………………………………………………[2]
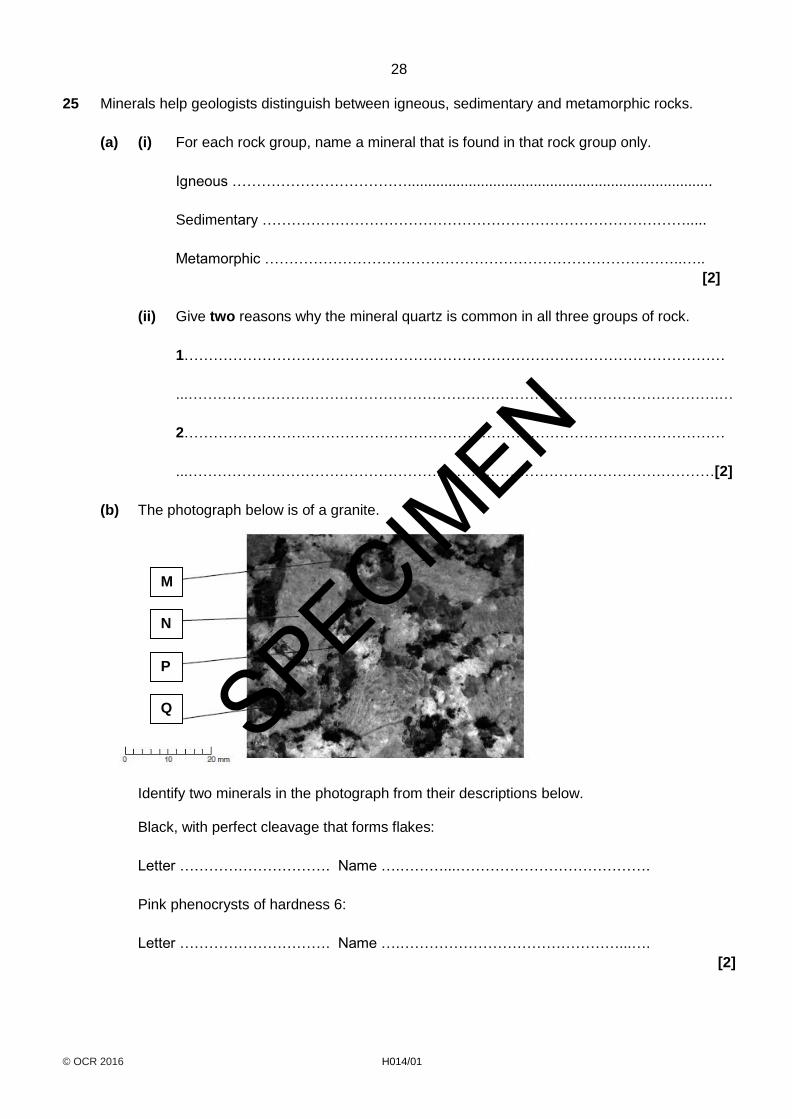
(b) The photograph below is of a granite.
Identify two minerals in the photograph from their descriptions below.
Black, with perfect cleavage that forms flakes:
Letter …………………………. Name ….………...………………………………….
Pink phenocrysts of hardness 6:
Letter …………………………. Name ….………………………………………...….
[2]
M
N
P
Q SPECIM
EN

29
© OCR 2016 H014/01 Turn over
(c) The table below gives information relating to minerals found in the Zechstein salt deposits of
northern Europe.
Specific gravity
Crystal system and cleavage
Hardness Composition Colour Name
2.0
Varies 2 K salts White Potash salts
2.3 Massive or cubic with excellent cleavage so cleaves into smaller cubes
2.5 NaCl White Halite
2.9
Massive layers 3 CaSO4 White Anhydrite
2.2
Fibrous layers 2 CaSO4·2H2O White or pink Gypsum
2.8 Massive or rhombohedral but faces are often curved
3.5 CaMg(CO3)2 White Dolomite
2.7 Massive or rhombohedral with three planes of cleavage so cleaves into smaller rhombs
3 CaCO3 White Calcite
Using information from the table, identify minerals B, C and D.
Mineral B ……………………………………………………………………………………………
Mineral C ……………………………………………………………………………………….…..
Mineral D …………………………………………………………………………………..………...
[2]
SPECIMEN

30
© OCR 2016 H014/01
(d) (i) A student needed to distinguish between three metallic ore samples.
Using colour, the student decided that the first sample, a dark red, was hematite, the second sample, a grey sample, was galena and the third sample, a pale brass-yellow sample, was iron pyrites.
Evaluate the student’s decision.
……………………………………………………………………………………………
…………………………………………………………………………………………… [1]
(ii) Suggest two ways to improve the validity of the identifications the student has made.
……………………………………………………………………………………………
……………………………………………………………………………………………
……………………………………………………………………………………………
…………………………………………………………………………………………… [2]
SPECIMEN

31
© OCR 2016 H014/01 Turn over
26 Geologists use seismograms to investigate earthquakes.
(a) (i) The table shows arrival times to the nearest half minute for the P and S waves shown
on three seismograms.
P wave arrival time (min) S wave arrival time (min)
Seismogram A 6 10
Seismogram B 1.5 6.5
Seismogram C
Complete the table for seismogram C, using the data above. Give the arrival times to
the nearest half minute.
[1]
(ii) Using the P wave arrival time data from the seismograms and assuming that P waves
travel at 5 × 10² km min–1, calculate the distance from the epicentre for stations A, B
and C.
Station A distance ……………………… km
Station B distance ……………………… km
Station C distance ……………………… km
[1]
(b) Use the distance from the epicentre for all three stations to locate the epicentre of the
earthquake on the diagram below.
[3]
SPECIMEN

32
© OCR 2016 H014/01
(c) Seismic wave velocity can be used to help determine the nature and depth of the earth’s interior. The graph below shows how the velocity of P waves change as they travel through the Earth.
(i) From the graph, calculate the average velocity of P waves between depths of 1200 and 1800 km.
average velocity =………….…………km s–1 [1]
(ii) Explain why the P wave velocity increases between 200 and 2900 km depth.
……………………………………………………………………………………………
…………………………………………………………………………………………… [1]
SPECIMEN

33
© OCR 2016 H014/01 Turn over
(iii) The table below shows changes in the velocity of S waves. Plot the data on the axes in part (c) and draw the line on the graph. [2]
S wave velocity (km s–1)
3.0 5.0 4.0 5.0 7.0 0.0 0.0 4.0 4.5
Depth (km)
0 100 150 250 2900 2900 5100 5100 6371
[2]
(iv) Suggest the geological reason for the difference between the graphs for P waves and S waves between 2900 and 5100 km depth.
……………………………………………………………………………………………
…………………………………………………………………………………………… [1]
(v) Use the graph to describe the role of P and S waves in identifying layers within the Earth.
……………………………………………………………………………………………
……………………………………………………………………………………………
……………………………………………………………………………………………
…………………………………………………………………………………………… [3]
SPECIMEN

34
© OCR 2016 H014/01
27 In 1812 Friedrich Mohs devised a hardness scale for identifying mineral specimens.
(a) Why are there usually 9 minerals supplied in a laboratory Mohs Hardness Scale kit, rather than the 10 minerals originally suggested?
……………………………………………………………………………………………………
…………………………………………………………………………………………………… [1]
(b) A student found two minerals, Specimen A and Specimen B, from an old hardness kit which had lost their labels.
Using a laboratory Mohs Hardness Scale kit, describe a procedure the student could use to identify Specimen A and Specimen B.
……………………………………………………………………………………………………
……………………………………………………………………………………………………
……………………………………………………………………………………………………
……………………………………………………………………………………………………
……………………………………………………………………………………………………
…………………………………………………………………………………………………… [3]
(c) Specimen A does not scratch Specimen B. The student observed that a third specimen, Specimen C, had a grey appearance similar to Specimen B and was able to scratch Specimen A.
What does the information suggest about the identity of Specimen C?
……………………………………………………………………………………………………
…………………………………………………………………………………………………… [1]
SPECIMEN

35
© OCR 2016 H014/01 Turn over
(d) Common objects can be used in the place of minerals for a quick hardness test.
The table below shows some of the common objects used to test the hardness of Specimen C.
Common object Mohs hardness Specimen C scratched?
fingernail 2–2.5 X
nail 4
knife blade 5–6.5
quartz 7
The table below shows the appearance and hardness of a number of minerals.
Mineral Appearance Mohs hardness
Gypsum
White colour, translucent 2
Anhydrite White/grey colour, sugary appearance
3–3.5
Calcite White/pink colour, sugary appearance
3
Quartz White/pink colour, translucent
7
The student concluded that Specimen C was anhydrite.
Evaluate the student’s judgement.
……………………………………………………………………………………………………
……………………………………………………………………………………………………
……………………………………………………………………………………………………
…………………………………………………………………………………………………… [2]
SPECIMEN

36
© OCR 2016 H014/01
28 The geology of South Devon has often been characterised by the ‘red beds’ frequently seen in
coastal sections, notably in the Torbay area.
(a) A group of geology students decide to investigate these ‘red beds’. They choose an outcrop
near Paignton Harbour which appears to show large scale cross bedded sandstones but
interspersed with lenses of a coarser sediment. See photographs 28A and 28B below.
Photograph 28A Photograph 28B
Cross bedded sandstones in centre of photo Lens of coarser material
The students decided to do a grain analysis on a weakly cemented block of the coarser
sediment in order to plot a cumulative weight percent frequency curve.
(i) Outline a practical procedure that the students could follow.
……………………………………………………………………………………………………
……………………………………………………………………………………………………
……………………………………………………………………………………………………
……………………………………………………………………………………………………
……………………………………………………………………………………………………
……………………………………………………………………………………………………
……………………………………………………………………………………………………
...……………………..………………………………………………………………………..[4]
SPECIMEN

37
© OCR 2016 H014/01 Turn over
(ii) Several of the elongated clasts in photograph 28B are tilted in a similar direction.
Name the sedimentary structure represented by the tilted clasts and explain how this
tilting occurs.
……………………………………………………………………………………………………
……………………………………………………………………………………………………
……………………………………………………………………………………………………
……………………………………………………………………………………………………
...……………………..………………………………………………………………………..[3]
(iii)* The students use their cumulative weight percent frequency curve to calculate the
sorting coefficient of the coarser material to be 1.9. From the geological guide, they
know value for the sorting of the sandstones is 0.3.
Use the values above, along with the photographs and information given in the earlier
parts of this question, to suggest the environment of deposition of the rocks found in
this outcrop. You should explain the basis of your decisions. [6]
……………………………………………………………………………………………………
……………………………………………………………………………………………………
……………………………………………………………………………………………………
……………………………………………………………………………………………………
……………………………………………………………………………………………………
……………………………………………………………………………………………………
……………………………………………………………………………………………………
……………………………………………………………………………………………………
……………………………………………………………………………………………………
……………………………………………………………………………………………………
……………………………………………………………………………………………………
……………………………………………………………………………………………………
……………………………………………………………………………………………………
SPECIMEN

38
© OCR 2016 H014/01
……………………………………………………………………………………………………
……………………………………………………………………………………………………
Additional answer space if required.
……………………………………………………………………………………………………
……………………………………………………………………………………………………
……………………………………………………………………………………………………
……………………………………………………………………………………………………
……………………………………………………………………………………………………
……………………………………………………………………………………………………
……………………………………………………………………………………………………
……………………………………………………………………………………………………
……………………………………………………………………………………………………
……………………………………………………………………………………………………
……………………………………………………………………………………………………
……………………………………………………………………………………………………
END OF QUESTION PAPER
SPECIMEN

39
© OCR 2016 H014/01
ADDITIONAL ANSWER SPACE
If additional space is required, you should use the following page(s). The question number(s) must be
clearly shown in the margin.
……………………………………..…………………………………………………………………………………
……………………………………..…………………………………………………………………………………
……………………………………..…………………………………………………………………………………
……………………………………..…………………………………………………………………………………
……………………………………..…………………………………………………………………………………
……………………………………..…………………………………………………………………………………
……………………………………..…………………………………………………………………………………
……………………………………..…………………………………………………………………………………
……………………………………..…………………………………………………………………………………
……………………………………..…………………………………………………………………………………
……………………………………..…………………………………………………………………………………
……………………………………..…………………………………………………………………………………
……………………………………..…………………………………………………………………………………
……………………………………..…………………………………………………………………………………
……………………………………..…………………………………………………………………………………
……………………………………..…………………………………………………………………………………
……………………………………..…………………………………………………………………………………
……………………………………..…………………………………………………………………………………
……………………………………..…………………………………………………………………………………
……………………………………..…………………………………………………………………………………
……………………………………..…………………………………………………………………………………
……………………………………..…………………………………………………………………………………
SPECIMEN

40
© OCR 2016 H014/01
……………………………………..…………………………………………………………………………………
……………………………………..…………………………………………………………………………………
……………………………………..…………………………………………………………………………………
……………………………………..…………………………………………………………………………………
……………………………………..…………………………………………………………………………………
……………………………………..…………………………………………………………………………………
……………………………………..…………………………………………………………………………………
……………………………………..…………………………………………………………………………………
……………………………………..…………………………………………………………………………………
……………………………………..…………………………………………………………………………………
……………………………………..…………………………………………………………………………………
……………………………………..…………………………………………………………………………………
……………………………………..…………………………………………………………………………………
……………………………………..…………………………………………………………………………………
……………………………………..…………………………………………………………………………………
……………………………………..…………………………………………………………………………………
……………………………………..…………………………………………………………………………………
……………………………………..…………………………………………………………………………………
……………………………………..…………………………………………………………………………………
Copyright Information:
OCR is committed to seeking permission to reproduce all third-party content that it uses in the assessment materials. OCR has attempted to
identify and contact all copyright holders whose work is used in this paper. To avoid the issue of disclosure of answer-related information to
candidates, all copyright acknowledgements are reproduced in the OCR Copyright Acknowledgements booklet. This is produced for each
series of examinations and is freely available to download from our public website (www.ocr.org.uk) after the live examination series.
If OCR has unwittingly failed to correctly acknowledge or clear any third-party content in this assessment material, OCR will be happy to correct
its mistake at the earliest possible opportunity.
For queries or further information please contact the Copyright Team, First Floor, 9 Hills Road, Cambridge CB2 1GE.
OCR is part of the Cambridge Assessment Group; Cambridge Assessment is the brand name of University of Cambridge Local Examinations
Syndicate (UCLES), which is itself a department of the University of Cambridge.
SPECIMEN
F100023/2.0
…day June 20XX – Morning/Afternoon
AS Level Geology
H014/01 Geology
SAMPLE MARK SCHEME
Duration: 2 hours 30 minutes
MAXIMUM MARK 120
This document consists of 26 pages
SPECIMEN
H014/01 Mark Scheme June 20XX
2
MARKING INSTRUCTIONS
PREPARATION FOR MARKING
RM ASSESSOR 1. Make sure that you have accessed and completed the relevant training packages for on-screen marking: RM assessor Online Training; OCR
Essential Guide to Marking. 2. Make sure that you have read and understood the mark scheme and the question paper for this unit. 3. Log-in to RM assessor and mark the required number of practice responses (“scripts”) and the required number of standardisation
responses.
MARKING 1. Mark strictly to the mark scheme. 2. Marks awarded must relate directly to the marking criteria. 3. The schedule of dates is very important. It is essential that you meet the RM assessor 50% and 100% (traditional 50% Batch 1 and 100%
Batch 2) deadlines. If you experience problems, you must contact your Team Leader (Supervisor) without delay. 4. If you are in any doubt about applying the mark scheme, consult your Team Leader by telephone, email or via the RM assessor messaging
system.
SPECIMEN
H014/01 Mark Scheme June 20XX
3
5. Work crossed out: a. where a candidate crosses out an answer and provides an alternative response, the crossed out response is not marked and gains no
marks b. if a candidate crosses out an answer to a whole question and makes no second attempt, and if the inclusion of the answer does not
cause a rubric infringement, the assessor should attempt to mark the crossed out answer and award marks appropriately. 6. Always check the pages (and additional objects if present) at the end of the response in case any answers have been continued there. If the
candidate has continued an answer there then add a tick to confirm that the work has been seen. 7. There is a NR (No Response) option. Award NR (No Response)
- if there is nothing written at all in the answer space - OR if there is a comment which does not in any way relate to the question (e.g. ‘can’t do’, ‘don’t know’) - OR if there is a mark (e.g. a dash, a question mark) which isn’t an attempt at the question. Note: Award 0 marks – for an attempt that earns no credit (including copying out the question).
8. The RM Assessor comments box is used by your Team Leader to explain the marking of the practice responses. Please refer to these
comments when checking your practice responses. Do not use the comments box for any other reason. If you have any questions or comments for your Team Leader, use the phone, the RM Assessor messaging system, or email.
9. Assistant Examiners will send a brief report on the performance of candidates to their Team Leader (Supervisor) via email by the end of the marking period. The report should contain notes on particular strengths displayed as well as common errors or weaknesses. Constructive criticism of the question paper/mark scheme is also appreciated.
SPECIMEN

H014/01 Mark Scheme June 20XX
4
10. For answers marked by levels of response: Read through the whole answer from start to finish, using the Level descriptors to help you decide whether it is a strong or weak answer. The indicative geological content in the Guidance column indicates the expected parameters for candidates’ answers, but be prepared to recognise and credit unexpected approaches where they show relevance. Using a ‘best-fit’ approach based on the skills and geological content evidenced within the answer, first decide which set of level descriptors, Level 1, Level 2 or Level 3, best describes the overall quality of the answer. Once the level is located, award the higher or lower mark: The higher mark should be awarded where the level descriptor has been evidenced and all aspects of the communication statement (in italics) have been met. The lower mark should be awarded where the level descriptor has been evidenced but aspects of the communication statement (in italics) are missing. In summary: The skills and geological content determine the level. The communication statement determines the mark within a level. Level of response questions on this paper are 24c and 28(a)(iii).
SPECIMEN
H014/01 Mark Scheme June 20XX
5
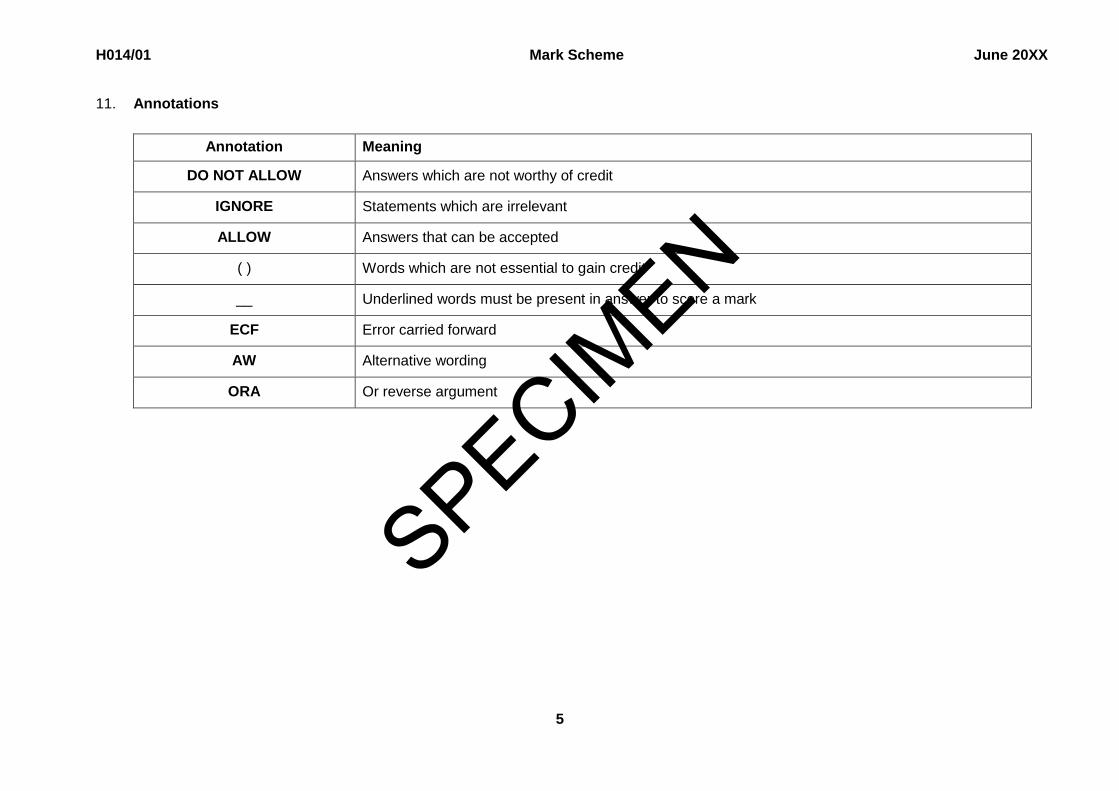
11. Annotations
Annotation Meaning
DO NOT ALLOW Answers which are not worthy of credit
IGNORE Statements which are irrelevant
ALLOW Answers that can be accepted
( ) Words which are not essential to gain credit
__ Underlined words must be present in answer to score a mark
ECF Error carried forward
AW Alternative wording
ORA Or reverse argument
SPECIMEN
H014/01 Mark Scheme June 20XX
6
12. Subject-specific Marking Instructions
INTRODUCTION
Your first task as an Examiner is to become thoroughly familiar with the material on which the examination depends. This material includes:
the specification, especially the assessment objectives
the question paper
the mark scheme.
You should ensure that you have copies of these materials.
You should ensure also that you are familiar with the administrative procedures related to the marking process. These are set out in the OCR
booklet Instructions for Examiners. If you are examining for the first time, please read carefully Appendix 5 Introduction to Script Marking:
Notes for New Examiners.
Please ask for help or guidance whenever you need it. Your first point of contact is your Team Leader.
SPECIMEN
H014/01 Mark Scheme June 20XX
7
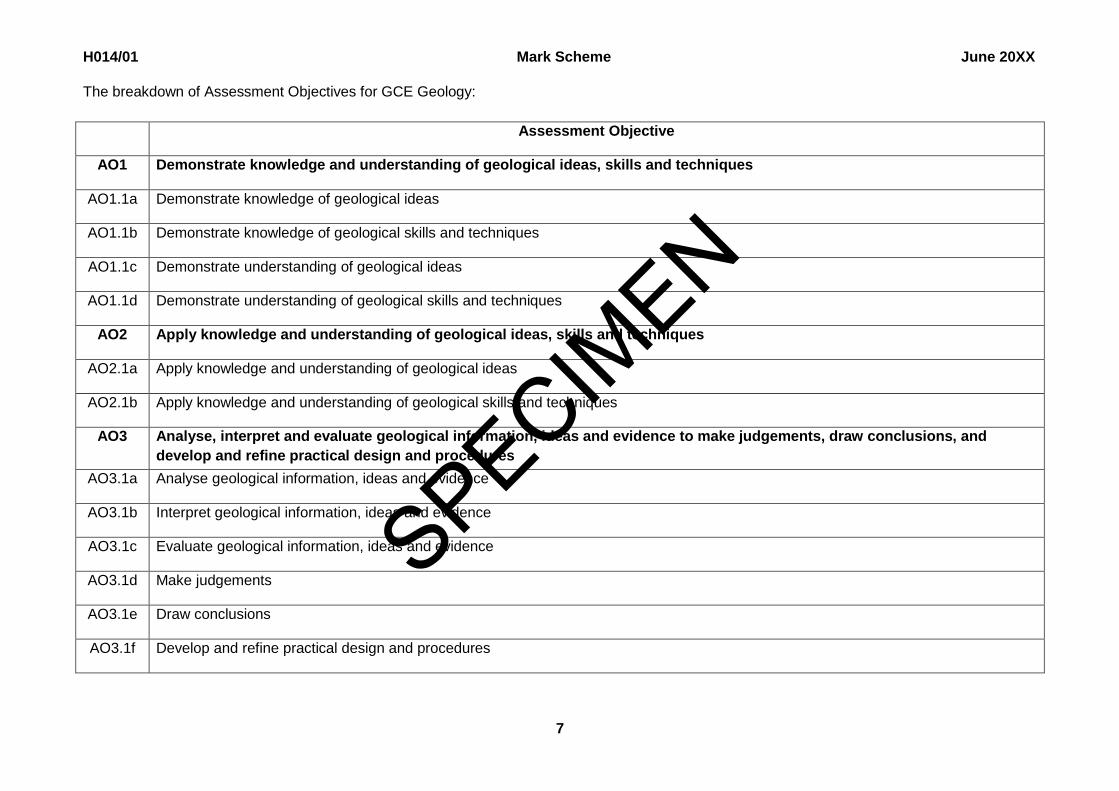
The breakdown of Assessment Objectives for GCE Geology:
Assessment Objective
AO1 Demonstrate knowledge and understanding of geological ideas, skills and techniques
AO1.1a Demonstrate knowledge of geological ideas
AO1.1b Demonstrate knowledge of geological skills and techniques
AO1.1c Demonstrate understanding of geological ideas
AO1.1d Demonstrate understanding of geological skills and techniques
AO2 Apply knowledge and understanding of geological ideas, skills and techniques
AO2.1a Apply knowledge and understanding of geological ideas
AO2.1b Apply knowledge and understanding of geological skills and techniques
AO3 Analyse, interpret and evaluate geological information, ideas and evidence to make judgements, draw conclusions, and
develop and refine practical design and procedures
AO3.1a Analyse geological information, ideas and evidence
AO3.1b Interpret geological information, ideas and evidence
AO3.1c Evaluate geological information, ideas and evidence
AO3.1d Make judgements
AO3.1e Draw conclusions
AO3.1f Develop and refine practical design and procedures
SPECIMEN

H014/01 Mark Scheme June 20XX
8
Question Answer Marks AO
element Guidance
1 C 1 2.1a
2 D 1 2.1b
3 A 1 1.1a
4 A 1 1.1d
5 C 1 1.1a
6 C 1 2.1a
7 A 1 1.1c
8 D 1 2.1a
9 B 1 2.1a
10 B 1 2.1b
11 B 1 2.1a
12 A 1 1.1c
13 B 1 2.1b
14 B 1 1.1c
15 C 1 2.1b
16 B 1 1.1a
17 D 1 1.1a
18 B 1 2.1b
19 D 1 1.1c
20 C 1 1.1c
TOTAL 20
SPECIMEN

H014/01 Mark Scheme June 20XX
9
Question Answer Marks AO
element Guidance
21 (a) clear sketch showing in the correct proportions:
synform
antiform
e.g.
labels to include: antiform; synform; limb; axial plane trace;
crest; trough
3
2.1b × 3
Minimum of three labels required
(b) sediments laid down horizontally
sedimentation stops as rocks are uplifted and eroded
new deposits laid down unconformably on erosion surface
3 1.1c × 3 ALLOW labeled diagrams showing stated
points
SPECIMEN

H014/01 Mark Scheme June 20XX
10
Question Answer Marks AO
element Guidance
(c) (i) the distances between the two limbs of the fold are different
on either side of the fault / the outcrop is displaced in opposite
directions on each side of the axial plane / axial plane trace
not displaced
1 2.1a
ALLOW alternative wording
(ii) left / NW / W
the outcrop of the beds are closer on the downthrown side of
an antiform / beds are younger on the downthrown side / ORA
2 1.1c
2.1a
(iii) 50 m ± 5 m
1 2.1b
Total 10
SPECIMEN
H014/01 Mark Scheme June 20XX
11
Question Answer Marks AO
element Guidance
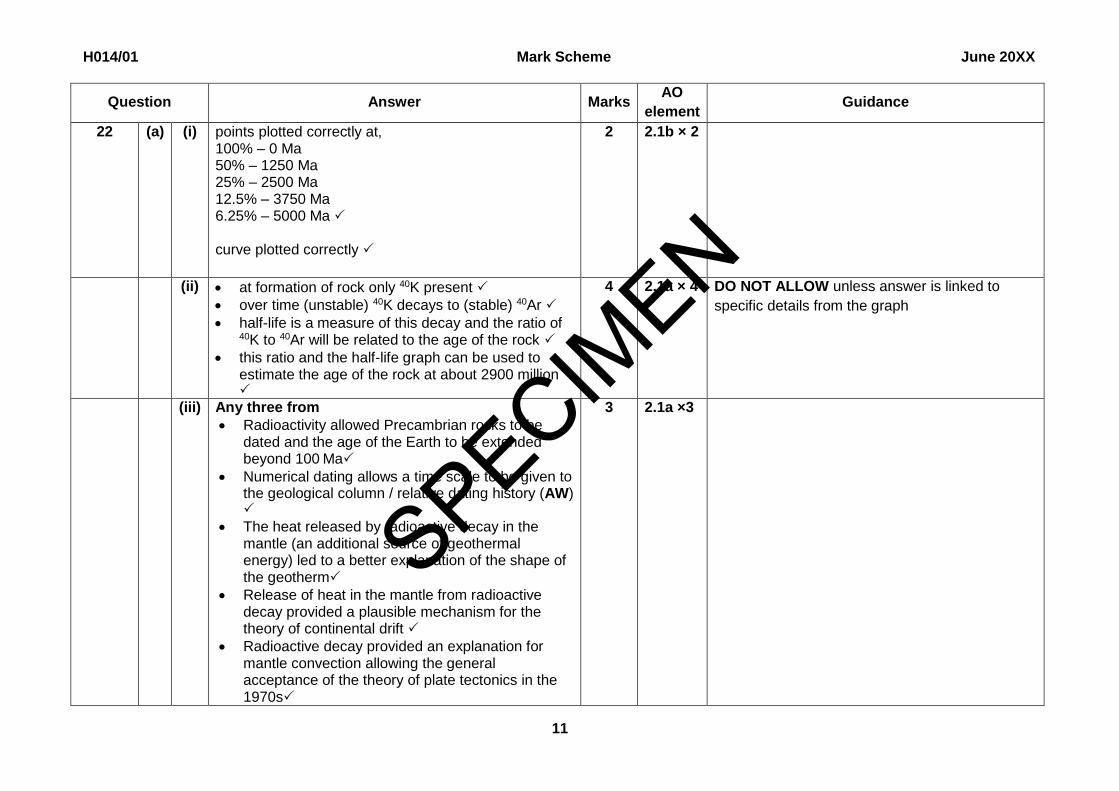
22 (a) (i) points plotted correctly at, 100% – 0 Ma 50% – 1250 Ma 25% – 2500 Ma 12.5% – 3750 Ma 6.25% – 5000 Ma curve plotted correctly
2 2.1b × 2
(ii) at formation of rock only 40K present
over time (unstable) 40K decays to (stable) 40Ar
half-life is a measure of this decay and the ratio of 40K to 40Ar will be related to the age of the rock
this ratio and the half-life graph can be used to estimate the age of the rock at about 2900 million
4 2.1a × 4 DO NOT ALLOW unless answer is linked to
specific details from the graph
(iii) Any three from
Radioactivity allowed Precambrian rocks to be dated and the age of the Earth to be extended beyond 100 Ma
Numerical dating allows a time scale to be given to the geological column / relative dating history (AW)
The heat released by radioactive decay in the mantle (an additional source of geothermal energy) led to a better explanation of the shape of the geotherm
Release of heat in the mantle from radioactive decay provided a plausible mechanism for the theory of continental drift
Radioactive decay provided an explanation for mantle convection allowing the general acceptance of the theory of plate tectonics in the 1970s
3 2.1a ×3
SPECIMEN

H014/01 Mark Scheme June 20XX
12
Question Answer Marks AO
element Guidance
(b) (i)
top and bottom of the top limestone
top and bottom of conglomerate
top and bottom of bottom limestone
3 2.1b × 3
(ii) Advantages
recognises lithostratigraphic as using rocks / identify sequences in rocks
has immense economic importance in identifying beds of economic value such as coal
Disadvantages
without fossil evidence lithostratigraphic correlation is difficult
3 1.1c × 3 ALLOW the presence of rare minerals such as
iridium can greatly enhance correlation
(c) (i) 2.2 (±0.2)
°C km–1
2 2.1b × 2 (1400 – 750)/(400 – 100) = 650/300 = 2.2
SPECIMEN

H014/01 Mark Scheme June 20XX
13
Question Answer Marks AO
element Guidance
(ii) heat transfer in the lithosphere (0 – 100 km) is by
conduction, which is less efficient, therefore the
geothermal gradient is higher
heat transfer in the asthenosphere (> 100 km) is by
convection, which is more efficient, therefore the
geothermal gradient is lower
2 1.1a × 2 ALLOW some areas have much higher heat
flows because of deep fault zones, rifting,
magmatic intrusions, or active tectonic forces
TOTAL 19
SPECIMEN

H014/01 Mark Scheme June 20XX
14
Question Answer Marks AO
element Guidance
23 (a) F is the larger intrusion (no mark)
the temperature gradient is less steep around F OR the rate of
cooling is lower around F
F has a smaller surface area to volume ratio OR has a greater
thermal mass OR has a greater volume of magma
because larger intrusions retain heat for longer they can heat up
a greater volume of country rock OR the heat can travel a greater
distance from the intrusion
3 3.1a × 3
(b) (i) shaded area must include slate, schist and gneiss and begin above 200°C e.g.
1 AO2.1b
(ii) gneiss hornfels slate gneiss hornfels schist / slate
2 1.1a × 2 5–6 correct = 2 marks
1–4 correct = 1 mark
SPECIMEN

H014/01 Mark Scheme June 20XX
15
Question Answer Marks AO
element Guidance
(c) Any three from
dip of sides / contact of intrusion varies
narrow if side is dipping steeply / wide if shallow dip
country rock type varies – heat is absorbed / conducted
differently / some are more reactive
presence of water – increases amount of metamorphism /
carries heat further
size / volume of magma – large intrusion produces wider
aureole / will retain heat longer
initial temperature of magma / temperature difference –
higher temperature will produce wider aureole
composition of magma – silicic magmas may contain more
volatiles so can produce wider aureoles
3 1.1c × 3 max 1 if general statement width varies because the intrusion / country rock varies max 1 for list of factors with no explanation
(d) Any two from
pelites/shale(AW) is the parent of different low, medium and
high grade metamorphic rocks OR slate, phyllite, schist and
gneiss as metamorphic grade increases
limestone is the parent of one metamorphic rock marble OR
sandstone is the parent of one metamorphic rock
metaquartzite OR limestone is only composed of
CaCO3/Calcite OR sandstone is only composed of
SiO2/Quartz
the clay minerals in pelites/shale(AW) have a complex
chemical composition so they can be the produce a wide
variety of different index minerals as, metamorphic grade/the
intensity of metamorphism, increases
2 1.1c × 2 ALLOW intensity of metamorphism for
metamorphic grade
DO NOT ALLOW general comments about
‘minerals’
TOTAL 11
SPECIMEN

H014/01 Mark Scheme June 20XX
16
Question Answer Marks AO
element Guidance
24 (a) Any two from
greater the velocity the larger particles that can be transported
takes greater amount of energy to lift the particles
clay particles require large amounts of energy to be picked up
velocity is fastest in the centre of the river
2 1.1c × 2 ALLOW reference Hjulstrom curve ALLOW reference to reduction in velocity ALLOW velocity may increase during flood conditions
(b) (i) mean = 392/15 = 26 (mm)
1 1.1b × 1
(ii) Mean roundness = [(2 × 13)/73] × 1000
= 356
2 2.1b × 2 ALLOW ECF from part (b)(i)
(iii) sample size is valid, because it is larger than optimum
sample size determined using running means of length
/ larger than optimum sample size of 12
1 3.1c
ALLOW 11 for optimum sample size
(iv) Discussion of data
Positive correlation of data but gradients different, data
sets don’t overlap
Conclusions
Suggests significant difference between pebble sizes
upstream and downstream
Suggests pebbles are smaller/smoother/more rounded
Explanation
smaller clasts, travel further / can travel over a wider
range of velocities, and are therefore subjected to more
erosion by abrasion and attrition
4
3.1a x1
3.1e x2
2.1a ×1
SPECIMEN

H014/01 Mark Scheme June 20XX
17
(c) Please refer to the marking instructions on page 4 of
this mark scheme for guidance on how to mark this
question.
Level 3 (5–6 marks)
Full analysis of the information provided discussing
most of important geology (i.e. most of potential
sedimentary structures) AND explanation AND
discussion of way-up evidence
There is a well-developed line of reasoning which is clear and logically structured. The information presented is relevant and detailed.
Level 2 (3–4 marks)
Good analysis of the information provided.
Some of structures described AND explanation OR
discussion of way-up evidence
There is a line of reasoning presented with some
structure. The information presented is relevant.
Level 1 (1–2 marks)
A limited treatment providing either a description of
some structures OR information which may lead to
attempt at interpretation of way-up evidence.
There is an attempt at a logical structure with a line of reasoning. The information is in the most part relevant.
0 marks No response or no response worthy of credit.
6
2.1a ×4
3.1c x1
3.1d x1
Indicative geological points include:
AO3.1c Evaluate geological ideas, information
and evidence – Evaluation of scenario
sediment brought down by river, settles in low
energy conditions of playa lake; hot conditions
cause rapid evaporation, this environment leads
to………
AO3.1d Make judgements – determine
possible sedimentary structures
Salt pseudomorphs
Asymmetrical ripple marks
Graded bedding
Desiccation cracks
Imbrication
AO2.1a Apply knowledge and understanding
of geological ideas – explanation of decisions
Salt pseudomorphs form when lake dries and
halite crystals form;redissolving of these and
infilling with sediment form pseudomorphs.
Asymmetrical ripple marks are formed by
currents that flow in one direction, or formed in
desert environments where the wind acts in the
same way as water
Graded bedding, largest particles are on the
bottom of the bed and the smaller particles are at
the top / the grains become finer towards the top
/ there is an abrupt change in size at each
bedding plane
SPECIMEN

H014/01 Mark Scheme June 20XX
18
larger particles are heavier and settle out first so
are found at the bottom of the bed / can be
formed when sediment tips into lake and gravity
settling occurs
Dessication (mud) cracks form when fine
sand/mud dries, shrinks and cracks; cracks
become infilled later with sediment.
Imbrication forms when long pebbles become
tilted in roughly the same direction by transporting
river
Evidence for overturned sequence
Dessication: cracks are wider at bottom than top;
Graded bedding: sequence gets coarser upwards
Geopetal structures
TOTAL 16
SPECIMEN

H014/01 Mark Scheme June 20XX
19
Question Answer Marks AO
element Guidance
25 (a) (i) igneous olivine
sedimentary clay
metamorphic garnet
2 1.1a × 2 All correct for 2 marks
1–2 correct for 1 mark
(ii) quartz is SiO2 and Si and O are the most abundant elements in the crust (~75%) / are lithophiles so are enriched in the crust continental crust is formed of granitic rocks, quartz is a common mineral in granite (~25%) and through the rock cycle granites erode to form quartz sandstone and metamorphose to form gneiss
2 1.1a × 2 ALLOW quartz is resistant to physical weathering (hardness 7) and chemical weathering (chemically inert)
(b) Q black crystals as biotite N large phenocrysts as K feldspar
2 3.1b × 2
ALLOW orthoclase feldspar DO NOT ALLOW ‘feldspar’
(c) B gypsum
C halite
D calcite
2 3.1c × 2 All 3 for 2 marks
1–2 for 1 mark
SPECIMEN

H014/01 Mark Scheme June 20XX
20
(d) (i) most ores/minerals have a range of colours so this is
not a reliable form of identification
1 3.1c ALLOW red could be a copper ore, grey could be
an iron mineral/magnetite, yellow could be gold
(ii) Any two from
streak
lustre
hardness
2 3.1f × 2 ALLOW density or specific gravity
IGNORE details of the results you would see for
the three metallic ore samples mentioned
TOTAL 11
SPECIMEN

H014/01 Mark Scheme June 20XX
21
Question Answer Marks AO
element Guidance
26 (a) (i) P wave arrival time = 1.5 (min)
S wave arrival time = 3.0 OR 3.5 (min)
1 1.1d
(ii) A = 3 × 10³ / 3000 (km) (6 × 500)
B = 2.25 × 10³ / 2250 (km) (4.5 × 500) C = 7.5 × 10² / 750 (km) (1.5 × 500)
1 2.1b ALLOW ECF from (i) for C
All three needed for one mark
(b)
3 2.1b × 3 ALLOW ECF from (ii) 1 mark for 1 correct arc 2 marks for 3 correct arcs 1 mark for locating the epicentre / can be in the centre of a triangle
(c) (i) 12.00 (km s–1) 1 1.1d
(ii) As pressure increases with depth, particles become
closer so waves (energy) transmitted faster
1 1.1c
(iii) Correctly plotted points
Line drawn correctly
2 2.1b × 2
SPECIMEN

H014/01 Mark Scheme June 20XX
22
Question Answer Marks AO
element Guidance
(iv) S waves are transverse waves which cannot travel
through liquids as liquids will not shear
1 3.1b
SPECIMEN

H014/01 Mark Scheme June 20XX
23
(v) Any three from
P and S wave velocities change markedly at the
boundary of two layers/at a discontinuity
P and S waves both slow down in the asthenosphere
P and S waves both speed up in the mantle
P waves slow down at the Gutenberg
Discontinuity/outer core whilst S waves stop
completely
P waves speed up at the Lehmann
Discontinuity/inner core
S waves reappear at the Lehmann
Discontinuity/inner core
3
2.1a × 3 ALLOW Velocity of seismic waves increases
with depth as rock becomes more rigid/more
incompressible
ALLOW P and S waves do not pass through
the shadow zone
Total 13
SPECIMEN
H014/01 Mark Scheme June 20XX
24
Question Answer Marks AO
element Guidance
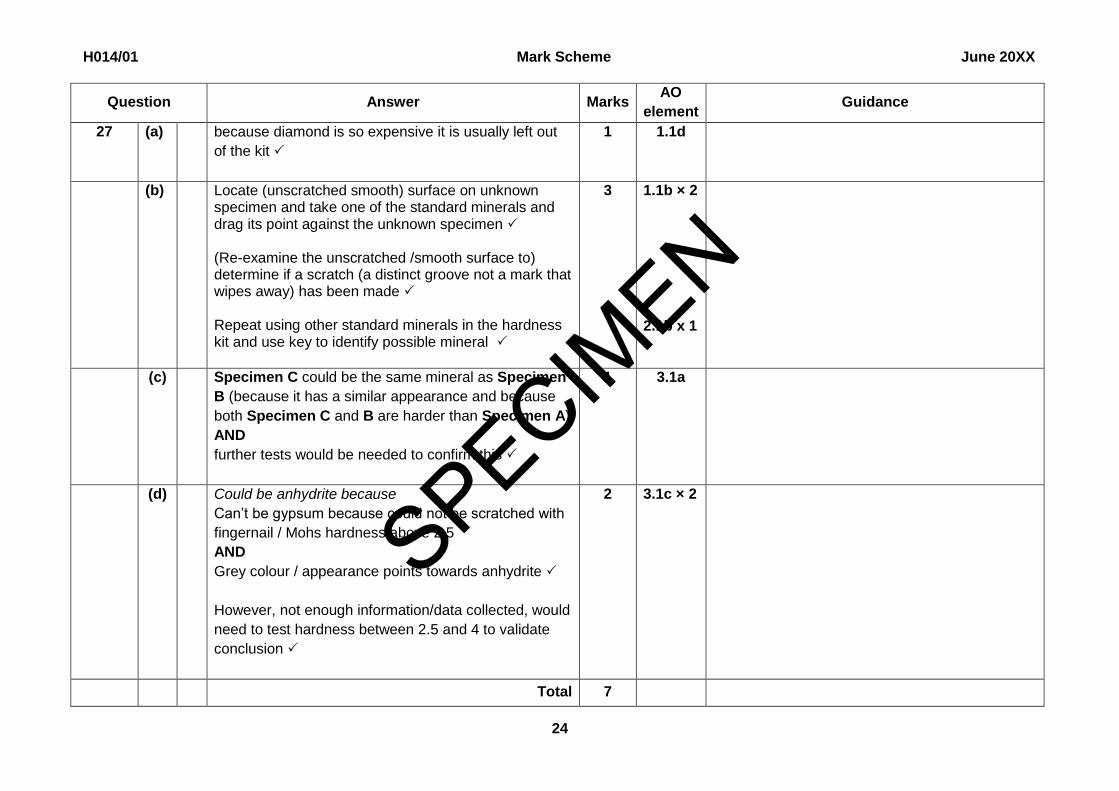
27 (a) because diamond is so expensive it is usually left out
of the kit
1 1.1d
(b) Locate (unscratched smooth) surface on unknown specimen and take one of the standard minerals and drag its point against the unknown specimen
(Re-examine the unscratched /smooth surface to) determine if a scratch (a distinct groove not a mark that wipes away) has been made
Repeat using other standard minerals in the hardness kit and use key to identify possible mineral
3 1.1b × 2
2.1b x 1
(c) Specimen C could be the same mineral as Specimen
B (because it has a similar appearance and because
both Specimen C and B are harder than Specimen A)
AND
further tests would be needed to confirm this
1 3.1a
(d) Could be anhydrite because
Can’t be gypsum because could not be scratched with
fingernail / Mohs hardness above 2.5
AND
Grey colour / appearance points towards anhydrite
However, not enough information/data collected, would
need to test hardness between 2.5 and 4 to validate
conclusion
2 3.1c × 2
Total 7
SPECIMEN

H014/01 Mark Scheme June 20XX
25
Question Answer Marks AO
element Guidance
28 (a) (i) block / sample needs to be broken up
mass of sample weighed / 100 g used
use sieve bank / stack to sort sample
weigh proportion of sediment in each sieve
4 3.1f x 4
(ii) imbrication / imbricate structure
water flow knocks over elongated flat pebbles
b-axis tilts in the direction of flow
3 1.1c x 3
(iii)* Please refer to the marking instructions on page 4 of
this mark scheme for guidance on how to mark this
question.
Level 3 (5–6 marks)
Full analysis of the information provided discussing
most of important geology AND a sound overall
conclusion
There is a well-developed line of reasoning which is clear and logically structured. The information presented is relevant and detailed.
Level 2 (3–4 marks)
Good analysis of the information provided
AND
an attempt at an overall conclusion of the environment
at the time OR interpretation of information
There is a line of reasoning presented with some
structure. The information presented is relevant.
6 3.1a x 3
3.1b x 2
3.1e x 1
NB: A labeled diagram may illustrate some of
the observations and/or interpretation.
Indicative geological points include:
AO3.1a Analyse geological information, ideas
and evidence
Pictures:
angular fragments
badly sorted
imbricate structures dip to west
coarse material interspersed with finer cross bedded sands
Grain analysis:
coarser material poorly sorted
sandstones well-sorted and finer sand
Text:
Red colour suggest oxidising conditions (surface
deposition)
SPECIMEN

H014/01 Mark Scheme June 20XX
26
Level 1 (1–2 marks)
A limited treatment providing incomplete analysis of
information which may lead to attempt at interpretation
or conclusion.
There is an attempt at a logical structure with a line of reasoning. The information is in the most part relevant.
0 marks No response or no response worthy of credit.
AO3.1b Interpret geological information,
ideas and evidence
red large-scale cross bedded sands suggest desert environment
breccia/badly sorted angular fragments showing imbrication suggests rapid water borne deposition
AO3.1e Draw conclusions
overall desert environment with periodic flash floods depositing eroded material from higher ground to west of desert
Total 13
Summary of updates
Date Version Change
January 2019 2.1 Minor accessibility changes to the paper: i) Additional answer lines linked to Level of Response questions
ii) One addition to the rubric clarifying the general rule that working should be shown for any calculation questions
SPECIMEN