h1 2016 analyst & investor presentation - easyjet plc/media/files/e/easyjet/...h1 2016 analyst...
TRANSCRIPT

H1 2016 Analyst & investor
presentation
Tuesday 10 May 2016

Introduction
Carolyn McCall
Chief Executive Officer

3 3
Footer box on intersect of lines line h=8.03 9 and v=8.75 with font 10pt Arial not bold
easyJet’s resilient model continues to deliver
Robust performance despite the impact from external shocks
Continued focus on building strong network positions
Increased revenue and passenger growth at stable load factors
Strong cost performance secured flat PBT and PBT margin at constant currency
Capital structure review delivers proposed 50% payout ratio
Strong H1 performance despite shocks
3

Financial review
Andrew Findlay
Chief Financial Officer

5 5
Footer box on intersect of lines line h=8.03 9 and v=8.75 with font 10pt Arial not bold
Financial performance
H1 2016 H1 2015 Change* Change*
£m £m % % @ CC
Total revenue 1,771 1,767 0.3% 2.9%
Fuel (462) (516) 10.5% 9.7%
Costs excluding fuel (1,333) (1,244) (7.2%) (7.9%)
(Loss) / profit before tax (24) 7
Profit before tax at constant currency 5 7
EBITDAR 111 130 (14.8%) 9.3%
EBITDAR margin 6.2% 7.3%
Earnings per share (pence) (5.1) 1.3
*Favourable / (adverse)
** Profit before tax at constant currency after balance sheet revaluations
5
**

6 6
Footer box on intersect of lines line h=8.03 9 and v=8.75 with font 10pt Arial not bold
Revenue performance
H1 2016 H1 2015 Change*
Seats flown (m) 34.5 32.2 7.4%
Load factor (%) 89.7% 89.7% 0.0ppt
Passengers (m) 31.0 28.9 7.4%
Average sector length (km) 1,054 1,072 (1.7%)
Total revenue - reported (£m) 1,771 1,767 0.3%
Total revenue - constant currency (£m) 1,817 1,767 2.9%
Total revenue per seat - reported (£) 51.29 54.91 (6.6%)
Total revenue per seat - constant currency (£) 52.62 54.91 (4.2%)
6
* Favourable / (adverse)

7 7
Footer box on intersect of lines line h=8.03 9 and v=8.75 with font 10pt Arial not bold
1.48
0.72
1.04
0.48
0.47 1.33
Resilient revenue performance
Revenue per seat bridge
H1 2016
51.29
FX
Before FX
52.62
Other Easter Underlying softness
Sharm el-Sheikh Paris H1 2015
54.91
7
(2.7%)
(1.3%)
(1.9%)
(0.9%)
(0.9%)

8 8
Footer box on intersect of lines line h=8.03 9 and v=8.75 with font 10pt Arial not bold
A strong focus on costs
Total cost per seat bridge
0.48
0.72
0.39
0.77
0.130.28
0.54
2.47
0.38
51.98
P&L FX
Fuel Before movement in fuel and FX
54.93
Other cost savings
H1 2016 A320 mix Before management
action
56.42
54.70
Lean engineering
contract
Inflation* Balance sheet
revaluations
Disruption Regulated airports inflation
H1 2015
Management action
External factors
• Total cost per seat at constant currency: 4.3% decrease
• Cost per seat ex fuel at constant currency: 0.5% increase
* Operational price increases including unregulated airports, ground handling, navigation and crew costs
8

9 9
Footer box on intersect of lines line h=8.03 9 and v=8.75 with font 10pt Arial not bold
Impact of fuel & currency
H1 2016 fuel impact favourable / (adverse) H1 2016 H1 2015
Fuel $ per metric tonne
Market rate 409 707
Effective price 786 925
US dollar rate
Market rate 1.48 1.55
Effective price 1.61 1.59
Actual cost of fuel £ per metric tonne 489 581
H1 2016 currency impact favourable / (adverse) EUR CHF USD Other Total
£m
Revenue (47) 2 1 (2) (46)
Fuel - - 4 - 4
Prior year balance sheet revaluations (3) 1 (2) - (4)
Costs excluding fuel and prior year balance sheet
revaluations18 (2) (2) (1) 13
Total (32) 1 1 (3) (33)
2 cents
92
Change
298
139
(7 cents)
9

10 10
Footer box on intersect of lines line h=8.03 9 and v=8.75 with font 10pt Arial not bold
Strong cash generation
10
2194121
314
45215
12392
80
23
Net working capital
31 March 2016
1,057*
Ordinary dividend
Before dividend
1,276
Depn & amort
Operating loss
1 October 2015
939*
Increased borrowings
Tax paid CAPEX Other FX Other operating
*Includes money market deposits but excludes restricted cash
• Net cash: £296m (FY15: £435m)
• Adjusted net debt: £474m (FY15: £363m)
Cash flow bridge
Cash generated from operations
(excl dividends): £461m

11 11
Footer box on intersect of lines line h=8.03 9 and v=8.75 with font 10pt Arial not bold
Strong balance sheet
£m H1 2016 H1 2015
Goodwill and other intangible assets 501 476
Property, plant and equipment 3,089 2,720
Derivative financial instruments (338) (281)
Other assets (excluding cash and money market deposits) 367 355
Unearned revenue (1,080) (1,091)
Other liabilities (excluding debt) (883) (856)
Capital employed 1,656 1,323
Cash and money market deposits 1,057 976
Debt (761) (560)
Net cash 296 416
Net assets 1,952 1,739
11

12 12
Footer box on intersect of lines line h=8.03 9 and v=8.75 with font 10pt Arial not bold
Gross capital expenditure
c.£800mc.£850m
c.£900m
c.£650m
c.£550m
£0m
£500m
£1,000m
FY 2020 FY 2019 FY 2018 FY 2017 FY 2016 FY 2015
£536m
FY 2014
£449m
FY 2013
£421m
FY 2012
£392m
FY 2011
£556m
12
- Assumes base case fleet plan

13 13
Footer box on intersect of lines line h=8.03 9 and v=8.75 with font 10pt Arial not bold
Capital Structure Review
• The scope of the review entailed:
A strong balance sheet is a core part of easyJet’s strategy and is fully aligned with shareholder interests
Liquidity buffer
Gearing
Residual Values
Dividend Policy
13

14 14
Footer box on intersect of lines line h=8.03 9 and v=8.75 with font 10pt Arial not bold
Capital Structure Review – Key Changes
14
50% PAT dividend ratio
Current Position Updated Position
Liquidity buffer Cash position of £4 million per aircraft Liquidity buffer including cash and revolving credit facility
Cover peak unearned revenue
Minimum position of £2.6 million per 100 seats
Funding Mortgage funding secured on aircraft Unsecured funding via EMTN programme
Mortgage funding secured on aircraft
Revolving credit facility to support liquidity
Gearing Target gearing between 15% and 30% No specific gearing target
Intend to maintain current credit rating (subject to events
outside easyJet’s control)
Residual Value Downside flexibility through leasing arrangements
Move from 70/30 owned vs leased split to 80/20 to
reduce ownership costs
Rolling sale and leaseback programme on A319 fleet
No material change to 80/20 fleet mix outcome
Downside flexibility maintained
Hedging Semi-active fuel and foreign exchange hedging
Simple forward contracts
No change
Dividend 40% payout ratio of post-tax income Increase in payout ratio to 50% of post-tax
income
Board to keep Balance sheet under review

Business Review
Carolyn McCall
Chief Executive Officer
16 16
Footer box on intersect of lines line h=8.03 9 and v=8.75 with font 10pt Arial not bold
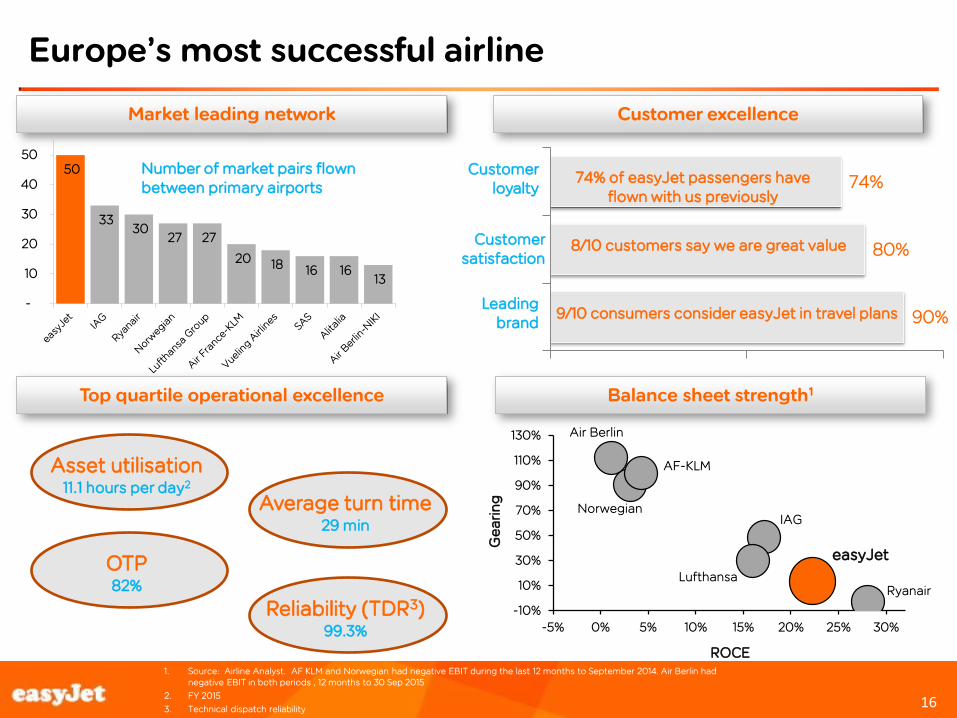
Europe’s most successful airline
1. Source: Airline Analyst. AF KLM and Norwegian had negative EBIT during the last 12 months to September 2014. Air Berlin had negative EBIT in both periods , 12 months to 30 Sep 2015
2. FY 2015
3. Technical dispatch reliability
16
50
33 30
27 27
20 18 16 16 13
-
10
20
30
40
50Number of market pairs flown between primary airports
-10%
10%
30%
50%
70%
90%
110%
130%
-5% 0% 5% 10% 15% 20% 25% 30%
Ge
ari
ng
ROCE
Market leading network
Balance sheet strength1 Top quartile operational excellence
Ryanair
IAG
AF-KLM
Air Berlin
Norwegian
Lufthansa
easyJet
Customer excellence
90%
80%
74%
9/10 consumers consider easyJet in travel plans
8/10 customers say we are great value
74% of easyJet passengers have flown with us previously
Leading brand
Customer satisfaction
Customer loyalty
Asset utilisation 11.1 hours per day2
OTP 82%
Reliability (TDR3) 99.3%
Average turn time 29 min

17 17
Footer box on intersect of lines line h=8.03 9 and v=8.75 with font 10pt Arial not bold
easyJet - Delivering growth and returns to shareholders
17
Growth
Margin
Returns
• Passenger growth of 7%-8% CAGR
• Top quartile ROCE
• 50% PAT pay-out ratio
• Stable margin
• Strong cost underpin

18 18
Footer box on intersect of lines line h=8.03 9 and v=8.75 with font 10pt Arial not bold
Resilient H1 trading Growth
Flow Trading
UK- Beach
Paris touching
Sharm el Sheikh
touching
UK – Ski
City – City
Trading by traffic flow
18

19 19
Footer box on intersect of lines line h=8.03 9 and v=8.75 with font 10pt Arial not bold
easyJet Air France
Ryanair KLM
Vueling British
Thomson Monarch
Alitalia other
7.4% easyJet capacity growth over winter
United Kingdom +9.4%
France +6.5 %
Italy 11.7%*
Spain +4.5%
Switzerland +8.1%
Germany +7 %
Source : OAG, scheduled data and Internal easyJet projection April 2016. Country capacity growth is based on network touching seats. * Excludes Rome capacity
Investment in the network in H1
9% 7%
4%
7%
9% 12%
5%
12%
8% 5%
7% 5%
Market growth easyJet growth in the market Netherlands +27%
7%
27%
Portugal +21.3%
12%
21%
Growth
19
Market share on easyJet routes

20 20
Footer box on intersect of lines line h=8.03 9 and v=8.75 with font 10pt Arial not bold
Depth in high GDP markets
1) Catchment areas defined as population living within 50km of airports within the market and ranked according to GDP for that area; 2) Rank of short haul capacity for the 12 months to September 2015; 3) Manchester catchment includes Liverpool airport; 4) Dusseldorf catchment includes Cologne, Dortmund, Friedrichshafen, Nuremburg and Paderborn; 5) Zurich catchment includes Basel
20
easyJet network
- Number 1 or 2 position in the primary airport in 12 of Europe’s top 25 catchment areas by GDP1
Growth

21 21
Footer box on intersect of lines line h=8.03 9 and v=8.75 with font 10pt Arial not bold
1) Based on theoretical max runway capacity at airport, Peak = first wave departures (before 8.30am) on weekdays in IATA Summer season . For leisure destinations may also include weekend peak demand periods
2) Based on summer 2016 schedule
Airport Current morning peak utilisation? 1
easyJet touching aircraft2
London Gatwick 69
Geneva 20
Bristol 14
Luton 21
Basel 14
Manchester 12
Schiphol 13
Milan Malpensa 22
Edinburgh 11
Belfast 9
A network that is difficult to replicate
>90% utilised 80-90% utilised
Growth
Strong positions at key airports Increasing frequencies
<80% utilised
21
0
1
2
3
4
5
6
1-2 2-3 3-4 4-5 5-6 6-7
We
ekl
y F
req
ue
nc
y A
dd
itio
n Y
oY
Number of Daily Flights
Average Topups Per Week
Average
For flights previously with at least a daily frequency, easyJet added YoY on average 1.2 frequencies per week.

22 22
Footer box on intersect of lines line h=8.03 9 and v=8.75 with font 10pt Arial not bold
Investing in our network
Deepening the network New bases
22
Growth
Venice Marco Polo London Luton
Amsterdam Schiphol

23 23
Footer box on intersect of lines line h=8.03 9 and v=8.75 with font 10pt Arial not bold
Leading in digital
23
Growth

24 24
Footer box on intersect of lines line h=8.03 9 and v=8.75 with font 10pt Arial not bold
Leading in data
FLIGHT CLUB
24
Growth
25m marketable customers
74% returning customers
41.5 average age

25 25
Footer box on intersect of lines line h=8.03 9 and v=8.75 with font 10pt Arial not bold
Grow revenue
25
Growth
26 26
Footer box on intersect of lines line h=8.03 9 and v=8.75 with font 10pt Arial not bold
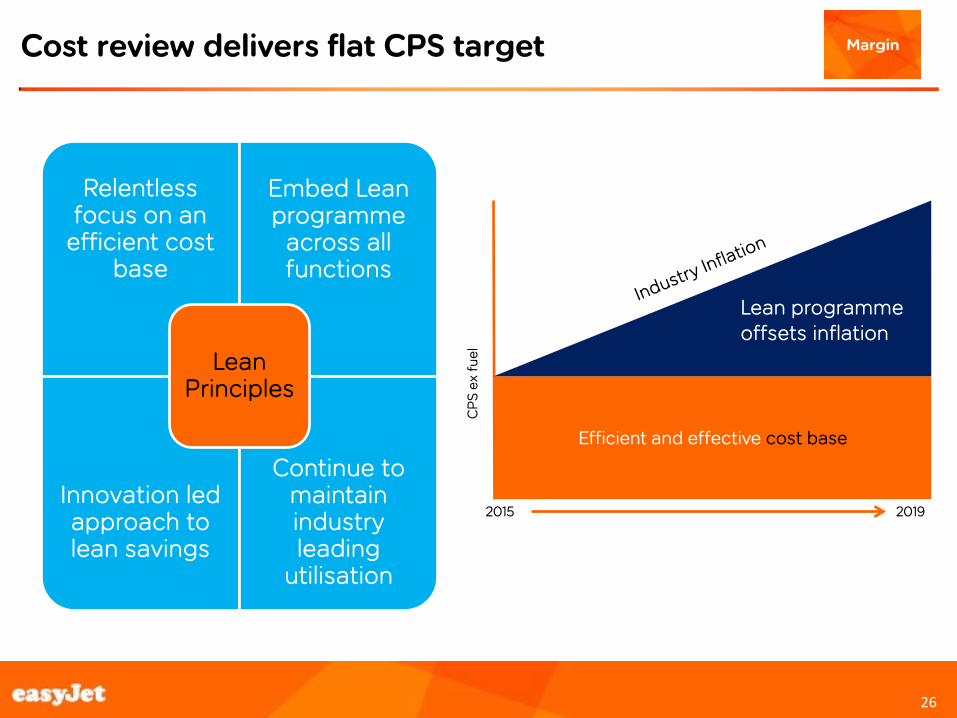
Cost review delivers flat CPS target
26
Margin
Efficient and effective cost base
Lean programme offsets inflation
CP
S e
x fu
el
Relentless focus on an
efficient cost base
Embed Lean programme
across all functions
Innovation led approach to lean savings
Continue to maintain industry leading
utilisation
Lean Principles
2015 2019

27 27
Footer box on intersect of lines line h=8.03 9 and v=8.75 with font 10pt Arial not bold
Strong pipeline of cost saving initiatives
27
Margin
Focus area Savings*
Airports & ground handling (eg: LGW) £ £ £
Supplier relationship management £ £
Maintenance efficiency £ £ £
Fleet up-gauging £ £ £
Lean bases & smart scheduling £ £
Invest in people £
Detailed focus on overheads £ £
IT investment £ £
Use of data to drive efficiency £
Lean Target - Flat CPS ex-fuel between 2015-2019
• *Size of savings – More £ signs means larger saving • Lean target assumes pre abnormal levels of disruption •
Porto Barcelona
Maintenance
Ground handling

28 28
Footer box on intersect of lines line h=8.03 9 and v=8.75 with font 10pt Arial not bold
Up-gauging our fleet
28
Margin
Up-gauging delivering CPS savings
156 seats 186 seats
Current generation
A319
New generation A320neo
13% -14%
New A320 cabin, 186 seats
- CPS savings based on fuel price quoted in original plan

29 29
Footer box on intersect of lines line h=8.03 9 and v=8.75 with font 10pt Arial not bold
Operational excellence
29
Increased customer satisfaction
Greater operational efficiency
Delivering cost savings (single ground handling fleet)
Margin

30 30
Footer box on intersect of lines line h=8.03 9 and v=8.75 with font 10pt Arial not bold
Outlook in 2016
Capacity (seats flown) • H2 c.+6.5% (before disruption)
• FY c.+7% (before disruption)
Revenue per seat at constant currency • Q3 revenue per seat: down c. 7%
• H2 revenue per seat: down low to mid single digits
Cost per seat at constant currency • FY cost per seat excluding fuel: down c. 1% (assuming normal levels of disruption)
FX • H2: c.£20 million adverse movement from foreign exchange rates
• FY: c.£55 million adverse movement from foreign exchange rates
Fuel • H2: unit fuel costs £85 million to £90 million favourable
• FY: unit fuel costs £170 million to £180 million favourable
• Expected total fuel cost £1,120 million
Rates at 9 May 2016 £/USD: 1.4390; £/EUR: 1.2635 Unit fuel guidance based on Jet fuel trading range of $350 / metric tonne to $450 / metric tonne
30

31 31
Footer box on intersect of lines line h=8.03 9 and v=8.75 with font 10pt Arial not bold
easyJet is a structural winner
• Europe's best network that is difficult to replicate
• Best customer proposition
• Constant innovation to drive demand and loyalty
• Cost plan to deliver flat CPS ex-fuel
• 50% profit after tax pay-out ratio
31

Q & A

appendix

34 34
Footer box on intersect of lines line h=8.03 9 and v=8.75 with font 10pt Arial not bold
Fuel and foreign exchange hedging
Sensitivities – FY16
• $10 per tonne change in fuel price will impact the full year pre-tax result by +/- $1.5 million
• One cent movement in the £/$ will impact the full year pre-tax result by +/- £1.3 million
• One cent movement in the £/€ will impact the full year pre-tax result by +/- £0.6 million
Fuel
requirement US dollar
requirement Euro surplus CHF surplus
Six months ending 30 September 2016
87% at $793/ metric tonne
76% at $1.61/£ 79% at €1.25/£ 73% at CHF1.46/£
Full year ending 30 September 2016
87% at $814/ metric tonne
80% at $1.62/£ 86% at €1.23/£ 81% at CHF1.46/£
Full year ending 30 September 2017
76% at $626 / metric tonne
70% at $1.53/£ 71% at €1.32/£ 68% at CHF1.42/£
As at 6 May 2016 34

35 35
Footer box on intersect of lines line h=8.03 9 and v=8.75 with font 10pt Arial not bold
H2 forward bookings
% seats sold *
H2 (April 2016 to September 2016) as at 6 May 2016
H2 bookings in line with prior year
35
Apr May Jun Jul Aug Sep H2
Summer '15 Summer '16

36 36
Footer box on intersect of lines line h=8.03 9 and v=8.75 with font 10pt Arial not bold
easyjet
Ryanair Vueling
BA
AF-KLM
Other
Competitive capacity environment in H2
Source: Market capacity data from OAG scheduled data, as at 6 May 016 easyJet markets based on internal easyJet definition. easyJet growth based on H2 2016 schedule vs H2 2015 flown capacity
Short-haul market easyJet city to city pairs
7.6% split by carrier
36
5.6%
6.3% 6.3% 6.4%
5.4%
6.5%
8.2%
7.6%
Capacity change total SHMarket
easyJet capacity change Competitors on easyJetmarkets
Capacity Change easyJetmarkets
Summer 15 Summer 16

37 37
Footer box on intersect of lines line h=8.03 9 and v=8.75 with font 10pt Arial not bold
Overall c. 6.6% capacity growth over summer
United Kingdom +6%
France +10 %
Italy 0%
Spain +6% Switzerland +5%
Germany +2 %
Source : OAG, scheduled data and Internal easyJet projection April 2016. Country capacity growth is based on network touching seats.
Investment in the network
6% 8%
5%
10%
6%
0%
6% 10%
5%
0%
2% 5%
Market growth easyJet growth in the market
Netherlands +21%
7%
21%
Portugal +15%
14% 15%
37

38 38
Footer box on intersect of lines line h=8.03 9 and v=8.75 with font 10pt Arial not bold
Profit before tax
Profit before tax per seat bridge
0.16
0.48
0.21
0.72
0.39
Underlying softness
Lean engineering
contract
A320 Mix
0.38
Disruption
0.28
Cost inflation*
0.77
Balance sheet
revaluations
0.13
Fuel
2.47
Regulated airports inflation
0.54
Other revenue
0.47
0.69
H1 2016 P&L Fx
0.85
H1 2016 @ CC
Other cost savings
1.04
Paris and Sharm
el-Sheikh
2.20
Easter H1 2015
* Operational price increases including unregulated airports, ground handling, navigation and crew costs
Revenue
Costs

39 39
Footer box on intersect of lines line h=8.03 9 and v=8.75 with font 10pt Arial not bold
Loss after tax
39
£m H1 2016 H1 2015 Change
(Loss) / profit before tax (24) 7 (31)
Tax credit / (charge) 4 (2) (6)
(Loss) / profit after tax (20) 5 (25)
Effective tax 18.1% 20.4% 2.3ppt

40 40
Footer box on intersect of lines line h=8.03 9 and v=8.75 with font 10pt Arial not bold
Revenue per seat
£ per seat H1 2016 H1 2015 Change
Seat revenue 50.39 54.05 (6.8%)
Non-seat revenue 0.90 0.86 4.6%
Total revenue 51.29 54.91 (6.6%)
40
41 41
Footer box on intersect of lines line h=8.03 9 and v=8.75 with font 10pt Arial not bold
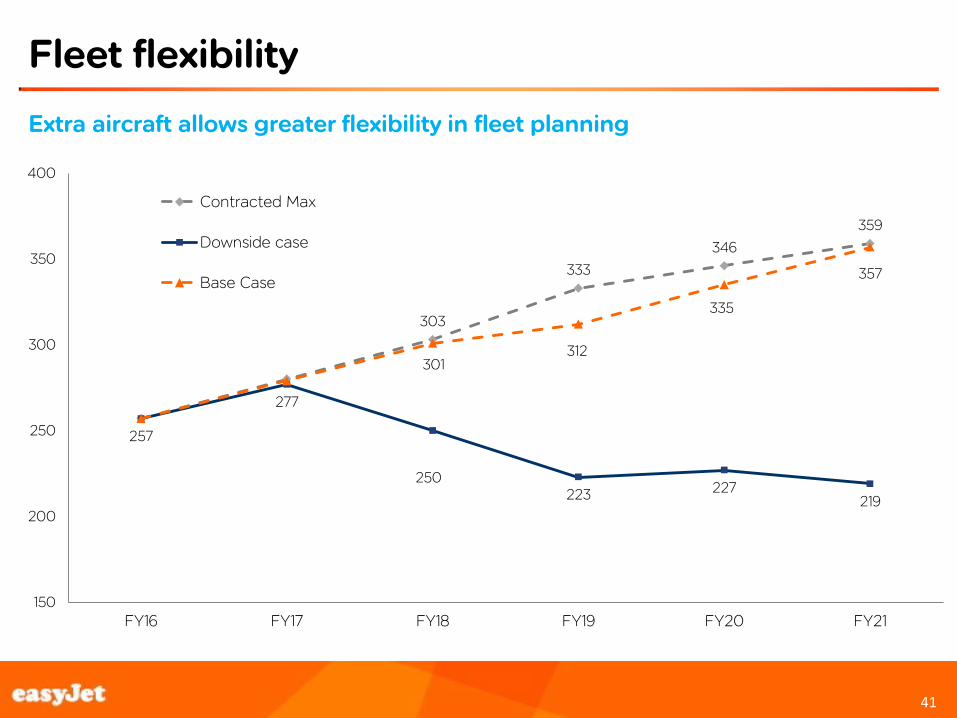
Fleet flexibility
Extra aircraft allows greater flexibility in fleet planning
303
333
346
359
257
277
250 223 227
219
301 312
335
357
150
200
250
300
350
400
FY16 FY17 FY18 FY19 FY20 FY21
Contracted Max
Downside case
Base Case
41

42 42
Footer box on intersect of lines line h=8.03 9 and v=8.75 with font 10pt Arial not bold
Cost per seat excluding fuel - key drivers
42
* Excludes foreign exchange gains and losses on balance sheet revaluations
Cost
per seat
excluding fuel
Variance at
constant
currency
Variance at
constant
currency
Weighting of
variance
£ £ % %
• Efficiency gained from upgauging our fleet
from an average of 164 to 166 seats per
aircraft
• Decrease in average sector length
• Improved crew scheduling
• Offset by pay increases
• Reduction in number of leased aircraft in the
fleet
• Savings from new maintenance contract
• Offset by Inflationary increases
Overhead 5.46 (0.14) (2.8%) (0.4%) • Higher disruption costs
• Rate increases and investment in ground
handling at Gatwick
• Offset by volume savings and savings from
new contracts
Navigation 3.91 0.01 0.4% - • Decrease in average sector length
• Depreciation on new aircraft purchased
• Offset against decreasing lease costs
38.68 (0.18) (0.5%) (0.5%)
Net Exchange (gains)/losses (0.07)
Total CPS excluding fuel 38.61
Airports and Ground handling 14.88
Ownership ex revaluations* 3.96 -
(0.19) (0.5%)
0.3%
0.6%
- -
7.25
3.22
1.6%
Drivers
(1.3%)
Crew 0.12
Maintenance 0.02 0.1%

43 43
Footer box on intersect of lines line h=8.03 9 and v=8.75 with font 10pt Arial not bold
Increasing proportion of A320’s
43
H1 2016 H1 2015 Change
A319 (operating lease) 45 50 (5)
A319 (owned / finance lease) 99 99 0
A319 Total 144 149 (5)
A320 (operating lease) 18 18 0
A320 (owned / finance lease) 85 63 22
A320 Total 103 81 22
Total fleet 247 230 17
Percentage unencumbered 52% 44% 8ppt
Percentage operating lease 26% 30% -4ppt
Percentage of A320s in fleet 42% 35% 7ppt
Average seats per aircraft 166 164 1.0%
44 44
Footer box on intersect of lines line h=8.03 9 and v=8.75 with font 10pt Arial not bold
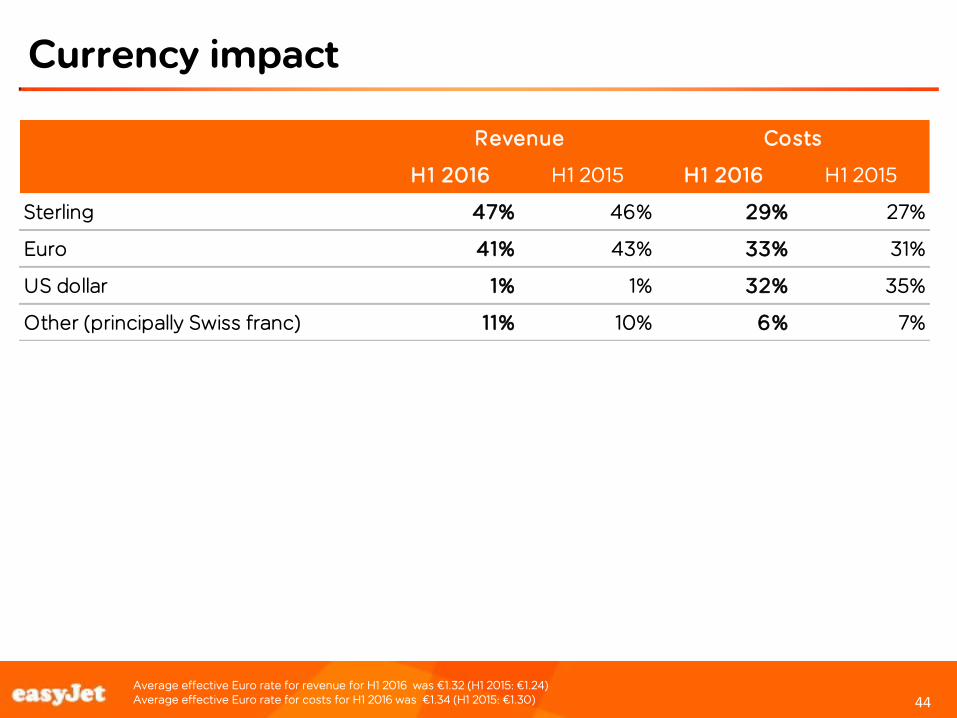
Currency impact
Average effective Euro rate for revenue for H1 2016 was €1.32 (H1 2015: €1.24) Average effective Euro rate for costs for H1 2016 was €1.34 (H1 2015: €1.30)
44
H1 2016 H1 2015 H1 2016 H1 2015
Sterling 47% 46% 29% 27%
Euro 41% 43% 33% 31%
US dollar 1% 1% 32% 35%
Other (principally Swiss franc) 11% 10% 6% 7%
Revenue Costs

45 45
Footer box on intersect of lines line h=8.03 9 and v=8.75 with font 10pt Arial not bold
Disclaimer
Certain statements in this presentation constitute or may constitute forward-looking statements. Any statement in this presentation that is not a statement of historical fact including, without limitation, those regarding the Company’s future expectations, operations, financial performance, financial condition and business is or may be a forward-looking statement. These forward-looking statements are subject to risks and uncertainties that may cause actual results to differ materially from those projected or implied in any forward-looking statement. These risks and uncertainties include, among other factors, changing economic, financial, business or other market conditions. These and other factors could adversely affect the outcome and financial effects of the plans and events described in this presentation. As a result, you are cautioned not to place any reliance on such forward-looking statements. The forward-looking statements reflect knowledge and information available at the date of this presentation and the Company undertakes no obligation to update its view of such risks and uncertainties or to update the forward-looking statements contained herein. Nothing in this presentation should be construed as a profit forecast or profit estimate and no statement in this presentation should be interpreted to mean that the future earnings per share of the Company for current or future financial years will necessarily match or exceed the historical or published earnings per share of the Company.
This communication is directed only at (i) persons having professional experience in matters relating to investments who fall within the definition of “investment professionals” in Article 19(5) of the Financial Services and Markets Act 2000 (Financial Promotion) Order 2001; or (ii) high net worth bodies corporate, unincorporated associations and partnerships and trustees of high value trusts as described in Article 49(2) of the Financial Services and Markets Act 2000 (Financial Promotion) Order 2001. Persons within the United Kingdom who receive this communication (other than those falling within (i) and (ii) above) should not rely on or act upon the contents of this communication. Nothing in this presentation is intended to constitute an invitation or inducement to engage in investment activity for the purposes of the prohibition on financial promotion contained in the Financial Services and Markets Act 2000.
This presentation has been furnished to you solely for information and may not be reproduced, redistributed or passed on to any other person, nor may it be published in whole or in part, for any other purpose.
This presentation does not constitute or form part of, and should not be construed as, an offer for sale or subscription of, or solicitation of any offer to buy or subscribe for, any securities of easyJet plc (“easyJet”) in any jurisdiction nor should it or any part of it form the basis of, or be relied on in connection with, any contract or commitment whatsoever. This presentation does not constitute a recommendation regarding the securities of easyJet. Without limitation to the foregoing, these materials do not constitute an offer of securities for sale in the United States. Securities may not be offered or sold into the United States absent registration under the US Securities Act of 1933 or an exemption there from.
easyJet has not verified any of the information set out in this presentation. Without prejudice to the foregoing, neither easyJet nor its associates nor any officer, director, employee or representative of any of them accepts any liability whatsoever for any loss however arising, directly or indirectly, from any reliance on this presentation or its contents.
This presentation is not being issued, and is not for distribution in, the United States (with certain limited exceptions in accordance with the US Securities Act of 1933) or in any jurisdiction where such distribution is unlawful and is not for distribution to publications with a general circulation in the United States.
By attending or reading this presentation you agree to be bound by the foregoing limitations.
45