h1'12 - interim report
DESCRIPTION
ÂTRANSCRIPT

1
SEMIANNUAL FINANCIAL REPORT
OF THE DIASORIN GROUP
AT JUNE 30, 2012
DiaSorin S.p.A.
Via Crescentino (no building No.) –13040 Saluggia (VC)
Tax I.D. and Vercelli Company Register No. 13144290155
2
CONTENTS
BOARD OF DIRECTORS, BOARD OF STATUTORY AUDITORS AND INDEPENDENT AUDITORS .............................. 3
THE DIASORIN GROUP .................................................................................................................................................. 4
STRUCTURE OF THE DIASORIN GROUP AT JUNE 30, 2012 .................................................................................... 6
CONSOLIDATED FINANCIAL HIGHLIGHTS .............................................................................................................. 7
DEVELOPMENT INITIATIVES ...................................................................................................................................... 8
INTERIM REPORT ON OPERATIONS ......................................................................................................................... 12
REVIEW OF THE GROUP’S OPERATING PERFORMANCE AND FINANCIAL POSITION ................................. 17 OPERATING PERFORMANCE IN THE SECOND QUARTER OF 2012 ............................................................... 17 OPERATING PERFORMANCE IN THE FIRST HALF OF 2012 ............................................................................. 27 STATEMENT OF FINANCIAL POSITION OF THE GROUP AT JUNE 30, 2012 ................................................. 35 ANALYSIS OF CONSOLIDATED CASH FLOWS .................................................................................................. 37 OTHER INFORMATION............................................................................................................................................ 38
TRANSACTIONS WITH RELATED PARTIES ............................................................................................................ 39
SIGNIFICANT EVENTS OCCURRING AFTER JUNE 30, 2012 AND BUSINESS OUTLOOK ................................ 40
CONDENSED SEMIANNUAL CONSOLIDATED FINANCIAL STATEMENTS AT JUNE 30, 2012 ...................... 41
CONSOLIDATED INCOME STATEMENT .................................................................................................................. 42
CONSOLIDATED STATEMENT OF FINANCIAL POSITION ................................................................................... 43
CONSOLIDATED STATEMENT OF CASH FLOWS ................................................................................................... 45
STATEMENT OF CHANGES IN CONSOLIDATED SHAREHOLDERS’ EQUITY .................................................. 46
CONSOLIDATED STATEMENT OF COMPREHENSIVE PROFIT AND LOSS........................................................ 47
NOTES TO THE CONDENSED SEMIANNUAL CONSOLIDATED FINANCIAL STATEMENTS AT JUNE 30,
2012 AND JUNE 30, 2011 ............................................................................................................................................... 48
CERTIFICATION OF THE CONDENSED SEMIANNUAL CONSOLIDATED FINANCIAL STATEMENTS
PURSUANT TO ARTICLE 81-TER OF CONSOB REGULATION NO. 11971 OF MAY 14, 1999, AS AMENDED 71

3
BOARD OF DIRECTORS, BOARD OF STATUTORY AUDITORS AND INDEPENDENT AUDITORS
B o a r d o f D i r e c t o r s ( elected on April 27, 2010 )
Chairman Gustavo Denegri
Deputy Chairman Antonio Boniolo
Chief Executive Officer Carlo Rosa (1)
Directors Giuseppe Alessandria (2) (3)
Chen Menachem Even
Enrico Mario Amo
Ezio Garibaldi (2)
Michele Denegri
Franco Moscetti (2)
Gian Alberto Saporiti
B o a r d o f S t a t u t o r y A u d i t o r s
Chairman Roberto Bracchetti
Statutory Auditors Bruno Marchina
Andrea Caretti
Alternates Umberto Fares
Maria Carla Bottini
I n d e p e n d e n t A u d i t o r s Deloitte & Touche S.p.A.
COMMITTEES
Internal Control Committee Ezio Garibaldi (Chairman)
Franco Moscetti
Enrico Mario Amo
Compensation Committee Giuseppe Alessandria (Chairman)
Ezio Garibaldi
Michele Denegri
Nominating Committee Franco Moscetti (Chairman)
Giuseppe Alessandria
Michele Denegri
Related-party Committee (4) Franco Moscetti (Coordinator)
Giuseppe Alessandria
Ezio Garibaldi
(1) General Manager
(2) Independent Director
(3) Lead Independent Director (4) Established pursuant to a Board resolution of November 5, 2010

4
THE DIASORIN GROUP
The DiaSorin Group is an international player in the market for in vitro diagnostics.
Specifically, the DiaSorin Group is active in the area of immunodiagnostics, a market segment that
encompasses the categories of immunochemistry and infectious immunology.
In the immunodiagnostics market segment, the Group develops, produces, and markets
immunoreagent kits for laboratory in vitro clinical diagnostics based on various technologies. The
technologies that the Group uses and has established as the foundation for the development and
production of its entire product line reflect the technological path followed by in vitro
immunodiagnostic assaying, starting with the introduction of the first commercial tests at the end of
the 1960s. Specifically, there are three primary technologies:
- RIA (Radio Immuno Assay): This is a technology that uses radioactive markers and is
currently employed primarily for some products capable of providing results that cannot be
delivered by other technologies. It does not enable the development of products that can be
used with automated testing systems and equipment, but only with products for tests that
have to be carried out manually by experienced technicians.
- ELISA (Enzyme Linked ImmunoSorbent Assay): Introduced in the 1980s, this is a non-
radioactive technology in which the signal generated by the marker is colorimetric, and
which primarily makes it possible to develop products in the microplate format. Originally,
products that used the ELISA technology were developed in such a way that diagnostic tests
could be performed with the use of minimally sophisticated instrumentation and with a high
level of involvement by the laboratory staff. Later came the development of analyzers
capable of automating some of the manual operations, but they were still much more
complex than the new generation of products that use the CLIA technology.
- CLIA (ChemiLuminescent Immuno Assay): This is the latest generation technology that
appeared in the early 1990s. Here, the signal is generated by a marker marked with a
luminescent molecule; the CLIA technology can be adapted to products and instruments with
features offering a high level of usage flexibility in terms of menus and the performance
speed of the test. This technology is used on the LIAISON system. Unlike ELISA, the CLIA
technology has made it possible to shorten processing time and has been used by diagnostic
companies to develop products in proprietary formats (that is, non-standard formats) based
on cartridges capable of working only on the system developed by the particular company
(so-called closed systems). The diagnostic kit used on the LIAISON system is manufactured
by DiaSorin in cartridges, each of which contains 100 tests for the same disease. Unlike
products that use the ELISA technology, the operator is not required to perform any action
on the product, which comes in its final form and only needs to be loaded into the
appropriate location on the equipment.
In addition to the development, production, and marketing of immunoreagent kits, the Group
supplies its customers with equipment that, when used in combination with the reagents, makes it
possible to carry out the diagnostic investigation automatically. Specifically, DiaSorin offers two
primary types of equipment: the ETI-MAX system, for products that are based on the ELISA
technology, and the LIAISON and LIAISON XL systems, which handle products developed on the
basis of the CLIA technology.

5
DiaSorin’s products are distinguished by the high technological and innovative content brought to
bear in the research and development process and the large-scale production of the biological raw
materials that constitute their basic active ingredients (viral cultures, synthetic or recombinant
proteins, monoclonal antibodies).
DiaSorin internally manages the primary processes involved in the research, production, and
distribution aspects, that is, the process that, starting with the development of new products, leads to
the marketing of those products. The Group's manufacturing organization consists of several
facilities located in Saluggia (VC), at the Group’s Parent Company’s headquarters; Stillwater,
Minnesota (USA), at the headquarters of DiaSorin Inc.; Dietzenbach, Frankfurt (Germany), at the
headquarters of DiaSorin Deutschland GmbH; Dublin (Ireland), at the headquarters of Biotrin Ltd;
Dartford (UK) and Kyalami (Johannesburg, South Africa). One more plant, located in Oslo
(Norway), was added recently with the NorDiag acquisition.
The Group headed by DiaSorin S.p.A. is comprised of 22 companies based in Europe, North,
Central, and South America, Africa, Asia and the Pacific Basin. Five of these companies are
involved both in research and production.
Lastly, the Group established foreign branches in Portugal, Great Britain the Netherlands and
Norway.
In Europe, the United States, Mexico, Brazil, China, Australia and Israel, the DiaSorin Group sells
its products mainly through its marketing companies that are part of the DiaSorin Group. In
countries where the Group does not have a direct presence, it operates through an international
network of more than 130 independent distributors.

6
STRUCTURE OF THE DIASORIN GROUP AT JUNE 30, 2012
DiaSorin
S.p.A.
DiaSorin Czech
s.r.o
DiaSorin
Iberia SA
Biotrin Group
Limited
DiaSorin SA
(France)
DiaSorin Australia
(Pty)LTD
DiaSorin Ltd
(UK)
DiaSorin Inc.
(USA)
DiaSorin Mexico
SA de CV
DiaSorin Ltd
(China)
DiaSorin
Deutschland GmbH
DiaSorin Austria
GmbH
DiaSorin Ltda
(Brazil)
DiaSorin Ltd
(Israel)
DiaSorin AB
(Sweden)
DiaSorin Iberia SA
Succursal en
Portugal
Biotrin
International
Limited
DiaSorin
I.N.UK Limited
Biotrin
Intellectual Properties
Limited
DiaSorin Canada
INC
UKASSE
(Germany)
99.99%
100%
100%
99.99%
100%
99.99%
80%
100%
100%
99.99%
100%
100%
100%
100%
100%
100%
88.75%
100%
100%
DiaSorin S.p.A.
UK Branch
DiaSorin SA/NV
(Belgium)
DiaSorin South Africa
(PTY) LTD
DiaSorin SA/NV
Dutch
Branch
100%
99.99%
9.58%
UK Branch Norwegian Branch

7
CONSOLIDATED FINANCIAL HIGHLIGHTS
Income statement
(in thousands of euros)
2nd
quarter
2011 (**)
2nd
quarter 2012
at const. scope
of consolidation
(*)(**)
Change in
scope of
consolidation
(NorDiag) (**)
2nd
quarter
2012 (**)
Net revenues 115,730 114,553 480 115,033
Gross profit 84,443 78,264 282 78,546
EBITDA (1) 51,458 45,888 (1,150) 44,738
EBIT 44,905 38,777 (1,201) 37,576
Net profit for the period 27,874 24,154 (1,069) 23,085
1
st half
2011
1st half 2012 at
constant scope
of consolidation
(*)(**)
Change in
scope of
consolidation
(NorDiag) (**)
1st half
2012
Net revenues 227,133 220,206 480 220,686
Gross profit 164,279 152,999 282 153,281
EBITDA (1) 101,429 90,036 (1,150) 88,886
EBIT 88,369 75,947 (1,201) 74,746
Net profit for the period 56,357 46,608 (1,069) 45,539
Statement of financial position
(in thousands of euros) 12/31/11 6/30/12
Capital invested in non-current assets 205,369 211,469
Net invested capital 309,531 324,281
Net financial position 41,647 52,000
Shareholders’ equity 351,178 376,281
Statement of cash flows
(in thousands of euros) 2
nd quarter
2011
2nd
quarter
2012
1st half
2011
1st half
2012
Net cash flow for the period (12,496) (10,789) (16,938) 5,698
Free cash flow (2) 14,926 26,251 38,695 42,732
Capital expenditures 8,027 7,780 12,742 14,588
Number of employees
1,527 1,569
(*) To provide a homogeneous comparison with the data for the first half and second quarter of 2011, the data stated at constant scope of
consolidation were prepared excluding the amounts attributable to the NorDiag business operations (acquired on May 4, 2012).
(**) Unaudited data.
(1) The Board of Directors defines EBITDA as the “operating result (EBIT)” before amortization of intangibles and depreciation of
property, plant and equipment.
(2) Free cash flow is the cash flow from operating activities, counting utilizations for capital expenditures but before interest
payments and acquisitions of companies and business operations..

8
DEVELOPMENT INITIATIVES
The research and development activity focused primarily on the following strategic areas:
completion of the development of the new LIAISON XL automatic analyzer and validation
of the existing LIAISON menu on the next-generation system;
ongoing development and release of new products that have enriched the menu available on
the LIAISON system platform;
development of infectious-disease and onco-hematology molecular assays and an automated
analyzer based on LAMP technology;
integration of the NorDiag R&D group into the molecular diagnostic business;
extension of product registrations in strategic markets in support of the Group's geographic
expansion.
LIAISON XL automated analyzer for immunodiagnostics
In the first half of 2012, installations of the LIAISON XL automated analyzer continued, reaching
an installed base of 354 units, with installations in countries where DiaSorin subsidiaries are
present, as well as in countries where marketing is done through distributors, for a total of 23
countries or commercial units currently involved in the LIAISON XL program, with their number
expected to rise in the second half of the year.
In order to support the growing demand for installations, the system production pace is gradually
being ramped up with the supplier, Stratec Biomedical A.G., now at 12 systems per week.
Thanks to feedback from the market and as a result of ongoing maintenance and improvement
programs already in effect, the first half of 2012 has seen:
- the completion of improvement and maintenance actions on hardware components;
- the release of two new software packages.
Additional work in the areas of maintenance and improvement programs is also planned for the
second half of the year.
In addition, the current LIAISON menu is being extended to the LIAISON XL. As of the end of the
first half of 2012, the number of tests "migrated" to the new platform came to:
- 64 for the EC/worldwide market;
- 6 for the U.S. market (including the 25OH Vitamin D TOTAL test).
New immunodiagnostic tests
In the first half of 2012, in the field of infectious diseases, DiaSorin SpA released kits for Measles
IgM and Mumps IgM for the world market (excluding the U.S.). In addition, an improved
LIAISON CMV IgG Avidity II assay compatible with both the LIAISON and LIAISON XL was
also released onto the market. Together with recently released products (CMV IgG II and CMV
IgM II), this kit rounds off the renewed line for automated anti-CMV antibody assaying. In
addition, the CE mark for a new version of the HBs kit was obtained in January 2012.
At the beginning of 2012, the U.S. FDA approved the new version of the Vitamin D test.
As part of work in the area of automated immunometric feces diagnostics, a kit for detecting
Chlostridium Difficile infections was released in January 2012 and one for Helicobacter Pylory in
March 2012 (together with a new system developed by DiaSorin in collaboration with Dyasis [UK]

9
for collecting and extracting feces, which is compatible with our LIAISON systems), both for the
E.U. market.
Development work on a new kit for determining the avidity of Toxoplasma IgG, an assay
compatible with the LIAISON XL instrument, is continuing. The HTLV I/II antibody test was
submitted on schedule to the notification agency for obtaining the CE mark. The launch of the
HTLV I/II kit, which will complete the line of LIAISON XL Blood Bank products, is scheduled for
the second half of 2012. At the same time, development of a new version of the HIV kit, with better
performance than the currently available version, and an antibody screening kit for the diagnosis of
Chagas disease, which is especially important for the Central/South American diagnostics market, is
currently under way.
In the first half of 2012, additional development work on new immunodiagnostic kits focused on
GDH projects (for the platform automating immunometric feces analysis), new assays for sex
steroid hormones and the first test for the automated assaying of aldosterone.
DiaSorin's Gerenzano Research Center
The finishing technical touches to the Aldosterone assay prototype were completed at the
Gerenzano Research Center in the first half of 2012 and the processes and know-how were
transferred to the Stillwater site, where the assay entered the product development phase.
The “C. difficile” project was completed with the generation and characterization of mouse
monoclonal antibodies directed against both toxins (A and B) of the bacterium, which are potential
candidates for the development of “sandwich” assays. The immunometrically improved antibodies
were transferred to the Stillwater site for further characterization, while the corresponding
hybridomas were transferred to Saluggia to be stored in the corporate clone bank. In addition, a
recombinant domain of the B toxin, which may be useful as a calibrator for the assay, was
produced; this made it possible to purify a polyclonal antibody directed against the toxin, generated
in Stillwater, which could potentially be used in combination with one of the monoclonal antibodies
developed at the Center.
A development project for a new High-Throughput HIV Combo assay (combined detection of
antibodies and p24 antigen of the virus) in collaboration with the Saluggia site, which calls for the
re-development of the primary reagents, has also been started. New peptide-type synthetic reagents
have been developed and their chemistry is currently in the optimization phase. At the same time,
the search for new technological signal solutions is under way for antibody reagents that are
compatible with the new peptide reagents and capable of providing the test with the desired
sensitivity.
In support of the Sclerostin project under way at the Stillwater site, the similarly-named
recombinant protein, which could potentially be used as a calibrator for the future test, has been
produced. The preparation process has been transferred to Saluggia.
Other projects which started in the first half of 2012 include projects for the development of
reagents (proteins and antibodies) for the development of assay prototypes for determining levels of
hormone FGF-d23 and 1,25-dihydroxyvitamin D, the latter to support ongoing work at the
Stillwater site.

10
Molecular diagnostics activities
In the field of molecular diagnostics, R&D activity has been aimed at the development of new
assays to diagnose infectious diseases and hematologic malignancies. For infectious diseases, the
development of seven molecular assays for the detection of VZV, Toxoplasma and HSV1/2, and for
the detection and monitoring of the viral load of CMV, EBV, parvovirus and BKV, continued in the
first half of 2012. The feasibility and optimization phases have been completed and the assays are
currently in the validation phase and will be marketed in fourth quarter 2012. In addition,
development started on a test for Clostridium Difficile, which will be marketed in 2013 in Europe
and the United States.
In the first half of 2012, development of the LIAISON IAM analyzer continued according to plan
and breadboards were produced and tested, followed by prototypes implementing all the
functionalities of the final system, which is expected to launch in fourth quarter 2012.
Following the acquisition of NorDiag (see below), Nordiag's R&D team is participating in the
development of the molecular assay for diagnosing C. Difficile by developing a simple, manual
method for sample preparation.
Regarding molecular diagnostics in oncohematology, the first half of 2012 saw the completion of
the feasibility of five molecular assays, the purpose of which is to qualitatively detect the primary
transcripts of translocation (t(8;22) BCR-ABL, p190-p210) as well as the primary transcripts of
translocation (t(15;17) PML-RARa, BCR1-BCR2-BCR3). Starting with the beginning of second
quarter 2012, six molecular assays have been under development for the detection of translocations
t(8;21) AML1-ETO and inv(16) CBFB-MYH11 (transcripts A, E, D) and the two point mutations
of gene C-KIT (V816D; N822K).
Development of the latter assays will allow the diagnostic panel for the screening of acute myeloid
leukemias to be completed, which is essential not only for the diagnosis but also the prognosis and
treatment options of these diseases.
NorDiag acquisition and integration into the molecular diagnostics activities
The acquisition of NorDiag, a Norwegian company specializing in the automated extraction of
nucleic acids, was completed in May 2012. To understand the strategic value of this acquisition, we
must recall that molecular diagnostics is essentially based on two sequential phases. The first is
extraction of the nucleic acids from various biological media (for example, whole blood, serum,
plasma, urine). Over the years, market demand has turned to simple and reasonably low-cost
systems for automated nucleic acid extraction. The second phase consists in amplifying the nucleic
acids. DiaSorin had already acquired and developed the know-how for nucleic acid amplification
and detection by means of the LAMP technology. With the acquisition of NorDiag, DiaSorin is
strategically complementing its amplification expertise and technology with nucleic acid extraction
capabilities. Thanks to this acquisition, DiaSorin now has the know-how and technologies for the
entire process leading to molecular diagnosis, from nucleic acid extraction to amplification and
detection.
In keeping with the strategic value of the NorDiag acquisition, DiaSorin decided to preserve
NorDiag's R&D organization and integrate it into the Group's areas of molecular diagnostics, thus
confirming its operational capacity at the Oslo laboratories, such as Biotrin Norway. In recent
months, this organization was gradually incorporated into the Group's molecular diagnostics
projects, to which it is starting to make its own contribution of knowledge and technology in
automated nucleic acid extraction.

11
The NorDiag acquisition is of particular strategic value considering that the Company, after
developing and marketing the LIAISON IAM system, which is capable of automated nucleic acid
amplification with LAMP technology, decided to start a project in 2013 aimed at creating a second-
generation, integrated instrument capable of extracting, amplifying and detecting nucleic acids in a
simple and reasonably low-cost automated way.

12
INTERIM REPORT ON OPERATIONS
Foreword
These condensed semiannual consolidated financial statements were prepared in accordance with
international accounting principles (International Accounting Standards – IAS and International
Financial Reporting Standards – IFRS) and the corresponding interpretations (Standing
Interpretations Committee – SIC and International Financial Reporting Interpretations Committee –
IFRIC) published by the International Accounting Standards Boards (IASB). More specifically,
they are being presented in condensed form, in accordance with the international accounting
principle that governs interim financial reporting (IAS 34), as adopted by the European Union, and
comply with the requirements of Article 154-ter, Sections 2 and 3, of Legislative Decree No. 58 of
February 24, 1998.
Acquisitions of companies and business operations
On May 4, 2012, the DiaSorin Group signed an agreement to acquire from the NorDiag Group its
business operations, including technologies, patents and knowhow, related to the extraction of
nucleic acids used for molecular diagnostics applications.
NorDiag ASA, a holding company based in Oslo that heads the NorDiag Group, with shares listed
on the Norwegian stock exchange (NORD), develops, produces and markets automated
technologies for isolating nucleic acids and cells in biological samples, which are essential for the
implementation of molecular diagnostics procedures.
The products offering of the acquired business operation includes:
i) reagent kits for the extraction of nucleic acids (DNA and RNA) from biological samples of
different type (blood, plasma, serum, urine, swabs, stool and sputum);
ii) two dedicated systems for the extraction phase of nucleic acids that can simultaneously handle
multiple samples: the “Bullet” platform for high-volume routines and the “Arrow” platform for
lower throughput routines;
iii) control software customizable to the needs of individual customers.
The assets acquired by the DiaSorin Group included:
Production plant and equipment acquired by Biotrin International through a branch established
in Norway;
the NorDiag, Arrow and Bullet trademarks;
all intellectual properties (including those licensed) needed to manufacture and market the
products;
medical equipment installed at various locations in Europe and the rest of the world;
the customer list and the distribution contracts for the products handled by the acquired business
operations.
The transaction involved 19 employees; no trade receivables and payables were acquired.
The purchase price was 7.6 million euros, entirely financed from internal resources of the DiaSorin
Group.

13
The Group consolidated the amounts for the first month of activity of the acquired business, starting
on the transaction date. To provide a homogeneous comparison with the data for the first half and
second quarter of 2011, the income statement data shown in this interim report are being presented
on a constant scope of consolidation basis, excluding the amounts attributable to the new business
operations from the scope of consolidation.
Lastly, the process of valuing the assets of the acquired group is currently begin completed and,
consequently, any excess consideration paid, compared with the carrying amounts of the acquired
assets, was provisionally added to “Goodwill,” as allowed by IFRS 3 Revised.
14
Key events in the first half of 2012
In January, DiaSorin S.p.A. received the CE mark enabling it to market a new assay for the
diagnosis of the Hepatitis B virus (Anti-HBs II), a completely standardized test, more easily
replicable and with greater sensitivity for the quantitative determination of antibodies for the
surface antigen of the Hepatitis B virus. The LIAISON® Anti-HBs II assay uses the
ChemiLuminescent Immuno Assay (CLIA) technology to determine the quantity of antibodies for
the surface antigen of the Hepatitis B virus (Anti-HBs) in serum or blood samples. The test is
available both on the LIAISON® and LIAISON® XL systems.
In January, DiaSorin S.p.A. received from the Food and Drug Administration (FDA) authorization
to market in the United States a new immunological assay (LIAISON® 25 OH Vitamin D TOTAL
Assay) developed for quantitative determination of Vitamin D levels on the LIAISON® proprietary
platform. Over the past two years, DiaSorin’s research organization developed this new product
intended for use on the LIAISON platform and designed to improve some of the features of its
predecessor product, thereby setting a new quality standard for Vitamin D tests.
In February, DiaSorin S.p.A. joined the ISBT as a “Gold Corporate Member.” The ISBT
(International Society of Blood Transfusion) is the most important professional association at the
international level in the fields of transfusions and transplants.
DiaSorin chose to partner with ISBT because it totally shares its current strategic vision of
“facilitating knowledge about transfusion medicine to serve the interests of donors and patients.”
The agreement with ISBT will contribute to further expanding DiaSorin’s business in the blood
transfusion area and promoting its brand in terms of market visibility. ISBT membership further
positions DiaSorin as a reliable player in the blood bank market, through the offer of a vast range of
high quality product, including the complete panel of the MUREX line on ELISA technology.
On February 9, 2012, DiaSorin S.p.A. announced that the amount of its share capital had changed, due
to the subscription of a capital increase consisting of 77,175 common shares, par value 1 euro each,
reserved for implementation of the “2007-2012 Stock Option Plan,” approved by the Board of Directors
on March 26, 2007. An additional 60,000 common shares, par value 1 euro each, were issued upon
subscription on March 7, 2012 in implementation of the abovementioned Stock Option Plan.
In March, DiaSorin signed an exclusive worldwide agreement, valid until 2015, for the supply of its
Vitamin D products (25-Hydroxy Vitamin D) to the Sonic Healthcare Group (SHL.AX), an
international medical testing group with operations in the United States, Australia, New Zealand,
Germany, Switzerland, Belgium, the United Kingdom and Ireland.
Under the terms of the agreement, DiaSorin will supply its Vitamin D products, as an exclusive
supplier, to all Sonic Group laboratories for use on DiaSorin’s LIAISON® and LIAISON®XL
proprietary systems in Australia, Germany and the United States and will enjoy preferential supplier
status for laboratories in Belgium, Ireland, New Zealand, Switzerland and the United Kingdom.
In its capacity as exclusive supplier, DiaSorin reserves the right to supply its products, directly or
indirectly, also to other users and/or customers, in addition to Sonic’s laboratories. Moreover, as a
preferential supplier, DiaSorin will enjoy priority status in submitting sales proposals ahead of all
other suppliers.
In the second quarter of 2012, DiaSorin announced the launch of the first totally automated assay
for determination of Helicobacter Pylori in stool samples, which will be available on the LIAISON
and LIAISON XL platforms in most of DiaSorin’s markets, with the exception of the United States
and the United Kingdom.

15
In April 2012, DiaSorin announced the launch of two new products for the determination of IgM
measles virus antibodies (Measles IgM) and mumps virus antibodies (Mumps IgM). These two new
assays, based on CLIA technology, provide a fully automated qualitative determination of IgM
antibodies for the measles and mumps viruses in human serum and plasma samples on the
LIAISON platforms.
On May 4, 2012, as explained in a separate section of this Report (which should be consulted for
additional information), the DiaSorin Group signed a contract to acquire from the NorDiag Group
its business operations, technologies, patents and knowhow related to the extraction of nucleic acids
used for molecular diagnostics applications.
On June 27, 2012, DiaSorin S.p.A. announced that its share capital changed, due to the subscription
of a capital increase consisting of 20,000 common shares, par value 1 euro each, reserved for
implementation of the “2007-2012 Stock Option Plan,” approved by the Board of Directors on
March 26, 2007.
The foreign exchange market
In the foreign exchange market, the average exchange rate of the euro versus the U.S. dollar
deteriorated by 7.6% in the first half of 2012, compared with the same period last year. The euro lost
value also vis-à-vis the other currencies used by the Group, with the exchange rate down
considerably in some cases compared with the first six months of 2011, particularly for the
Australian dollar (down about 7.5%) and the Chinese yuan (down about 10.7%). On the other hand,
the euro appreciated in value by more than 6% versus the South African rand and by about 5.5%
versus the Brazilian real.
The loss in value of the euro versus the U.S. dollar was even more pronounced in second quarter of
2012 (-11% compared with the same period last year). With regard to the other currencies used by the
Group, the euro lost value compared with the exchange rates in effect last year, particularly in the
case of the Australian dollar (down about 6.3%), the British pound (down about 8.2%) and the
Chinese yuan (down about 13.3%). On the other hand, the euro appreciated significantly compared
with last year’s average exchange rates for the Brazilian real (up about 9.6%) and the South African
rand (up about 6.5%)
The table below provides a comparison of the average and end-of-period exchange rates for the first half
and second quarter of 2012 and 2011 (Source: Italian Foreign Exchange Bureau):

16
Currency Average At
1st half 2012 1st half 2011 2nd quarter 2012 2nd quarter 2011 6/30/12 6/30/11
U.S. dollar 1.2965 1.4032 1.2814 1.4391 1.2590 1.4453
Brazilian real 2.4144 2.2879 2.5167 2.2960 2.5788 2.2601
British pound 0.8225 0.8682 0.8100 0.8827 0.8068 0.9026
Swedish kronor 8.8824 8.9391 8.9133 9.0153 8.7728 9.1739
Czech koruna 25.1742 24.3495 25.2693 24.3237 25.6400 24.3450
Canadian dollar 1.3040 1.3706 1.2949 1.3932 1.2871 1.3951
Mexican peso 17.1867 16.6865 17.3620 16.8752 16.8755 16.9765
Israeli shekel 4.9231 4.9366 4.9021 4.9490 4.9453 4.9439
Chinese yuan 8.1901 9.1755 8.1072 9.3509 8.0011 9.3416
Australian dollar 1.2559 1.3582 1.2699 1.3550 1.2339 1.3485
South African rand 10.2942 9.6856 10.4214 9.7852 10.3669 9.8569

17
REVIEW OF THE GROUP’S OPERATING PERFORMANCE AND FINANCIAL POSITION
Foreword
As mentioned earlier in this Report, the Group consolidated the amounts for the first month of
activity of the acquired business, starting on the transaction date. However, in order to provide a
homogeneous comparison with the data for the first half and second quarter of 2011, the income
statement data shown in this Report are being presented on a constant scope of consolidation basis,
excluding from the scope of consolidation the amounts attributable to the new business operations
and showing them in a separate section of the income statement, reflective of the consolidation
adjustments. Consequently, the comments concerning the operating performance during the
reporting period refer to the Group, with data on a constant scope of consolidation basis. Specific
comments about the new business operations are provided whenever a significant impact is
involved.
OPERATING PERFORMANCE IN THE SECOND QUARTER OF 2012
In the second quarter of 2012, net of the contribution provided by the recently acquired NorDiag
business operations, revenues totaled 114,553 thousand euros, 1.0% lower than in the same period
last year, but up 8.4% compared with the first quarter of 2012 despite a difficult macroeconomic
environment in some of Europe’s main countries (Italy, France and Spain above all), where a
contraction in healthcare spending caused the volume of prescribed tests to shrink between 2% and
2.5%.
Excluding the positive translation effect attributable mainly to the gain in value of the U.S. dollar
(equal to about 11%), the change in revenues would have amounted to 5,515 thousand euros or
4.8%.
The main reasons for this decrease include i) lower Vitamin D revenues, which began to decline in
the third quarter of 2011, particularly in North America, France and Australia, and ii) the absence of
some nonrecurring items that had a positive impact on last year’s revenues. More specifically:
i) In the United States, the Group was faced with extreme price pressure caused by major
competitors, who did not carry this diagnostic specialty in their catalogs in 2011.
ii) Vitamin D sales volumes in North America, after peaking in the summer of 2011, began to
contract in the third quarter of 2011, falling by more than 10% and settling to the current level.
iii) At the beginning of 2012, reentry into the European and Australian markets by a competitor,
who had withdrawn this test at the end of 2010, thereby enabling the Group to increase revenues
in the two following quarters.
iv) The earlier award of a contract to supply ELISA technology products in Brazil that ended in the
third quarter of 2011. As a result, these revenues were missing in the first half of 2012, but the
contract was again awarded to DiaSorin, with product deliveries resuming in the third quarter of
2012.
In order to more effectively contextualize the developments commented above, the chart that
follows shows the trend of Group revenues on a quarter-by-quarter basis starting in 2011, both at
current exchange rates and constant exchange rates:

18
The chart above clearly shows how, excluding the development that occurred in the first two quarter
of 2011 (commented earlier in this Report), the Group’s revenues follow a positive trend, showing
in the second quarter of 2012 gains, at constant exchange rates, of almost 6% and almost 5%
compared, respectively, with the third quarter and fourth quarter of 2011, and of more than 8%
compared with the first quarter of the current year.
Lastly, a noteworthy development was a continuation of the outstanding performance of the CLIA
technology product families, excluding Vitamin D tests, which, thanks to a quarter-over-quarter
growth of more than 15%, more than offset the impact of the physiological decline of the contribution
provided by the more dated, open RIA and ELISA technologies and significantly reduced the impact
on Group revenues of the nonrecurring items described above. Noteworthy developments included
rising sales in the areas of Tumor Markers, Infectiology, Prenatal Screening panel, Parvovirus and the
new HIV and Viral Hepatitis line, due largely to the launch of the new closed LIAISON XL
automated analyzer, which enabled the Group to offer to its customers a solution that was competitive
with the products available from major players in these market segments.
In the second quarter of 2012, DiaSorin placed a total of 134 new LIAISON XL analyzers, bringing
the installed base to about 354 systems (including 41 in the validation phase, mostly at the facilities
of a major customer in North America, who replaced some LIAISON units that reached the end of
their useful lives with fewer LIAISON XL systems). An additional 29 LIAISON analyzers were also
placed with customers, bringing to 163 the total number of analyzers installed in the second quarter
of 2012.
NorDiag sales, divided almost equally between systems and reagents, were made almost exclusively
to customers acquired together with the molecular business operations in May 2012. This was
because, due to the short time that elapsed since the acquisition, the Group has not yet been able to
reap the benefits that would be available by leveraging its extensive sales network.
95,000
100,000
105,000
110,000
115,000
120,000
Q1 2011 Q2 2011 Q3 2011 Q4 2011 Q1 2012 Q2 2012
REVENUES AT CURR. EXCH. RATES
REVENUES AT CONST. EXCH. RATES

19
The gross profit, net of NorDiag’s impact, totaled 78,264 thousand euros in the second quarter of
2012, for a decrease of 7.3 percentage points (6,179 thousand euros) compared with the same period
last year (84,443 thousand euros). The gross profit was equal to 68.3% of revenues, down by 4.7
percentage points compared with the profitability level achieved by the Group in the second quarter
of 2011. This decrease is the direct result of the developments mentioned above, when commenting
revenues. Specifically: i) lower Vitamin D revenues (due in part to price concessions in exchange
for multi-year contract renewals); ii) increase in revenues from distributors, who, by definition, pay
lower prices than end customers; iii) slower growth by some European subsidiaries and in Brazil;
and iv) increase in equipment sales, which, by their very nature, are characterized by lower margins.
It is worth mentioning that, net of these nonrecurring items, the profitability of the reagents
marketed by the Group held at the excellent levels achieved thus far. When the recently acquired
NorDiag business operations are included, the Group’s gross profit totals 78,546 thousand euros.
This amount is slightly higher than the figure at constant scope of consolidation, thanks to the
margins contributed by sales of molecular products.
Consolidated EBITDA, net of NorDiag’s impact, decreased from 51,458 thousand euros in the
second quarter of 2011 to 45,888 thousand euros in the same period this year, for a contraction of
10.8% that primarily reflects the reduction in gross profit. The ratio of EBITDA to revenues was
equal to 40.1%, decreasing by 4.4 percentage points compared with the second quarter of 2011, due
to the reason mentioned above. EBITDA including the NorDiag business operations totaled 44,738
thousand euros. Nonrecurring charges incurred in connection with the acquisition of the molecular
business and its subsequent reorganization account for the difference compared with the amount
without NorDiag.
Consolidated EBIT, net of NorDiag’s impact, which declined by 13.6%, falling from 44,905 thousand
euros to 38,777 thousand euros, were equal to 33.9% of revenues (4.9 percentage points less than in
the second quarter of 2011). EBIT with NorDiag included amount to 37,576 thousand euros.
Net financial expense totaled 1,634 thousand euros in the second quarter of 2012, compared with
net financial expense of 875 thousand euros in the same period last year. The difference between
these two quarters is chiefly the result of the disparity in the trend prevailing in the foreign
exchange markets and the resulting impact on the measurement at fair value of forward contracts to
sell U.S. dollars (negative by 623 thousand euros, compared with a negative balance of 157
thousand euros in the second quarter of 2011) and the recognition of currency translation losses of
forward contracts that expired in the second quarter of 2012 (amounting to 180 thousand euros, as
against gains of 445 thousand euros in the second quarter of 2011). Please note that these charges
were recognized purely for valuation purposes, without any impact on cash flow for the period.
Income taxes totaled 12,989 thousand euros in the second quarter of 2012 (16,156 thousand euros in
the same period last year). The tax rate decreased from 36.7% in the second quarter of 2011 to 35%
in the second quarter of 2012, due mainly to the effect of taxes withheld on the dividends
distributed by the U.S. subsidiary, amounting to 137 thousand euros (1,332 thousand euros in the
second quarter of 2011).
Lastly, the net profit for second the quarter totaled 24,154 thousand euros, down 13.3% compared with
the same period in 2011. When the effect of the NorDiag acquisition is included, the net profit for the
second quarter of 2012 amounts to 23,085 thousand euros, after taxes of 12,858 thousand euros.
The table that follows shows the consolidated income statement for the quarters ended June 30,
2012 and June 30, 2011:

20
CONSOLIDATED INCOME STATEMENT
Second quarter
(in thousands of euros) 2011(**)
2012
at const. scope
of consolidation
(*)(**)
Change in scope of
consolidation
(NorDiag) (**)
2012(**)
Sales and service revenues 115,730 114,553 480 115,033
Cost of sales (31,287) (36,289) (198) (36,487)
Gross profit 84,443 78,264 282 78,546
73.0% 68.3% 58.8% 68.3%
Sales and marketing expenses (20,865) (20,432) (80) (20,512)
Research and development costs (5,498) (6,074) (208) (6,282)
General and administrative expenses (11,337) (12,115) (342) (12,457)
Total operating expenses (37,700) (38,621) (630) (39,251)
Other operating income (expense) (1,838) (866) (853) (1,719)
non-recurring amount - - (853) (853)
EBIT 44,905 38,777 (1,201) 37,576
38.8% 33.9% n.m. 32.7%
Net financial income (expense) (875) (1,634) 1 (1,633)
Profit before taxes 44,030 37,143 (1,200) 35,943
Income taxes (16,156) (12,989) 131 (12,858)
Net profit 27,874 24,154 (1,069) 23,085
EBITDA (1) 51,458 45,888 (1,150) 44,738
44.5% 40.1% n.m. 38.9%
(*) To provide a homogeneous comparison with the data for the first half and second quarter of 2011, the data stated at constant scope of
consolidation were prepared excluding the amounts attributable to the NorDiag business operations (acquired on May 4, 2012).
(**) Unaudited data.
(1) With regard to the income statement data provided above, please note that the Board of Directors defines EBITDA as the “result
from operations” before amortization of intangibles and depreciation of property, plant and equipment. EBITDA, which the Company
uses to monitor and assess the Group’s operating performance, are not recognized as an accounting tool in the IFRSs and, consequently,
should not be viewed as an alternative gauge to assess the Group’s operating performance. Because the composition of EBITDA is not
governed by the reference accounting principles, the computation criterion used by the Group could be different from the criterion used
by other operators and/or groups and, consequently, may not be comparable.

21
Net revenues
As mentioned earlier in this Report, in the second quarter of 2012, net of the contribution provided
by the recently acquired NorDiag business operations, revenues totaled 114,553 thousand euros, up
8.4% compared with the first quarter of 2012, but 1.0% lower than in the same period last year,
despite a difficult macroeconomic environment in some of Europe’s main countries (Italy, France and
Spain above all), where the volume of prescribed tests contracted between 2% and 2.5%.
Restated excluding the currency translation effect, revenues show a decrease of 4.8 percentage
points, due mainly to fluctuations in the USD/EUR exchange rate, with the greenback posting a
significant increase in value compared with the second quarter of 2011.
Lastly, the revenues generated by the recent NorDiag acquisition, completed in May 2012,
amounted to 480 thousand euros.
Please note that in the first half of 2011 revenues were boosted by some large nonrecurring items,
which significantly reduce the homogeneity of the comparison with this year’s second quarter and
run the risk of overshadowing the outstanding performance of the Group’s other products, which,
net of Vitamin D revenues, enjoyed a growth of more than 8%.
Breakdown of revenues by geographic region
The table below provides a breakdown of the consolidated revenues of the DiaSorin Group by
geographic region of destination.
In order to provide a more homogeneous comparison, the revenues generated by Murex and
NorDiag products are shown separately from the geographic breakdown of DiaSorin’s traditional
business activities.
Insofar as Murex is concerned, even though the acquisition occurred before the second quarter of
2011, the logistics flows that resulted from the need to use Abbott branches for distribution in some
areas in 2011 made it impossible to provide an accurate breakdown of last year’s revenues by
geographic region of destination. Consequently, the comments about sales and service revenue by
geographic region refer only to DiaSorin’s business activities.
(in thousands of euros) Second quarter
2012 2011
% change at
current
exchange rates
% change at
constant
exchange rates
Europe and Africa 50,009 48,961 2.1% 1.7%
Central and South America 7,975 8,750 -8.9% -3.7%
Asia Pacific 14,570 11,452 27.2% 19.3%
North America 32,402 36,938 -12.3% -22.0%
Total without Murex 104,956 106,101 -1.1% -5.1%
Murex 9,597 9,629 -0.3% -1.3%
Total with Murex 114,553 115,730 -1.0% -4.8%
Molecular (NorDiag) 480 -
Grand total 115,033 115,730 -0.6% -4.4%

22
Before proceeding with a review of the data for each geographic region, it is worth mentioning how,
in the second quarter of 2012, the remarkable revenues increase achieved in the Asia Pacific region
(19.3% at constant exchange rates) managed to offset almost completely the reductions reported in
North America (22% at constant exchange rates: Vitamin D effect) and Central and South America
(3.7% at constant exchange rates: delay in the award of a call for tenders in Brazil). Lastly, in
Europe, revenues were up only a modest 1.7% (at constant exchange rates) due to a reduction in
healthcare spending caused by the macroeconomic crisis affecting Spain, France and Italy.
Europe and Africa
Revenues booked in the Europe and Africa sales region totaled 50,009 thousand euros in the second
quarter of 2012, for a gain of 2.1% (1.7% at constant exchange rates) compared with the same
period last year (48,961 thousand euros). This improvement reflects the effect of an outstanding
performance in the indirect markets served through Group distributors (growth of more than 30%)
and in most direct markets, with major exceptions in Spain, France and Italy, where revenues were
down slightly, due mainly to a difficult macroeconomic situation and the resulting contraction in
healthcare spending. In France, another negative factor was the abovementioned reentry into the
Vitamin D market of a competitor of the Group, who had withdrawn its product for quality problems
towards the end of 2010. The best performers among the countries reporting higher revenues
included Israel (+14.8%), the UK (+6.3%) and Germany (+4.7%). Also worth mentioning are the
positive results achieved with the product lines tied to the launch of the LIAISON XL analyzer,
particularly the new products in the HIV and Viral Hepatitis lines, and the commercial success of
the LIAISON XL automated analyzer.
North America
In the second quarter of 2012, the North America sales region reported revenues of 32,402 thousand
euros, down 12.3% compared with the same period last year. Net of the currency translation effect,
the decrease would have grown to 22 percentage points, due the significant appreciation of the U.S.
dollar versus the euro in 2012 (more than 10%). An outstanding performance by specialties in the
Infectiology and Prenatal Screening product families, with a revenue gain of more than 30
percentage points, was more than offset by a slowing of Vitamin D sales that started in the third
quarter of 2011, as mentioned earlier in this Report. Two main factors account for this decrease: i)
lower prices and ii) a reduction in sales volumes, beginning in the third quarter of 2011, that caused
unit sales to settled at a level more than 10% below the peak achieved in the summer of 2011. More
specifically, the price reduction is attributable to the market entry of the Group’s main competitors,
who pursued extremely aggressive sales policies. DiaSorin responded to these policies, starting in
Europe and Africa47.7%
Central and South America
7.6%
Asia Pacific13.9%
North America 30.8%
2nd quarter 2012 DiaSorin's businesses
Europe and Africa46.1%
Central and South America
8.3%
Asia Pacific10.8%
North America 34.8%
2nd quarter 2011 DiaSorin's businesses

23
the third quarter of 2011, by offering sales discounts in exchange for extending supply contracts and
thus consolidating its customer base.
Central and South America
The Latin American sales region reported revenues of 7,975 thousand euros in the in the second
quarter of 2012, for a reduction of 8.9 percentage points compared with 8,750 thousand euros in the
second quarter of 2011 (net of the Murex product line). With data restated net of the currency
translation effect, the revenue decrease is equal to 3.7 percentage points (devaluation of the
Brazilian currency). This negative result is mainly attributable to: i) the loss of a major Vitamin D
customer in Brazil; ii) the absence of the revenues generated by the award of an important contract
for the supply of ELISA products that ended in the third quarter of 2011 (a new contract was
awarded to the local subsidiary, with the supply of these products expected to resume in the third
quarter of 2012); and iii) lower equipment sales to the network of Group distributors in indirect
markets, which reached a peak in 2011 (these sales have now been replaced with sales of reagents).
Lastly, it is worth mentioning that the Mexican subsidiary increased revenues by more than 14
percentage points compared with the same period in 2011.
Asia Pacific
In the second quarter of 2012, the Asia Pacific sales region reported excellent sales results, with total
revenues increasing to 14,570 thousand euros, for a gain of 27.2 percentage points compared with the
same period last year. At constant exchange rates, revenues show an increase of 19.3 percentage points
(due mainly to fluctuations in the value of the Australian currency versus the euro).
The revenues gain is the net result of three factors, two positive and the third one negative: i) the
outstanding performance in the Chinese market, where revenues (as constant exchange rates)
increased by more than 42 percentage points in the second quarter of 2012 (evenly distributed
among all CLIA products sold in that country); ii) the excellent results achieved in the markets
served through Group distributors (+41.7%), due both to equipment sales and the reestablishment of
the revenue stream from markets in the Middle East; and iii) a significant decrease in revenues
generated in the Australian market due to the loss of two important local customers (one was
recovered in May 2012) and the substantial reduction in Vitamin D prices granted to the Sonic
Healthcare Group in exchange for an exclusive contract until 2015 in some key markets of the
Group (including the United States, Germany and Australia).
Breakdown of revenues by technology
The table that follows shows the percentage of the Group’s consolidated revenues contributed by
each technology in the second quarter of 2012 and 2011. Due to the acquisition of the NorDiag
business operations, the contribution of a new technology, that of molecular diagnostics, is shown
for the first time.
The data in the table reflect the steady physiological decline of the contribution provided by the RIA
and ELISA technologies (which are more dated and function on open systems). They also show a
slight reduction in the percentage of total revenues provided by CLIA products, due both to the
decrease in Vitamin D sales mentioned above (which peaked in the first half of 2011) and the high
revenues generated by equipment sales (mainly LIAISON XL, but also molecular diagnostic systems).
Revenues from equipment sales grew by more than 27% compared with the previous year, producing
an increase of about 3 percentage point in the percentage contribution to total revenues.

24
% of revenues contributed Second quarter 2012 Second quarter 2011
RIA 3.5% 4.1%
ELISA 17.2% 18.6%
CLIA 66.9% 67.9%
MOLECULAR 0.2% -
Equipment sales and other revenues 12.2% 9.4%
Total 100.0% 100.0%
At June 30, 2012, a total of about 4,519 LIAISON automated analyzers (including 41 in the
validation phase) were installed at facilities operated by direct and indirect Group customer, for an
increase of 313 units compared with the installed base at December 31, 2011. The new LIAISON
XL automated analyzer continued to be extremely well received by the market, with 354 units
already installed after slightly more than nine months from its launch. It is worth mentioning that the
Group expects the growth rate of the installed base to slow over the coming months, due to the
greater productivity of the LIAISON XL system compared with the LIAISON system. Specifically,
thanks to innovative technological solutions, the new analyzer will deliver a productivity increase
ranging between 50% and 90%, which, in all likelihood, will enable i) new customers to use fewer
LIAISON XL analyzers compared with the number of LIAISON systems they would have needed to
meet the requirements of their laboratories; and ii) existing customers to install fewer LIAISON XL
analyzers compared with the number of LIAISON systems previously installed, when these reach
the end of their useful lives, with a beneficial impact on depreciation expense.
Operating performance
Net of NorDiag, the Group ended the second quarter of 2012 with a gross profit of 78,264 thousand
euros compared with 84,443 thousand euros in the same period in 2011, for a decrease of 7.3
percentage points, or 6,179 thousand euros. At the same time, the ratio of gross profit to revenues
decreased from 73.0 percentage points to 68.3 percentage points.
The main factors driving this change, with a corresponding impact on EBITDA and consolidated
EBIT, include a partial decrease in revenues and, as mentioned earlier in this Report, a change in the
sales mix, with a smaller contribution provided by Vitamin D sales and sales by some subsidiaries,
particularly in Europe, and increases in sales by distributors and equipment sales, with the attendant
RIA3.5% ELISA
17.2%
CLIA66.9%
MOLECULAR0.2%
Equipment sales and other
revenues12.2%
2nd quarter 2012 DiaSorin's businesses
RIA4.1% ELISA
18.6%
CLIA67.9%
MOLECULAR0.0%
Equipment sales and
other revenues
9.4%
2nd quarter 2011 DiaSorin's businesses

25
benefit of expanding the installed base and prospectively increase the ability to generate reagent
revenues.
Operating expenses, net of NorDiag, totaled 38,621 thousand euros in the second quarter of 2012,
for a modest increase of 2.4 percentage points compared with the same period last year. It is worth
mentioning that this change is largely due to a strengthening of the U.S. dollar versus the euro,
which increased the impact of the costs incurred by the U.S. operations (which were basically
unchanged, when stated in the local currency). The ratio of operating expenses to total revenues
increased from 32.6 percentage points in the second quarter of 2011 to 33.7 percentage points in the
same period this year. When NorDiag is included, operating expenses amount to 39,251 thousand
euros.
Without NorDiag, other operating expenses decreased to 866 thousand euros, compared with 1,838
thousand euros in the second quarter of 2011, when the balance included additions to provisions for
specific risks and charges of a legal and tax nature that did not recur in 2012. However, when
NorDiag is included, other operating expenses amount to 1,719 thousand euros, due to the costs
incurred in connection with the recent acquisition and reorganization of the molecular business
operations.
In the second quarter of 2012, consolidated EBIT, net of NorDiag, decreased by 13.6 percentage
points compared with 2011, to a total of 38,777 thousand euros, equal to 33.9% of revenues.
EBITDA were also down, falling by 10.8 percentage points compared with 2011, to a total of 45,888
thousand euros, equal to 40.1% of revenues (44.5% in the second quarter of 2011). When NorDiag
is included, EBIT and EBITDA amount to 37,576 thousand euros and 44,738 thousand euros,
respectively. The difference compared with the amounts net of NorDiag is due mainly to
nonrecurring charges related to the acquisition of the molecular business operations and their
subsequent reorganization.
Financial income and expense
Net financial expense totaled 1,633 thousand euros in the second quarter of 2012, compared with
net financial expense of 875 thousand euros in the same period last year. The difference between
the two quarters is due mainly to the following factors:
- The measurement at fair value of forward contracts to sell U.S. dollars generated a loss of 623
thousand euros (loss of 157 thousand euros in the second quarter of 2011), recognized
purely for valuation purposes without any impact on cash flow for the period. Hedges that
expired and were settled in the second quarter of 2012 amounted to US$8.5 million, while
hedging transactions totaling US$16 million were outstanding, compared with the second
quarter of 2011 when closed-out transactions and outstanding transaction totaled US$7.8
million and US$31 million, respectively.
- Forward contracts that expired in the second quarter of 2012 generated a foreign exchange
translation loss of 180 thousand euros, which was recognized in the income statement (gain
of 445 thousand euros in the second quarter of 2011).
- The currency translation effect on other financial balances, which was negative by 90
thousand euros (negative by 235 thousand euros in the second quarter of 2011), related
mainly to financial balances of subsidiaries that use currencies different from the Group’s
reporting currency. In this case as well, translation difference are items recognized for
valuation purposes that have no impact on cash flows.
- Interest and other financial expense for the period included 599 thousand euros in factoring
transaction fees (619 thousand euros in the second quarter 2011).

26
Profit before taxes and net profit
Excluding the contribution of the new business operations, the second quarter of 2012 ended with a
result before taxes of 37,143 thousand euros, down from the 44,030 thousand euros reported in the
same period last year.
Income taxes for the second quarter of 2012 amounted to 12,989 thousand euros, compared with a
liability of 16,156 thousand euros in the same period in 2011. The tax rate for the quarter improved
to 35%, compared with a tax rate of 36.7% in the second quarter of 2011, that reflected the impact of
1,332 thousand euros in taxes withheld on dividends distributed by the U.S. subsidiary.
The second quarter of 2012 ended with a net profit of 24,154 thousand euros (27,874 thousand euros
in 2011), for a decrease of 13.3 % compared with the same period in 2011.

27
OPERATING PERFORMANCE IN THE FIRST HALF OF 2012
In the first half of 2012, the DiaSorin Group reported revenues of 220,686 thousand euros, down
6,447 thousand euros, or 2.8%, compared with the same period last year. On a constant scope of
consolidation basis, i.e., with the 2012 revenues stated without NorDiag sales (total of 480 thousand
euros), and at constant exchange rates, the decrease amounts to 13,097 thousand euros, or 5.8%. It is
worth mentioning that most of this reduction originated in the first quarter of 2012 and that revenues
were up significantly in the second quarter, improving by more than 8 percentage points, on a
constant scope of consolidation basis, compared with the first three months of the year.
As mentioned when commenting the results for the second quarter, the main reasons for the decrease
compared with the first half of 2011 was a decline in Vitamin D revenues that began after the
summer of 2011, particularly in North America, France and Australia. More specifically in United
States, increased price pressure caused by major competitors, who did not carry this diagnostic
specialty in their catalogs in 2011 is the primary factor accounting for the shortfall in revenues.
Please also note that in the first two quarters of 2011 revenues were boosted by nonrecurring effects
of different types that make it hard to develop a comparison of homogeneous data: i) the withdrawal
by a major competitor of its Vitamin D product from the European and Australian markets at the end
of 2010, which caused Group revenues to increase in the following to quarters; ii) a sharp increase in
Vitamin D volumes in the American market, which, after peaking in the summer of 2011, contracted
by more than 10% in the third quarter of 2011, settling at the current level; iii) the award of a
contract to supply ELISA technology products in Brazil that ended in the third quarter of 2011 and,
consequently, was absent in the first quarter of 2012. It is worth mentioning that the same contract
was again awarded to DiaSorin, with product deliveries resuming in the third quarter of 2012.
Lastly, a noteworthy development was a continuation of the outstanding performance, with growth
of more than 12 percentage points, of the CLIA technology product families, excluding Vitamin D
tests, which more than offset the impact of the physiological decline of the revenues from RIA and
ELISA technologies. Noteworthy developments included rising sales in the areas of Tumor Markers,
Infectiology, Prenatal Screening panel, Parvovirus and the new HIV and Viral Hepatitis line, due
largely to the launch of the new LIAISON XL automated analyzer, which enabled the Group to offer
to its customers a solution that was competitive with the products available from major players in
these market segments. In the first half of 2012, DiaSorin placed a total of 226 new LIAISON XL
analyzers, bringing the installed base to about 354 systems (including 41 in the customer validation
phase). An additional 87 LIAISON analyzers were also placed with customers, bringing to 313 the
total number of analyzers installed in the first half of 2012.
NorDiag sales, divided almost equally between systems and reagents, were made almost exclusively
to customers acquired together with the molecular business operations in May 2012. This was
because, due to the short time that elapsed since the acquisition, the Group has not yet been able to
reap the benefits that would be available by leveraging the potential of its sales force that, directly
and indirectly, covers all of the world’s main diagnostic markets.
The gross profit, net of NorDiag’s impact, totaled 152,999 thousand euros in the first half of 2012,
for a decrease of 6.9 percentage points, or 11,280 thousand euros, compared with the same period
last year (164,279 thousand euros). At June 30, 2012, the ratio of gross profit to revenues was equal
to 69.5%, or 2.8 percentage points less than in the same period in 2011, due mainly to the decrease
in revenues and the shift in sales mix discussed earlier in this Report. When the recently acquired
NorDiag business operations are included, the Group’s gross profit totals 153,281 thousand euros.
This amount is slightly higher than the figure at constant scope of consolidation, thanks to the
margins contributed by sales of molecular products.

28
Consolidated EBITDA, net of NorDiag, decreased to 90,036 thousand euros in the first half of 2012,
compared with 101,429 thousand euros in the first six months of 2011; at June 30, 2012, the ratio of
consolidated EBITDA to revenues was equal to 40.9 percentage points, compared with 44.7
percentage points in the same period last year. Consolidated EBIT amounted to 75,947 thousand
euros, compared with 88,369 thousand euros in the first half of 2011; at June 30, 2012, the ratio of
consolidated EBIT to revenues was equal to 34.5 percentage points, compared with 38.9 percentage
points last year. When the result of the NorDiag business operations is included, consolidated
EBITDA and consolidated EBIT amount to 88,886 thousand euros and 74,746 thousand euros,
respectively.
Factors affecting financial income and expense included a charge for negative fair value of 373
thousand euros (positive by 655 thousand euros in the first half of 2011), which was recognized
purely for valuation purposes without any impact on cash flow; a gain of 15 thousand euros on
contracts settled during the period (gain of 978 thousand euros on contracts that expired in the first
half of 2011); and an increase in factoring fees paid caused by a deterioration of the financing terms
applied to receivables assigned during the period (1,133 thousand euros in the first half of 2012
compared with 882 thousand euros in the first half of 2011).
As a result of the items discussed above, the cumulative net profit totaled 46,608 thousand euros,
down by 17.3 percentage points compared with the first half of 2011
The table that follows shows the consolidated income statement for the six month periods ended
June 30, 2012 and June 30, 2011:

29
CONSOLIDATED INCOME STATEMENT
First half
(in thousands of euros) 2011
2012
at const. scope
of consolidation
(*)
Change in scope of
consolidation
(NorDiag)
2012
Sales and service revenues 227,133 220,206 480 220,686
Cost of sales (62,854) (67,207) (198) (67,405)
Gross profit 164,279 152,999 282 153,281
72.3% 69.5% 58.8% 69.5%
Sales and marketing expenses (39,354) (40,537) (80) (40,617)
Research and development costs (10,714) (11,549) (208) (11,757)
General and administrative expenses (22,028) (23,967) (342) (24,309)
Total operating expenses (72,096) (76,053) (630) (76,683)
Other operating income (expense) (3,814) (999) (853) (1,852)
non-recurring amount - - (853) (853)
EBIT 88,369 75,947 (1,201) 74,746
38.9% 34.5% n.m. 33.9%
Net financial income (expense) 807 (1,646) 1 (1,645)
Profit before taxes 89,176 74,301 (1,200) 73,101
Income taxes (32,819) (27,693) 131 (27,562)
Net profit 56,357 46,608 (1,069) 45,539
EBITDA (1) 101,429 90,036 (1,150) 88,886
44.7% 40.9% n.m. 40.3%
(*) To provide a homogeneous comparison with the data for the first half of 2011, the data stated at constant scope of consolidation were
prepared excluding the amounts attributable to the NorDiag business operations (acquired on May 4, 2012).
(1) With regard to the income statement data provided above, please note that the Board of Directors defines EBITDA as the “result
from operations” before amortization of intangibles and depreciation of property, plant and equipment. EBITDA, which the Company
uses to monitor and assess the Group’s operating performance, are not recognized as an accounting tool in the IFRSs and, consequently,
should not be viewed as an alternative gauge to assess the Group’s operating performance. Because the composition of EBITDA is not
governed by the reference accounting principles, the computation criterion used by the Group could be different from the criterion used
by other operators and/or groups and, consequently, may not be comparable.

30
Net revenues
In the first half of 2012, net of the contribution provided by the recently acquired NorDiag business
operations, Group revenues totaled 220,206 thousand euros, down 3.0% compared with the same
period last year. Restated excluding the currency translation effect, revenues show a decrease of 5.8
percentage points, due mainly to fluctuations in the USD/EUR exchange rate, with the dollar
significantly increasing in value compared with the first half 2011. It is worth mentioning that most
of this decrease originated in the first quarter of 2012 and that revenues were up significantly in the
second quarter, improving by more than 8 percentage points, on a constant scope of consolidation
basis, compared with the first three months of the year.
The revenues generated by the recent NorDiag acquisition, completed in May 2012, amounted to
480 thousand euros, equally divided between sales of reagents and systems.
Breakdown of revenues by geographic region
The table below provides a breakdown by geographic region of destination of the consolidated
revenues of the DiaSorin Group in the first half of the year. In order to provide a more homogeneous
comparison, the revenues generated by Murex and NorDiag products are shown separately from the
geographic breakdown of DiaSorin’s traditional business activities.
Insofar as Murex is concerned, even though the acquisition occurred before the second quarter of
2011, the logistics flows that resulted from the need to use Abbott branches for distribution in some
areas in 2011 made it impossible to provide an accurate breakdown of last year’s revenues by
geographic region of destination. Consequently, the comments about sales and service revenue by
geographic region refer only to DiaSorin’s business activities.
(in thousands of euros) First half
2012 2011
% change at
current exchange
rates
% change at
constant exchange
rates
Europe and Africa 98,204 97,989 0.2% 0.0%
Central and South America 14,344 17,506 -18.1% -15.0%
Asia Pacific 23,474 21,061 11.5% 4.9%
North America 65,569 72,645 -9.7% -16.6%
Total without Murex 201,591 209,201 -3.6% -6.5%
Murex 18,615 17,932 3.8% 3.1%
Total with Murex 220,206 227,133 -3.0% -5.8%
Molecular (NorDiag) 480 -
Grand total 220,686 227,133 -2.8% -5.6%

31
Europe and Africa
Revenues booked in the Europe and Africa sales region totaled 98,204 thousand euros in the second
quarter of 2012, for a modest gain of 0.2% compared with the same period last year (97,989
thousand euros). This improvement is the net result of contrasting factors: i) a deterioration of the
performance in the French and Spanish markets for the reasons mentioned earlier in this Report,
including both the impact of macroeconomic conditions and, in the case of France, lower Vitamin D
sales; ii) excellent results in the markets where the Group operates through local distributors, with
growth of more than 30% thanks to a commercial agreements executed with a Turkish distributor;
and iii) an outstanding performance by the Group’s operations in the Dutch, English, Austrian and
Israeli markets, all of which enjoyed double-digit growth. Revenues were virtually flat in Italy
(down by less than 1 percentage point) and grew modestly in Germany (just shy of 2%). Also worth
mentioning are the positive results achieved with the product lines tied to the launch of the
LIAISON XL analyzer, particularly the new products in the HIV and Viral Hepatitis product lines,
and the commercial success of the new LIAISON XL automated analyzer.
North America
In the first half of 2012, the North America sales region reported revenues of 65,569 thousand euros,
down 9.7% compared with the same period last year. Net of the currency translation effect, revenues
show a decrease of 16.6 percentage points, due the significant appreciation of the U.S. dollar versus
the euro in 2012 (particularly in the second quarter). An outstanding performance by specialties in
the Infectiology and Prenatal Screening product families (gain of almost 35 percentage points) was
more than offset by a slowing of Vitamin D sales that started in the third quarter of 2011, as
mentioned in comments to earlier quarters. Two main factors account for this decrease: i) lower
sales prices and ii) a reduction in sales volumes, beginning in the third quarter of 2011, that caused
unit sales to settled at a level more than 10% below the peak achieved in the summer of 2011. More
specifically, the price reduction is attributable to the market entry of the Group’s main competitors,
who pursued extremely aggressive sales policies. As a result, starting in the third quarter of 2011,
DiaSorin was forced to adjust the prices charged to its customers in exchange for extending supply
contracts.
Europe and Africa48.7%
Central and South America
7.1%
Asia Pacific11.6%
North America 32.6%
1st half 2012 DiaSorin's businesses
Europe and Africa46.8%
Central and South America
8.4%
Asia Pacific10.1%
North America 34.7%
1st half 2011 DiaSorin's businesses

32
Central and South America
The Latin American sales region reported revenues of 14,344 thousand euros in the in the first half
of 2012, for a reduction of 18.1 percentage points compared with 17,506 thousand euros in the first
six months of 2011 (net of the Murex product line). With data restated net of the currency translation
effect, the revenue decrease is equal to 15 percentage points (devaluation of the Brazilian currency).
This change is mainly attributable to: i) the Brazilian subsidiary, which lost a major Vitamin D
customer and, in 2011, was awarded an important contract for the supply of ELISA products that
ended in the third quarter of 2011 (a new contract was awarded to the local subsidiary, with the
supply of these products expected to resume in the third quarter of 2012); and ii) in countries where
the Group does not have a direct presence, the performance of the network of Group distributors,
who, after reporting strong equipment sales in 2011, are now enjoying routine activity levels,
generating a steady and growing revenue stream from the sale of reagents. Also worth mentioning is
a positive performance by the Mexican subsidiary, which increased revenues by slightly more than 3
percentage points compared with the same period in 2011.
Asia Pacific
In the first half of 2012, the Asia Pacific sales region reported excellent sales results, with total
revenues increasing to 23,474 thousand euros, for a gain of 11.5 percentage points compared with the
same period last year (excluding Murex sales). At constant exchange rates, revenues show an increase
of 4.9 percentage points (due mainly to fluctuations in the value of the Australian and Chinese
currencies versus the euro).
The revenues gain is the net result of three factors, two positive and the third one negative: i) the
outstanding performance in the Chinese market, where revenues increased by almost 40 percentage
points (evenly distributed among all CLIA products sold in that country); ii) the excellent results
achieved in the markets served through Group distributors (+23.6%), due both to equipment sales
and the growth of all CLIA product families, Vitamin D products in particular (growth of almost 50
percentage points); and iii) a significant decrease in revenues generated in the Australian market
due to the loss of two important local customers (one was recovered in May 2012) and the
substantial reduction in Vitamin D prices granted to the Sonic Healthcare Group in exchange for an
exclusive contract until 2015 in some key markets of the Group (including the United States,
Germany and Australia).
Breakdown of revenues by technology
The table that follows shows the percentage of the Group’s consolidated revenues contributed by
each technology in the first half of 2012 and 2011. Due to the acquisition of the NorDiag business
operations, the contribution of a new technology, that of molecular diagnostics, which generated
revenues of 480 thousand euros (slightly less than half from equipment sales), is shown for the first
time
The data in the table reflect the steady physiological decline of the contribution provided by the RIA
and ELISA technologies (which are more dated and function on open systems). They also show that
the percentage of total revenues provided by CLIA products was unchanged in the first half of 2012
(up slightly, with data net of molecular sales), due both to the significant decrease in Vitamin D sales
mentioned above (which peaked in the first half of 2011 as a result of nonrecurring factors) and, more
importantly, to the high revenues generated by equipment sales (mainly LIAISON XL), which grew
by 17.1% in the first half of 2012, increasing their contribution to total revenues by almost 2
percentage points. It is worth mentioning that equipment sales will have the positive effect of boosting
reagent sales in future months.

33
% of revenues contributed First half 2012 First half 2011
RIA 3.8% 4.2%
ELISA 17.5% 19.1%
CLIA 67.3% 67.4%
MOLECULAR 0.2% -
Equipment sales and other revenues 11.2% 9.3%
Total 100.0% 100.0%
At June 30, 2012, a total of about 4,519 LIAISON automated analyzers (including 41 in the
validation phase) were installed at facilities operated by direct and indirect Group customer, for an
increase of 313 units compared with the installed base at December 31, 2011. The new LIAISON
XL automated analyzer continued to be extremely well received by the market, with 354 units
already installed after slightly more than nine months from its launch. It is worth mentioning that the
Group expects the growth rate of the installed base to slow over the coming months, due to the
greater productivity of the LIAISON XL system compared with the LIAISON system. Specifically,
thanks to innovative technological solutions, the new analyzer will deliver a productivity increase
ranging between 50% and 90%, which, in all likelihood, will enable i) new customers to use fewer
LIAISON XL analyzers compared with the number of LIAISON systems they would have needed to
meet the requirements of their laboratories; and ii) existing customers to install fewer LIAISON XL
analyzers compared with the number of LIAISON systems previously installed, when these reach
the end of their useful lives, with a beneficial impact on depreciation expense.
Operating performance
Insofar as operating results are concerned, net of NorDiag, the gross profit contracted from 164,279
thousand euros in the first half of 2011 to 152,999 thousand euros in the same period in 2012, for a
decrease of 6.9%, equal to 11,280 thousand euros. The ratio of gross profit to revenues went from
72.3% in the first six months of 2011 to 69.5% in 2012, due mainly to the reduction in revenues and
the shift in mix commented earlier in this Report. With data stated reflecting the effect of the recent
NorDiag acquisition, the gross profit amounts to 153,281 thousand euros, slightly more than the
total with data on a comparable scope of consolidation basis, reflecting the margins generated by
sales of molecular products. It is also worth mentioning that, net of the nonrecurring items
RIA3.8% ELISA
17.5%
CLIA67.3%
MOLECULAR0.2%
Equipment sales and other
revenues11.2%
1st half 2012 DiaSorin's businessesRIA
4.2% ELISA19.1%
CLIA67.4%
MOLECULAR0.0%
Equipment sales and
other revenues
9.3%
1st half 2011 DiaSorin's businesses

34
mentioned above, the profitability of the Group’s products continued to match the excellent results
achieved thus far.
Operating expenses, net of NorDiag, totaled 76,053 thousand euros in the first half of 2012, up
5.5%, or 3,957 thousand euros, compared with the same period last year. The ratio of operating
expenses to total revenues rose from 31.7 percentage points to 34.5 percentage points. It is worth
mentioning that this increase is due in part to a strengthening of the U.S. dollar, which magnified the
impact in euros of the costs incurred by the U.S. operations. When NorDiag is included, operating
expenses are slightly higher, rising to 76,683 thousand euros.
In the first half of 2012, research and development costs grew by 7.8%, or 835 thousand euros,
causing their ratio to revenues to increase from 4.7 percentage points to 5.2 percentage points,
reflecting the need to fund the Group’s growing commitment to the development of new product
lines in the molecular area and support the steady expansion of its menu of CLIA products.
Without NorDiag, other operating expenses decreased to 999 thousand euros, compared with 3,814
thousand euros in the first half of 2011, when the balance included additions to provisions for
specific risks and charges of a legal and tax nature totaling 1,855 thousand euros that did not recur in
2012. However, when NorDiag is included, other operating expenses amount to 1,852 thousand
euros, due to the costs incurred in connection with the recent acquisition and reorganization of the
molecular business operations.
As a net result of the items described above, EBIT, net of NorDiag, totaled 75,947 thousand euros in
the first half of 2012, for a decrease of 14.1% compared with the first six months of 2011; EBITDA
amounted to 90,036 thousand euros, down 11.2% compared with the first six months of 2011.
Financial income and expense
Without NorDiag, net financial expense amounted to 1,646 thousand euros in the first half of 2012,
as against net financial income of 807 thousand euros in the first six months of 2011.
The fair value of forward contracts to sell U.S. dollars was negative by 373 thousand euros in the
first half of 2012 (positive fair value of 655 thousand euros in the same period in 2011), while
contracts settled during the period generated a gain of 15 thousand euros (contract maturing in the
first half of 2011 generated a gain of 978 thousand euros).
In the first half of 2012, interest and other financial expense included 1,133 thousand euros in fees
on factoring transactions (882 thousand euros in the first six months of 2011). This increase reflects
a deterioration of the financing terms applied to receivables assigned during the period.
Profit before taxes and net profit
Net of NorDiag, the first half of 2012 ended with a profit before taxes of 74,301 thousand euros,
down compared with the 89,176 thousand euros reported in the same period last year.
Income taxes for the first half of 2012 totaled 27,693 thousand euros (32,819 thousand euros in the
same period in 2011), with the tax rate increasing from 36.8% in 2011 to 37.3% in the first half of
2012.

35
The consolidated net profit for the first half of 2012 totaled 46,608 thousand euros (56,357 thousand
euros in the same period last year), for a decrease of 17.3%.
When the contribution of NorDiag is included, the profit before taxes amounts to 73,101 thousand
euros and the income taxes for the period amount to 27,562 thousand euros, for a resulting net profit
of 45,539 thousand euros.
STATEMENT OF FINANCIAL POSITION OF THE GROUP AT JUNE 30, 2012
A condensed statement of financial position of the Group at June 30, 2012 is provided below:
(in thousands of euros) 6/30/12 12/31/11
Total intangible assets 126,435 121,933
Total property, plant and equipment 64,040 62,722
Other non-current assets 20,994 20,714
Net working capital 140,251 133,880
Other non-current liabilities (27,439) (29,718)
Net invested capital 324,281 309,531
Net financial position 52,000 41,647
Shareholders’ equity 376,281 351,178
With regard to the Group’s statement of financial position, the table below details the changes
resulting from the contribution of the business operations acquired from the NorDiag Group
(in thousands of euros) Total
Inventory 1,541
Manufacturing and distribution equipment 1,529
Goodwill (to be allocated) 4,530
Total 7,600
As mentioned earlier in this Report, the process of valuing the assets of the acquired group is
currently begin completed and, consequently, any excess consideration paid, compared with the
carrying amounts of the acquired assets, was provisionally added to “Goodwill,” as allowed by
IFRS 3 Revised.
Non-current assets increased from 205,369 thousand euros at December 31, 2011 to 211,469
thousand euros at June 30, 2012, reflecting the combined impact of a change in scope of
consolidation and the translation effect resulting from fluctuations in the exchange rate for the euro
versus the main currencies used by the Group.
A breakdown of net working capital is provided below:
(in thousands of euros) 6/30/12 12/31/11 Change
Trade receivables 115,798 116,617 (819)
Ending inventory 86,604 81,262 5,342
Trade payables (36,838) (38,382) 1,544
Other current assets/liabilities (1) (25,313) (25,617) 304
Net working capital 140,251 133,880 6,371 (1) Other current assets/liabilities is defined as the algebraic sum of receivables and payables other than financial and commercial items.

36
Working capital increased by 6,371 thousand euros in the first half of 2012, due mainly to a rise in
inventories and to a reduction in trade accounts payable.
With regard to trade receivables, which were in line with the amount reported at December 31,
2011, a noteworthy development was the collection of past-due positions owed by public entities in
the countries where the Group operates (Italy and Spain in particular). In addition, when the balance
at June 30, 2012 is restated net of the devaluation of the euro and without NorDiag, trade
receivables show a gain of about 1.3 million euros compared with the end of 2011.
The increase of 5,342 thousand euros in ending inventory, compared with December 31, 2011, is
due to the translation effect (388 thousand euros), the addition of the merchandise inventory of the
newly acquired business operations (1,580 thousand euros) and, for the balance, higher inventories
of strategic materials at the Group’s production facilities and significant additions of semifinished
goods related to products scheduled for launch in the coming months.
A significant development concerning operating liabilities was the decrease of trade payables, due to
the payment of the accumulated balance at the end of 2011, consisting mainly of royalties payables
owed under contracts signed by the Group’s manufacturing companies and amounts owed under some
contracts with annual payments terms, generally due after the close of the reporting year.
At June 30, 2012, the net consolidated financial position was positive by 52,000 thousand euros for
an increase of 10,353 thousand euros compared with December 31, 2011. The cash flow generated
from operating activities in the first half of 2012, before the payment of taxes and financial and
nonrecurring outlays (dividends, loan repayments and NorDiag) totaled 68,497 thousand euros
(69,875 thousand euros in the same period in 2011). A more detailed description of the cash flow
for the period is provided on the pages the follow.
A breakdown of the Group’s net financial position is provided below:
(in thousands of euros) 6/30/12 12/31/11
Cash and cash equivalents 69,843 64,145
Liquid assets (a) 69,843 64,145
Other current financial assets (b) - -
Current bank debt (8,349) (8,352)
Other current financial liabilities (593) (1,345)
Current indebtedness (c) (8,942) (9,697)
Current net financial position (d)=(a)+(b)+(c) 60,901 54,448
Non-current bank debt (8,848) (12,741)
Other non-current financial liabilities (53) (60)
Non-current indebtedness (e) (8,901) (12,801)
Net financial position (f)=(d)+(e) 52,000 41,647
Shareholders’ equity, which totaled 376,281 thousand euros at June 30, 2012 (351,178 thousand
euros at December 31, 2011), includes treasury shares valued at 44,882 thousand euros.
The reserve for treasury shares, which was established pursuant to law (Article 2357 of the Italian
Civil Code), was recognized following purchases of treasury shares executed in 2011.

37
ANALYSIS OF CONSOLIDATED CASH FLOWS
A schedule showing a condensed consolidated statement of cash flows, followed by a review of the
main statement items and of the changes that occurred compared with the corresponding period in
2011, is provided below:
STATEMENT OF CASH FLOWS
(in thousands of euros) 1st half
2012
1st half
2011
2nd quarter
2012
2nd quarter
2011
Cash and cash equivalents at beginning of period 64,145 62,392 80,632 57,950
Net cash from operating activities 54,918 49,463 32,618 21,828
Cash used for financing activities (28,322) (54,523) (28,747) (26,671)
Cash used for investing activities (13,298) (11,878) (7,060) (7,653)
Acquisitions of subsidiaries and business operations (7,600) - (7,600) -
Net change in cash and cash equivalents 5,698 (16,938) (10,789) (12,496)
Cash and cash equivalents at end of period 69,843 45,454 69,843 45,454
The cash flow from operating activities increased from 49,463 thousand euros in the first half of
2011 to 54,918 thousand euros in 2012. While the income stream (net profit plus depreciation and
amortization, additions to provisions and other non-cash items) was lower than in 2011, this shortfall
was offset by working capital dynamics that were more favorable than the previous year, due in
particular to the abovementioned reduction in trade receivables. Tax payments totaled 25,765
thousand euros (31,180 thousand euros in the first half of 2011), consisting mainly of income taxes
owed by the Group’s Parent Company and subsidiaries in the United States, France and South
Africa.
The cash used for financing activities totaled 28,322 thousand euros. It was used mainly for a
dividend distribution of 24,971 thousand euros in May 2012 (21,979 thousand euros in 2011) and
repayments of financing facilities amounting to 4,416 thousand euros. In the first half of 2011, the
cash used for financing activities amounted to 54,523 thousand euros, including 25,114 thousand
euros for purchases of treasury shares.
Net cash used in investing activities totaled 13,298 thousand euros, up from 11,878 thousand euros
in the first half of 2011: capital expenditures for medical equipment amounted to 9,442 thousand
euros, up from 7,589 thousand euros in the first six months of 2011, reflecting the impact of the
launch of the new LIAISON XL analyzer. In addition, development costs of 1,650 thousand euros
were capitalized in the first half of 2012 (445 thousand euros in the same period in 2011) mainly in
connection with investments in molecular diagnostics.
A noteworthy development was the acquisition of the NorDiag business operations, which required
an expenditure of 7,600 thousand euros.
Available liquid assets held by the Group increased by 5,698 thousand euros in the first half of 2012,
as against a reduction of 16,938 thousand euros in the same period in 2011.
At June 30, 2012, available liquid assets held by the Group totaled 69,843 thousand euros, up from
64,145 thousand euros at the end of 2011.

38
OTHER INFORMATION
The Group had 1,569 employees at June 30, 2012 (1,541 employees at December 31, 2011).
39
TRANSACTIONS WITH RELATED PARTIES
In the normal course of business, DiaSorin S.p.A. engages on a regular basis in commercial and
financial transactions with its subsidiaries, which are also Group companies. These transactions,
which are part of the Group’s regular operations and are executed on standard market terms, consist
of the supply of goods and services, including administrative, information technology, personnel
management, technical support and consulting services, which produce receivables and payables at
the end of the year, and financing and cash management transactions, which produce income and
expenses.
These transactions are eliminated in the consolidation process and, consequently, are not discussed
in this section of this Report.
The Group awards additional benefits to several eligible employees of DiaSorin S.p.A. and other
Group companies through a stock option plan. The costs incurred in connection with this plan and
recognized in profit or loss totaled 864 thousand euros in the first six months of 2012 (678 thousand
euros in 2011).
The compensation payable to senior managers and eligible employees (key management) is
consistent with standard market terms for compensation offered to employees with a similar status.

40
SIGNIFICANT EVENTS OCCURRING AFTER JUNE 30, 2012 AND BUSINESS OUTLOOK
In July 2012, the Group established of a joint venture with a local partner, Trivitron Healthcare, an
Indian company focused on production, innovation, distribution and aftersale support, with a broad
range of products for in vitro diagnostics (IVD).
The Trivitron Group is one of India’s top three groups in the medical device sector, with a vast
experience in the IVD market, acquired through a series of long-term collaborative relationship with
multinational corporations.
Pursuant to the agreement, the DiaSorin Group and Trivitron established DiaSorin Trivitron
Helathcare Private Limited, a limited liability company based in Chennai, in which the partners own
interestes of 51% and 49%, respectively, that will operate directly in the Indian diagnostic market.
The industrial plan of the newly established company, financed in full by DiaSorin and Trivitron,
will enable the DiaSorin Group to access directly the Indian IVD market, valued at about 400
million euros, with an annual growth rate of 15%.
The product line offered will intially focus on the Vitamin D market and will later be expanded to
include all LIAISON XL, Murex and molecular diagnistic products, thereby strengthening the
current and future presence of the DiaSorin Group in India, the second fastest growing diagnostic
market in the world after China.
In view of the Group’s operating performance and taking into account the possible evolution of the
global macroeconomic scenario and the diagnostics sector in which the Group operates,
management confirms the guidance provided in the interim report on operations for the first quarter
of 2012, believing that 2012 revenues will be in line with or slightly higher than those reported in
2011 and that the EBITDA margin will be in line with or slightly below the level achieved in 2011.
The Company expects to place a total of 500 to 600 new LIAISON and LIAISON XL system in
2012.

41
CONDENSED SEMIANNUAL CONSOLIDATED
FINANCIAL STATEMENTS AT JUNE 30, 2012

42
CONSOLIDATED INCOME STATEMENT
(in thousands of euros) First half
Notes 2012 2011
Net revenues (1) 220,686 227,133
Cost of sales (2) (67,405) (62,854)
Gross profit
153,281 164,279
Sales and marketing expenses (3) (40,617) (39,354)
Research and development costs (4) (11,757) (10,714)
General and administrative expenses (5) (24,309) (22,028)
Other operating income (expense) (6) (1,852) (3,814)
nonrecurring amount
(853) -
EBIT
74,746 88,369
Net financial income (expense) (7) (1,645) 807
Profit before taxes
73,101 89,176
Taxes (8) (27,562) (32,819)
Net profit for the period
45,539 56,357
Earnings per share (basic) (9) 0.84 1.02
Earnings per share (diluted) (9) 0.84 1.02

43
CONSOLIDATED STATEMENT OF FINANCIAL POSITION
(in thousands of euros) Notes 6/30/12 12/31/11
ASSETS
Non-current assets
Property, plant and equipment (10) 64,040 62,722
Goodwill (11) 69,775 65,083
Other intangibles (11) 56,660 56,850
Equity investments (12) 27 27
Deferred-tax assets (13) 20,243 20,119
Other non-current assets (14) 724 568
Total non-current assets
211,469 205,369
Current assets
Inventories (15) 86,604 81,262
Trade receivables (16) 115,798 116,617
Other current assets (17) 8,907 6,808
Cash and cash equivalents (18) 69,843 64,145
Total current assets
281,152 268,832
TOTAL ASSETS 492,621 474,201

44
CONSOLIDATED STATEMENT OF FINANCIAL POSITION (continued)
(in thousands of euros) Notes 6/30/12 12/31/11
LIABILITIES AND SHAREHOLDERS’ EQUITY
Shareholders’ equity
Share capital (19) 55,855 55,698
Additional paid-in capital (19) 15,803 13,744
Statutory reserve (19) 11,168 8,016
Other reserves and retained earnings (19) 292,798 218,995
Treasury stock (19) (44,882) (44,882)
Net profit for the period
45,539 99,607
Total shareholders’ equity 376,281 351,178
Non-current liabilities
Long-term borrowings (20) 8,901 12,801
Provisions for employee severance indemnities and other employee benefits (21) 21,141 20,948
Deferred-tax liabilities (13) 2,938 2,564
Other non-current liabilities (22) 3,360 6,206
Total non-current liabilities 36,340 42,519
Current liabilities
Trade payables (23) 36,838 38,382
Other current liabilities (24) 25,427 22,314
Taxes payable (25) 8,793 10,111
Current portion of long-term debt (20) 8,426 8,552
Other financial liabilities (20) 516 1,145
Total current liabilities 80,000 80,504
Total liabilities 116,340 123,023
TOTAL LIABILITIES AND SHAREHOLDERS’ EQUITY 492,621 474,201

45
CONSOLIDATED STATEMENT OF CASH FLOWS
(in thousands of euros) First half
2012
First half
2011
Cash flow from operating activities
Net profit for the period 45,539 56,357
Adjustments for:
- Income taxes 27,562 32,819
- Depreciation and amortization 14,140 13,060
- Financial expense/(income ) 1,645 (807)
- Additions to/(Utilizations of) provisions for risks (1,283) 2,044
- (Gains)/Losses on sales of non-current assets 63 68
- Additions to/(Reversals of) provisions for employee severance indemnities
and other employee benefits 288 223
- Changes in shareholders’ equity reserves:
- Stock option reserve 864 678
- Cumulative translation adjustment from operating activities 941 1,184
- Change in other non-current assets/liabilities (2,998) (576)
Cash flow from operating activities before changes in working capital 86,761 105,050
(Increase)/Decrease in receivables included in working capital 1,045 (11,674)
(Increase)/Decrease in inventories (2,823) (7,674)
Increase/(Decrease) in trade payables (1,712) 726
(Increase)/Decrease in other current items (1,476) (4,675)
Cash from operating activities 81,795 81,753
Income taxes paid (25,765) (31,180)
Interest paid (1,112) (1,110)
Net cash from operating activities 54,918 49,463
Investments in intangibles (2,169) (847)
Investments in property, plant and equipment (12,419) (11,895)
Retirements of property, plant and equipment 1,290 864
Cash used in regular investing activities (13,298) (11,878)
Acquisitions of subsidiaries and business operations (*) (7,600) -
Cash used in investing activities (20,898) (11,878)
Loan repayments (4,416) (3,965)
(Repayment of)/Proceeds from other financial obligations (132) (305)
Increase in share capital and additional paid-in capital/Dividend distribution (22,755) (21,914)
(Purchases)/Sales of treasury stock - (25,114)
Foreign exchange translation effect (1,019) (3,225)
Cash used in financing activities (28,322) (54,523)
Net change in cash and cash equivalents 5,698 (16,938)
CASH AND CASH EQUIVALENTS AT BEGINNING OF PERIOD 64,145 62,392
CASH AND CASH EQUIVALENTS AT END OF PERIOD 69,843 45,454
(*) Please see a special section of the report on operations for additional information about the acquisition.

46
STATEMENT OF CHANGES IN CONSOLIDATED SHAREHOLDERS’ EQUITY
(in thousands of euros) Share
capital
Additional paid-in
capital
Statutory
reserve
Cumula-
tive transla-
tion
reserve
Stock option
reserve
Reserve
for
treasury stock
Retained
earnings (Accumu-
lated
deficit)
Treasury
stock
Net
profit
for the
period
Group
interest
in share-
holders’ equity
Shareholders’ equity at 12/31/10 55,693 13,684 4,519 7,192 884 - 143,546 - 90,418 315,936
Appropriation of previous year’s profit 3,497 86,921 (90,418
) -
Dividend distribution (21,979) (21,979)
Capital increase 5 60 65
Stock options 678 678
Translation adjustment (8,549) (8,549)
Establishment of reserve for treasury stock 25,114 (25,114) -
Purchases of treasury stock (25,114) (25,114)
Net investment hedge gains/(losses),
net of tax effect 927 927
Net profit for the period 56,357 56,357
Shareholders’ equity at 6/30/11 55,698 13,744 8,016 (430) 1,562 25,114 183,374 (25,114) 56,357 318,321
Shareholders’ equity at 12/31/11 55,698 13,744 8,016 8,155 2,337 44,882 163,621 (44,882) 99,607 351,178
Appropriation of previous year’s profit 3,152 96,455 (99,607
) -
Dividend distribution (24,971) (24,971)
Capital increase 157 2,059 2,216
Stock options
324 540 864
Translation adjustment 1,217 1,217
Net investment hedge gains/(losses),
net of tax effect 238 238
Net profit for the period 45,539 45,539
Shareholders’ equity at 6/30/12 55,855 15,803 11,168 9,610 2,661 44,882 235,645 (44,882) 45,539 376,281
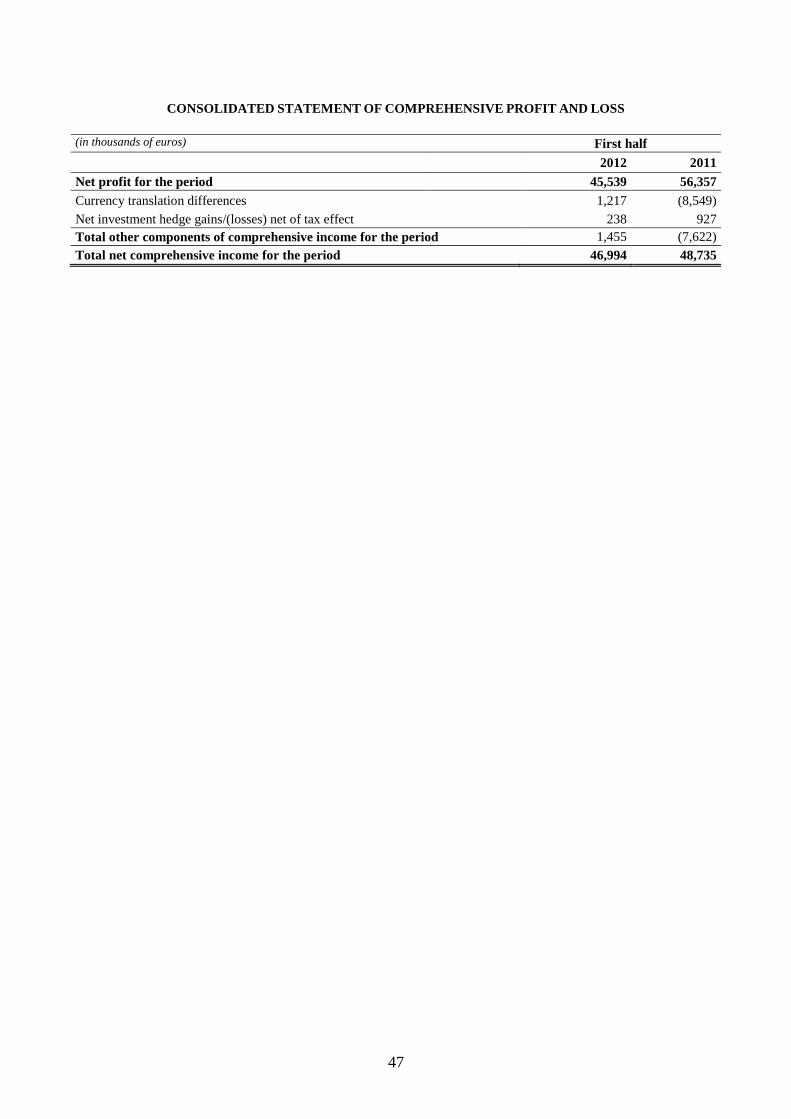
47
CONSOLIDATED STATEMENT OF COMPREHENSIVE PROFIT AND LOSS (in thousands of euros) First half
2012 2011
Net profit for the period 45,539 56,357
Currency translation differences 1,217 (8,549)
Net investment hedge gains/(losses) net of tax effect 238 927
Total other components of comprehensive income for the period 1,455 (7,622)
Total net comprehensive income for the period 46,994 48,735
48
NOTES TO THE CONDENSED SEMIANNUAL CONSOLIDATED FINANCIAL STATEMENTS AT JUNE 30,
2012 AND JUNE 30, 2011
GENERAL INFORMATION AND SCOPE OF CONSOLIDATION
General information
The DiaSorin Group specializes in the development, manufacture and distribution of products in the
immunochemistry and infectious immunology product groups. These product classes can also be
grouped into a single family called immunodiagnostics. DiaSorin S.p.A., the Group’s Parent
Company, has its headquarters on Via Crescentino (no building number), in Saluggia (VC) 13040.
Principles for the preparation of the condensed semiannual consolidated financial statements
These condensed semiannual consolidated financial statement were prepared in compliance with the
International Financial Reporting Standards (“IFRSs”), as issued by the International Accounting
Standards Board (“IASB”) and adopted by the European Union. The abbreviation IFRSs also
includes the International Accounting Standards (“IASs”) that are still in effect and all of the
interpretations of the International Financial Reporting Interpretations Committee (“IFRIC”).
This Semiannual Report was prepared in accordance with the requirements of the relevant
international accounting standard (IAS 34 – Interim Financial Reporting).
These notes provide information in summary form, in order to avoid duplicating information
published previously, as required by IAS 34. Specifically, these notes discuss only those components
of the income statement and statement of financial position the composition or change in amount of
which require disclosure (due to the amount involved or the type of transaction or because an unusual
transaction is involved) in order to understand the Group’s operating performance, cash flow and
financial position.
Consequently, these condensed semiannual consolidated financial statements do not provide all of
the disclosures required in the annual financial statements and should be read in conjunction with
the annual financial statements prepared for the year ended December 31, 2011.
When preparing interim financial statements, management is required to develop estimates and
assumptions that affect the amounts shown for revenues, expenses, assets and liabilities in the
financial statements and the disclosures provided with regard to contingent assets and liabilities on
the date of the interim financial statements. If such estimates and assumptions, which are based on
management’s best projections, should differ from actual events, they will be modified
appropriately when the relevant events produce the abovementioned differences.
As a rule, certain valuation processes, particularly the more complex processes such as determining
whether the value of non-current assets has been impaired, are carried out fully only in connection
with the preparation of the annual financial statements, when all the necessary information is
available, except when there are impairment indicators that require an immediate assessment of any
impairment losses that may have occurred.

49
The process of preparing the condensed semiannual consolidated financial statements included
developing the actuarial valuation required to compute the provisions for employee benefits and
value the stock option plan.
The Group engages in activities that, taken as a whole, are not subject to significant seasonal or
cyclical changes in revenue generation during the year.
The income tax liability is recognized by each company included in the scope of consolidation
using the best estimate of the weighted average tax rate projected for the entire year.
In this Consolidated Semiannual Report, all amounts are in thousands of euros unless otherwise
stated.
The accounting principles applied to prepare this Consolidated Semiannual Report are consistent
with those used for the consolidated annual financial statements at December 31, 2011, since it has
been determined that the amendments and interpretations published by the IASB that were
applicable as of January 1, 2012 did not produce any material changes in the accounting principles
adopted by the Group the previous year.
It is worth mentioning that, on October 7, 2010, the IASB published amendments to IFRS 7 –
Financial Instruments: Disclosures. These amendments were issued with the aim of improving the
understanding of transactions involving the transfer of financial assets (derecognition), including
the understanding of the potential effects of any residual risk to which the company transferring the
assets may be exposed. These amendment also require additional disclosures when transactions
involving a disproportionately large amount are executed near the end of the reporting period. The
adoption of this amendment had no impact on the disclosures provided in these financial statements.
Financial statement presentation formats
The financial statements are presented in accordance with the following formats:
- in the income statement, costs are broken down by function. This income statement format,
also known as a “cost of sales” income statement, is more representative of the Group’s
business than a presentation with expenses broken down by nature because it is consistent
with internal reporting and business management methods and with international practice in
the diagnostic industry;
- in the statement of financial position, current and non-current assets and current and non-
current liabilities are shown separately;
- the statement of cash flows is presented in accordance with the indirect method.
Scope of consolidation
The condensed semiannual consolidated financial statements include the financial statements of
DiaSorin S.p.A., the Group’s Parent Company, and those of its subsidiaries.
Subsidiaries are companies over which the Group is able to exercise control, i.e., it has the power to
determine their operating and financial policies, so as to obtain benefits from the results of their
operations.

50
Subsidiaries are consolidated line by line from the date the Group obtains control until the moment
when control ceases to exist. Dormant subsidiaries and subsidiaries that generate an insignificant
volume of business are not consolidated. Their impact on the Group’s total assets and liabilities,
cash flow and bottom-line result is not material.
Minority interests and the interest in the profit or loss for the year of consolidated subsidiaries
attributable to minority shareholders do not represent material amounts: at June 30, 2012, minority
interest in net profit and shareholders’ equity amounted to 185 thousand euros and 379 thousand
euros, respectively.
A list of the subsidiaries included in the scope of consolidation, complete with information about
head office locations and the percentage interest held by the Group, is provided in Annex I.
Please note that the scope of consolidation changed compared with the first half of 2011, due to the
inclusion of the NorDiag business operations, which were acquired on May 4, 2012.
The Group consolidated the amounts for the first month of activity of the acquired business, starting
on the transaction date.
Lastly, please note that the process of valuing the assets of the acquired group is currently begin
completed and, consequently, any excess consideration paid, compared with the carrying amounts
of the acquired assets, was provisionally added to “Goodwill,” as allowed by IFRS 3 Revised. See a
special section of the Report on operations for additional information.

51
ANALYSIS OF FINANCIAL RISKS
The financial risks to which the Group is exposed include market risk and, to a lesser extent, credit
risk and liquidity risk.
As required by IAS 39, assets and liabilities of a material amount are listed below:
6/30/12 12/31/11
(in thousands of euros) Notes Carrying
amount
Receiv-
ables
Hedging
instru-
ments
Held for
trading`
Carrying
amount
Receiv-
ables
Hedging
instru-
ments
Held for
trading
Trade receivables (16) 115,798 115,798 - - 116,617 116,617 - -
Other current financial assets (20) - - - - - - - -
Cash and cash equivalents (18) 69,843 69,843 - - 64,145 64,145 - -
Total current financial assets
185,641 185,641 - - 180,762 180,762 - -
Total financial assets 185,641 185,641 - - 180,762 180,762 - -
6/30/12 12/31/11
(in thousands of euros) Notes Carrying
amount
Liabilities
at amor-
tized cost
Hedging
instru-
ments
Held for
trading`
Carrying
amount
Liabilities
at amor-
tized cost
Hedging
instru-
ments
Held for
trading
Long-term borrowings (20) 8,901 8,901 6,785 - 12,801 12,801 9,901 -
Total non-current financial liabilities
8,901 8,901 6,785 - 12,801 12,801 9,901 -
Trade payables (23) 36,838 36,838 - - 38,382 38,382
-
Current portion of long-term debt (20) 8,426 8,426 6,785 - 8,552 8,552 6,601 -
Other current financial liabilities (20) 516 - - 516 1,145 - - 1,145
Total current financial liabilities
45,780 45,264 6,785 516 48,079 46,934 6,601 1,145
Total financial liabilities 54,681 54,165 13,570 516 60,880 59,735 16,502 1,145
Risks related to fluctuations in foreign exchange and interest rates
Because the Group has not established hedges specifically for this purpose, it is exposed to the
interest rate risk in connection with variable-rate financial liabilities. At June 30, 2012, reference
borrowings totaled 17,197 thousand euros. Assuming an increase of 2 percentage points in interest
rates on medium- and long-term borrowings, the resulting impact on the financial expense
recognized in the income statement would be about 0.4 million euros, while a decrease of 2
percentage points in interest rates would produce savings of 0.2 million euros. The same analysis
was performed for all of the receivables assigned without recourse to the factoring company, which
totaled 17,992 thousand euros in the first half of 2012. This computation was made because the
factoring company charges a variable fee tied in part to the Euribor. An increase or decrease of 2
percentage points in the Euribor would result in a change in financial expense of 0.4 million euros.
The Group is exposed to the market risk caused by fluctuations in foreign exchange rates because it
operates at the international level and executes transactions involving different foreign exchange
and interest rates. The Group’s exposure to foreign exchange risks is due to the geographic
distribution of its production facilities and of the markets where it sells its products and to the use of
external sources to secure financing in foreign currencies.

52
Starting in the first quarter of 2010, the Company applies the guidelines of IAS 39 to account for a
hedge of a net investment. Specifically, a financing facility provided to the Group’s Parent
Company in U.S. dollars has been designated as an instrument hedging net assets denominated in
U.S. dollars, as allowed by IAS 39. The effectiveness of this hedge is verified every three months
using the dollar offset method. The portion that this test shows to be effective is reflected in
shareholders’ equity under the translation reserve. This item will continue to be part of
shareholders’ equity until the Company decides to dispose of the U.S. operations.
However, in terms of the financial expense recognized in the income statement upon the translation
of other debt denominated in foreign currencies, the impact on the income statement of an increase
or decrease of 5 percentage points in the euro/U.S. dollar exchange rate would be negative by about
0.7 million euros should the dollar strengthen or positive by 0.6 million euros should the dollar
weaken. Moreover, the impact on the income statement of an increase or decrease of 5 percentage
points in the euro/British pound exchange rate would amount to about 0.7 million euros.
Some Group subsidiaries are located in countries that are not members of the European Monetary
Union.
Since the Group’s reporting currency is the euro, the income statements of these companies are
translated into euros at the average exchange rate for the period. Consequently, even if revenues and
margins were to remain equal when stated in the local currency, fluctuations in exchange rates
could have an impact on the euro amount of revenues, expenses and operating results due to the
translation into the consolidation currency. An analysis of the changes affecting the main currencies
used by the Group has shown that a 5% change in the exchange rates of all of the currencies used by
the Group would have an impact on the income statement of about 2.3 million euros.
The euro amount attributed to assets and liabilities of consolidated companies that use reporting
currencies different from the euro could vary as a result of changes in exchange rates. As required
by the accounting principles adopted by DiaSorin, these changes are recognized directly in equity
by posting them to the currency translation reserve. A 5% change in all foreign exchange rates
would have an impact of about 5 million euros on the currency translation reserve.
The Group monitors any significant exposures to the foreign exchange translation risk. However, no
hedges had been established against such exposures as of the date of the financial statements. This
is because the potential impact of the foreign exchange translation risk on the Group’s equity is not
significant.
Credit risk
The Group’s receivables present a low level of risk since most of these receivables are owed by
public institutions, for which the risk of non-collection is negligible.
At June 30, 2012, past-due trade receivables were equal to about 22% of revenues. These
receivables were held mainly by the Group’s Parent Company and the Spanish and Brazilian
subsidiaries, which sell a very high percentage of their products to the local national health services.
About 60% of these receivables was more than 120 days past due. These past-due receivables are
covered by an allowance for doubtful accounts amounting to 8,186 thousand euros. In addition, in
order to bridge the gap between contractual payment terms and actual collection dates, the Group
assigns its receivables to factors without recourse.

53
Liquidity risk
A prudent cash management strategy includes maintaining sufficient cash or readily available
assets, as well as credit lines, to meet immediate liquidity needs. Cash flows, funding requirements
and liquidity levels are monitored and managed centrally to ensure promptly and effectively the
availability of financial resources and invest appropriately any excess liquidity.
Management believes that the funds and credit lines currently available, when combined with the
resources generated by operating and financing activities, will enable the Group to meet the
obligations resulting from its capital investment programs, working capital requirements and the
need to repay its indebtedness upon maturity.
Commercial Risk
The DiaSorin Group is subject to the commercial risk, particularly with regard to the Vitamin D
segment, caused by increased competition and the market entry, both in the United States and in
Europe, of such aggressive competitors as Siemens, Abbot and Roche. The strategy of protecting
major customers by extending long-term contracts, the acknowledged extremely high quality of
DiaSorin tests, the ability of doubling the hourly rate of determinations offered by the LIAISON
XL, and growing demand in countries where dosage is still not very frequent ensure that DiaSorin
will continue to play a leading role in the future of this market. In addition, a positive trend in sales
of all other LIAISON specialties offset in part weakness in other segments, including that of
Vitamin D.
Other information
Information about significant events occurring after June 30, 2012, the Group’s business outlook
and its transactions with related parties is provided in separate sections of this Semiannual Report.
The table below provides a comparison of the average and end-of-period exchange rates for the first half
of 2012 and 2011 (source: Italian Foreign Exchange Bureau):
Currency Average At
` 1st half 2012 1st half 2011 2nd quarter 2012 2nd quarter 2011 6/30/12 6/30/11
U.S. dollar 1.2965 1.4032 1.2814 1.4391 1.2590 1.4453
Brazilian real 2.4144 2.2879 2.5167 2.2960 2.5788 2.2601
British pound 0.8225 0.8682 0.8100 0.8827 0.8068 0.9026
Swedish kronor 8.8824 8.9391 8.9133 9.0153 8.7728 9.1739
Czech koruna 25.1742 24.3495 25.2693 24.3237 25.6400 24.3450
Canadian dollar 1.3040 1.3706 1.2949 1.3932 1.2871 1.3951
Mexican peso 17.1867 16.6865 17.3620 16.8752 16.8755 16.9765
Israeli shekel 4.9231 4.9366 4.9021 4.9490 4.9453 4.9439
Chinese yuan 8.1901 9.1755 8.1072 9.3509 8.0011 9.3416
Australian dollar 1.2559 1.3582 1.2699 1.3550 1.2339 1.3485
South African rand 10.2942 9.6856 10.4214 9.7852 10.3669 9.8569

54
OPERATING SEGMENTS
As required by IFRS 8, the Company designated the geographic regions where it operates as its
operating segments.
The Group’s organization and internal management structure and its reporting system identify the
following segments: Italy and UK Branch, Europe (Germany, France, Belgium and the Netherlands,
Spain and Portugal, Ireland, Austria, Great Britain, Scandinavia, Czech Republic), North America
(United States and Canada) and Rest of the World (Brazil, Mexico, Israel, China, Australia and
South Africa).
The Group is characterized by a structure of its commercial organization based geographic regions,
which was developed to address the requirements created by geographic expansion and strategic
initiatives, such as the launch of the LIAISON XL. This new organization, which was conceived to
reflect the destinations of the Group’s sales, is based on the following four regions: Europe and
Africa, North America, Central and South America, and Asia Pacific (including China).
As a result, the financial data of the DiaSorin Group that are being disclosed to the financial
markets and the investing public now include revenue information that reflects the regional
organization mentioned above.
The schedules that follow show the Group’s operating and financial data broken down by
geographic region. Information about revenues based on customer locations is provided in the
Report on operations, in the comments to the schedule showing a breakdown of net revenues by
geographic region.
No unallocated common costs are shown in the abovementioned schedules because the operations
in each country (hence, each segment) are equipped with comprehensive independent organizations
(sales, technical support and accounting) fully capable of exercising their functions. Moreover, the
Italy segment invoices each quarter to the other segments the costs that are incurred centrally
(mainly insurance costs and costs related to the Group’s IT systems and management personnel).
Eliminations refer mainly to inter-segment margins that are eliminated upon consolidation.
Specifically, the elimination of the margin earned by the Italy segment on the sale of equipment to
other segments is shown both at the result level and with regard to capital expenditures. The
margins earned on products sold by manufacturing facilities to sales branches that have not yet been
sold to customers are eliminated only at the result level.
Segment assets include all items related to operations (non-current assets, receivables and
inventories), but do not include tax related items (deferred-tax assets) and financial assets, which
are shown at the Group level.
The same approach was used for segment liabilities, which include items related to operations
(mainly trade payables and amounts owed to employees), but do not include financial and tax
liabilities and shareholders’ equity items, which are shown at the Group level.
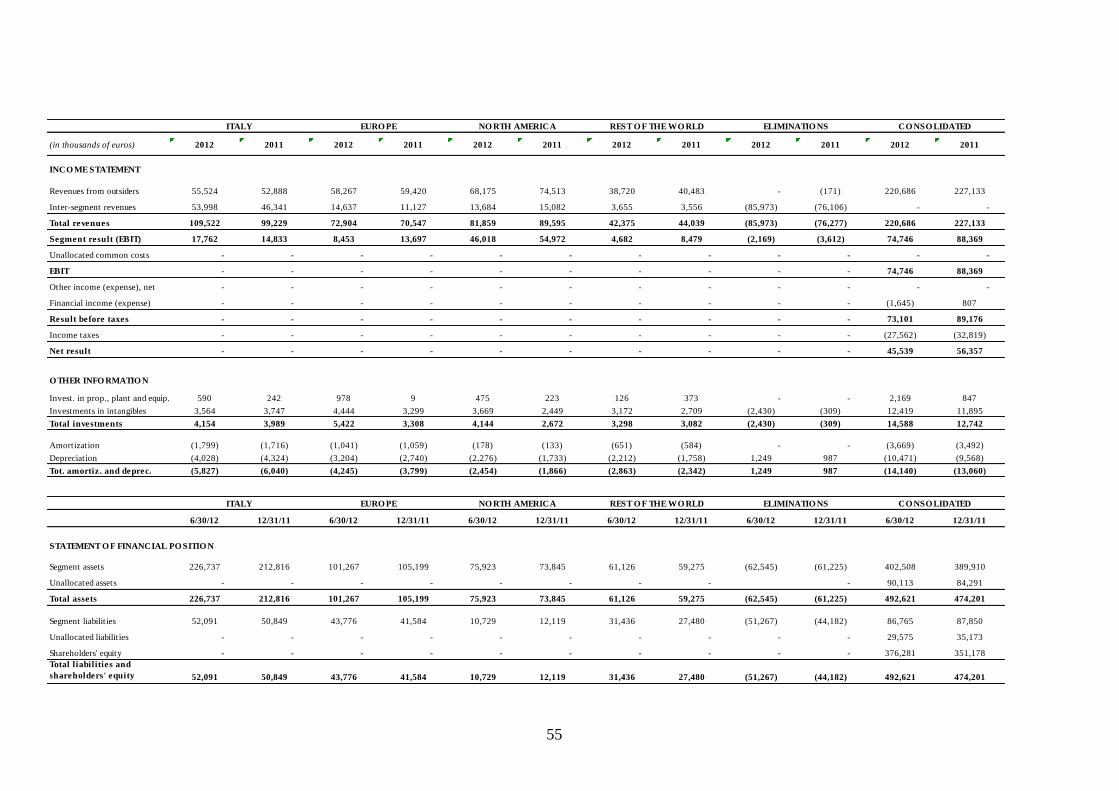
55
(in thousands of euros) 2012 2011 2012 2011 2012 2011 2012 2011 2012 2011 2012 2011
INCO ME STATEMENT
Revenues from outsiders 55,524 52,888 58,267 59,420 68,175 74,513 38,720 40,483 - (171) 220,686 227,133
Inter-segment revenues 53,998 46,341 14,637 11,127 13,684 15,082 3,655 3,556 (85,973) (76,106) - -
Total revenues 109,522 99,229 72,904 70,547 81,859 89,595 42,375 44,039 (85,973) (76,277) 220,686 227,133
Segment result (EBIT) 17,762 14,833 8,453 13,697 46,018 54,972 4,682 8,479 (2,169) (3,612) 74,746 88,369
Unallocated common costs - - - - - - - - - - - -
EBIT - - - - - - - - - - 74,746 88,369
Other income (expense), net - - - - - - - - - - - -
Financial income (expense) - - - - - - - - - - (1,645) 807
Result before taxes - - - - - - - - - - 73,101 89,176
Income taxes - - - - - - - - - - (27,562) (32,819)
Net result - - - - - - - - - - 45,539 56,357
O THER INFO RMATIO N
Invest. in prop., plant and equip. 590 242 978 9 475 223 126 373 - - 2,169 847
Investments in intangibles 3,564 3,747 4,444 3,299 3,669 2,449 3,172 2,709 (2,430) (309) 12,419 11,895
Total investments 4,154 3,989 5,422 3,308 4,144 2,672 3,298 3,082 (2,430) (309) 14,588 12,742
Amortization (1,799) (1,716) (1,041) (1,059) (178) (133) (651) (584) - - (3,669) (3,492)
Depreciation (4,028) (4,324) (3,204) (2,740) (2,276) (1,733) (2,212) (1,758) 1,249 987 (10,471) (9,568)
Tot. amortiz . and deprec. (5,827) (6,040) (4,245) (3,799) (2,454) (1,866) (2,863) (2,342) 1,249 987 (14,140) (13,060)
6/30/12 12/31/11 6/30/12 12/31/11 6/30/12 12/31/11 6/30/12 12/31/11 6/30/12 12/31/11 6/30/12 12/31/11
STATEMENT O F FINANCIAL PO SITIO N
Segment assets 226,737 212,816 101,267 105,199 75,923 73,845 61,126 59,275 (62,545) (61,225) 402,508 389,910
Unallocated assets - - - - - - - - - 90,113 84,291
Total assets 226,737 212,816 101,267 105,199 75,923 73,845 61,126 59,275 (62,545) (61,225) 492,621 474,201
Segment liabilit ies 52,091 50,849 43,776 41,584 10,729 12,119 31,436 27,480 (51,267) (44,182) 86,765 87,850
Unallocated liabilit ies - - - - - - - - - - 29,575 35,173
Shareholders' equity - - - - - - - - - - 376,281 351,178
Total liabilities and
shareholders' equity 52,091 50,849 43,776 41,584 10,729 12,119 31,436 27,480 (51,267) (44,182) 492,621 474,201
CO NSO LIDATEDITALY EURO PE NO RTH AMERICA REST O F THE WO RLD ELIMINATIO NS
ITALY EURO PE NO RTH AMERICA REST O F THE WO RLD ELIMINATIO NS CO NSO LIDATED

56
2012 2011 2012 2011 2012 2011 2012 2011 2012 2011 2012 2011 2012 2011
INCOME STATEMENT
Revenues from outsiders 98,204 97,989 65,569 72,645 14,344 17,506 23,474 21,061 18,615 17,932 480 - 220,686 227,133
CONSOLIDATED
(in thousands of euros)
EUROPE AND AFRICA NORTH AMERICACENTRAL AND SOUTH
AMERICAASIA PACIFIC MUREX NORDIAG

57
DESCRIPTION AND MAIN CHANGES
Consolidated income statement
The notes to the consolidated income statement are provided below. More detailed information
about the components of the income statement is provided in the Report on Operations.
(1) Net revenues
In the first half of 2012, net revenues, which are generated mainly through the sale of diagnostic
kits, totaled 220,686 thousand euros, or 2.8% less than in the same period last year. These
revenues include equipment rentals and technical support revenues of 3,767 thousand euros,
compared with 3,798 thousand euros in the first six months of 2011.
As for the contribution provided by sales of Murex products, the Group reported revenues of
18,615 thousand euros at June 30, 2012 (17,932 thousand euros in the first half of 2011). The
NorDiag business operations, acquired on May 4, 2012, contributed 480 thousand euros.
(2) Cost of sales
In the first half of 2012, the cost of sales amounted to 67,405 thousand euros (including 198
thousand euros attributable to the NorDiag business operations), compared with 62,854 thousand
euros in the first six months of 2011. The cost of sales includes 5,396 thousand euros in royalty
expense (7,000 thousand euros in the same period in 2011) and 4,085 thousand euros in costs
incurred to distribute products to end customers (3,758 in the first half of 2011). The cost of sales
also includes the depreciation of medical equipment held by customers, which amounted to 6,798
thousand euros (5,889 thousand euros in the same period last year).
(3) Sales and marketing expenses
Sales and marketing expenses, which include 80 thousand euros attributable to the NorDiag
business operations, totaled 40,617 thousand euros in the first half of 2012, compared with 39,354
thousand euros in the first six months of 2011. This item consists mainly of marketing costs
incurred to promote and distribute DiaSorin products, costs attributable to the direct and indirect
sales force and the cost of the technical support offered together with the Group-owned equipment
provided to customers under gratuitous loan contracts.
(4) Research and development costs
The research and development costs incurred during the first six months of 2012, which totaled
11,757 thousand euros (10,714 thousand euros in the same period in 2011), include all of the
research and development outlays that were not capitalized (7,272 thousand euros compared with
6,694 thousand euros in the first six months of 2011), the costs incurred to register the products
offered for sale and meet quality requirements (3,603 thousand euros, up from 3,229 thousand
euros in the first half of 2011) and the amortization of capitalized development costs (882
thousand euros compared with 791 thousand euros in the same period in 2011). A total of 208
thousand euros was attributable to the NorDiag business operations.
During the first half of 2012, the Group capitalized new development costs amounting to 1,650
thousand euros, compared with 445 thousand euros in the first six months of 2011.

58
(5) General and administrative expenses
General and administrative expenses, which include expenses incurred for corporate management
activities, Group administration, finance and control, information technology, corporate
organization and insurance, totaled 24,309 thousand euros in the first half of 2012 (including 342
thousand euros for the NorDiag business operations), up from 22,028 thousand euros in the same
period in 2011.
(6) Other operating income (expense)
Net other operating expense, which included charges totaling 853 thousand euros incurred in
connection with the acquisition of the NorDiag business operations, totaled 1,852 thousand euros,
compared with net other operating expense of 3,814 thousand euros in the first half of 2011. This
item reflects other income from operations that does not derive from the Group’s regular sales
activities (such as gains on asset sales, government grants and insurance settlements), net of other
operating charges that cannot be allocated to specific functional areas (losses on asset sales, out-of-
period charges, indirect taxes and fees, and additions to provisions for risks).
Specific charges include additions to the allowance for doubtful accounts amounting to 207
thousand euros (697 thousand euros in the first half of 2011) and 801 thousand euros in trade
related foreign exchange translation losses.
(7) Net financial income (expense)
The table below provides a breakdown of financial income and expense:
(in thousands of euros) First half 2012 First half 2011
Interest and other financial expense (1,536) (1,333)
Valuation of financial instruments as per IAS 39 (373) 655
Interest on pension funds (417) (386)
Interest and other financial income 467 181
Net translation adjustment 214 1,690
Net financial income (expense) (1,645) 807
In the first six months of 2012, net financial expense totaled 1,645 thousand euros, as against net
financial income of 807 thousand euros in the same period last year.
The main reason for this negative change is the effect of the net translation adjustment recognized
on the conversion of intercompany financing facilities denominated in currencies different from the
reporting currency and reflects the gain realized upon the settlement of U.S. dollar forward contracts
(15 thousand euros in 2012 and 978 thousand euros in 2011). Please note that the realized loss
compared with the value at the inception of these contracts in 2011 amounts to 987 thousand euros,
recognized as negative fair value of 1,002 thousand euros at December 2011, with a resulting impact
of 15 thousand euros on the income statement.
The measurement at fair value of financial instruments executed by DiaSorin S.p.A., the Group’s
Parent Company, to hedge expected cash flows from the U.S. subsidiary, consisting of forward
contracts to sell U.S. dollars, generated a loss of 373 thousand euros in the first half of 2012, as
against a gain of 655 thousand euros in 2011. Hedges that expired and were settled in the first half of
2012 amounted to US$20 million, while hedging transactions of US$16 were outstanding, compared

59
with closed-out transactions and outstanding transaction totaled US$22.1 million and US$31 million,
respectively, in the first six months of 2011.
Interest and other financial expense includes 1,133 thousand euros in fees on factoring transactions
(882 thousand euros in the first half of 2011) and 187 thousand euros in interest on bank borrowings
(167 thousand euros in the same period in 2011).
(8) Income taxes
The income tax expense recognized in the income statement for the first half of 2012 amounted to
27,562 thousand euros (32,819 thousand euros in the same period in 2011). The tax expense amount
includes non-deductible foreign taxes withheld on the dividends paid to the Group’s Parent
Company by the U.S. and South African subsidiaries, which totaled 1,685 thousand euros on the
first half of 2012 (2,009 thousand euros in the first six months of 2011) and 131 thousand euros
attributable to the NorDiag business operations.
In the first six months of 2012, the tax burden was equal to 37.7% of the profit before taxes (36.8%
in the first half of 2011).
(9) Earnings per share
Basic earnings per share, which amounted to 0.84 euros in the first half of 2012, compared with 1.02
euros in the same period in 2011, were computed by dividing the net result attributable to
shareholders by the weighted average number of shares outstanding for the period (54,247 million at
June 30, 2012).
Diluted earnings per share also amounted to 0.84 euros in the first half of 2012, compared with 1.02
euros in the same period in 2011: the average number of “potentially dilutive” shares resulting from
the hypothetical exercise of stock options, based on plan regulations, that were taken into account to
determine dilute earning did not have a material diluting effect.

60
CONSOLIDATED STATEMENT OF FINANCIAL POSITION
(10) Property, plant and equipment
The table below shows the changes that occurred in this account as of June 30, 2012:
(in thousands of euros) At
December
31, 2011
Additions Change in scope of
consolidation
Depreci-ation
Retire-ments
Translation adjustment
Reclassifications and other
changes
At June 30, 2012
Land 2,328 - - - - 7 - 2,335
Buildings 5,440 265 - 380 - 71 589 5,985
Plant and machinery 6,046 555 - 752 - 43 497 6,389
Manufacturing and distribution equipment 36,705 10,513 1,401 8,669 988 62 4 39,028
Other assets 6,629 598 128 670 25 107 96 6,863
Construction in progress and advances 5,574 488 - - 339 32 (2,315) 3,440
Total property, plant and equipment 62,722 12,419 1,529 10,471 1,352 322 (1,129) 64,040
Additions to manufacturing and distribution equipment include purchases of medical equipment
amounting to 9,442 thousand euros, up from 7,589 thousand euros in the first half of 2011.
Depreciation for the period totaled 6,798 thousand euros, up from 5,889 in the same period in 2011.
The change in scope of consolidation reflects the inclusion of plant and machinery and medical
equipment resulting from the acquisition of the NorDiag business operations.
(11) Goodwill and other intangible assets
A breakdown of intangible assets at June 30, 2012 is as follows:
(in thousands of euros) At
December 31, 2011
Additions Change in
scope of consolidation
Amorti-
zation Translation
adjustment
Reclassi-
fications and other changes
At June
30, 2012
Goodwill 65,083 - 4,530 - 162 - 69,775
Development costs 12,385 1,650 - 882 60 (4) 13,209
Concessions, licenses and trademarks 32,444 344 - 1,620 148 338 31,654
Industrial patents and intellectual property rights 11,780 152 - 1,136 (32) 795 11,559
Advances and other intangibles 241 23 - 31 5 - 238
Total intangible assets 121,933 2,169 4,530 3,669 343 1,129 126,435
Goodwill increased to 69,775 thousand euros at June 30, 2012, up from 4,530 thousand euros at
December 31, 2011, due to the acquisition of the NorDiag business operations: because the process
of determining the fair value of the acquired assets had not been completed as of the date of these
interim financial statements, any excess consideration paid, compared with the carrying amounts of
the acquired assets, was provisionally added to “Goodwill.”
The increase compared with December 31, 2011 also reflects the translation effect on the goodwill
allocated to the DiaSorin Brazil, DiaSorin U.S.A. and DiaSorin South Africa CGUs, amounting to
162 thousand euros.
Please note that intangible assets with an indefinite useful life were not tested for impairment at
June 30, 2012, since there were no indications of impairment. A full impairment test will be carried
out in connection with the preparations of the annual financial statements.

61
(12) Equity investments
Equity investments, which totaled 27 thousand euros at June 30, 2012, include 26 thousand euros
for the investment held by the German subsidiary in the U-Kasse pension fund and 1 thousand euros
for the interest held in the Sobedia affiliated company. The balance in this account was unchanged
compared with December 31, 2011.
(13) Deferred-tax assets and deferred-tax liabilities
Deferred-tax assets amounted to 20,243 thousand euros. They relate to consolidated companies that
have deferred-tax assets in excess of deferred-tax liabilities and to consolidation adjustments.
Deferred-tax liabilities, which totaled 2,938 thousand euros, relate to consolidated companies that
have deferred-tax liabilities in excess of deferred-tax assets. They are shown on the liabilities side of
the statement of financial position.
The balance reflects the net deferred-tax assets computed on the consolidation adjustments (mainly
from the elimination of unrealized gains on intra-Group transactions) and on temporary differences
between the asset and liability amounts used to prepare the consolidated financial statements and the
corresponding amounts used by the consolidated companies for tax purposes.
Deferred-tax assets were recognized in the financial statements when their future utilization was
deemed probable. The same approach was used to recognize the benefit provided by the use of tax
loss carryforwards, most of which, under current laws, can be brought forward indefinitely.
Based on the multi-year plans prepared by management, the Group is expected to generate
sufficient taxable income in future years to allow for the full recovery of the abovementioned
amounts.
An analysis of deferred-tax assets, net of offsettable deferred-tax liabilities, is provided below:
(in thousands of euros) 6/30/12 12/31/11
Deferred-tax assets 20,243 20,119
Deferred-tax liabilities (2,938) (2,564)
Total net deferred-tax assets 17,305 17,555
The Group offsets deferred-tax assets and liabilities when they refer to the same company.
Depending on whether they are positive or negative, the resulting balances are recognized as
deferred-tax assets or deferred-tax liabilities, respectively.
(14) Other non-current assets
The amount of 724 thousand euros refers mainly to receivables held by the Brazilian subsidiary for
estimated tax payments made.

62
(15) Inventories
A breakdown of inventories at June 30, 2012 and a comparison with the data at December 31, 2011
is provided below:
(in thousands of euros) 6/30/12 12/31/11
Gross
amount
Provisions for
writedowns
Net
amount
Gross
amount
Provisions for
writedowns
Net
amount
Raw materials and supplies 25,616 (2,101) 23,515 23,974 (2,169) 21,805
Work in progress 34,903 (2,561) 32,342 32,141 (2,961) 29,180
Finished goods 32,112 (1,365) 30,747 31,668 (1,391) 30,277
Total 92,631 (6,027) 86,604 87,783 (6,521) 81,262
The table below shows the changes that occurred in the provisions for inventory writedowns:
(in thousands of euros) 6/30/12 12/31/11
Opening balance 6,521 6,171
Additions for the period 313 1,228
Utilizations/Reversals for the period (845) (916)
Translation differences and other changes 38 38
Ending balance 6,027 6,521
The increase of 5,342 thousand euros in ending inventory, compared with December 31, 2011, is
due to the addition of the merchandise inventory of the newly acquired business operations (1,580
thousand euros) and, for the balance, higher inventories of strategic materials at the Group’s
production facilities and significant additions of semifinished goods related to products scheduled
for launch in the coming months.
(16) Trade receivables
Trade receivables totaled 115,798 thousand euros at June 30, 2012. The table that follows shows the
changes that occurred in the allowance for doubtful accounts, which amounted to 8,186 thousand
euros at June 30, 2012:
(in thousands of euros) 6/30/12 12/31/11
Opening balance 8,338 7,065
Additions for the period 207 1,666
Utilizations/Reversals for the period (221) (175)
Currency translation differences and other changes (138) (218)
Closing balance 8,186 8,338
In order to bridge the gap between contractual payment terms and actual collection dates, the Group
assigns its receivables to factors without recourse. The receivables assigned by the Group’s Parent
Company in the first half of 2012 totaled 17,992 thousand euros.
(17) Other current assets
Other current assets of 8,907 thousand euros (6,808 thousand euros at December 31, 2011) consist
mainly of accrued income and prepaid expenses for insurance, interest, rentals and government
grants; tax credits for foreign taxes withheld; and advances paid to suppliers.

63
(18) Cash and cash equivalents
The components of cash and cash equivalents, which totaled 69,843 thousand euros (64,145
thousand euros at December 31, 2011), include regular bank and postal accounts and short-term
bank deposits.
(19) Shareholders’ equity
Share capital
At June 30, 2012, the fully paid-in share capital consisted of 55.855 million common shares, par
value of 1 euro each. It increased by 157 thousand euros during the first half of 2012, due to a
capital increase carried out in connection with the 2007-2012 Stock Option Plan.
Additional paid-in capital
This account, which had a balance of 15,803 thousand euros, increased by 2,059 thousand euros
compared with December 31, 2011, due to a capital increase carried out in connection with the 2007-
2012 Stock Option Plan.
Statutory reserve
This reserve amounted to 11,168 thousand euros at June 30, 2012. The appropriation of the 2011 net
profit accounts for the increase compared with December 31, 2011.
Other reserves
A breakdown of other reserves is as follows:
(in thousands of euros) 6/30/12 12/31/11 Change
Currency translation reserve 9,610 8,155 1,455
Reserve for treasury stock 44,882 44,882 -
Stock option reserve 2,661 2,337 324
Retained earnings 237,714 165,690 72,024
IFRS transition reserve (2,973) (2,973) -
Consolidation reserve 904 904 -
Total other reserves and retained earnings 292,798 218,995 73,803
Currency translation reserve
The increase of 1,455 thousand euros shown in the currency translation reserve at June 30, 2012 is
due to the fluctuation of the exchange rate of the U.S. dollar and the Brazilian real. It also reflects
the foreign exchange differences resulting from the translation at year-end exchange rates of the
shareholders’ equities of consolidated companies with financial statements denominated in foreign
currencies, totaling 1,217 thousand euro. This amount includes 162 thousand euros for adjustments
to the goodwill allocated to CGUs that operate with currencies different from the euro.
This reserve also includes a gain of 238 thousand euros, net of tax effect, for unrealized translation
differences on indebtedness denominated in foreign currencies held by the Group’s Parent
Company to hedge its investment in the shareholders’ equity of the DiaSorin USA subsidiary.

64
Reserve for treasury shares
With regard to treasury shares, the Company complied with all statutory requirements, purchasing
treasury shares for amount covered by the distributable earnings and available reserves shown in its
latest duly approved financial statements. Purchases were authorized by the Shareholders’ Meeting
and under no circumstance did the par value of the purchased shares exceed one-fifth of the share
capital.
On January 17, 2011, the Company began to implement a program to buy treasury shares reserved
for implementation of its new stock option plan, in accordance with the provisions and timing
authorized by the Shareholders’ Meeting on April 27, 2010. The program ended on February 15,
2011, with the purchase of 750,000 common shares, equal to 1.35% of the share capital, at an
average price of 33.48 euros per share. A second program to buy treasury shares got under way on
October 17, 2011, in accordance with the provisions and timing authorized by the Shareholders’
Meeting of October 4, 2011.
Following these purchases, DiaSorin S.p.A. holds a total of 1,550,000 treasury shares, equal to
2.7828% of the share capital. The average purchase price of the 800,000 treasury shares purchased
in the last quarter of 2011 was 24.71 euros per share.
At June 30, 2012, the reserve for treasury shares amounted to 44,882 thousand euros. This reserve
was established pursuant to law (Article 2357 ter of the Italian Civil Code) due to purchases of
treasury shares made in 2011.
Stock option reserve
The balance in the stock option reserve refers to the 2007-2012 Stock Option Plan and the 2010
Stock Option Plan. In the first half of 2012, this reserve increased due to the recognition of stock
option costs amounting to 864 thousand euros. The exercise of some tranches of the 2007-2012 Plan
in the first half of 2012 caused a reduction of 540 thousand euros in the stock option reserve.
Retained earnings
The increase of 72,024 thousand euros in retained earnings, compared with December 31, 2011, is
due mainly to the appropriation of the net profit earned in 2011 (99,607 thousand euros). In
addition, the exercise of some tranches of the 2007-2012 Plan resulted in a positive change of 540
thousand euros.
IFRS transition reserve
The IFRS transition reserve was established on January 1, 2005, upon first-time adoption of the
IFRSs as an offset to the adjustments recognized to make the financial statements prepared in
accordance with Italian accounting principles consistent with IFRS requirements, net of the
applicable tax effect (as required by and in accordance with IFRS 1). This reserve has not changed
since it was first established.
Consolidation reserve
The consolidation reserve, amounting to 904 thousand euros, reflects the negative difference
generated by the elimination of the carrying amounts of equity investments against the
corresponding shareholders’ equities.
(20) Borrowings
Borrowings include 8,901 thousand euros in long-term debt and 8,426 thousand euros for the
current portion due within one year.

65
The table below lists the borrowings owed to banks and credit institutions at June 30, 2012
(amounts in thousands of euros):
Lender institution Currency Short-term
amount
Long-term
amount
Amount due
after 5 years Total
Interbanca USD USD 8,542 8,542 - 17,084
amount in EUR 6,785 6,785 - 13,570
Interbanca EUR EUR 1,379 1,379 - 2,758
IMI – Ministry of Educ., University and Research EUR 185 684 - 869
Unicredit for flood relief EUR - - - -
Finance leases EUR 77 53 - 130
Total 8,426 8,901 - 17,327
The table below lists the changes that occurred in the facilities outstanding as of the date of this
semiannual report compared with December 31, 2011 (amounts in thousands of euros):
Lender institution Balance at
12/31/11
Repay-
ments
Currency
translation
differences
Fair value
measure-
ment
Amortized
cost effect
Balance at
6/30/12
GE Capital (form. Interbanca) USD 16,502 (3,414) 459 - 23 13,570
GE Capital (form. Interbanca) EUR 3,448 (690) - - - 2,758
IMI – Ministry of Educ., University and Research 956 (106) - - 19 869
Unicredit for flood relief 187 (206) - - 19 -
Finance leases 260 (132) 2 - - 130
Total borrowings owed to financial institutions 21,353 (4,548) 461 - 61 17,327
Financial instruments 1,145
(1,002) 373 - 516
Total financial items 22,498 (4,548) (541) 373 61 17,843
The following amounts were repaid in the first half of 2012: 106 thousand euros to IMI-Ministry of
Education, 206 thousand euros to Unicredit, 690 thousand euros to GE Capital for the facility in
euros, US$4,300 thousand (equal to 3,414 thousand euros) to GE Capital and 132 thousand euros to
leasing companies.
The fair value of forward contracts to sell U.S. dollar outstanding at June 30, 2012 was negative by
373 thousand euros.
There were no changes in contract terms compared with December 31, 2011 and DiaSorin was in
compliance with all of the operating and financial covenants of the existing loan agreements.
Net financial position
The table below shows a breakdown of the net financial position of the DiaSorin Group at June 30,
2012 and provides a comparison with the data at December 31, 2011:

66
(in thousands of euros) 6/30/12 12/31/11
Cash and cash equivalents 69,843 64,145
Liquid assets (a) 69,843 64,145
Other current financial assets (b) - -
Current bank debt (8,349) (8,352)
Other current financial liabilities (593) (1,345)
Current indebtedness (c) (8,942) (9,697)
Current net financial position (d)=(a)+(b)+(c) 60,901 54,448
Non-current bank debt (8,848) (12,741)
Other non-current financial liabilities (53) (60)
Non-current indebtedness (e) (8,901) (12,801)
Net financial position (f)=(d)+(e) 52,000 41,647
The entire amount of the net financial position reflects transactions with parties outside the Group.
A breakdown of the changes in the Group’s liquid assets is provided in the statement of cash flows.
(21) Provision for employee severance indemnities and other employee benefits
The balance in this account reflects all of the Group’s pension plan obligations, other post-
employment benefits and benefits payable to employees when certain requirements are met. Group
companies provide post-employment benefits to their employees by contributing to external funds
and by funding defined-contribution and/or defined-benefit plans.
The manner in which these benefits are provided varies depending on the applicable statutory, tax-
related and economic conditions in the countries where Group companies operate. As a rule,
benefits are based on each employee’s level of compensation and years of service. The Group’s
obligations refer to the employees currently on its payroll.
Defined-contribution plans
Certain Group companies pay contributions to private funds or insurance companies pursuant to a
statutory or contractual obligation or on a voluntary basis. With the payment of these contributions,
the companies in question absolve all of their obligations. The liability for contributions payable is
included under Other current liabilities. The cost attributable to each year, which accrues based on the
services provided by employees, is recognized as a labor cost of the relevant organizational unit.
Defined-benefit plans
The Group’s pension plans that qualify as defined-benefit plans include the provisions for employee
severance indemnities in Italy, the Alecta system in Sweden and the U-Kasse pension plan and
Direct Covenant system in Germany.
The liability owed under these plans is recognized at its actuarial value using the projected unit
credit method. Any resulting actuarial gains or losses are recognized in accordance with the
Corridor Method.

67
Other employee benefits
The Group also provides its employees with additional long-term benefits, which are paid when
employees reach a predetermined length of service. In these cases, the value of the liability
recognized in the financial statements reflects the probability that these benefits will be paid and the
length of time for which they will be paid. The liability owed under this plan is recognized at its
actuarial value using the projected unit credit method. In this case, the Corridor Method is not
applied to any resulting actuarial gains or losses, which, instead, are recognized in profit or loss.
The table that follows summarizes the Group’s main employee benefit plans that are currently in
effect:
(in thousands of euros) 6/30/12 12/31/11 Change
Employee benefits
provided in:
- Italy 5,398 5,338 60
- Germany 13,134 12,879 255
- Sweden 2,176 2,121 55
- Other 433 610 (177)
21,141 20,948 193
broken down as follows:
- Defined-benefit plans
Provision for employee severance indemnities 4,330 4,459 (129)
Other defined-benefit plans 15,310 15,000 310
19,640 19,459 181
- Other long-term benefits 1,501 1,489 12
Total employee benefits 21,141 20,948 193
The table below shows a breakdown of the main changes that occurred in the first half of 2012:
(in thousands of euros) Defined-benefit
plans Other benefits
Total employee
benefits
Balance at December 31, 2011 19,459 1,489 20,948
Financial expense/(income) 408 9 417
Actuarial losses/(gains) - 204 204
Service costs 143 49 192
Contribution/Benefits paid (404) (252) (656)
Currency translation differences and other changes 34 2 36
Balance at June 30, 2012 19,640 1,501 21,141
(22) Other non-current liabilities
Other non-current liabilities, which totaled 3,360 thousand euros at June 30, 2012, consist mainly of
provisions for risks and charges. The table that follows shows the changes that occurred in these
provisions:

68
(in thousands of euros) 6/30/12 12/31/11
Opening balance 4,165 3,203
Additions for the period 51 1,620
Utilizations (31) (224)
Reversals for the period (757) (328)
Currency translation differences and other changes (73) (106)
Ending balance 3,355 4,165
Please note that in the last quarter of 2011, the Group’s Parent Company was the subject of a tax
audit, which was completed in December with the issuance of the corresponding audit report. Based
in part on the advice of counsel, the Directors believe that the risk of contingent liabilities arising
from this audit is remote.
(23) Trade payables
Trade payables, which totaled 36,838 thousand euros at June 30, 2012, represent amounts owed to
suppliers for purchases of goods and services. All amounts are due within one year.
(24) Other current liabilities
Other current liabilities of 25,427 thousand euros consist mainly of amounts owed to employees for
statutory bonuses (16,742 thousand euros) and the remaining balance of the price owed for the
acquisition of the business operations of a local distributor in Australia (2,103 thousand euros).
(25) Taxes payable
The balance of 8,793 thousand euros represents the income tax liability for the profit earned in the
first half of 2012, less estimated payments made, and amounts owed for other indirect taxes and
fees.
(26) Commitments and contingent liabilities
Other significant commitments and contractual obligations
Significant contractual obligations include the agreements executed by DiaSorin S.p.A., the
Group’s Parent Company, and Stratec in connection with the development and production of a
chemiluminescence diagnostic system (called LIAISON XL). The supply contract signed by
DiaSorin and Stratec calls for the latter to manufacture and supply exclusively to DiaSorin the
LIAISON XL analyzer. The projected commitment is deemed to be significantly lower than the
normal level of capital investment that would be required for current or future equipment
production. As a result, net invested capital is not expected to undergo significant structural changes
in the future as a result of this commitment.
69
Contingent liabilities
The DiaSorin Group operates globally. As a result, it is exposed to the risks that arise from the
complex laws and regulations that apply to its commercial and manufacturing activities.
The Group believes that, overall, the amounts set aside for pending legal disputes in the
corresponding provisions for risks are adequate.
(27) Entries resulting from atypical and/or unusual transactions
As required by Consob Communication No. DEM/6064296 of July 28, 2006, the Company declares
that, in the first half of 2012, the Group did not execute atypical and/or unusual transactions, as
defined in the abovementioned Communication, according to which atypical and/or unusual
transactions are transactions that, because of their significance/material amount, type of counterpart,
subject of the transaction, method of determining the transfer price and timing of the event
(proximity to the end of a reporting period), could create doubts with regard to: the
fairness/completeness of the financial statement disclosures, the existence of a conflict of interest,
the safety of the corporate assets and the protection of minority shareholders.

70
ANNEX I: THE COMPANIES OF THE DIASORIN GROUP AT JUNE 30, 2012
Company Head office
location Currency
Share
capital (*)
Par value
per share
or
partnership
interest
% interest held
directly
Number of
shares or
partnership
interests held
Companies consolidated line by line
DiaSorin S.A/N.V. Brussels
(Belgium) EUR 1,674,000 6,696 99.99% 249
DiaSorin Ltda São Paulo
(Brazil) BRL 10,011,893 1 99.99% 10,011,892
DiaSorin S.A. Antony
(France) EUR 960,000 15 99.99% 62,494
DiaSorin Iberia S.A. Madrid
(Spain) EUR 1,453,687 6 99.99% 241,877
DiaSorin Ltd Oldbury (Great Britain)
GBP 500 1 100.00% 500
DiaSorin Inc. Stillwater
(USA) USD 1 0.01 100.00% 100
DiaSorin Canada Inc Mississauga (Canada)
CAD 200,000 N/A -
100 Class A
Common shares
DiaSorin Mexico S.A de C.V. Mexico City
(Mexico) MXP 63,768,473 1 99.99% 99,999
DiaSorin Deutschland GmbH Dietzenbach
(Germany) EUR 275,000 275,000 100.00% 1
DiaSorin AB Sundbyberg
(Sweden) SEK 5,000,000 100 100.00% 50,000
DiaSorin Ltd Rosh Haayin
(Israel) ILS 100 1 100.00% 100
DiaSorin Austria GmbH Vienna (Austria)
EUR 35,000 35,000 100.00% 1
DiaSorin Czech S.ro. Prague (Czech
Republic) CZK 200,000 200,000 100.00% 1
Biotrin Group Limited Dublin
(Ireland) EUR 3,923 0.01 100.00% 392,282
Biotrin International Limited Dublin (Ireland)
EUR 163,202 1.2 - 136,002
Biotrin Intellectual Properties Limited Dublin
(Ireland) EUR 144 0.6 9.58% 236
DiaSorin I.N.UK Limited
(formerly Biotrin Holdings Limited)
Dublin
(Ireland) EUR
7,826,072 0.01 - 782,607,110
DiaSorin South Africa (PTY) Ltd Johannesburg
(South Africa) ZAR 101 1 100.00% 101
DiaSorin Australia (Pty) Ltd Sydney
(Australia) AUD 100 1 100.00% 100
DiaSorin Ltd Shanghai
(China) RMB 1,211,417 1 80.00% 96,000
Equity investments valued at cost
DiaSorin Deutschland Unterstuetzungskasse
GmbH
Dietzenbach
(Germany) EUR 25,565 1 - 1
Consorzio Sobedia Saluggia (Italy) EUR 5,000 N/A 20.00% 1
(*) Amounts in local currencies.

71
CERTIFICATION OF THE CONDENSED SEMIANNUAL CONSOLIDATED FINANCIAL STATEMENTS
PURSUANT TO ARTICLE 81-TER OF CONSOB REGULATION NO. 11971 OF MAY 14, 1999, AS
AMENDED
We, the undersigned, Carlo Rosa, in my capacity as Chief Executive Officer, and Luigi De Angelis,
in my capacity as Officer Responsible for the preparation of corporate financial reports of DiaSorin
SpA,
attest that,
insofar as the provisions of Article 154-bis, Sections 3 and 4, of Legislative Decree No. 58 of
February 24, 1998 are concerned, the administrative and accounting procedures applied during the
first half of 2012 to prepare the condensed semiannual consolidated financial statement were:
a) adequate in light of the Company’s characteristics; and
b) were applied effectively.
Moreover, we attest that the condensed semiannual consolidated financial statements:
a) were prepared in accordance with the applicable international accounting principles, as adopted
by the European Union pursuant to Regulation (CE) No. 1606/2002 of the European Parliament and
Council dated July 19, 2002;
b) correspond to the Company’s books of accounts and bookkeeping entries;
c) are suitable for the purpose of providing a truthful and fair representation of the statement of
financial position, operating performance and cash flow of the issuer and of the companies included
in the scope of consolidation.
To the best of our knowledge, the interim Report on Operations provides a reliable analysis of
significant events that occurred during the first half of the year and of their impact on the condensed
semiannual financial statements, together with a description of the main risks and uncertainties for
the remaining six months of the year.
The interim Report on Operations also provides a reliable analysis of information concerning
transactions with related parties.
Saluggia, August 3, 2012
Signed:
Carlo Rosa Luigi De Angelis
Chief Executive Officer Officer Responsible for the preparation
of corporate financial reports