h2s msc project
TRANSCRIPT

1
Effect of Pre-exposure of Sulfur and Iron Sulfide on
H₂S Corrosion at Different Temperatures
Master Thesis
of
Brailovskiy Valery
June 2011

2

3
Faculty of Science and Technology
MASTER’S THESIS
Study program/ Specialization:
Masters in Environmental
Technology/Offshore
Spring semester, 2011
Open
Writer:
Brailovskiy Valery
………………………………………… (Writer’s signature)
Faculty supervisor: Tor Hemmingsen
External supervisor(s):
Title of thesis:
Effect of pre-exposure of sulfur and iron sulfide on H₂S corrosion at different temperatures
Credits (ECTS): 30
Key words:
Sulfur Deposition
H₂S Corrosion
Iron Sulfide
Galvanic Corrosion
Pages: 68
+ enclosure: 2 CDs
Stavanger, 14.06.2011

4

5
ABSTRACT
The study has been carried out to investigate the effect of elemental sulfur and
iron sulfide on corrosion behavior of carbon steel in sour environment. It was
found that both compounds could form a protective layer of corrosion products
even at low pH and high temperature levels. In general, bare steel electrode
behaved as sacrificial anode in two metal galvanic coupling with sulfur or iron
sulfide covered steel electrode. However, some examples of opposite behavior
were observed in the tests with iron sulfide. The surface of bare steel electrode
was coated with a thin black layer and had no evidence of changes due to
corrosion. In other hand, surface of sulfur-covered electrode had well adherent
thick dark film with traces of pitting. In the case with iron sulfide-covered
electrode, the metal surface remained bright with crevice corrosion region.

6

7
ACKNOWLEDGEMENT
I would like to express my sincere gratitude to Professor Tor Hemmingsen for his
continues academic and moral support.
I would like to thanks my laboratory colleges for priceless advices and moral
support too.
Special thanks to my friend Whida Permana.

8
TABLE OF CONTENTS
1 INTRODUCTION .......................................................................................... 13
2 LITERATURE REVIEW .................................................................................. 14
2.1 Sour Environment ............................................................................... 14
2.2 Sour corrosion problems ..................................................................... 14
2.3 Types of corrosion ............................................................................... 16
2.4 Steels used in sour environment ......................................................... 16
2.5 H₂S Corrosion of carbon steel .............................................................. 16
2.5.1 Presence of elemental S in sour corrosion .................................... 18
2.5.2 Effect of temperature and partial pressure .................................. 21
2.5.3 Effect of pH .................................................................................. 21
2.5.4 Effect of Cl ions ............................................................................ 22
2.5.5 Effect of concentration H₂S .......................................................... 22
3 ELECTROCHEMICAL METHODES ................................................................. 23
4 EXPERIMENTAL PROCEDURE AND SETUP ................................................... 25
4.1 Research objectives ............................................................................. 25
4.2 Setup ................................................................................................... 25
4.3 Experimental procedures .................................................................... 27
5 RESULTS AND DISCUSSIONS ....................................................................... 30
6 CONCLUSIONS ............................................................................................ 59
7 RECOMMENDATIONS AND FUTURE WORK ................................................. 60
REFERENCES ...................................................................................................... 61
APPENDIX 1 ....................................................................................................... 65
APPENDIX 2 ....................................................................................................... 66

9
LIST OF FIGURES
Figure 1. pH at equilibration after mixing water with sulfur at various
temperatures. ................................................................................................... 20
Figure 2. Effect of NaCl concentration on the corrosion rate of carbon steel in a
H₂O-H₂S-NaCl system (after Foroulis). ............................................................... 22
Figure 3. Effect of pH and concentration of H₂S on corrosion rate. .................... 23
Figure 4. The galvanic cell. ................................................................................. 26
Figure 5. Support for two working and counter electrodes ................................ 27
Figure 6. Galvanic couple between two corroding metals .................................. 31
Figure 7. The OCP values of Fe/Fe+S galvanic couple after 15 minutes and 24
hours at different temperatures (Series 1)......................................................... 32
Figure 8. The OCP values of Fe/FeS galvanic couple after 15 minutes and 24 hours
at different temperatures. ................................................................................. 33
Figure 9. Potentiodynamic sweeps for covered with elemental sulfur working
electrode at pH3 at 20°C (blue), 40°C (green), 80°(red) after 15 minutes. .......... 37
Figure 10. Potentiodynamic sweeps for covered with elemental sulfur working
electrode at pH7 at 20°C (blue), 40°C (green),80°(red) after 15 minutes. ........... 38
Figure 11. Potentiodynamic sweeps for covered with elemental sulfur working
electrode at pH10 at 20°C (blue), 40°C (green),80°(red) after 15 minutes. ......... 38
Figure 12. Changes in corrosion current density in time for decoupled sulfur-
covered electrode. ............................................................................................ 39
Figure 13. Potentiodynamic sweeps for covered with elemental sulfur working
electrode at pH3 at 20°C (blue), 40°C (green),80°(red) after 24 hours. .............. 40
Figure 14. Potentiodynamic sweeps for covered with elemental sulfur working
electrode at pH7 at 20°C (blue), 40°C (green),80°(red) after 24 hours. .............. 40
Figure 15. Potentiodynamic sweeps for covered with elemental sulfur working
electrode at pH10 at 20°C (blue), 40°C (green),80°(red) after 24 hours. ............ 41

10
Figure 16. Potentiodynamic sweeps for bare working electrode at pH3 at 20°C
(blue), 40°C (green), 80° (red) after 24 hours. .................................................... 43
Figure 17. Potentiodynamic sweeps for bare working electrode at pH7 at 20°C
(blue), 40°C (green), 80° (red) after 24 hours. .................................................... 43
Figure 18. Potentiodynamic sweeps for bare working electrode at pH10 at 20°C
(blue), 40°C (green), after 24 hours. .................................................................. 44
Figure 19. Galvanic corrosion: pH10 at 40°C (blue); pH3 at 40°C (red); pH7 at 80°C
(purple); pH10 at 80°C (green); pH3 at 80°C (brown). ........................................ 45
Figure 20. Effect of temperature on corrosion rate of the steel [40]. ................. 46
Figure 21. Surface of bare carbon steel electrode (pH10 at 80°C). ..................... 46
Figure 22. Surface of covered with elemental sulfur carbon steel electrode (pH10
at 80°C). ............................................................................................................ 47
Figure 23. Picture of covered with Teflon tape and bare working electrodes. .... 47
Figure 24. Surface of covered with elemental sulfur electrode (pH10 at 20°C)
after removal of Teflon tape. ............................................................................. 48
Figure 25. Potentiodynamic sweeps for covered with iron sulfide working
electrode at pH3 at 20°C (blue), 40°C (green),80°(red) after 15 minutes. ........... 50
Figure 26. Potentiodynamic sweeps for covered with iron sulfide working
electrode at pH7 at 20°C (blue), 40°C (green),80°(red) after 15 minutes. ........... 50
Figure 27. Potentiodynamic sweeps for covered with iron sulfide working
electrode at pH10 at 20°C (blue), 40°C (green),80°(red) after 15 minutes. ......... 51
Figure 28. Changes in corrosion current density in time for decoupled iron
sulfide- covered electrode. ................................................................................ 51
Figure 29. Potentiodynamic sweeps for covered with elemental sulfur working
electrode at pH3 at 20°C (blue), 40°C (green), 80°C (red) after 24 hours............ 53
Figure 30. Potentiodynamic sweeps for covered with elemental sulfur working
electrode at pH7 at 20°C (blue), 40°C (green), 80°C (red) after 24 hours............ 53
Figure 31. Potentiodynamic sweeps for covered with elemental sulfur working
electrode at pH10 at 20°C (blue), 40°C (green), 80°C (red) after 24 hours. ......... 54

11
Figure 32. Potentiodynamic sweeps for bare working electrode at pH3 at 20°C
(blue), 40°C (green), 80°(red) after 24 hours. ..................................................... 55
Figure 33. Galvanic corrosion scans for Fe/FeS couple in Series 2. ..................... 55
Figure 34. Surface of bare carbon steel electrode at pH7 at 80°C. ..................... 57
Figure 35. Surface of covered (FeS) electrode at pH7 at 80°C after black film has
been removed. .................................................................................................. 57

12
LIST OF TABLES
Table 1. The Experimental test matrix ............................................................... 25
Table 2. Chemical composition of carbon steel X65 (from certificate)................ 25
Table 3. The experiments with the covered working electrodes ........................ 27
Table 4. Potential before and after decoupling of electrodes ............................ 30
Table 5. Evaluation of the open circuit potential of decoupled electrodes during
tests. ................................................................................................................. 35
Table 6. Comparison of Ecorr potential for decoupled electrodes. .................... 42
Table 7. Galvanic current for covered electrode in coupling Fe/Fe+S (µA). ........ 45
Table 8. Galvanic current for covered electrode in coupling Fe/FeS (µA). .......... 56

13
1 INTRODUCTION
The number of sour (C0₂ + H₂S containing) oil and gas fields being produced
worldwide is increasing. As sweet (C0₂ containing) fields are being depleted, and
higher oil prices made it possible for profitable development of sour oil and gas
fields [1].
Carbon steel is extensively used in oil and gas pipelines due to low cost. Since
long ago companies faced with a corrosion problems related to using the carbon
steel tubing in extremely environments which could cause to serious damages in
structure. Sulfide stress cracking (SSC) can occur when H₂S is present in the
reservoir and is in contact with high-strength steel commonly used in drilling,
completing and production wells [2]. For SSC to occur, a metal must be exposed
to hydrogen sulfide and under operating conditions conducive to SSC. The critical
operating conditions to be considered are if the metal is exposed and, if so, what
is the partial pressure of hydrogen sulfide, pH of the water handled, temperature
and stress level [3].
Iron sulfide scale formed on internal surfaces of carbon steel tubing and
pipelines can be very protective, but localized corrosion attack may occur in the
presence of high chloride levels, elemental sulfur or exposure to stagnant water.
The formation of iron sulfides is complicated by existence of several stable and
metastable Fe-S compounds. Many studies have appeared in the literature;
however, no systematic investigation has been reported on the influence of pH
and H₂S concentration on the active dissolution of iron in acidic solutions [4]. For
understanding of behavior and morphology of sulfides films need more time and
more complicated equipment.
The objective of the present work was to study corrosion of carbon steel X65 in
solutions of various pH levels and temperatures using potentiostatic polarization
methods.

14
2 LITERATURE REVIEW
2.1 Sour Environment
The number of sour oil and gas fields worldwide is increasing, as sweet fields are
being depleted and high oil prices vouch for profitable development of sour oil
and gas finds. Sour oil and gas production and transport always imply a risk of
material damage and shutdowns due to CO₂/H₂S corrosion, and especially
localized corrosion attacks.
The NACE Standard MR0175-88 [5] can be used as guidelines for defining a sour
environment for the general selection of carbon steel and allow steels. This
definition states that the 0.05-psia (0.34 kPa) H₂S partial pressure in the gas
phase distinguishes SSC failures from no failures in susceptible carbon and low-
alloy steels [6].
2.2 Sour corrosion problems
H₂S is a compound toxic to life that can be associated to natural gas, oil and
production water. It is very dangerous to operational staff and causes corrosion
cracking and pitting. The generation mechanism of H₂S has been classified as
biotic (biological sources) or abiotic (geological or geochemical sources). The
biotic is related to sulfite reducing bacteria (SRB) in reservoirs. Abiotic
mechanism involved only chemical reaction between organic, inorganic phases
and water. In that case temperature and pressure are critical parameters:
thermochemical sulphate reduction (TSR), hydrolysis of metallic sulfurs, cracking
or organic compounds, cracking or kerogen and volcanogenic sources are
examples of abiotic mechanism [7].
H₂S is associated with corrosion damage and contributes to several forms of
environmental embrittlement. These forms of embrittlement include internal
hydrogen blistering, hydrogen induced cracking (HIC) and stress oriented
hydrogen induced cracking (SOHIC) of carbon steel plate and pipe material and
sulfide stress cracking (SSC) in high strength steels or hard weld zones. It can also

15
contribute to SSC, hydrogen embrittlement cracking (HEC), localized corrosion
and anodic SCC alloys.
Sulfide Stress Cracking (SSC) occurs under the combined action of tensile stress
and aqueous environments containing H₂S. This type of cracking occurs at hard
martensitic or bainitic areas associated with welds, including both the weld
deposit and the heat affected zones. Atomic hydrogen liberated by H₂S diffuses
through the steel and tends to accumulate at areas of high metal hardness and
high tensile stress. This mechanism does not require the recombination of
hydrogen to molecules and is most often associated with atomic hydrogen. This
phenomenon embrittles the steel. The SSC cracks are perpendicular to the
tensile stress direction.
During Hydrogen Induced Cracking (HIC) or stepwise cracking, hydrogen
absorbed from the solution diffuses in the metal and then recombines as
hydrogen molecules at trap sites in the steel matrix. High hydrogen pressure can
be developed and cracks can initiate. As more hydrogen enters the voids the
pressure rises, deforming the surrounding steel so that blisters may become
visible at the surface. The steel around the crack becomes highly strained and
this can cause linking of adjacent cracks to form stepwise cracking.
Stress Oriented Hydrogen Induced Cracking (SOHIC) could be described as
combination of HIC and SSC. In SOHIC staggered small cracks are formed
approximately perpendicular to the principal stress (applied or residual) resulting
in a “ladder-like” crack array. The mode of cracking can be categorized as SSC
caused by a combination of external stress and the local straining around
hydrogen induced cracks. SOHIC usually occurs in the base metal, adjacent to the
HAZ of a weld (where there are high residual stresses from welding) or in a hard
weld heat affected zone [8].
As mentioned earlier, the biological source of sour corrosion is SRB causes to
Microbial Induced Corrosion (MIC). MIC is very aggressive form of corrosion with
many proposes mechanism. Rapid pitting attack can quickly lead to equipment

16
failure. SRB present in anaerobic layer formed on the metal surface can be
detected at corrosion sites in the field by presence of the sulphide films.
2.3 Types of corrosion
Many upstream oil and gas facilities consist of carbon steel pipeline and piping
exposed to CO₂ and H₂S acid gases. Field experience shows that failure of these
linens is typically localized/pitting corrosion rather than general corrosion over
the entire material surface [9, 10], when the metal loss from the surface. During
the localized/pitting corrosion the metal loss is randomly located on the metal
surface and anodic sites are formed where the iron sulfides scale could damage.
Also corrosion could occur at places with gaskets, bolts and lap joints where
crevice exists. Crevice corrosion creates pits similar to pitting corrosion.
2.4 Steels used in sour environment
Carbon steels are generally used for the petroleum industry for transportation of
crude oils and gasses from offshore to different refining platforms and from their
different destination of the applications. Usually the carbon steel is susceptible
to internal corrosion due to CO₂/H₂S environment. General principles for
selection materials selection and corrosion protection described in NORSOK
standard M-011 [11]. The selection of materials shall be optimized and provide
acceptable safety and reliability. Steels grades alloyed with high contents of
Chromium (Cr), Molybdenum (Mo) and Nickel (Ni) are able to effectively resist
corrosion.
2.5 H₂S Corrosion of carbon steel
Several researches have investigated the corrosion of carbon steel in the
presence of H₂S. The chemistry of H₂S-H₂O system is fairly complex. The stability
of the different sulfur species present (H₂S, HS¯ or S²¯) depends on the solution
pH and the redox potential. The corrosion of carbon steel in H₂S media is
influenced by the formation of salts of iron with sulfur anions. The types of iron
sulfide scales that are formed include kansite (Fe₉S₈), troilite (FeS), pyrrhotite

17
(Fe₁₋ₓS), mackinawite (Fe₁₊ₓS), markasite FeS₂ (S-deficient) and pyrite FeS₂ (S or Fe
deficient) [12].
The overall H₂S corrosion reaction for Fe in an aqueous medium is written as
Fe + H₂S → FeS + H₂ (1)
In most cases, the formation of iron sulfide films (FeₓSy) on the steel surface
becomes the rate-limiting step in H₂S corrosion. Both the corrosion rate and
morphology are intimately related to the electronic, chemical and even
mechanical properties of these films. The complex chemistry and mechanism of
FeₓSy formation make this sound like a difficult proposal for experimental
investigations. Depending on the environment chemistry and the prior state of
the underlying metal, a variety of iron sulfides can be formed. Mackinawite is
one of the most prevalent FeₓSy compounds encountered in slightly sour
conditions. Its crystalline structure consists of a tetragonal sulfur-deficient iron
sulfide (FeS₁₋ₓ). Due to its (thermodynamic) semistability, mackinawite usually
forms as a precursor to some other structures. The semiconductive properties of
nonstoichiometric iron sulfides stem from the presence of native point defects.
These properties are anticipated to play a crucial role in localized sour corrosion
mechanism [13].
In the literature a number of schemes which represent mechanisms of iron sulfide
scales formation could be found. In accordance with these studies it is possible
to conclude that in the reaction time of first hour very thin sulfide film, possibly
mackinawite, forms rapidly on the steel electrode. Based on it the mechanisms
of H₂S corrosion could be described as follows:
1. H₂S diffuses to the steel surface,
2. H₂S reacts with the steel to form mackinawite scale on the surface,
3. Mackinawite scale dissolves to Fe(HS)ᶧ and HS¯,
4. Fe(HS)ᶧ diffuses away from the steel surface, and

18
5. More H₂S diffuses to react with the exposed steel.
When more ferrous ions were released from the steel surface, cubic ferrous
sulfide and troilite precipitated on the steel surface because of high local
supersaturation of iron sulfide. If oxygen was involved in the system, it may form
thiospinel greigite on the steel surface. At very high concentration of H₂S,
pyrrhotite, marcasite, and pyrite may form on the steel surface [14].
These scales may or may not be protective depending on the conditions such as
temperature, pH and H₂S concentration.
Many studies were carried out to investigate how these parameters affect on
corrosion rate.
2.5.1 Presence of elemental S in sour corrosion
Elemental sulfur deposition commonly occurs in production fields with sour
environment, especially in high H₂S concentration level reservoirs. In aqueous
conditions, contact of solid sulfur with mild steel can initiate catastrophic
corrosion problems. Corrosion process may be dramatically accelerated in the
presence of high concentration of salt [15].
The chemical species H₂S, CO₂ and S of the gas phase as well as the Cl of the
brine play a key role on the corrosiveness of the downhole environment. The
impact of elemental sulfur is controlled by three main parameters temperature,
pressure and the composition of the sour gas, where the H₂S content has the
most significant effect on the S solubility.
From several studies it could be summarized that, S8 deposition has three
predominant potential behavior pathways to consider: chemical reactions,
condensate formation, and desublimation of sulfur. The chemical reaction
theory, however, can hardly quantify the solid sulfur deposition which takes
place immediately with pressure decreased. Condensate formation may lead to
the S8 deposit since liquid hydrocarbons are able to dissolve a part of the
vaporized sulfur and evaporation of these condensed liquids results in deposition
of sulfur particles. This condensate mechanism is possible only when the gas is

19
rich in heavy hydrocarbons. Desublimation is the direct transformation of a
vapor compound into a solid. As vapor phase becomes saturated, further
decreases in either pressure or temperature will instigate a thermodynamic
instability, leading to the occurrence of sulfur precipitation via a phase change.
Furthermore, condensate formation is a temperature-dominant process whereas
desublimation is pressure-dominant. In general, gas transmission systems with a
great flow rate have a low temperature drop rate on account of thermal
insulation whereas a high pressure drop rate is anticipated under the turbulent
flow. Unless the system has a sudden temperature quench locally, the pressure
drop rate appears to be a key parameter on elucidating the mechanism of S₈
deposition. Hence, desublimation is the most likely S₈ deposition mechanism
[16].
Based on the investigations of several researches the S/H₂S corrosion can be
summarized as follows [17, 18-20].
The elemental sulfur dissolves in sour gases and forms various polysulfide
species under high temperatures [21]:
Sₓ+ H₂S →H₂Sₓ₊₁ (2)
The anodic metal dissolution reactions:
Fe = Fe ²ᶧ + 2e¯ (3)
Fe + H₂O = Fe(OH) + Hᶧ + 2e¯ (4)
Chemical formation of iron sulfides:
Fe²ᶧ + HS¯ + OH¯ = FeS + H₂O (5)
Fe ²ᶧ + S²¯= FeS (6)
Fe(OH) + Hᶧ + HS¯ + OH¯= FeS + 2H₂O (7)
Fe(OH) + Hᶧ + S²¯ = FeS + H₂O (8)

20
The cathodic reactions:
FeSₓ + S = FeSₓ₊₁ (9)
FeSₓ₊₁ + H₂O + 2e ¯→ FeSₓ + HS¯ + OH¯ (10)
FeSₓ₊₁+ 2e¯ → FeSₓ + S²¯ (11)
H₂Sₓ + 2e¯→ H₂Sₓ₋₁ + S²¯ (12)
H₂Sₓ + 2e¯→ H₂Sₓ₋₁ + HS¯ (13)
H₂Sₓ₊₁ + 2xe¯ → H₂S + xS²¯ (14)
Elemental sulfur can readily form in aqueous systems via the oxidation of sulfide
species [22]. Possible reactions for the formation of elemental sulfur (S8) could
involve high oxidation state metals (denoted Mnᶧ) or oxygen:
8 H₂S (aq) + 16 Mnᶧ (aq) → S₈(s) + 16 Hᶧ (aq) + 16 M(n₋₁)ᶧ (aq) (15)
8 H₂S (aq) + 4 O₂ (g) → S₈ (s) + 8 H₂O (l) (16)
The presence of elemental sulfur could also cases to significant acidification of
water upon exposure at temperatures in excess of 80°C. Figure 1 shows the pH at
equilibration after mixing with sulfur at various temperatures.
Figure 1. pH at equilibration after mixing water with sulfur at various
temperatures [23].

21
2.5.2 Effect of temperature and partial pressure
Temperature and partial pressure directly affected the morphology and
composition of corrosion products, which in turn caused the change of corrosion
rate and occurrence of localized corrosion [24]. But this effect much depends on
the exposure time. Hence, the temperature dependence of H₂S corrosion is very
weak for short term exposure and does not seems to have an effect at longer
exposure times. This suggests that the corrosion rate is predominantly controlled
by the presence of iron sulfide scale [25]. Increasing the temperature and H₂S
concentration increase the sulfidation rate. It is typical that a temperature
increase of 50°C wills double the sulfidation rate, while increasing the H₂S
concentration by a factor of 10 may be needed to double the sulfidation rate.
Therefore, changes of H₂S concentration are generally less significant, in terms of
influencing corrosion, than temperature variations [26]. As the concentration of
H₂S increases, the film formed is rather loose even at pH 3-5 and does not
contribute to the corrosion inhibiting effect [27]. With the pressure and
temperature drop the solubility of sulfur is decrease and sulfur is deposited
when the solubility limit is exceeded.
2.5.3 Effect of pH
The protective nature and composition of the corrosion product depend greatly
on the pH of the solution. At lower values of pH (<2), iron is dissolved and iron
sulfide is not precipitated on the surface of the metal due to a very high solubility
of iron sulfide phases at pH values less than 2. In this case, H₂S exhibits only the
accelerating effect on the dissolution of iron. At pH values from 3 to 5, inhibitive
effect of H₂S is seen due to the formation of ferrous sulfide (FeS) protective film
on the electrode surface [28].

22
2.5.4 Effect of Cl ions
The effect of chloride concentration on the corrosion rate of carbon steel in
solutions saturated with H₂S (at room temperature) is shown in Figure 2. An
increase in the chloride concentration, in the range 0 to 3.6% NaCl, increased the
corrosion rate exponentially, suggested that the chloride ions inhibit the
formation of the sulfide films as well as increase the conductivity of the solution,
and, thereby, accelerate corrosion [28].
Figure 2. Effect of NaCl concentration on the corrosion rate of carbon steel in a
H₂O-H₂S-NaCl system (after Foroulis) [28].
2.5.5 Effect of concentration H₂S
The corrosion rate of X65 increases with the increase of H₂S concentration and
decreases with the increase of reaction time under the test conditions [29]. H₂S
concentration has an immense influence on the protective ability of the sulfide
film formed. As the concentration of H₂S increases, the film formed is rather
loose even at pH 3-5 and does not contribute to the corrosion inhibiting effect
[15]. It can be speculated that the formation of the sulfide surface films has
played a double role. At the low concentrations the sulfides reduced the
corrosion rate most likely by coverage of the steel surface, which prevented the
underlying iron from dissolving. This is supported by the facts that the sulfide
films detected in the experiments were too thin to be an effective diffusion

23
barrier. The secondary effect, which became dominant at higher concentrations
of H₂S, is related to an increase of the corrosion rate. It is most likely related to
the conductive sulfide films being a catalyst for the cathodic.
Figure 3 represent effect of pH and H₂S concentration on corrosion rate.
Figure 3. Effect of pH and concentration of H₂S on corrosion rate *29].
3 ELECTROCHEMICAL METHODES
Corrosion normally occurs at a rate determined by equilibrium between
opposing electrochemical reactions. The first is the anodic reaction, in which a
metal is oxidized, releasing electrons into the metal. The other is the cathodic
reaction, in which a solution species (often O₂ or Hᶧ) is reduced, removing
electrons from the metal. When these two reactions are in equilibrium, the flow
of electrons from each reaction is balanced, and no net electron flow (electrical
current) occurs. The two reactions can take place on one metal or on two
dissimilar metals (or metal sites) that are electrically connected [30].
DC electrochemistry, and in particular, the potentiodynamic polarization scan,
allows considerable information on electrode process to be acquired. Through
DC polarization technique, information on the corrosion rate, pitting
susceptibility, passivity as well as cathodic behavior of an electrochemical system
may be obtained [31]. As the potential is increased, pitting corrosion will begin at
a certain value known as the breakdown potential (EB, the lowest potential at

24
which pitting occurs). Since pitting corrosion relates to an increase in the
oxidation rate, the EB is determined by the corresponding increase in measured
current. An increase in EB is associated with higher resistance to pitting
corrosion. As the potential is decreased on the reverse scan, there is a decrease
in the current. However, hysteresis is observed for the reverse scan and a
hysteresis loop is traced. The sample is repassivated at the potential where the
reverse scan crosses the forward scan. The repassivation potential, or protection
potential (EP), occurs at a lower potential than the EB. The difference between
EB and EP is related to susceptibility to crevice corrosion; the greater the
hysteresis in the polarization curve, the greater the crevice corrosion
susceptibility.
Electrochemical corrosion experiments may also be used to determine corrosion
rates (Tafel Plot), active/passive characteristics for a specific sample/solution
system, passivation rates, and anodic and cathodic protection [32].

25
4 EXPERIMENTAL PROCEDURE AND SETUP
4.1 Research objectives
The objective of this project is to study the corrosion behavior of carbon steel in
the presence of both elemental sulphur and iron sulfide in different pH level. A
test temperature was selected in the range from 20°C to 80°C. The test matrix
for the research is given in Table 1
Table 1. The Experimental test matrix
Steel type X65 (Troll tubing) polished (1000 mesh)
Standard electrolyte 0.5 M NaCl (with 0.01 M Na₂S (Na₂S·3H₂O,) and 0.1 M HCl
Temperatures 20,40,80°C pH 3,7,10 Corrosion promoters Elemental Sulphur (S), iron(||)sulfide (FeS)-100
mesh, 99.9% metals basis Purging Nitrogen (N₂) 4.0 50 liter, Yara Paraxair.
For the experiments carbon steel X65 is used because it is widely used material
in oil and gas industry. Table 2 shows a chemical composition of carbon steel X65
(Figure 1 in appendix 1).
Table 2. Chemical composition of carbon steel X65 (from certificate)
4.2 Setup
The experimental setup is shown in Figure 4. The experiments were performed in
a Gamry galvanic glass cell sealed with airtight glass lids designed with the ports
for two working, reference, counter electrodes, port for purging tubing, port for
chemical insertion and sampling. Nitrogen was bubbled for de-aeration
throughout the test solution prior and during each experiment. All tubing and

26
wires were equipped with seals and tightened with Teflon tape so the air ingress
was negligible.
Figure 4. The galvanic cell.
The working electrodes were made of carbon steel X65. Coupon shape was of a
cylindrical geometry, 1cm in diameter and 1 cm in height approximately with
surface area approximately 0.785 cm². All coupons were sealed with epoxy resin
such that only the end-surface area was exposed. The surfaces of all specimens
were wet-polished up to 1000 grit and degreased with distilled water and
ethanol, and finally dried in blowing air.
As a reference electrode a saturated calomel electrode (SCE) was used. The
accuracy of the reference electrode was checked every time before and after
each experiment, against a dedicated reference electrode, the difference was
not more than 4-5mV in all cases. To minimize contamination of reference
electrode it was mounted into narrow glass tube with the cotton plug in the end
submersed into electrolyte and a thread is drawn all the way through the tube in
order to prevent the formation of air bubbles and assure good electrolytic
contact. All potentials were referred to the SCE. As counter electrode a platinum
electrode was used (4×6×2 mm).
All chemical insertions and sampling were made by syringe molted into the air
tight plug also equipped with the overpressure tube.

27
In order to follow the procedure the special support for two working and counter
electrode was made which allowed to hold electrodes above the electrolyte
surface and submersed it into the solution. This devise could keep electrodes
above the electrolyte while the pH was adjusted and nitrogen was purging and
be submersed easily into solution after certain time (Figure 5).
Figure 5. Support for two working and counter electrodes
The H₂S content was made by adding sodium Na₂S and HCl to the solution since
Na₂S turns into H₂S in acidic solutions within the pH range of 1 to 5.
Gamry galvanic cell has a double-wall construction and inlet and outlet for water
circulation to adjust the need temperatures.
4.3 Experimental procedures
All galvanic measurements were performed in 18 experiments, more than 48
hours by each. Table 3 shows the experimental overview.
Table 3. The experiments with the covered working electrodes
Elemental Sulphur Iron Sulfide(2)
Temperature Temperature pH 20 40 80 pH 20 40 80 3 #3 #6 #9 3 #12 #15 #18 7 #1 #4 #7 7 #10 #13 #16 10 #2 #5 #8 10 #11 #14 #17

28
A procedure for measuring was made for the experiments:
The initial open circuit potential (OCP) was measured for both
working electrodes (during 90 sec);
A cathodic potentiodynamic sweep for covered working electrode
was measured at 5 to -300 mV vs Ecorr, 0.2 mV/s, 1 meas/s after 15
minutes from beginning;
An anodic potentiodynamic sweep for covered working electrode
was measured at -5 to 150 mV vs E corr,0.2 mV/s, 1 meas/s;
The Rp/Ec trend for covered working electrode was performed
during 24 hours;
The measurements of open circuit potential of both working
electrodes were implemented after 24 hours Rp/Ec trend;
A cathodic potentiodynamic sweep for bare working electrode was
measured at 5 to -300 mV vs Ecorr, 0.2 mV/s, 1 meas/s after 24
hours from beginning;
An anodic potentiodynamic sweep for bare working electrode was
measured at -5 to 150 mV vs Ecorr,0.2 mV/s, 1 meas/s after 24
hours from beginning;
A cathodic potentiodynamic sweep for covered working electrode
was measured at 5 to -300 mV vs Ecorr, 0.2 mV/s, 1 meas/s) after
24 hours from beginning;
An anodic potentiodynamic sweep for covered working electrode
was measured at -5 to 150 mV vs Ecorr, 0.2 mV/s, 1 meas/s after 24
hours from beginning;
The measurements of galvanic corrosion were carried out during 24
hours.

29
In Series 1, one of the working electrodes was covered with elemental sulphur
(S) approximately 1. 0 g/cm². In Series 2 working electrode was covered with
iron sulfide (FeS). The other electrode in both series was uncovered carbon steel.
Before working electrodes were lowered to the electrolyte, purging nitrogen (N₂)
was done during at least 30 minutes.
To adjust need pH value, addition of 0.1 M Na₂S and addition of 0.5 M HCl were
made through syringe.
Potentiodynamic measurements were done before 24 hours Rp/Ec trend and
after.
At the end of each series galvanic corrosion measurements during 24 hours were
implemented.
For galvanic measurement it was connected in zero resistance ammeter (ZRA)
mode, which means one steel sample is connected as working electrode, another
steel sample as the counter electrode and the reference to reference electrode.
After all experiments the working electrodes were washed with ethanol and
dried in exsiccator and pictures of all were taken with light microscope for study
the surface changes. Prior each next experiment cell was demounted and
washed.

30
5 RESULTS AND DISCUSSIONS All experiments could be divided in to two series with the difference in film
forming agent. In Series 1 elemental sulfur was used for covering the surface of
one the working electrode and in Series 2 iron sulfide was used.
In each test OCP measurements of covered electrode were made with regard to
bare working electrode at the beginning and after 24 hours of running. Table 4
includes the data of OCP in both series.
Table 4. Potential before and after decoupling of electrodes
Potentials before and after decoupling of electrodes, mV
pH3 pH7 pH10
Temperature °C
Time, hr
Fe Fe+S Fe FeS Fe Fe+S Fe FeS Fe Fe+S Fe FeS
20 0.25 -740 -683 -637 -591 -778 -683 -762 -642 -665 -635 -637 -667
24 -693 -619 -722 -659 -697 -636 -706 -698 -793 -625 -770 -724
40 0.25 -718 -698 -721 -726 -888 -637 -728 -652 -908 -677 -562 -655
24 -686 -642 -715 -709 -693 -643 -733 -705 -699 -613 -741 -803
80 0.25 -699 -595 -737 -591 -832 -624 -813 -822 -726 -642 -919 -680
24 -645 -629 -753 -691 -648 -638 -679 -706 -601 -606 -964 -755
The table shows that almost in every case the OCP of bare electrode was lower
than OPC of covered electrode. A higher potential of sulfur or ferrous sulfide
covered electrode forces the non-covered electrode by galvanic coupling to
corrode as shown in a general corrosion curve (Figure 6):
More active metal corrodes faster when coupled, nobler metal
corrodes slower;
More active metal becomes anode, nobler becomes cathode

31
Figure 6. Galvanic couple between two corroding metals
Figure 7 shows that this trend occurred in all tests in Series 1 after 15 minutes.
After polarization of covered electrode and 24 hours Rp/Ec scan of coupled
metals, measurements of OCP for both decoupled electrodes were repeated.
Opposite behavior of the covered electrode was obtained at the pH10 at 80°C
(Figure 7, f). The OCP of bare steel electrode was -606 mV (SCE) and the OCP of
sulfur-covered electrode was -601 mV (SCE). This suggested that the electrode
was no longer protected by a protective film. It was confirmed after the
corrosion galvanic scan and pictures of surface were taken after test (Figure 20
text below). The reason of this could be the high pH and temperature conditions.
Figure 8 shows the measurements of decoupled working electrodes In Series 2.
At pH7 and 80°C potential was -813 for bare electrode and -822 mV (SCE) for iron
sulfides-covered, at pH 10 and 40°C: -741 for bare and -803 mV (SCE) for covered
electrode after 15 minutes. The covered electrode had lower potential. Same
trend was obtained in measurements after 24 hours.

32
a) 20°C (Fe/Fe+S) after 15 minutes b) 40°C (Fe/Fe+S) after 15 minutes
c) 80°C (Fe/Fe+S) after 15 minutes d) 20°C (Fe/Fe+S) after 24 hours
e) 40°C (Fe/Fe+S) after 24 hours f) 80°C (Fe/Fe+S) after 24 hours
Figure 7. The OCP values of Fe/Fe+S galvanic couple after 15 minutes and 24
hours at different temperatures (Series 1).

33
a) 20°C (Fe/FeS) after 15 minutes b) 40°C (Fe/FeS) after 15 minutes
c) 80°C (Fe/FeS) after 15 minutes d) 20°C (Fe/FeS) after 24 hours
e) 40°C (Fe/FeS) after 24 hours f) 80°C (Fe/FeS) after 24 hours
Figure 8. The OCP values of Fe/FeS galvanic couple after 15 minutes and 24 hours
at different temperatures.

34
Such a difference in OPC pointed on anodic behavior of the covered electrode
though it was expected what iron sulfide would protected the surface. The films
have both different structures and different electrochemical potentials, and may
therefore be cathodic or anodic when they are in contact with a metal [33].
Ewing [34] has presented data showing that iron sulfide is anodic to steel at pH
values above 6.5.
After 24 hours of running the OCP of covered electrode still was lower than OCP
of bare one. The pictures were taken after experiments show the presence of
thin black film on both electrode surfaces (Figures 26, 27 texts below; Figure 4,
pictures 5, 6 in appendix), hard to remove on bare electrode and easy to peel off
on covered one. After the film layer from covered with elemental sulfur was
peeled off the metal remained metallic bright without detectible changes or was
darkened slightly.
To see the evolution of the OCP during the test, the values of decoupled
electrodes were measured in three points of time. First measurements of OPC
were made after 15 minutes from the start of the tests, then after polarization of
covered electrode and 24 hours of Rp/Ec trend running. Last measurements of
OCP were made after polarization of both working electrodes, before galvanic
corrosion measurements. The data represents in Table 5 below. The trend has
been tracked between two first point regarding the time and pH.
The table shows that where were two ways of OPC evolution. Potential increases
or decreases in the course of the experiment. The data tend to suggest that such
decrease in potential indicates on growth of a protective film on the sample
surface or if it is increase some breakage of the film or pitting occurred.
It can also be seen from the Table 5 that the potential tended to decrease with
increasing in pH values in cases with elemental sulfur cover (except pH10 at
80°C) and with iron sulfide cover.
In Series 1 (Fe+S) it is difficult to observe a similar trend in changes through time.
But in Series 2 (FeS) in general, OPC decreased except pH7 at 80°C and pH3 at
40°C. Also it could be noted that OCP after 15 minutes for pH7 and 80°C too low

35
for carbon steel. Potential has shifted from -819 to -717 mV (SCE). Comparing to
working electrode covered with elemental sulfur (Series 1) at the same
parameters, potential shift was -624 to -650 mV (SCE).
Table 5. The open circuit potential of decoupled electrodes during tests.
Covered
electrode pH T,°C
Time, hours
0.25 24 Before galvanic
corrosion measurements
Fe+
S
3 20 -683 -619 -607
7 20 -665 -635 -625
10 20 -635 -625 -645
3 40 -687 -642 -630
7 40 -637 -643 -652
10 40 -618 -612 -641
3 80 -595 -629 -633
7 80 -624 -638 -650
10 80 -639 -609 -612
FeS
3 20 -587 -659 -655
7 20 -640 -698 -723
10 20 -667 -724 -786
3 40 -724 -709 -789
7 40 -650 -705 -732
10 40 -654 -803 -839
3 80 -575 -691 -716
7 80 -819 -706 -717
10 80 -675 -754 -808

36
Thermodynamically, according to the Nernst equation, as the pH and
temperature of the electrolyte increases the electrode potential of a metal
decreases [35].
Series 1
Further the data will be representing divided in two series. Some of the diagrams
were plot in Gamry Echem Analyst program, which make the work with
numerous values easier.
To investigate the cathodic and anodic behavior potentiodynamic measurements
for the covered electrode were carried out after 15 minutes from beginning of
each test and one more time after 24 hours Rp/Ec trend for both of working
electrodes.
Figures 9-11 show the potentiodynamic polarization curves of X65 carbon steel
at various pH levels and different temperatures in Series 1.
The Ecorr potential was not the same after a cathodic sweep and therefore many
of the curves showed not an overlap of starting potential (Ecorr) for the anodic
sweep.
Pauses in 15 minutes between cathodic and anodic measurements were made,
but still some curves deviated in the starting potential. As polarization was start
with the cathodic current steps, it was suggested that the mixed potential at the
beginning of cathodic step curve.
The effect of the corrosion products is that the galvanic current be reduced by
the increase in the ohmic resistance and the change of the corrosion potential to
more noble values [36]. It was expected that such changes would be occurred
with decreasing in the pH level and temperature which may cause to dissolution
of protective layer.
Figures 9-11 show stable behavior of anodic curves with increasing in pH. The
anodic current increased with increasing in pH. This could be due to the fact that
corrosion process involved formation and dissolution of corrosion products,
always maintaining the surface active [37]. Shift in potentials was in a range of

37
-568 to -609 mV (SCE). Nobler potential was observed at pH3 at 80°C. More
negative potential was at pH3 at 40°C (Figure 9).
Figure 9 clearly showed hydrogen reduction region and reduction of water or
sulfur species in environment due to a more catalytic film under the conditions
of 20, 40°C at low potential. Same behavior of cathodic reaction could be seen at
pH7 at 40°C (Figure 10). At this pH level the more negative potential -665 mV
(SCE) was observed at 20°C.
The higher current was observed at pH7 at 80°C (Figure 8). This allowed
expecting higher corrosion rate under these conditions. That was confirmed
during the Rp/Ec trend measurements (Figure 10).
Figure 9 shows that at pH7 at 20°C, the anodic current increased significant in
the region with a small shift in potential. Then potential rose slowly to -433 mV
with high applied current.
Figure 9. Potentiodynamic sweeps for covered with elemental sulfur working
electrode at pH3 at 20°C (blue), 40°C (green), 80°(red) after 15 minutes.

38
Figure 10. Potentiodynamic sweeps for covered with elemental sulfur working
electrode at pH7 at 20°C (blue), 40°C (green),80°(red) after 15 minutes.
Figure 11. Potentiodynamic sweeps for covered with elemental sulfur working
electrode at pH10 at 20°C (blue), 40°C (green),80°(red) after 15 minutes.

39
After potentiodynamic polarization tests, Rp/Ec trend measurements were made
to determine the corrosion current density. Figure 12 diagrams the corrosion
current density in all tests in Series 1.
Figure 12. Changes in corrosion current density in time for decoupled sulfur-
covered electrode.
As can be seen from the Figure 12, the higher current density was at pH7 at
80°C. This is surprising high value compared to the other tests results. It was
expected to seen the higher values of current density at pH3. One possible
reason for large divergence in the results could be the specimens were prone to
edge attack. Also it could be due to difficulties in adjustment of pH level. In
general highest values are observed at pH3 at 40, 80°C. These two lines have
tend continuously increase in current density over a period of experiment. In
other hand the lines at pH10 at 40, 80°C tended to stabilize and decrease with
time. At the pH10 at 20°C current density was almost zero during 17 hours of
running and increased not significant after. It means that the covered electrode
corroded less because it had the lowest current density. After 24 hours of Rp/Ec
measurements polarization scans were taken. Figures 13-15 show the
potentiodynamic curves for covered with elemental sulfur electrode after 24
hours Rp/Ec trend.

40
Figure 13. Potentiodynamic sweeps for covered with elemental sulfur working
electrode at pH3 at 20°C (blue), 40°C (green),80°(red) after 24 hours.
Figure 14. Potentiodynamic sweeps for covered with elemental sulfur working
electrode at pH7 at 20°C (blue), 40°C (green),80°(red) after 24 hours.

41
Figure 15. Potentiodynamic sweeps for covered with elemental sulfur working
electrode at pH10 at 20°C (blue), 40°C (green),80°(red) after 24 hours.
In all cases, the steel showed only an active behavior, anodic dissolution, without
evidence of any passive layer, except pH10 at 20°C (Figure 15). Under these
parameters, potential stopped to increase rapidly with not significant increasing
in current at -523 mV (SCE). Then current was increased without big increasing in
potential. The cathodic potential decreased comparing to pH7. It may be
suggested as inhibition effect due to formation of corrosion products on surface.
The shape of the rest curves practically remained the same with the pH changes.
The potential values lies between -609 and -701 mV (SCE). The lower anodic
potential under the conditions of pH7 at 80°C with higher current and corrosion
rate (Figure 12) .The anodic curves obtained show very similar current, regarding
to pH changes.
Along with the polarization studies of covered electrode the potentiodynamic
sweeps of bare steel electrode were carried out. Table 6 shows the Ecorr
potentials for bare and for covered decoupled electrodes during further
polarization measurements.

42
Table 6. Comparison of Ecorr potential for decoupled electrodes.
pH Temperature, °C
Ecorr after 15 minutes (Fe+S), mV
Ecorr after 24 hours (Fe+S), mV
Ecorr after 24 hours (Fe), mV
3 20 -618 -609 -691 40 -697 -642 -685 80 -595 -629 -648
7 20 -665 -635 -809 40 -608 -642 -893 80 -613 -613 -647
10 20 -615 -623 -769 40 -618 -613 -690 80 -646 -604 -634
From Table 6 it can be seen that values of Ecorr potential for bare carbon steel
electrode after 24 were lower than potential of covered electrode.
Figures 16-18 represent the obtained polarizations curves for bare electrode. It
can be seen, that where is no such big difference in anodic and cathodic
potentials which was in the tests with covered electrode. The potential region
was obtained between – 647 and -926 mV (SCE) and decreased with increasing in
pH. The more negative potential was under conditions of pH10 at 20°C (Figure
18). This is permit to suggest a higher corrosion rate at bare steel. From Figure 10
it can be seen that the covered electrode in the galvanic couple under same
conditions showed a lower current density and corrosion rate.
Under the conditions of pH3 at 40, 80°C it can be seen a decrease in cathodic
reactions.
It has been found that potential-based current oscillations occurred during the
tests of bare steel electrode. During the scans at pH10 the data of anodic and
cathodic steps at 80°C have been lost (Figure 18). At these conditions the more
sensitive oscillations were obtained. There are several possible reasons for such
behavior [38]:
The instrument
The cell/electrodes
The chemistry

43
The local electronic environment
The possible reason of such oscillation should be investigated further.
Figure 16. Potentiodynamic sweeps for bare working electrode at pH3 at 20°C
(blue), 40°C (green), 80° (red) after 24 hours.
Figure 17. Potentiodynamic sweeps for bare working electrode at pH7 at 20°C
(blue), 40°C (green), 80° (red) after 24 hours.

44
Figure 18. Potentiodynamic sweeps for bare working electrode at pH10 at 20°C
(blue), 40°C (green), after 24 hours.
It can be seen from Figures 16-18 that the potentials in these tests were very low
and decreased with increasing in pH. The potential also shifted slight with
increasing of the temperature in noble direction. In the test under condition of
pH10 at 80°C the potentiostat could not record the cathodic and anodic curves
for the unknown reason (Figure 18).
Figure 19 show the galvanic corrosion measurements after polarization of the
both electrodes. Due to a set-up error at the start of this work, the curves for
first four experiments (at pH7 at 20, 40°C and at pH10 at 20, 40°C). Rest curves
showed that the corrosion rate increased with the temperature increasing. Lei
Zhang et al reported that within the temperature increasing to 90°, the corrosion
type of X65 steel changes from general corrosion to localized corrosion [40]. The
Figure 20 shows the temperature effect on corrosion rate of steel.
More stable and more negative current value covered coupon showed at pH3 at
80°C. At pH7 at 80°C, Fe+S electrode showed positive current value first eighteen
hours. Then current very rapidly decreased from 13.7 µA to -114.5 µA pointed
out pitting. Presence of pitting was observed after the pictures of surface were

45
tacken (Figure 1, picture 4 in appendix 2). During next hour it increased to 16.83
µA. At pH10 at 80°C current was near zero value first 21 hours. During one hour
it dropped till -150.5 µA rapidly. This permit to suggest the pitting on the surface
of covered electrode. Next two hours current rose.
Figure 19. Galvanic corrosion: pH10 at 40°C (blue); pH3 at 40°C (red); pH7 at 80°C
(purple); pH10 at 80°C (green); pH3 at 80°C (brown).
Table 7. Galvanic current for covered electrode in coupling Fe/Fe+S (µA).
temperature pH3 pH7 pH10
20 ------ ------ ------
40 -21.47 ------ -10.15
80 -81.73 17.75 -0.819
Table 7 shows the data from galvanic scan in Series 1. Only under conditions of
pH7 at 80°C current showed positive value. Lack of the values in rest experiments
not allowed tracing the trend under conditions of 20°C. The reason of failure
could be investigated in future work.

46
Figure 20. Effect of temperature on corrosion rate of the steel [40].
Figure 21 shows the picture of the bare working electrode taken after the end of
the experiment at pH10 at 80°C. It shows that steel suffered from general
corrosion. Figure 22 is the picture of the covered with elemental sulfur working
electrode in the same experiment. It can be seen that the surface is covered with
a thick black film which has protected surface from general corrosion, but
presence of pitting was also observed.
Figure 21. Surface of bare carbon steel electrode (pH10 at 80°C).

47
Figure 22. Surface of covered with elemental sulfur carbon steel electrode (pH10
at 80°C).
Before the exposure in electrolyte, the surface of one working electrode which
suggested being covered was coated with powder (elemental sulfur or iron
sulfide). To hold the powder the Teflon tape was used. Not the entire surface
was covered with film agent. This is easier to see in Figure 23.
Figure 23. Picture of covered with Teflon tape and bare working electrodes.
Figure 24 shows one of the example of this situation there the uncovered region
suffered from localized/pitting corrosion in the border of tape and thick black

48
film under the tape. Elemental sulfur particles can form a block area on coupon
when coupons are partially covered by elemental sulfur which increases the
tendency of localized corrosion. Meanwhile, sulfur particles can absorb sulfur
ions to form Sy-1·S²¯ which can directly participate in cathodic reactions. When
coupons are uniformly covered by elemental sulfur particles in forms of
deposited, molten or paste characters, corrosion occurs just under the sulfur-
coverage area [39].
Moreover, during the all tests formation of thin black layer was observed on the
surface of the bare carbon steel electrode. Could be likely because of both
electrodes were in the same cell and precipitation of dissolved sulfur occurred.
Figure 24. Surface of covered with elemental sulfur electrode (pH10 at 20°C)
after removal of Teflon tape.
Series 2
Experimental procedure for Series 2 was the same as for Series 1. One of the
working electrodes in couple was covered with iron sulfide powder instead of
elemental sulfur. During the tests bare electrodes behaved usually like an anodes
(see the Table 5). In three tests of nine the opposite results were observed. The
covered electrode was a cathode. But only at conditions of pH10 at 40°C covered
electrode reminded cathode till the end of running. Rest potentials decreased
with the time.

49
Figures 25-27 show the polarization scan for FeS electrode at pH 7-10 at the
different temperatures after first 15 minutes of experiments. With increasing in
pH the potential decreased not significantly. Corrosion rate increased with
increase of the temperature. The shift of the potential lies in a region between -
579 and -847 mV (SCE). From Figures 25 and 27 it can be seen the suppressed the
cathodic reactions in the lower overpotential ranges.
At pH3 at 20°C on cathodic curve can be seen small oscillation with increasing in
current, whereas the anodic current was not affected (Figure 25).
In Figure 24 it can be seen that the polarization curves (pH7 at 80°C) a lower
starting potential for the cathodic and anodic sweeps. The anodic potential was -
847 mV (SCE). The cathodic line represents the hydrogen reduction region and
slight shift in current for further cathodic reaction, whereas the anodic current
was affected and increased with increasing in potential. The presence of
oscillation was observed in both cathodic and anodic sweeps. One of the reasons
could be that the potentials of the reactions were in very negative region (up to -
1.125 V for anodic steps).
At pH10 at 80°C it can be seen that the limiting current which affected anodic
reactions after the potential increased to approximately -625 mV (SCE) (Figure
27). The passivation region was obtained. All curves (Figures 25-27) show no
significant shift with the temperature and pH changes (only pH7 at 80°C). The
potential decreased slightly with the temperature and pH increasing. More
negative values obtained at pH7.

50
Figure 25. Potentiodynamic sweeps for covered with iron sulfide working
electrode at pH3 at 20°C (blue), 40°C (green),80°(red) after 15 minutes.
Figure 26. Potentiodynamic sweeps for covered with iron sulfide working
electrode at pH7 at 20°C (blue), 40°C (green),80°(red) after 15 minutes.
51
Figure 27. Potentiodynamic sweeps for covered with iron sulfide working
electrode at pH10 at 20°C (blue), 40°C (green),80°(red) after 15 minutes.
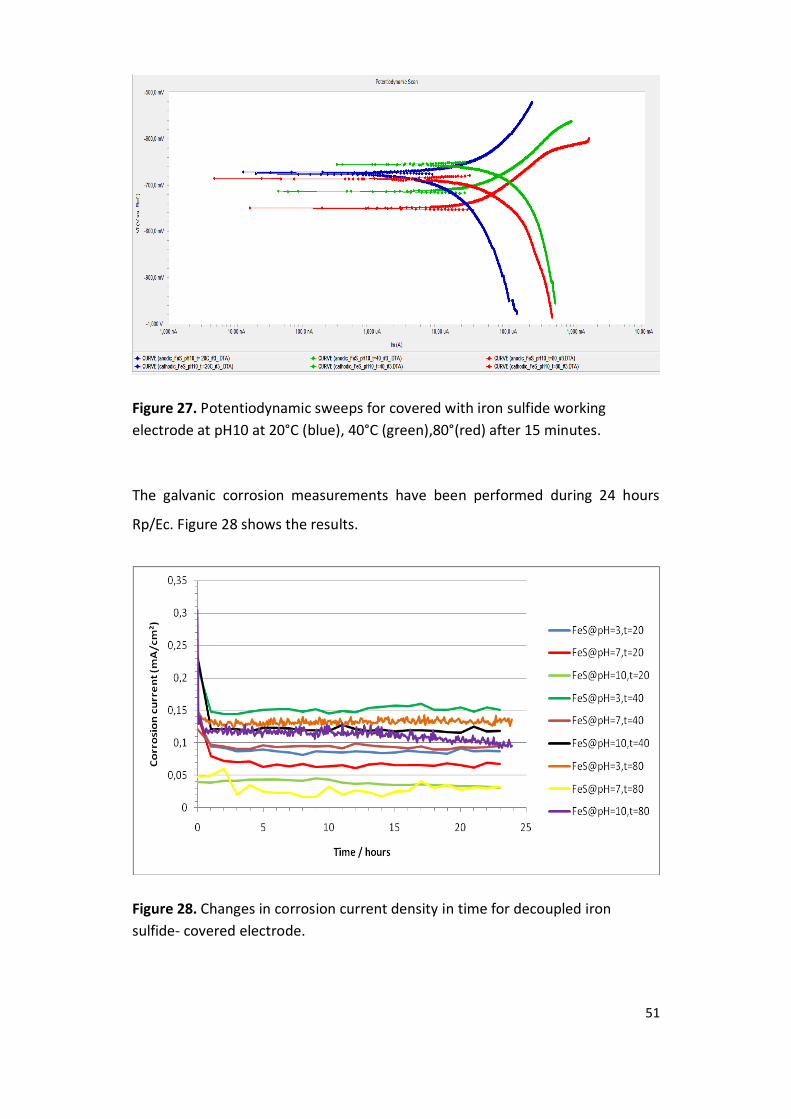
The galvanic corrosion measurements have been performed during 24 hours
Rp/Ec. Figure 28 shows the results.
Figure 28. Changes in corrosion current density in time for decoupled iron
sulfide- covered electrode.

52
At the beginning of all measurements current densities had maximum values but
during first hours were decreased and stabilized (Figure 28). The higher value at
the start shows line pH10 at 80°C. The line pH10 at 20°C shows most stable
trend.
The higher final value of current density is at pH3 at 40°C. As expected the higher
rate was at low pH value (pH3) and high temperatures (40, 80°C). The theory
considers the iron sulfide produced by corrosion is insoluble at normal pH`s and
can form the film which protects metal. Lower pH makes iron sulfide more
soluble, thus keeping the film from formation.
But also the relative high values were at pH10 at 40, 80°C, which does not match
the theory.
As in Series 1, after Rp/Ec trend the polarizations scans were made. The big
difference between anodic and cathodic potential values was observed. The shift
in potentials lies in the range between -658 and -952 mV (SCE). The potential
decreased with pH increasing. At pH3 at 40°C anodic potential showed the lower
value (-920 mV (SCE)) at 40°C (Figure 29).
During the tests at pH 7, the rapid increase in applied potential of both anodic
and cathodic reaction was observed with sufficiently negative values (Figure 30).
Current increased not significantly. At the temperature 80°C, cathodic line shows
some reduction of non hydrogen species, suggesting reduction of water and
sulfur species. Figure 31 shows very low potential values for the both anodic and
cathodic steps. It also can be observed in Table 5. The suddenly increase of
anodic potentials with no increasing in current permit to suggesting a passive
region. The cathodic reactions were dominated. That could be interpreted as a
protective film formation. This was confirmed by visual inspection of the coupon
after removal from the cell. Only the surface of the coupon exposed at pH10 at
80°C had an evidence of the localized corrosion (Figure 2, picture 2 in appendix
2). The rest two coupons were covered with thin black film non-adherent and
cracks easily. The surface remained metal bright (Figure 2, picture 6 in appendix
2) after the film was removed.

53
Figure 29. Potentiodynamic sweeps for covered with elemental sulfur working
electrode at pH3 at 20°C (blue), 40°C (green), 80°C (red) after 24 hours.
Figure 30. Potentiodynamic sweeps for covered with elemental sulfur working
electrode at pH7 at 20°C (blue), 40°C (green), 80°C (red) after 24 hours.

54
Figure 31. Potentiodynamic sweeps for covered with elemental sulfur working
electrode at pH10 at 20°C (blue), 40°C (green), 80°C (red) after 24 hours.
The potentiodynamic scans for bare steel electrode were carried out after
polarization sweeps of covered electrode. The more disturb oscillations took
place during measurements. It was not possible to read clear information of
polarization steps (Figure 32). To determine the possible cause of problem setup
was assembled every time the noise was present. Working electrode was tested
in three-electrode cell with electrolyte. The polarization sweep was carried out
without any evidence of deviation. Reference electrode was tested with
ammeter. Also the test of counter electrode was carried out . Inspection showed
no problems with equipment. It is mean that the problem was with local
electronic environment or chemistry. The chemistry problem is more likely.
Electrochemical oscillations can result from either electrochemical or purely
chemical origins. An electrochemical oscillation is dependent on the interfacial
potential while a purely chemical oscillator is not [40]. During the polarization
scans the anodic potential was in a rage of -675 to -990 mV (SCE) (Figure 3 in
appendix 2). Such a low values could be a reason of the oscillations. The sours of
distortion should be investigated further.

55
Figure 32. Potentiodynamic sweeps for bare working electrode at pH3 at 20°C
(blue), 40°C (green), 80°(red) after 24 hours.
Figure 33. Galvanic corrosion scans for Fe/FeS couple in Series 2.

56
Figure 33 plots the galvanic corrosion measurements in Series 2. It can be clearly
seen that tow curves have positive going scan under the conditions of pH7 at
80°C and pH3 at 40°C. This indicates that the iron sulfide-covered electrode was
forced to corrode by bare electrode in galvanic coupling. Rest curves showed
negative current values at the start of the test. The overview of the final current
values is given in Table 8.
Table 8. Galvanic current for covered electrode in coupling Fe/FeS (µA).
Temperature pH3 pH7 pH10
20 -1.581 0.958 19.57
40 15.57 2.103 -0.355
80 0.110 4.98 -0.430
These results indicate that at the pH3 at 20°C, pH10 at 40°C and pH10 at 80°C
negative going scan appeared over a period of test. In other experiments current
became positive after first 3-5 hours. It was concluded that covered electrode
will be corroded. After all test the pictures of electrodes were taken. Figure 2 in
Appendix 2 shows no presence of corrosion on the surface of covered electrodes.
Surface of bare steel electrode in all tests was covered with thin black layer. Only
in two tests at pH7 at 40°C and pH10 at 40°C the evidence of general corrosion
was observed while the surface of covered electrode remained metallic bright
under the iron sulfide. These results are not contradict the OCP measurements
(Figure 8) which showed that almost in all cases the bare electrodes had lower
potential and acted as anode. But in the same moment the data obtained during
galvanic corrosion scan shows opposite behavior of bare steel electrode. The
reason for this may be that during Rp/Ec trend the electrodes were decoupled
and the bare electrode corroded freely without any effect of covered electrode.
After 24 hours of test running the iron sulfide-covered electrode started to
corrode not significantly and bare electrode was protected by thin film from

57
further corrosion (Figure 34). The pictures of the covered electrode show that
the corrosion products were mostly generated at the periphery of the iron
sulfide pellet [41] uncovered with the Teflon tape (Figure 35). The corrosion type
in this region is crevice and it could be a reason of positive current values for iron
sulfide- covered electrode during galvanic corrosion scan.
Figure 34. Surface of bare carbon steel electrode at pH7 at 80°C.
Figure 35. Surface of covered (FeS) electrode at pH7 at 80°C after black film has
been removed.

58
Results from the study of carbon steel covered with iron sulfide showed that the
surface of electrode remained protected against the corrosion compared to
elemental sulfur-covered electrode even at high pH and high temperature.
Whereas the surface of sulfur-covered steel protected with thick film suffered
with pitting corrosion. The process could be accelerated by presence of chloride
played an important role in the corrosion process and indicated that
electrochemical reactions may underpin elemental sulfur corrosion [23].

59
6 CONCLUSIONS
From the experiments performed on carbon steel X65 with elemental sulfur and
iron sulfide as film formation agents coupled galvanically to similar metals, the
following conclusions can be made:
In galvanic coupling between two similar metals, the covered electrode
was protected by corrosion products film from general corrosion. This
trend was obtained even at low pH and high temperature.
The corrosion type of covered electrode changed from general to
localized/pitting with increase of temperature.
The corrosion rate in general was high for lower pH and high
temperature.
In the cases with elemental sulfur-covered electrode, the presence of
localized corrosion was obtained on covered electrode and bare
electrode had general corrosion.
In the cases with iron sulfide-covered electrode, the corrosion products
protective layer was loose and cracked easily compared to elemental
sulfur tests. After removal of the film surface of covered electrode
remained metallic bright with no evidence of corrosion attack.

60
7 RECOMMENDATIONS AND FUTURE WORK
Because of the short term of the projects, the many questions related to the
topic remained open. The following recommendations could be taking into
consideration for future work
The more accurate adjustment and monitoring of pH level.
The different way to hold on the sulfur or iron sulfide powder on the
surface of studied electrode, which could easier provide the access of
electrolyte.
The extending of the tests period.
Further study of weight loss and analysis of corrosion products
composition with study of morphology of the coupons surface and film
thickness could be done.

61
REFERENCES
1. J. Kvarekal, Morphology of Locolized Corrosion Attacks in Sour
Environments, NACE, Corrosion 2007, Paper No.07659.
2. Metals Handbook, Ninth Edition, Vol.11, Failure Analysis & Prevention, ASM
International, 1986, Paper No. 298.
3. R.N.Tuttle, Guideline Aid in Designing for H₂S Service, H₂S Corrosion in Oil &
Gas Production – A Compilation of Classic Paper, 1981, Paper No. 1077.
4. X.L. Cheng, H.Y. Ma, J.P. Zhang, X. Chen, S.H. Chen, and H.Q. Yang,
Corrosion of Iron in Acid Solutions with Hydrogen Sulfide.
5. Sulfide Stress Cracking Resistant Metallic Materials for Oilfield Equipment,
Standart MR0175-88, NACE, Houston (1988).
6. R.N. Tuttle, What Is a Sour Environment? , SPE, Tuttle & Assocs, 1990.
7. A.N. Cavallaro, Overview of H₂S Souring Cases in Argentina Reservoirs: Orgin
and Mitigation Sceneries, SPE 107376, 2007.
8. N. Lukachenko, P. Bourges et al, Recent experience on sour service resistant
steels behavior, NACE, Corrosion 2009, Paper No.09352.
9. J. W. Wallace, R.V. Reddy, D.V. Pugh, Sour Service Pit Growth Prediction of
Carbon Steel Using Extreme Value Statistics, NACE 2007, Paper No. 07657.
10. R.V. Reddy, J.L. Pacheco, Accurate Corrosion Prediction through an
Integrate Approach, IPTC 10675. Doha, Qatar, 2005.
11. NORSOK standard M-001, Materials selection, Rev. 4, August 2004.
12. J. B. Sardisco and R. E. Pitts, "Corrosion of Iron in an H₂S - CO₂ - H₂O
System", Corrosion 21 (1965), Paper No. 350.
13. J. Amri, J. Kvarekvål, Simultation of Solid state Growth of Iron Sulfide in Sour
Corrosion Conditions, NACE, 2011, Paper No. 11078.
14. W. Sun, Kinetics of iron carbonates and iron sulfide scale formation in
CO₂/H₂S corrosion, 2006.

62
15. H. Fang, D. Young and S. Nesie, Elemental sulfur corrosion of mild steel at
high concentration of sodium chloride, NACE International, 2009, Paper No.
2592.
16. Z. Zhu, Ph.D., EIT, N. Tajallipour, Ph.D., EIT, Patrick J. Teevens, CD, P.Eng.,
MCIC, Modeling of Elemental Sulfur Deposition in Sour-Gas Petroleum
Pipelines, NACE, Corrosion 2011, Paper No. 11124.
17. G. Schmitt, "Present Day Knowledge of the Effect of Elemental Sulfur on
Corrosion in Sour as Systems", Corrosion/90, Paper No. 39, Houston, TX
NACE (1990).
18. D. D. MacDonald, B. Roberts, J. B. Hyne, "The Corrosion of Carbon Steel by
Wet Elemental Sulfur, Corrosion Science 18 (1978) 411.
19. J. S. Smith, J. D. A. Miller, "Nature of Sulfides and Their Corrosive Effect on
Ferrous Metals: A Review," Brit. Corrosion J. 10, 3 (1975).
20. S. Smith, J. Pacheco, "Prediction of Corrosion in Slightly Sour Environments,"
Corrosion 2002, Paper No. 241 (Houston, TX: NACE, 2002).
21. D. Abayarathna, A. Naraghi, N. Obeyesekere, Inhibition of Corrosion of
Carbon Steel in the presence of C0₂, H₂S and S, Corrosion 2003, Paper No.
03340.
22. R. Steudel, “Mechanism for the Formation of Elemental Sulfur from
Aqueous Sulfide in Chemical and Microbiological Desulfurization
Processes”, Industrial Engineering & Chemistry,Research, 1996, 35, 1417-
1423.
23. H. Fang, B. Brown, D. Young, S. Nesic, Investigation of Elemental sulfur
Corrosion Mechanisms, NACE Corrosion 2011, Paper No. 11398.
24. L. Zhang, W. Zhong, J. Yang, T. Gu, X. Xiao, and Minxu, Effects of
Temperature and Partial Pressure on H₂S/CO₂ Corrosion of Pipeline Steel in
Sour Conditions, Corrosion 2011, Paper No. 11079.
25. W. Sun and S. Nesic, A Mechanistic Model of H₂S Corrosion of Mild Steel,
Corrosion 2007, Paper No. 07655.
26. R. C. John, A. L. Young, New Understanding on Corrosion of Alloys in High-
Temperature Sulfidizing Gases, Corrosion 2002, Paper No. 02486.

63
27. D.W Shoesmith, et al., The Formation of Ferrous Monosulfide Polymorphs
during the Corrosion of Iron by Aqueous Hydrogen Sulfide at 210C.
Electrochemical Society, 1980, Paper No. 1007-1015.
28. Z.A. Forouli, Electrochemical behavior and corrosion of iron in aqueous
sulfidic solution, Werkstoffe and Korrosion, 1980, pp 463-470.
29. W. F. Rogers, J.A. Rowe Jr, Corrosion Effects Of Hydrogen Sulfide and
Carbon Dioxide in Oil Production, Proceeding 4th World Petroleum
Congress-Section II/G, Paper 3.
30. Gamry Instrument,
http://www.gamry.com/App_Notes/DC_Corrosion/GettingStartedWithEche
mCorrMeasurements.htm.
31. D.G. Enos, The Potentiodynamic Polarization Scan, Technical report 33,
1997.
32. Materials Evaluation and Engineering, Inc., 2009.
33. S. Ewing, Electrochemical Studies of the Hydrogen Sulfide Corrosion
Mechanism, South Central Regional Meet. NACE, Tulsa, Oklahoma, Oct.,
1953 (Unpublished).
34. T. Hemmingsen, N. Aagotnes, T. Havn, Characterisation of sulphur
compounds and examination of their effects with respect to corrosion, 2004
35. M. Pourbaix, “Atlas of Electrochemical Equilibria in Aqueous Solutions,”
NACE-Cebelcor, 1974.
36. C. Mendez, C. Scott, Laboratory Evaluation and Modeling of API-L80/13CR
Galvanic Corrosion in CO2 Environment, NACE 2008, p.08325.]
37. J. Tang, Y. Shao, Corrosion Behavior of Carbon Steel in Different
Concentration of HCl solution containing H₂S at 90°C, Elsevier,Corrosion
Science 53, 2011
38. Dr. P. Peterson, Gamry instruments, NACE presentation.
39. L. Zhang, Z. Wen et al, Effect of Deposition Characteristic and temperature
on Elemental Sulfur Corrosion, NACE Corrosion 2011, Paper No. 11121.
40. K. Krischer , in: Alkire R.C. (Ed.), Advances in Electrochemical Science and
Engineering, vol. 8, Wiley-VCH Verlag GmbH & Co, 2002.

64
41. H. Fang, D. Young and S. Nesie, Elemental Sulfur Corrosion of MIild Stseel at
High Concentration of Sodium Chloride, NACE International, 2009, Paper
No.2592.

65
APPENDIX 1
Figure 1. Certificate of carbon pipeline steel X65

66
APPENDIX 2
Bare steel (Fe)
Covered steel with sulfur (Fe+S)
Description p
H 3
at
80
°C
1
2
1).Presence of thick black film,
local corrosion traces;
2). Thick black film, general
corrosion traces.
pH
7 a
t 8
0°C
3
4
3). Thin black film, easily to
remove, general corrosion;
4). Thick black film, general
corrosion traces.
pH
7 a
t 20
°C
5
6
5). Thin black film, under the
film metal remained metallic
bright, steel suffered local
corrosion;
6). Thick black film, presence
of localized corrosion in non-
covered region, several pits.
pH
10
at 4
0°C
7
8
7). Thick black film, surface
suffered with localized
corrosion;
8). Thick black film, presence
of pitting corrosion in non-
covered region and near.
Figure 1. Morphology of steel surface of bare and covered electrodes in Series 1.

67
Bare steel (Fe)
Covered steel iron sulfide (FeS)
Description p
H10
at
80
°C
1
2
1). Thin black film, hard to
remove, no evidences of
changes due to corrosion;
2). Thin black film, after
removal, evidences of
localized corrosion, surface
darkened slightly.
pH
3 a
t 2
0°C
3
4
3). No black film on the
surface, traces of localized
corrosion;
4). Thick black film, after
removal the surface slightly
darkened, no evidence of
corrosion attack.
pH
10
at
40
°C
5
6
5). Thin black film, hard to
remove, traces of localized
corrosion;
6). Thin black film, non-
adherent and cracks easily,
no evidence of corrosion
attack.
pH
7 a
t 40
°C
7
8
7). Thin black film, localized
corrosion;
8). Thin black film, non-
adherent and cracks easily,
surface under film slightly
darkened, no evidence of
corrosion attack.
Figure 2. Morphology of steel surface of bare and covered electrodes in Series 2.

68
Polarization sweeps for bare electrode (galvanic couple Fe/FeS) after 24 hours
(Series 2).
a).
b).
Figure 3. The potentiodynamic sweeps for bare working electrode after 24 hours:
a) pH3,b) pH7, at 20°C (blue), 40°C (green), 80°C(red).