ha 's in me shopp ng? - cornell...
TRANSCRIPT

April 19 6 E. . 96-05
ha 's In 0 f me Shopp ng?
r i ten P k o bra Per i
Gene A G rn n E vard W. L hlin

It is Policy ofCornell University actively to support equality
ofeducational and employment opportunity, No person shall be
denied admission to any educational program or activity or be
denied employment on the basis of any legally prohibited
discrimination invol '8, t not' 'ted to, such factors as race,
color, creed, religion, national or eth' origm, sex, age or
handicap. The University is committed to the maiDte ance of affirmative on pro . h will assure the continuation of
such equality of opportunity.

What's In Store for Home Shopping?
Kristen Park Debra Perosio
Gene A. German Edward W. McLaughlin
CORNELL UNIVERSITY Food Industry Management Program
$25 per copy Copies may be purchased from:
Food Industry Management Program 251 Warren Hall
Cornell University Ithaca, NY 14853
Phone (607) 255-1622 Fax (607) 255-4776
,

Abstract
Home shopping is currently being tested and tried by many supermarket companies. For many, home shopping could well be one method of gaining incremental customers and sales. The major purpose of this study was to determine the current status of home shopping services in the U.S. supermarket industry and to document consumers' reactions to the home shopping services provided.
In order to achieve these objectives, an integrated approach was employed consisting of a four part methodology: 1) a comprehensive review of research, trade literature, and other secondary information, 2) a mail survey to selected supermarket companies, 3) field visits and interviews with supermarket companies, and 4) consumer focus groups comprised of past, current and potential home shoppers.
From the retailer survey, our research found that 40 percent of respondents, or 24 companies, had home shopping services with an additional 18 percent indicating that they planned to offer home shopping in the next two years. Fully 75 percent of those offering home shopping used a contract service that performed part or all of the home shopping operations while only 25 percent managed and performed the entire operations themselves. However, retailers allowing third party contractors to operate their home shopping service due primarily to short run contingencies, may risk losing control of one of their single most valuable assets-their shopper data base.
This research with retailers and focus groups has identified a series of operational and marketing challenges confronting home shopping. Key challenges for home shopping services are to develop labor efficient yet user friendly ordering methods and to research processes that provide information needed by the consumer to make their shopping decisions. Visual signals, display areas, aromas, product demonstrations and explanations are all absent, so retailers must remember that the ordering method essentially replaces the entire information discovery process normally used by the consumer as they walk through the store.
In addition, picking orders from the supermarket shelves has inherent duplication of costs. Systems should be developed to eliminate such duplication of effort. Probably the biggest concern for consumers and retailers is the procedure for substituting products when out-of-stocks are encountered. Retailers are anxious to avoid out-of-stock situations as they lose sales every time a shopper attempts to buy product off of an empty shelf. In the case of home shopping, outof-stocks are a particular problem since the shopper cannot take part in the decision making process at the point of purchase.
Other issues facing home shopping providers include how shopping patterns change as consumers shift from shopping off supermarket shelves to home shopping catalogue shelves. In addition, competition from outside the traditional food retailing industry could develop from high tech firms, wholesalers and distributors, and delivery service providers as well as from manufacturer themselves.
Acknowledgements
This study would not have been possible without the encouragement and participation from a large number of sources. The project was funded for the major part by Kraft Foods, and the researchers would like to acknowledge them for providing the financial support and the vision that made this research possible. We would also like to thank the New York State Food Merchants Association for their support and interest in investigating this stimulating industry issue and for providing a forum for the initial presentation of the research at their 1995 Food New York State Food Merchants Association annual meeting and trade show.
In addition, we are grateful to all the industry members who cooperated by completing our industry survey and especially to those companies who donated their time to us in touring facilities and interviewing them in order to provide a greater understanding of the project and the issues involved.
Also, we would like to thank the participants in our focus groups who came after work and during their leisure time to speak to us about home shopping.
-

Table of Contents
Section I: Background and Literature Review 1 Demographics Affecting Shopping Patterns 1 Technology 5 Electronic Shopping 8
A History of Home Shopping Initiatives 9 Home Delivery Services 10 Home Shopping Contract Services for the Supermarket Industry 12
Peapod 12, Shoppers Express 13 Other Services 13
Consumer Issues 14 Operational Issues 16
Section II: Research Goals and Methodology 18 Section III: Empirical Results of Retailer Survey 20
Survey Respondent Profile 20 Retail Operational Practices ; 24
Home Shopping Customers 24 Home Shopping Managers 25 Company Characteristics 26 Operations 28 Selecting 32 Payment Methods 32 Labor 33 Promotion 34 Importance and Performance 35
Section IV: Consumer Perceptions of Home Shopping 37 General Demographic Profile ; 37 A Profile of Home Shoppers 39
Hi-Tech Baby Boomers 39 Older and Physically Challenged Home Shoppers .44 Experiences Common to Both Demographic Groups ~ .46
Section V: Supermarket Home Shopping: 51 Implications and Challenges 51 Appendix A 59
Selected International Home Shopping Services 59 Japan 59 The Netherlands 59 France 60 -Appendix B 63
Retailer Survey 63 References 74
111

List of Tables
Table 1. Percentage Offering Home Delivery 10 Table 2. Survey Response 21 Table 3. Comments 24 Table 4. Customer Demographics 25 Table 5. Experience with Home Shopping by Size ofFirm 28 Table 6. Estimated Growth in Home Shopping Orders and Sales 29 Table 7. Catalogue Types 30 Table 8. Catalogue Offerings 31 Table 9. Catalogue Product Selection 31 Table 10. Catalogue Product Selection from Harvest America 32 Table 11. Who Provides the Labor? 34 Table 12. Supermarket Labor Requirements 34 Table 13. Demographic Profile of Focus Group Participants 38 Table 14. Demographic Profile ofHi-Tech Baby Boomers .40 Table 15. Demographic Profile of Older and Physically Challenged Home Shoppers 45 Table 16. Top 20 Most Frequently Ordered Items 54
-
IV
j

Figure 1. Figure 2. Figure 3. Figure 4. Figure 5. Figure 6. Figure 7. Figure 8. Figure 9. Figure 10. Figure 11. Figure 12. Figure 13. Figure 14. Figure 15. Figure 16. Figure 17. Figure 18. Figure 19. Figure 20. Figure 21. Figure 22.
Figure 23.
List of Figures
Women in the Work Force, 1980-93 2 Percent of Households with One and Two Earners 3 Percent of Total Income from Dual and Single Income Households 4 Predicted Number of Households with Computers and Modems 6 Subscribers to On-line Services 7 Home Delivery Service Offered by Company Size 11 Home Delivery Service Offered by Geographic Region 12 Supermarket Shopping Comfort Index 15 Convenience Index of Home Shopping 16 Problem Index for Supermarket Offering Home Delivery 17 Respondents by Firm Size 20 Home Shopping Services Offered by Respondents 22 Home Shopping Services Offered within Two years 23 Home Shopping Services Offered in the Past.. 23 Who's Managing the Home Shopping "Store"? 25 Companies with Home Shopping by Number of Stores 26 Companies with Home Shopping by Annual Sales 27 Experience with Home Shopping 28 Ordering Methods Available and Used 30 Payment Methods 33 Promotion Methods Used by Supermarkets for Home Shopping 35 Importance of Home Shopping in Contributing Toward Selected Firm Objectives 36 Home Shopping Performance in Achieving Selected Performance Objectives 36
-
v

Section I: Background and Literature Review
Although grocers have offered home delivery services for their customers since the beginning of the grocery store, over 100 years ago, businesses have frequently returned to the idea of offering a more complete service that includes ordering supermarket items directly from the home. However, despite numerous experiments, persuading customers to actually shop and order their supermarket goods from the home has been difficult. Moreover, retailers have not been able to develop the logistical system needed to make home shopping a profitable venture.
In the 1990s, changing demographics, technologies, and food system structure has spurred interest in home shopping once more. This study investigated the concept of home shopping as a simple delivery service and as a complete service that could lead to a change in the way customers shop for goods. In this case, shopping for and ordering supermarket items from the home by an ever expanding number of methods as well as delivering the items either via the home, office, store pick-up, etc. are critical to defining and understanding the new initiatives in home shopping.
Emerging technologies as well as increased consumer demands for ease and convenience have focused attention on the feasibility of shopping from the home. Home shopping is not a new idea. It has been studied repeatedly over the past three decades, and, indeed, several retailers have experimented with home shopping in the past. One notable collaboration, for example, has been the Sears Roebuck Co. venture joint with IBM. Few of these early initiatives resulted in success. However, by the mid 1990s, new designs, equipment, and changing demographics and society stimulated retailers to once more investigate home shopping services.
Demographics Affecting Shopping Patterns
A growing body of evidence indicates that American consumers are willing and able to spend their food dollars for convenience in food preparation, packaging, and food shopping. Many time-pressed consumers do not elect to spend their leisure hours shopping in the supermarket for groceries.
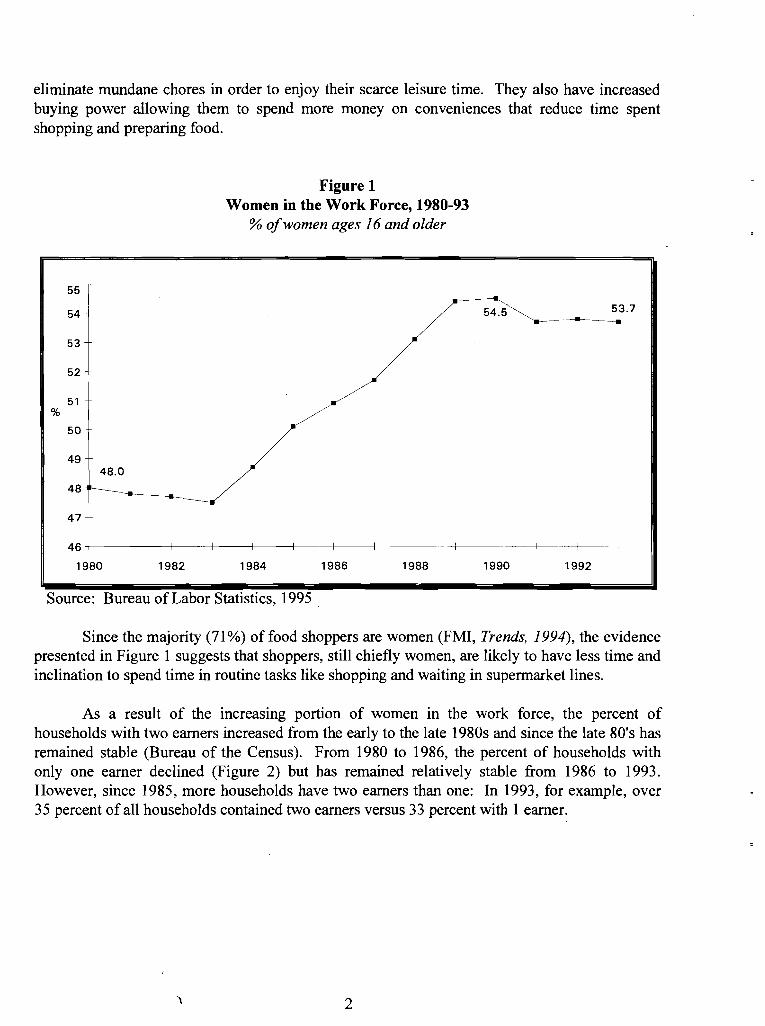
Demographic trends highlight the need for easy, convenient shopping. The percent of women working outside the home increased over the last 40 years to level off in the late 1980s. Forty-eight percent of women ages 16 and over participated in the work force in 1980 (Figure 1). During the 1980s, women participation in the work force grew steadily as individual earnings refused to keep up with inflation and women entered the work force to maintain their families' standard of living. Participation peaked at 54.5 percent in 1990 and has remained fairly stable since then.
The entry of more women in the work force served to increase the number of dual income households and resultingly provided the household with more income but at the same time eliminated time needed to perform traditional household chores. As these dual income families encounter ever-mounting time pressures, they often prefer to pay more for convenience and
1
--------
eliminate mundane chores in order to enjoy their scarce leisure time. They also have increased buying power allowing them to spend more money on conveniences that reduce time spent shopping and preparing food.
Figure 1 Women in the Work Force, 1980-93
% ofwomen ages 16 and older
55 T 54
53 152
51 %
50
49 48.0
48 -47
46 +----+-----j---+-----+-------jf------+----+--------j----+-----+----f----------+--
1980 1982 1984 1986 1988 1990 1992
Source: Bureau of Labor Statistics, 1995 .
Since the majority (71 %) of food shoppers are women (FMI, Trends, 1994), the evidence presented in Figure 1 suggests that shoppers, still chiefly women, are likely to have less time and inclination to spend time in routine tasks like shopping and waiting in supermarket lines.
As a result of the increasing portion of women in the work force, the percent of households with two earners increased from the early to the late 1980s and since the late 80's has remained stable (Bureau of the Census). From 1980 to 1986, the percent of households with only one earner declined (Figure 2) but has remained relatively stable from 1986 to 1993. However, since 1985, more households have two earners than one: In 1993, for example, over 35 percent of all households contained two earners versus 33 percent with 1 earner.
-
2

------------------
Figure 2 Percent of Households with One and Two Earners
35
%
of 34
HH ~--
33 t -~~,-, /-/ --~
I 32 +-:---J--+-- -+----+----+--+----+----+--+----+-- -I ---- +
198019811982 1983 1984 1985 1986 1987 1988 1989199019911992 1993
----- 2 earner household-=-_---::- l=~~~~h~useholds Il ~
Source: Bureau of the Census, 1995.
Demographic trends also show that the number of households is increasing. The estimated number of households in 1995 is 98,700 and by 2010 is expected to be 114,700 (Bureau of the Census, 1995). Therefore, even though the percent of total households that have dual incomes has remained constant since the late 1980s, the absolute number of dual income households is still increasing.
Dual income households also earn a significant portion of the total U.S. earned income. In 1980, households with two incomes earned 42.0 percent of total U.S. income while in 1993 this figure had risen to 47.5 percent (Figure 3). Meanwhile, the portion of overall income earned by households with only one income fell slightly from 30.6 percent to 27.0 percent of the total income.
-
3

50
0/0
Figure 3 Percent of Total Income from Dual and Single Income Households
45 +------------------=----::==='--'.I-----.~~-~=-==---=-----~---j._--.-------------
40 +---------------------------------
35 +------------------------------------
30r---" -~ -~~~ ~~"k~~~~~_n=:~~~_~ ,~ ~ ,,_ ~__ ~_ ~,- ,
25 +- 1-- --+----+----1
198019811982198319841985198619871988198919901991 19921993
l-- 2 earners ---D-- 1 earner I Source: Bureau of the Census, 1995.
The makeup of single earner households has shifted slightly in a manner that generally increases desires for added conveniences. A significant number of single earners are single person households composed of young adults entering the work force and maintaining their own household or single parents with children. These consumers have a lower income than the dual income households, however, the single person households can spend without the pressures of providing for a family. Leisure time is also important to these households, and they will spend for convenience if it will eliminate some of their mundane chores. Young householders number about 5 million which is projected to remain steady.
Increasing numbers of the elderly also maintain their own households until later in life and often live by themselves as many may have lost a spouse. In 1980, 11.3 percent, or 25.5 million, of the U.S. population was 65 and older (Bureau of the Census, 1995). In 1990 the percent of the population 65 and older increased to 12.5 percent, and in the year 2000, this percent is expected to increase again to 12.7 percent or 34.9 million persons (Bureau of the Census). -
Conveniences for all these single income households are very important as they try to maintain their households without the benefit of help from other adults.
4

Technology
In addition to changing demographics, advancing technology has offered many possible options for progressive home shopping services. New or improved technologies make it easier and potentially more rewarding for consumers to shop from the home (or office) and place their orders with the appropriate "retailer." Moreover, as the cost of technology continues to decline, consumers and retailers are able to afford new PC's with modems, improved software with networking capabilities, facsimile machines, and cable TV, all of which make shopping at home easier and more practical.
The introduction of facsimile machines to supermarkets has made it possible for centralized, contract service operators to receive phone orders from consumers nationwide and to fax hard copies of their shopping orders to the. appropriate local retailer within minutes. Consumers who own or have access to fax machines may also fax their orders to the home shopping services.
The penetration of personal computers into the American household has also made shopping at home easier and has influenced the way retailers look at the future of home shopping. According to a survey by Leo 1. Shapiro & Associates, 37 percent of American households surveyed owned a personal desktop or laptop computer. In addition, seven million multimedia PC's were sold to homes in 1994 alone (Reda, 1995). Fox (1995) also reported that most of the PC's sold to consumers at the Christmas holiday period of 1994 had built-in modems and software for logging onto one of the on-line services that, in tum, facilitate home shopping orders.
Maresca (1995) predicted that by 1999 over 63 million households would have a computer and 51 million of those (80%) would have computers with modems (Figure 4). This is a significant increase from 1995 predictions which indicated that a total of almost 39 million households will own a computer and that only 22.3 million (57%) of those will have a modem.
-
5'.

Figure 4 Predicted Number of Households with Computers and Modems
millions ofhouseholds with computers
:: f ~ 50
millions
of 40
HH
30
I0 w"hoo' mod,m, .
• with modems J 20
10
0
1994 1995 1996 1998 1999
_
I
13.6
1997
14.8
!
16.9
Source: Maresca, 1995.
These PC owners with modems can shop from retailer "catalogues" on their computers and then send the order directly into the home shopping service via the computer modem and telephone wire. The method and technology is fast and convenient for many consumers. The "catalogues" may be sent to consumers on diskette as a "catalogue kit" which contains the software for calling into a centralized home shopping service and logging onto a catalogue can be updated daily. Retailer catalogues can also be offered on-line with some of the major on-line companies, such as CompuServe, Prodigy or America Online. When a consumer subscribes to any of these on-line companies, he or she then has access to a number of services, one of which may be on-line shopping catalogues. CD-ROMs, the Internet, and the Web are also vehicles which may be used by consumers to shop for goods from their computer.
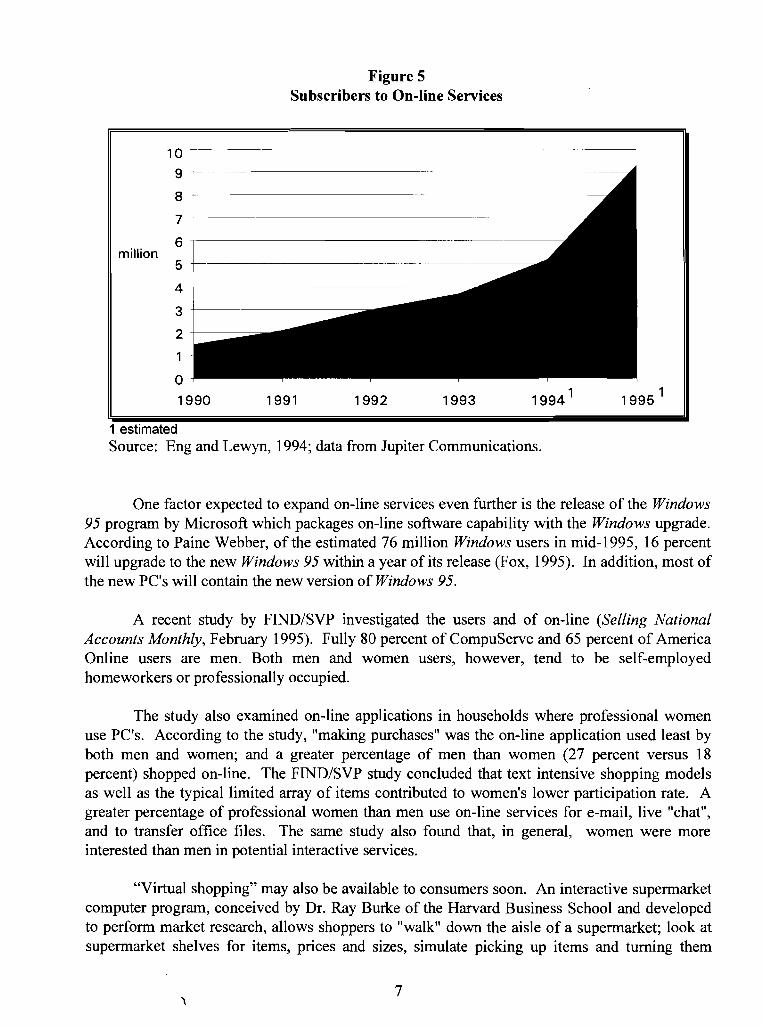
Eng and Lewyn (1994) estimated that subscriptions to on-line services would escalate dramatically (Figure 7). Reda (1995) reported that seven million consumers currently subscribe to an on-line service such as CompuServe, Prodigy, or America Online. By the end of the decade, Sandy Goldman, president of ShopperVision of Norcross, Georgia predicts more than 30 million users will subscribe to on-line services (Chain Store Age Executive, April 1995).
-
6
-
Figure 5 Subscribers to On-line Services
10 ,---------------------~~---------
9 ----~---------------
8
7 +-------------------------~----~
million --------_. ---~_._-------~:t
4 I
I 3
2
0 1990 1991 1992 1993 1994 1 1995 1
1 estimated Source: Eng and Lewyn, 1994; data from Jupiter Communications.
One factor expected to expand on-line services even further is the release of the Windows 95 program by Microsoft which packages on-line software capability with the Windows upgrade. According to Paine Webber, of the estimated 76 million Windows users in mid-1995, 16 percent will upgrade to the new Windows 95 within a year of its release (Fox, 1995). In addition, most of the new PC's will contain the new version of Windows 95.
A recent study by FIND/SVP investigated the users and of on-line (Selling National Accounts Monthly, February 1995). Fully 80 percent of CompuServe and 65 percent of America Online users are men. Both men and women users, however, tend to be self-employed homeworkers or professionally occupied.
The study also examined on-line applications in households where professional women use PC's. According to the study, "making purchases" was the on-line application used least by both men and women; and a greater percentage of men than women (27 percent versus 18 percent) shopped on-line. The FIND/SVP study concluded that text intensive shopping models as well as the typical limited array of items contributed to women's lower participation rate. A greater percentage of professional women than men use on-line services for e-mail, live "chat", and to transfer office files. The same study also found that, in general, women were more interested than men in potential interactive services.
"Virtual shopping" may also be available to consumers soon. An interactive supermarket computer program, conceived by Dr. Ray Burke of the Harvard Business School and developed to perform market research, allows shoppers to "walk" down the aisle of a supermarket; look at supermarket shelves for items, prices and sizes, simulate picking up items and turning them
7

around to read the nutrition label; and make your purchase. A similar system is to be used by ShopperVision Express, a merger between Shoppers Express and ShopperVision, in the future.
Interactive shopping using 2-way TV networks -- where consumers can actually interact with the TV -- have been researched heavily by cable and by phone companies. Most of the regional Bell companies, the long-distance carriers, and the major cable companies have interactive video projects planned (Illingworth, 1994). The interactive services would combine video and telecommunications enabling consumers to shop from their home, rent movies and play video games on demand, and even view and order stamps from the U.S. Postal Service.
However, currently, technological problems as well as enormous costs have delayed projects and dampened enthusiasm within the communications industry. One prohibiting factor has been the cost of installing new fiber optic lines that can handle video to replace millions of miles of copper wiring (Cauley, 1995). Moreover, other emerging issues regarding legal and regulatory barriers preventing links between the various communications forms of phone, cable and entertainment also need to be addressed before interactive services will be available to the public (Illingworth).
Electronic Shopping
Many communication analysts predict an increase in electronic home shopping. Several predictions in 1994 called for electronic shopping to account for 20 to 40 percent of retail chain and supermarket sales by 2004 (Loro, 1994). Others predicted 5 percent (Reda, 1995) to 15 percent (Losee, 1994) of total retail sales in ten years (2004).
Jupiter Communications predicted that by 2002 17.6 percent of households will shop by interactive TV for a value of $10 billion (Chain Store Age Executive, April 1995). Experts also predict that by 2004, 28 percent of consumers will purchase $47 billion in groceries from their homes (Triplett, 1994).
By contrast, a study by Louis Harris & Associates reported that 32 percent of 1,000 adults polled said they had any desire to shop for products electronically. This was the lowest rate of among 14 interactive services described to participants (Food Institute Report, 1994).
-
8

A History of Home Shopping Initiatives
The late 1980s saw a rush of activity by companies interested in the notion of ordering groceries from the home (or office) and having them delivered without the consumer having to enter a store. Whereas home delivery had been available from a number of markets, enabling the consumer to order or indeed shop the entire supermarket from the home was seductive to many supermarket firms who saw this as a means of providing an additional consumer service, and, importantly, incremental sales. The advent of cable TV, home computers, and high speed modems have initiated several trials in the early mid 1990s which have provided the basis for many home shopping services offered today. Several prominent examples follow.
Harvest America (1986) is a mail-order company which selects grocery items from a warehouse and ships orders to customers via UPS. Harvest America focuses on staple items such as food, non-food groceries and health & beauty care items. Orders are received primarily by mail although fax and phone orders are accepted. Harvest America is reported to have the largest market penetration in home food shopping with a 22,000 customer base (Debow, 1995).
Telaction/Express Marketplace (1988 - 1989) was JC Penney's trial in home shopping. Telaction displayed food and non-food products over cable TV into consumers' homes. Consumers tuned into the Telaction TV channel and were then prompted to place a telephone call to "shop" at a particular retailer and to access a laser disc containing pictures and information about available products.
Nash Finch, a grocery wholesaler in the Midwest, provided the home food shopping services and operated out of a warehouse in a Chicago suburb. It offered more than 8,500 food and nonfood items and charged a $5 fee for delivery. JC Penney discontinued the project after disappointing demand.
Prodigy (1988-1992), Sears Roebuck & IBM partnership, is an on-line service that also offers home shopping. Although Prodigy used to offer home grocery shopping through participating supermarkets such as Dominicks in Chicago and Kroger in Dallas and Atlanta, it withdrew from that service in 1992. Since Prodigy is an on-line service, customers were limited to those individuals who owned or had access to a computer and were members of Prodigy.
On Prodigy, customers could shop through the "store aisles" or they could select their . personal shopping list and make any minor adjustments that were needed. A running tally of the bill was computed and changes in the order could be made at any time. The item selection was limited and did not include the entire store selection.
-
9

Home Delivery Services
Grocers have offered home delivery services for their customers since the inception of the grocery store and many firms still offer home delivery without offering complete home ordering services. A number of recent surveys have chartered the progress of home delivery in United States, and although they do not strictly identify those offering complete home shopping (which would include the home ordering process) they provide a good insight into the extent to which home delivery is being offered. Appendix B contains the description of several home shopping experiments in Europe and Asia.
According to a recent survey by Saint Joseph's University (Linneman, et ai, 1995), home delivery services are offered more frequently by smaller supermarket operations. The survey revealed that 38 percent of operations with 1 to 3 stores offered home delivery (Table 1) whereas only 14 percent of operations with 4 to 49 stores offered home delivery. Thirty-two percent of large operations, those with 50 stores or more, offered home delivery.
Table 1 Percentage Offering Home Delivery
Varies by Size of Operation
Number of stores Percentage offering
1-3 38% 4-49 14 50 or more 32
Source: Linneman, et aI., 1995.
Most smaller companies have also offered home delivery longer than most larger companies. According to the study by Saint Joseph's, most supermarkets with one to three stores have offered home delivery for four or more years, whereas most larger supermarkets have offered delivery for fewer than four years.
Also, smaller supermarkets may consider their delivery services more "established" as only 14 percent of them considered the service "experimental" compared to 46 percent of larger supermarkets.
The Food Marketing Institute reported home delivery offerings broken out by company sales (Figure 6). A greater percentage (35.7%) of companies with less than $10 million in sales offered home delivery than any other size company. This corresponds to the findings of Saint Joseph's that a greater percentage of smaller companies than larger companies offer this service.
10

Figure 6 Home Delivery Service Offered by Company Size
% ofcompanies
_._------ -._----~40 I
35.7 35
30
25
% 20
15
10
5
0
31.4
-, less than $10 - $30 $31- $100 $101- $250 $250 - $500 $501- $1 bil $1-$3 bil over $3 bil
$10
Source: Food Marketing Institute Speaks, 1994.
In the United States, the region with the highest proportion of stores offering home delivery appears to be the Mid-Atlantic region where approximately 12 percent of companies offer home delivery (Figure 7). In the Mountain region, only half of one percent of supermarket companies offer home delivery. Contrast this with Canada which offers home delivery in 31.3 percent of its supermarket companies.
11

Figure 7 Home Delivery Service Offered by Geographic Region
% ofcompanies
35
31.3
30+----
20+------
11.8
10
25 +--------------------------------
15 +----------------------------------
1.3
New Middle East West South West Mountain Pacific Canada England Atlantic North North east South
Central Central Central
Source: Food Marketing Institute Speaks, 1994.
Home Shopping Contract Services for the Supermarket Industry
Supermarket companies with home shopping services may perform all of the services internally, or they may contract with one or more companies to perform part or all of the home shopping services, including taking orders, picking the orders off the shelves, and delivery. Independent, entrepreneurial home shopping businesses also exist which perform all of the functions of home shopping and which often have some informal agreement with one of the supermarkets in its market area.
Peapod
Peapod operates an entire grocery home shopping service from ordering to delivery including promotion. The company currently operates in 2 regions: it contracts with Safeway in San Francisco and Jewel in Chicago to provide home shopping for their customers. Orders can be placed by fax, phone or computer. The majority of their orders are currently placed by the latter mode. The orders are received and selected by Peapod employees who then deliver the orders during a specified 90 minute period.
Peapod and the local supermarket contractor work together to develop shopping and delivery charges to their customers. In the Chicago market, Peapod charges a monthly
, 12
membership fee of $4.95, provides a starter kit with a computer program or catalogue for $29.95, plus a delivery fee of $6.95 and 5% or each order. In San Francisco, the fees include $29.95 for the starter kit and a $35 per month membership fee which covers unlimited shopping and delivery with a $40 minimum order.
The company serves approximately 9,000 households in Chicago and 3,000 in San Francisco (Grassroots, 1995) who choose from approximately 18,000 items. The computer catalogue offers an expanded product line and services unavailable in the printed catalogues such as current store prices. It can sort items by category, price, brands, etc., and the computer version can prompt the customer for further descriptions of their meat, produce and other perishables.. The computer kit also lists items on sale within the stores, and customers can also use coupons. "There is a much higher redemption of coupons through Peapod than the actual person walking through Jewel," says Peapod's Chicago marketing director, Derek Milligan (Food People, 1994).
Shoppers Express
"Shoppers Express" has contracts with supermarkets and drug stores in approximately 200 markets in the United States with its home orderinglhome delivery system. It receives phone, fax, or computer orders from customers into a centralized location. The orders are then faxed to the appropriate stores in aisle sequence for that particular store. Local supermarket personnel shop for the customers' orders and monitor them through the check-out lines. Shoppers Express subcontracts with a local courier or delivery firm to deliver the supermarket orders.
Shoppers Express' computer catalogues and program are available through America Online and offer similar capabilities as Peapod's computer software.
Other Services
Although Peapod and Shoppers Express are the two largest companies providing home shopping services for supermarkets, there are other new companies and local entrepreneurs who provide home shopping services.
"Shopping Alternatives," recently started in 1994, works with eight retailers including Wal-Mart, Scolari's, and Shaw's. One of its major clients is Walmart, with whom a Walmart home shopping service is currently being tested in Dallas. The company takes orders by phone,
.and forwards them to the appropriate store. As with Shoppers Express, trained store personnel select the order. Shopping Alternatives has also opened a Web page and offers free, downloadable software to enable home grocery shopping from those supermarkets that are offering home shopping through the company.
"Go Getters," owned and operated by Patty Hogan of Owego, New York, is an example of an independent, entrepreneur who provides a variety of personal service. Although grocery shopping is one of the services the business provides, it is also an errand and personal shopping servIce.
13
Go-Getters started in the home shopping services as the deliverer for a local supermarket. However, when the supermarket decided to discontinue its home shopping service, Go Getters took over. It works closely with the local supermarket which has expressed great satisfaction with the working relationship. Go Getters shops only at the supermarket stores. In return, the supermarket will open a checkout lane for Go Getters to quickly check out grocery orders, provides storage space in the backroom for bagged orders, and provides some discounts on items. If there is an out of stock situation with no substitutes available and Go Getters knows it needs to be filled, then personnel will shop around in other stores to find the needed item.
Consumer Issues
Little is known about how consumer shopping behavior changes when using home food shopping. In general, consumers shop to satisfy various needs, sometimes the least of which is to actually acquire the item(s) purchased. Determination of why and how people shop for groceries would help retailers better understand how to satisfy these needs with a home shopping service and therefore fit home shopping into their company's strategy of providing food to the consumer.
Shopping activities generally provide more than the simple utility of buying food for sustenance. Shoppers are motivated by a variety of factors which mayor may not be fulfilled by home shopping. Tauber (1972) listed several factors that may motivate people to go shopping. Understanding these factors and how they apply to consumers shopping for food will help firms develop home shopping services that satisfy some of these needs, and therefore, increase "consumer demand." Motives for shopping, as described by Tauber, for example, satisfy needs on personal and social levels. Personal motives can include such things as diversion from routine activities, and self-gratification from buying something "nice" for themselves. Role playing was described as an internalization of what is expected of ones self in the roles that one takes on or acquires. A typical role mentioned is the mother or housewife who may feel grocery shopping is an expected part of their role. Social motives involve needs for social experiences outside of the home. Social contact,· communication and peer attraction by shopping at a particular store are examples of some of the needs that can be fulfilled by shopping.
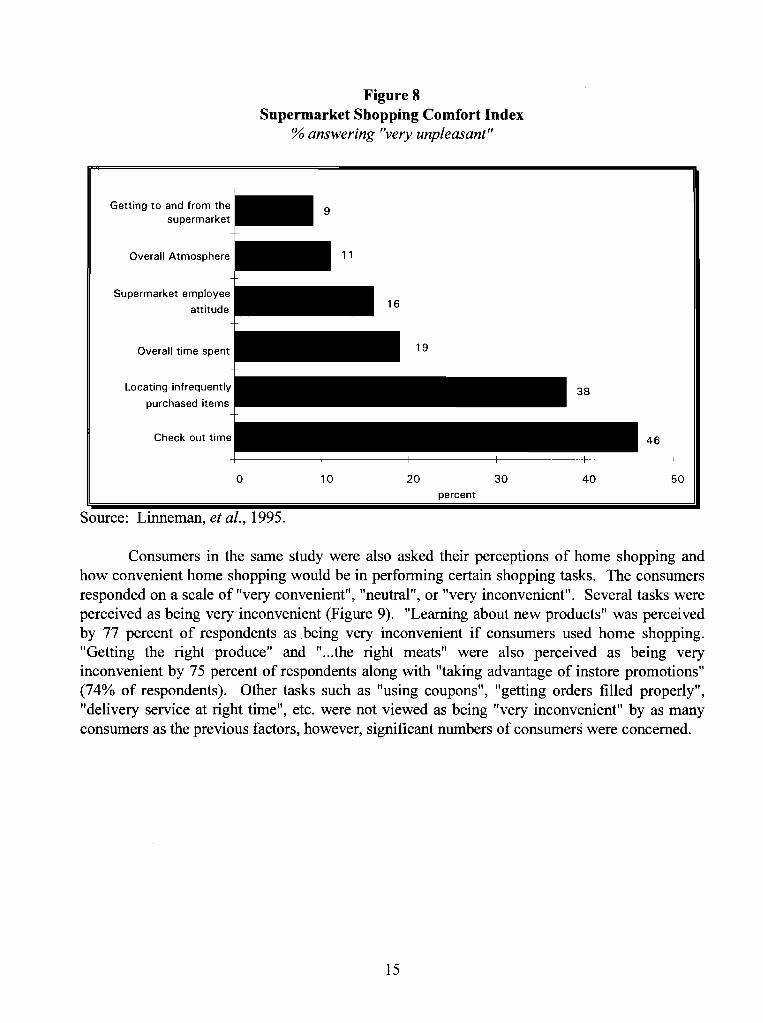
A consumer survey by Saint Joseph's University asked primary shoppers their degree of comfort with the procedures involved in shopping for food (Linneman, et al. 1995): 46 percent of shoppers said it was "very unpleasant" (Figure 8). A significant number (38%) also said "locating infrequently purchased items" was "very unpleasant." Perhaps more significantly, almost two-thirds of shoppers said "they wished they could spend the time that they spend shopping at supermarkets doing something else". In addition, 30 percent said "they usually need help getting groceries into their homes".
-
14
-
Figure 8 Supermarket Shopping Comfort Index
% answering "very unpleasant"
Getting to and from the supermarket
Overall Atmosphere
Supermarket employee
attitude
Overall time spent
Locating infrequently
purchased items
Check out time 46
---------1
o 10 20
percent
30 40 50
Source: Linneman, et al., 1995.
Consumers in the same study were also asked their perceptions of home shopping and how convenient home shopping would be in performing certain shopping tasks. The consumers responded on a scale of "very convenient", "neutral", or "very inconvenient". Several tasks were perceived as being very inconvenient (Figure 9). "Learning about new products" was perceived by 77 percent of respondents as .being very inconvenient if consumers used home shopping. "Getting the right produce" and "...the right meats" were also perceived as being very inconvenient by 75 percent of respondents along with "taking advantage of instore promotions" (74% of respondents). Other tasks such as "using coupons", "getting orders filled properly", "delivery service at right time", etc. were not viewed as being "very inconvenient" by as many consumers as the previous factors, however, significant numbers of consumers were concerned.
15

Figure 9 Convenience Index of Home Shopping
% responding "very inconvenient"
Getting the right
packaged goods
Paying for service
Placing the order
Delivery service
at right time
Getting orders filled
properly
Using coupons
Taking advantage of
in-store promotions
Getting the right produce
Getting the right meats
Learning about new products
50 60 70 80o 10 20 30 40
percent
Operational Issues
The Saint Joseph's University researchers (Linneman, et ai, 1995), asked companies to rate certain operational factors as having 1) problems, 2) neutral, or 3) no problem. The factor with the highest "problems" rating was "adequate customer demand" (Figure 10). Delivery issues were rated as being a problem by many firms. Order delivery and restructuring delivery were rated as having problems by 43 and 42 percent of firms respectively.
Although more firms said customer demand was a "problem" than any other factor, "promoting the home shopping program" was only deemed a problem by 9 percent of the -companies.
16

Figure 10 Problem Index for Supermarkets Offering Home Delivery
% answering ''problems''
Source: Linneman, et ai, 1995
50
Adequate Delivery of Restructuring Customer Picking Collecting Promoting customer orders delivery order orders payment program demand placement
-
50
40
30
20
10
17
Section II: Research Goals and Methodology
The overall purpose of the research project was to determine the current status of home shopping services in the U.S. supermarket industry and to document consumers' reactions to the services provided. Specific objectives were separated into two categories.
(1) Status of Home Shopping
• identifying key food companies involved, • identifying factors contributing to the success or failure of
various initiatives, • examining basic home shopping operations.
(2) Consumer Reactions
• how consumers like the services provided, • what key issues were important to consumers, • what services should be improved
In order to achieve these objectives, an integrated approach was employed consisting of a four part methodology:
• a comprehensive review of research, trade literature, and other secondary information to determine state-of-the-art research and knowledge regarding home shopping,
• a mail survey to supermarket companies, • field visits and interviews with supermarket companies, • six consumer focus groups located in 3 different home shopping service market
areas
(1) Literature Review
An extensive search of academic journals, trade publications, magazines, and previous studies of home shopping was conducted. The search provided preliminary information regarding home shopping services previously and currently offered and established an historical perspective to the study. It also served to identify key issues to be addressed or clarified in the supermarket surveys and field interviews.
Changes in and adoptions of technology in the United States that may support or hinder implementing home shopping services were reviewed along with changes in demographics and lifestyles.
18
(2) Supermarket SUn'eys
A mail survey instrument was constructed after reviewing the pertinent information and was sent to the top 75 supermarket firms in the United States as well as 43 selected companies representing small to mid-sized firms. Since the purpose of the survey was to provide descriptive information about current supermarket home shopping services in operation, no attempt was made to provide census type information or to· suggest that survey results were strictly representative of the whole supermarket industry in the U.S.
(3) Field Visits
Field visits to four firms providing home shopping services were conducted to observe various systems in operation and the different activities involved with each system.
(4) Consumer Focus Groups
Consumer focus groups were conducted in three locations. In each location, a company offered home shopping services to consumers in their market area. Locations were selected based on differing home shopping operations and, correlated with this, varying degrees of retailer involvement in the home shopping operations.
Each company generously provided Food Industry Management researchers with customers names and identified them as current or past users of their home shopping service. One company also provided a list of customers who had requested additional information about home shopping but had not yet placed a home shopping order.
In location A, three consumer groups were conducted. One group was composed of current customers, one group of past customers and one group of customers who had received a complete information package but had not yet placed a home shopping order. In location B, two groups were conducted: 1) current customers, and 2) past customers. In location C, one group of customers, both current and past users, was conducted.
19

Section III: Empirical Results of Retailer Survey
The overarching purpose of the survey was to provide descriptive information about supermarket home shopping services currently in operation. The survey was composed of three parts. The first asked all firms whether or not they had home shopping services. The second and third parts addressed consumer demographics and home shopping operations and were completed by firms who currently had experimented with home shopping.
Survey Respondent Profile
One hundred eighteen surveys were mailed to the top 75 supermarket firms and 43 selected small and medium sized supermarkets. Fifty states and 5 Canadian provinces were represented by the companies who received the survey. Of those surveys mailed, 60 (50.9%) were returned.
Twenty-nine percent of the companies responding were smaller firms having 1 to 25 stores (Figure 11). Twelve percent of the respondents had 26 to 50 stores while almost 59 percent had over 50 stores. Again, these proportions are not intended to be representative of those found in the supermarket industry in the U.S. as the intent of the survey was to determine the type of home shopping operations and not the number of operations. The respondents were mostly larger companies and those with perhaps the capabilities of implementing fully developed home ordering, picking, and delivery services.
Figure 11 Respondents by Firm Size
29% 59%
1-25 stores
over 50 stores
26-50 stores
12% -When firm size was determined by annual sales, again, the sample and the respondents
were weighted in the direction of the larger firms with fewer small and medium sized firms represented. Thirty-two percent of the respondents had annual sales of less that $500 million
20

annual sales while 20 percent had annual sales of $500 to $1,000 million. Forty-eight percent of respondents had annual sales of over $1,000 million in annual sales.
Of the 60 firms that responded to the survey, 24, or 40 percent of the total respondents, reported having some type of home shopping services (Table 2). In addition to those companies that currently had home shopping, 18 percent of respondents returning surveys planned to offer home shopping within 2 years (Table 2).
Table 2 Survey Response
% of Surveys % of Surveys Surveys Number Mailed Returned
Mailed 118 100.0% na
Returned 60 50.9% 100%
Returned with home shopping 24 20.3% 40.0%
Plan to have home shopping within 2 years 11 9.0% 18.3% na=not applicable
The survey also asked companies whether they had had home shopping services in the past, but were not longer offering them. Approximately 26 percent of respondents said they initially offered home shopping but have since discontinued it
When firms who offered home shopping services were asked what specific services were provided, all respondents (100%) indicated that they offered home delivery (Figure 12). Home ordering was offered by 96 percent of the companies, while picking up orders at the store (store pickup) or having orders delivered to the office were available from only 54 percent of the respondents who offered home shopping services.
-
21

Figure 12 Home Shopping Services Offered by Respondents
% ofhome shopping respondents
o 10 20 30 40 50 60 70 80 90 100
percent of respondents with home shopping
office delivery
store pickup.
home delivery
home ordering
100
-+---------1-----+---+---+-----1----+--+---+----+---1
Companies currently without home shopping but who reported that they planned to offer home shopping within two years (18 percent of total respondents) indicated that they planned to offer much the same services as those currently offering home shopping (Figure 13). When asked which service they would offer, most firms (90%) planned to offer home delivery and a large majority planned to offer home ordering (80%). Store pickup and office delivery options were not as popular with firms as only 70 percent and 40 percent of firms respectively planned on offering these services.
-
22

Figure 13 Home Shopping Services Offered within Two Years
% ofrespondents
office delivery
store pickup
90.0home delivery
home ordering
o 10 20 30 40 50 60 70 80 90
percent of respondents offering home shopping within 2 years
Respondents who had discontinued home shopping services (26%) were also asked what services they used to provide. Again, the most popular service that used to be provided by these companies was home delivery (87%) (Figure 14). Less than half (47%) of the companies even offered home ordering while fewer yet offered store pickup (33%) or office delivery (20%).
Figure 14 Home Shopping Services Offered in the Past
% ofrespondents who used to offer home shopping
office delivery
store pickup
home delivery
home ordering
o 10 20 30 40 50 60 70 80
86.7
90 -percent of respondents who used to offer home shopping
Comments from companies that no longer offered home shopping were solicited to find out why finns had discontinued the service (see Appendix A). Cost concerns were more
23

other concern, mentioned by 36 percent of the companies (Table 3). However other major concerns included low consumer demand and viability which were each mentioned by 24 percent of the companies. Other comments mentioned that home shopping was currently under study and mentioned that home shopping was not part oftheir company plans or strategy.
The researchers also asked companies that had no plans to offer home shopping why they did not offer it. Responses varied widely, however, cost, demand and viability concerns were quite apparent and outnumbered the rest of the comments (Table 3). Other reasons cited were that home shopping did not fit into companies' strategic plans or that it was simply "not viable." A number of companies indicated that home shopping was under study but no decisions had yet been made.
Table 3 Comments
"why don't you "why don't you plan to currently offer home offer home shopping
Comments shopping services" services?" % %
Cost 36.0 20.0 Demand 24.0 35.0 Not viable 24.0 10.0 Under study 8.0 15.0 Not in plans or strategy 4.0 15.0 Other 16.0 20.0
Retail Operational Practices
Home Shopping Customers
Few companies collected customer demographics on their home shopping customers. Those that did reported on the average that their home shoppers were 83 percent female and 17 percent male (Table 4). This a slightly higher proportion of females home shoppers than general supermarket shoppers. Food Marketing Industry's 1994 Trends in the United States reported 71 percent of supermarket shoppers are women.
-
24

13%
Table 4 Customer Demographics
Gender % of Home Shoppers female 83.0 male 17.0
Age under 35 6.4 35 to 64 35.7 65 and over 57.9
Companies also reported that only six percent of home shoppers are under 35 (Table 4). The majority of home shoppers are 65 and over (58%); 36 percent are between 35 to 64 years of age. This is in marked contrast to 16 percent of supermarket shoppers 65 and over as reported by the Food Marketing Institute's Trends in the United States. They also reported that 6 percent of shoppers were 18 to 24 years of age.
Home Shopping Managers
The literature review revealed that many retailers use contractors to provide some or all of their home shopping services. For example, Peapod, Chicago, Illinois, provides total home shopping services as an independent contractor with Jewel Foods while Shoppers Express, in Bethesda, Maryland, provides home ordering and delivery activities to over 200 markets in the United States. When retailers were asked who they used to provide the various home shopping services, 13 percent of respondents had all of their home shopping activities contracted out (Figure 15), 62 percent of respondents contracted out some of their activities, and 25 percent conducted all activities themselves.
Figure 15 Who's Managing the Home Shopping "Store?"
% ofhome shopping respondents
all services contracted
solely operated by retailer
25%
-partial contract of services
62%
25

Company Characteristics
When asked where home shopping services were offered, companies responded with a strong bias toward locating services within major metropolitan areas or cities. All respondents listed cities and/or counties containing cities such as Chicagoland metro area; Denver; Columbus; St Louis-North, South and West Counties; and Dayton-Montgomery & Greene counties (a complete list oflocations may be found in Appendix A).
Home shopping services were offered by 59 percent of companies having 1-25 stores. A . slightly smaller proportion of firms with 26-50 stores offered home shopping, while 35 percent of companies with over 50 stores reported having home shopping (Figure 16). This apparent trend, however, did not indicate a statistically significant difference as measured by Pearson's Chi-square.
Figure 16 Companies with Home Shopping by Number of Stores
% ofrespondents
60% 59.0%
50%
40%
30%
20%
10%
0%
1-25 stores 26-50 stores over 50 stores
When company size was broken down by annual sales this apparent trend disappeared. Fifty percent of firms with sales of $500 million or less offered home shopping services (Figure 17). Only 30 percent of firms with sales of$501 to $1,000 million had home shopping, however, 42 percent of firms with sales over $1,000 million offered home shopping. Companies with fewer stores located in metro areas may actually have very large annual sales. A possible connection between size by sales and location by population density may be responsible for the apparent difference in trends between companies with home shopping and those without as measured by these two different size criteria.
26

Figure 17 Companies with Home Shopping by Annual Sales
% ofrespondents
50.0% 50%
40%
30%
20%
10%
0%
$500 and less $501-$1,000 $1,001 and over
Respondents were asked how long they had had a home shopping service. The level of experience was high. More respondents had had home shopping for four years or more, almost 46 percent, than had for shorter periods (Figure 18). Seventeen percent had less than one year of experience with home shopping. Approximately 13 percent had one to two years of experience and 25 percent had two to four years of experience.
-
27

Figure 18 Experience with Home Shopping
% ofrespondents with home shopping
25%
1 to 2 years
13%
2 to 4 years
4 years or more
45%
Large firms appeared to have as much experience with home shopping services as smaller firms (Table 5). Forty percent of large firms had home shopping services for 4 years or more while 67 percent of medium and 50 percent of small firms had home shopping for 4 years or more. Although there appears to be a modest numerical difference, there was no statistically significant difference between size of firm and length of experience with home shopping services.
Table 5 Experience with Home Shopping by Size of Firm
% ofrespondents with home shopping
Size of Firm Less Than 1 to 1.9 2 to 3.9 4 Years 1 Year Years Years or More
Small (1-25 stores) 0 30 20 50 Medium (26-50 stores) 33 0 0 67 Large (over 50 stores) 30 0 30 40
Operations
Home shopping appears to have been growing in recent years. When asked how many orders firms experienced two years ago, currently and what they expect future orders to be in two years, companies indicated that orders would increase (Table 6). The average number of orders per week per firm two years ago was 236 with an increase of 38 percent to 326 currently. In two years, orders per week are expected to grow to 1,128, a further increase of 246% over current numbers. Two years ago, average sales per week per company was estimated to be $23,481
28

which grew to $40,513 in 1995 (an increase of 73 percent). It is predicted to grow to $147,810 (265 percent over current levels) in two years.
Table 6 Estimated Growth in Home Shopping Orders and Sales
respondent average
1993 1995 1997
Orders per week 236 326 1,128 Sales per week $23,481 $40,513 $147,810
Ordering Methods
Respondents reported a variety of customer ordering methods. The method offered the most frequently to customers was telephone with live operator which was available from 87 percent of respondents (Figure 19). Live operators most often used computer programs to take orders rapidly and accurately over the phone. They then could fax orders directly from the computer to the appropriate stores for order picking. Seventy-five percent of companies could take orders via fax.
Forty-six percent of the companies offered computer ordering as a method of placing a food order. A computer "catalogue" is made available to customers either through online services or through modem access to a company computer. Computer ordering usually consisted of selecting items from the "catalogue" and sending the order in directly from the home.
Voice interactive telephone was a method of placing an order but was offered by only 13 percent of the firms, and interactive TV, only now in its infancy, was offered by 4 percent of the firms. Certain miscellaneous methods of placing an order included mail and in person.
Although many ordering methods were being made available by firms, customers responded to only a few. Customers used the telephone operator most frequently: almost 78 percent of all orders were received by a telephone operator (Figure 19). Although 75 percent of companies offered fax capabilities, only 7 percent of all orders were received by fax. In addition,
. only 8 percent of all orders were received by computer. Less than 1 percent of orders were received by interactive telephone, and no orders were placed by interactive TV.
-
29

Other
Interactive TV
Voice interactive
phone
Computer
lo methods use~ • methods available j
Fax 75
o 10 20 30 40
%
50 60 70 80 90
Figure 19 Ordering Methods Available and Used
Printed catalogues are usually used to list products for the home shopper and are usually used primarily by shoppers who phone or fax their orders. Printed catalogues were made available by 68 percent of home shopping companies. Slightly fewer companies (50%) offered computer product catalogues (Table 7). Computerized catalogues are made available to consumers either through an on-line service such as America OnLine, CompuServe or through remote access via modem to a centralized mainframe. Less than 6 percent of companies with printed catalogues listed item prices in their catalogues whereas, 23 percent of companies which had computer catalogues listed prices.
Table 7 Catalogue Types
Catalogue Type % of Companies Offering
Printed customer catalogue 67.6 Computer customer catalogue 50.0
-Furthermore, only 6.3 percent and 8.3 percent of printed catalogues and computer catalogues respectively listed complete product offerings available from the store (Table 8). Even though most catalogues did not have a complete list products available in the store, most companies did allow customers to order items from the store even though they were not listed in the catalogue.
30

Eighty-six percent of those companies with printed catalogues and 75 percent of those with computer catalogues allowed total store shopping.
Table 8 Catalogue Offerings
% Responding "yes" Question Printed Catalogues Computer Catalogues
Does your catalogue include item prices? 5.6 23.1
Does your catalogue list all products available in your stores? 6.3 8.3
IfNO, can shoppers order anything available in the store even if it is not listed in the catalogue? 86.7 75.0
Since, generally, not all Stock Keeping Units (SKU's) available in the store are listed in printed catalogues, companies must choose which items they want listed. Companies were asked to report the number of SKU's available from the store and the number listed through the catalogue. On average, 35 percent of store SKU's were listed in home shopping catalogues (Table 9). The category with the highest percentage of store SKU's listed in the catalogue was produce (67%), while general merchandiselhealth and beauty care had the lowest percentage represented (8%)
Table 9 Catalogue Product Selection
% of Category SKU's Category # of Store SKU's Offered in Catalogue
Total Groceries-food Groceries-non-food Frozen Bakery Dairy Deli Meat Produce GM/HBC Other
44,569 13,422 4,785 1,658 1,278 1,932 1,550 2,223 1,292
16,379 50
35.3% 54.0 56.7 49.5 26.8 60.8 40.5 -52.4 67.4
7.5 26.0
31
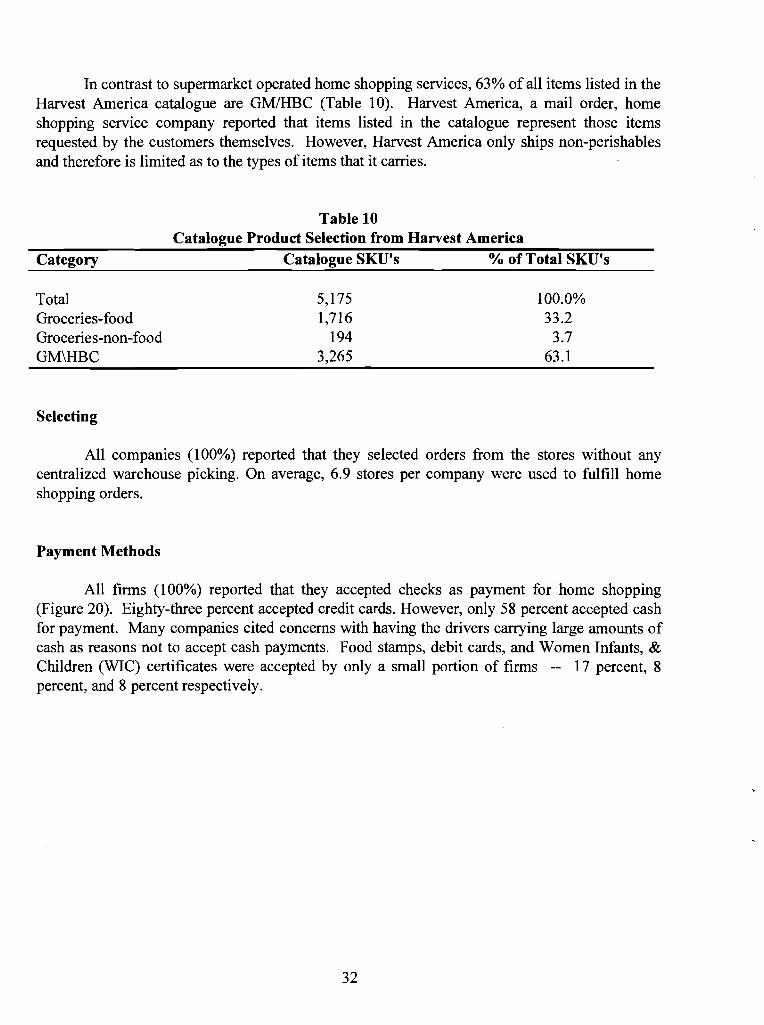
In contrast to supermarket operated home shopping services, 63% of all items listed in the Harvest America catalogue are GM/HBC (Table 10). Harvest America, a mail order, home shopping service company reported that items listed in the catalogue represent those items requested by the customers themselves. However, Harvest America only ships non-perishables and therefore is limited as to the types of items that it carries.
Table 10 Catalogue Product Selection from Harvest America
Category Catalogue SKU's % of Total SKU's
Total 5,175 100.0% Groceries-food 1,716 33.2 Groceries-non-food 194 3.7 GM\HBC 3,265 63.1
Selecting
All companies (100%) reported that they selected orders from the stores without any centralized warehouse picking. On average, 6.9 stores per company were used to fulfill home shopping orders.
Payment Methods
All firms (100%) reported that they accepted checks as payment for home shopping (Figure 20). Eighty-three percent accepted credit cards. However, only 58 percent accepted cash for payment. Many companies cited concerns with having the drivers carrying large amounts of cash as reasons not to accept cash payments. Food stamps, debit cards, and Women Infants, & Children (WIC) certificates were accepted by only a small portion of firms -- 17 percent, 8 percent, and 8 percent respectively.
-
32

Figure 20 Payment Methods
Women, Infants, & Children
Debit card
Food stamps
Cash
Credit card
Check 100.0f-----+-----+---+----+--_
~ -
D methods used
• methods available
o 20 40 60 80 100
Paying by check was the most popular method of payment by customers as reported by respondents (Figure 20). Fifty-three percent of payments were by check. Cash and credit card payments were used 25 and 21 percent of the time with cash payments being slightly more popular despite being available from fewer firms. However, payments by food stamps, debit cards, or WIC certificates were negligible with fewer than 1 percent of payments made by each of these methods.
Labor
Cost was the most frequently cited reason why supermarkets were not currently using or were not planning on instituting a home shopping service (Table 4). Since many firms contract out part or all of the activities requiring labor, retailers' largest single cost, companies were asked who, the supermarket or the contractor, provided the labor for each of a range of standard home shopping activities. Almost 63 percent of companies reported that a contractor provides labor for
. taking orders whereas only 38 percent said that they provided the labor themselves (Table 11).
Order picking was performed primarily by the supermarket company's labor force (83%). However, order delivery was usually handled by contractors -- almost 67 percent of the companies reported that a contractor provides delivery labor. In the case of delivery, some companies reported that both the supermarket firm and a contractor collaborate for delivery.
Responsibility for collecting payments were more evenly split between supermarket companies and contractors. Almost 46 percent of the supermarket respondents provided the labor to collect payments whereas 54 percent said a contractor handled it. Program promotion
33
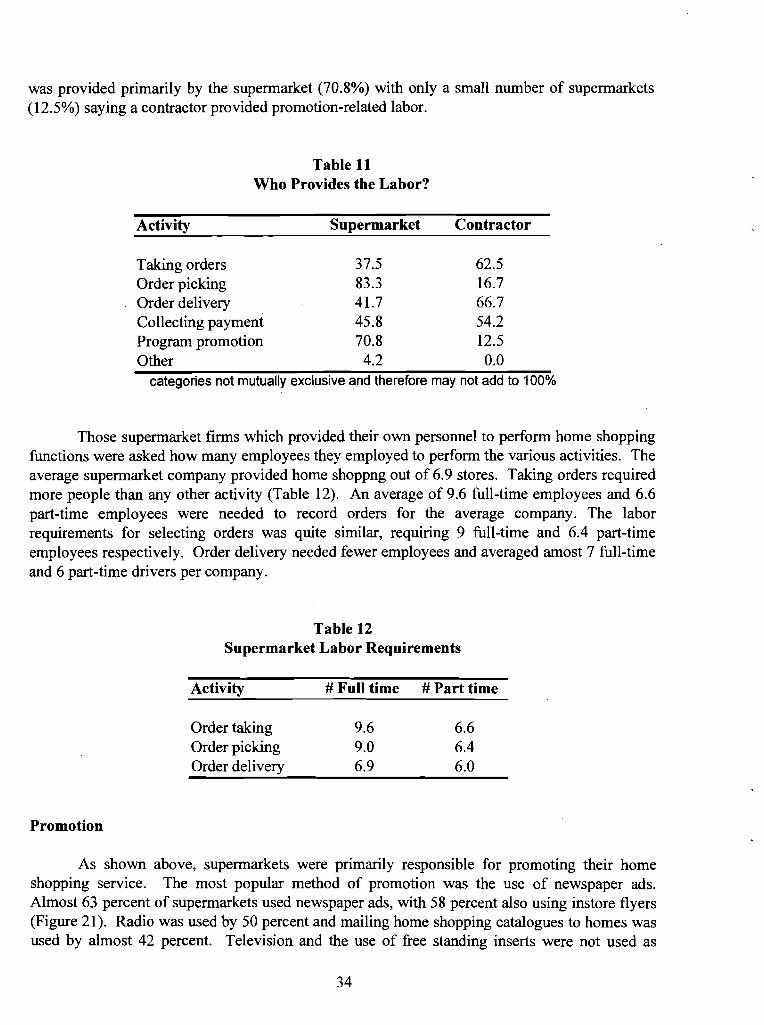
was provided primarily by the supermarket (70.8%) with only a small number of supermarkets (12.5%) saying a contractor provided promotion-related labor.
Table 11 Who Provides the Labor?
Activity Supermarket Contractor
Taking orders 37.5 62.5 Order picking 83.3 16.7 Order delivery 41.7 66.7 Collecting payment 45.8 54.2 Program promotion 70.8 12.5 Other 4.2 0.0
categories not mutually exclusive and therefore may not add to 100%
Those supermarket firms which provided their own personnel to perform home shopping functions were asked how many employees they employed to perform the various activities. The average supermarket company provided home shoppng out of 6.9 stores. Taking orders required more people than any other activity (Table 12). An average of 9.6 full-time employees and 6.6 part-time employees were needed to record orders for the average company. The labor requirements for selecting orders was quite similar, requiring 9 full-time and 6.4 part-time employees respectively. Order delivery needed fewer employees and averaged amost 7 full-time and 6 part-time drivers per company.
Table 12 Supermarket Labor Requirements
Activity # Full time # Part time
Order taking 9.6 6.6 Order picking 9.0 6.4 Order delivery 6.9 6.0
Promotion -As shown above, supermarkets were primarily responsible for promoting their home
shopping service. The most popular method of promotion was the use of newspaper ads. Almost 63 percent of supermarkets used newspaper ads, with 58 percent also using instore flyers (Figure 21). Radio was used by 50 percent and mailing home shopping catalogues to homes was used by almost 42 percent. Television and the use of free standing inserts were not used as
34

Figure 20 Payment Methods
Women, Infants, & Children
Debit card
Food stamps
Cash
Check +-----==t==----+---+------+--------11
o 20 40 60 80 100
83.0
!Dmethods used
~~ethods available
100.0
Credit card •••••
Paying by check was the most popular method of payment by customers as reported by respondents (Figure 20). Fifty-three percent of payments were by check. Cash and credit card payments were used 25 and 21 percent of the time with cash payments being slightly more popular despite being available from fewer firms. However, payments by food stamps, debit cards, or WIC certificates were negligible with fewer than 1 percent of payments made by each of these methods.
Labor
Cost was the most frequently cited reason why supermarkets were not currently using or were not planning on instituting a home shopping service (Table 4). Since many firms contract out part or all of the activities requiring labor, retailers' largest single cost, companies were asked who, the supermarket or the contractor, provided the labor for each of a range of standard home shopping activities. Almost 63 percent of companies reported that a contractor provides labor for
. taking orders whereas only 38 percent said that they provided the labor themselves (Table 11).
Order picking was performed primarily by the supermarket company's labor force (83%). However, order delivery was usually handled by contractors -- almost 67 percent of the companies reported that a contractor provides delivery labor. In the case of delivery, some companies reported that both the supermarket firm and a contractor collaborate for delivery.
Responsibility for collecting payments were more evenly split between supermarket companies and contractors. Almost 46 percent of the supermarket respondents provided the labor to collect payments whereas 54 percent said a contractor handled it. Program promotion
33
. ,

was provided primarily by the supermarket (70.8%) with only a small number of supermarkets (12.5%) saying a contractor provided promotion-related labor.
Table 11 Who Provides the Labor?
Activity Supermarket Contractor
Taking orders 37.5 62.5 Order picking 83.3 16.7 Order delivery 41.7 66.7 Collecting payment 45.8 54.2 Program promotion 70.8 . 12.5 Other 4.2 0.0
categories not mutually exclusive and therefore may not add to 100%
Those supermarket firms which provided their own personnel to perform home shopping functions were asked how many employees they employed to perform the various activities. The average supermarket company provided home shoppng out of 6.9 stores. Taking orders required more people than any other activity (Table 12). An average of 9.6 full-time employees and 6.6 part-time employees were needed to record orders for the average company. The labor requirements for selecting orders was quite similar, requiring 9 full-time and 6.4 part-time employees respectively. Order delivery needed fewer employees and averaged amost 7 full-time and 6 part-time drivers per company.
Table 12 Supermarket Labor Requirements
Activity # Full time # Part time
Order taking 9.6 6.6 Order picking 9.0 6.4 Order delivery 6.9 6.0
Promotion
-As shown above, supermarkets were primarily responsible for promoting their home
shopping service. The most popular method of promotion was the use of newspaper ads. Almost 63 percent of supermarkets used newspaper ads, with 58 percent also using instore flyers (Figure 21). Radio was used by 50 percent and mailing home shopping catalogues to homes was used by almost 42 percent. Television and the use of free standing inserts were not used as
34

frequently (17%). Other methods, employed by 29 percent of the respondents, included such techniques as billboards, window signs, and word of mouth.
Figure 21 Promotion Methods Used by Supermarkets for Home Shopping
free standing inserts 16.7
television 16.7
other 29.2
catalogue mailing 41.7
radio 50
instore flyers 58.3
newspaper ads 62.5 I I I I I
o 10 20 30 40 50 60 70
% of respondents with home shopping
Importance and Performance
The survey asked companies the importance of home shopping in providing the company with tangible returns. Firms responded on a scale of 1 to 4 with 1="not important" and 4="very important". When firms were asked how important home shopping was to financial profitability, the average reply was 2.0 or "somewhat important" (Figure 22). However, all other factors asked in the survey rated more highly than "financially profitable". Companies rated home shopping as being 2.6 being between "somewhat important" and "important" in increasing store sales. The objectives of enhancing store image and increasing customer loyalty both received an average rating 0[3.0 or "important".
-
35

Figure 22 Importance of Home Shopping in Contributing Toward Selected Firm Objectives
being financially profitable
increasing store sales
3.0enhancing store image
3.0increasing customer loyalty
1 3 4 not important important very
important
2
somewhat important
Respondents also rated how their home shopping was performing in regards to the factors above. The performance scale was from 1 to 4 again with 1=poor and 4=fantastic. Overall, performance ratings ranged from 1.8 for "financially profitable" to 2.6 for "increasing customer loyalty" (Figure 23). Performance for "increasing store sales" was 2.1 and for "enhancing store image" was 2.4.
Figure 23 Home Shopping Performance in Achieving Selected Performance Objectives
being financially profitable
increasing store sales
enhancing store image
T
2.4
+ increasing customer loyalty 2.6
2 3 4 -poor good excellent fantastic
36

Section IV: Consumer Perceptions of Home Shopping
Forty-six individuals participated in seven focus groups conducted in the northeast, midwest and western regions of the United States. All participants had prior involvement with home shopping. Many were avid home shoppers while some have tried home shopping on an irregular basis. Still others have expressed an interest in home shopping, however, they have yet to place an order. Focus groups ranged in size from 5-13 individuals.
General Demographic Profile
Individuals who participated in the focus groups were on average 49 years old (Table 13). Forty-three percent reported living alone while 30 percent indicated they were a member of a two person household. Twenty-two percent reported three to four people in their household while only five percent of focus group participants had five or more members in their household.
On average, participants reported that 1.2 individuals in their households are employed. Fully thirty percent of respondents were not currently employed (Table 13). A similar percentage (30%) reported that two members of their household were employed (Table 13).
Forty-three percent of all respondents reported an average annual income of between $20,001 and $60,000 (Table 13). Thirty-seven percent indicated their household income was $60,001 and above while twenty percent reported an annual income of less than $20,000.
Focus group participants reported high education levels. Sixty-eight percent had a graduate degree while only six percent had a high school education or less (Table 13).
Almost two thirds (65 percent) of participants reported owning a home computer.
-
37
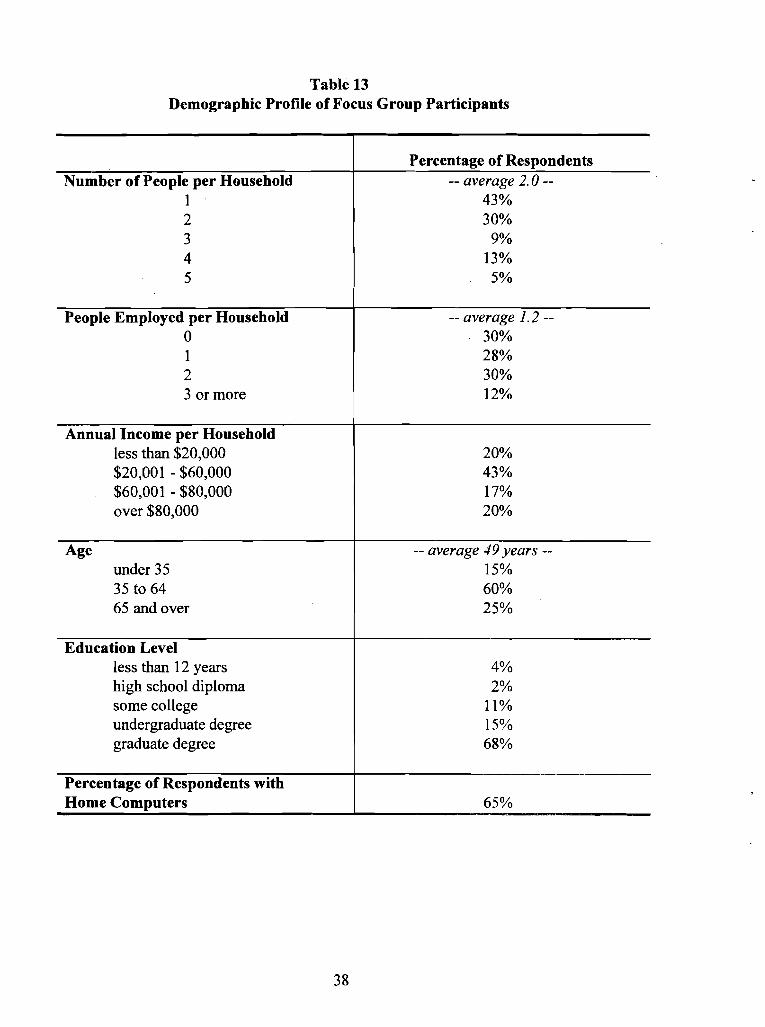
Table 13 Demographic Profile of Focus Group Participants
Percentage of Respondents Number of People per Household
1 2 3 4 5
People Employed per Household 0 1 2 3 or more
Annual Income per Household less than $20,000 $20,001 - $60,000 $60,001 - $80,000 over $80,000
-- average 2.0 -43% 30%
9% 13% 5%
-- average 1.2 -30% 28% 30% 12%
20% 43% 17% 20%
Age -- average 49 years -under 35 15% 35 to 64 60% 65 and over 25%
Education Level less than 12 years high school diploma some college undergraduate degree graduate degree
4% 2%
11% 15% 68%
Percentage of Respondents with Home Computers 65%
-
38

A Profile of Home Shoppers
Regular home shoppers can be categorized into two groups. The first group--"Hi-Tech Baby Boomers"--are those individuals with very hectic lifestyles. They are home shopping for food via their home computer with the hope of alleviating time pressures on their already timecrunched lives. A second group of dedicated home shoppers --"Older/Physically Challenged"-are individuals who have physical limitations, often older people, or, people who are temporarily or permanently physically challenged. Each group will be examined in detail in the following sections.
Hi-Tech Baby Boomers
Profile:
Focus group respondents in this category could best be described as busy, technologically sophisticated baby boomers. These individuals were typically members of affluent (32% reported income over $80,000), two wage earner (52% had 2 incomes per household) households (Table 14). Their household size varied; 32 percent lived alone while an equal percentage reported having three or more members of their household. As a group, these baby boomers were very well educated--80 percent reported holding graduate degrees. They were also technologically sophisticated--92 percent owned a home computer. These hi-tech individuals relied on their computers for placing home shopping orders.
Reasons for Utilizing Home Shopping Services:
Working couples, families with small children and individuals with many simultaneous life roles (e.g. parent, worker, student) were dedicated users of home shopping. These "hi-tech baby boomers" were searching for ways to streamline their lives--they were evaluating and prioritizing their activities in search of better, more efficient ways to manage their time-crunched lives. Home shopping offers one solution. "Hi-tech baby boomers" viewed home shopping as the ultimate convenience-- a way re-capture free time previously committed to food shopping. In essence these home shoppers were making a trade off--they were willing to pay home shopping fees in exchange for freedom from the supermarket. Two participants explained why they had chosen the home shopping alternative:
I had a job that takes an awful lot of my time and also I was in school and I decided that I had to cut back in any way that I could the time I was spending on other things. And I had read about the home shopping service and I decided that about three years ago four years ago actually that it would be a good idea to try it. -I mean my husband and I go to the market as seldom as possible so we end up buying two hundred dollars a pop. Andyou know, you have shop for it and put in the car and, and take it out ofthe car andput it away. And I just HATED it. I just really hated the entire act ofshopping for food It takes a lot of that painful stuff away.
39

Table 14 Demographic Profile of Hi-Tech Baby Boomers
Percentage
Number of People per Household 1 2 3 4 5 or more
-- average: 2.4 -32% 36%
4% 20%
8%
People Employed per Household o 1 2 3 or more
-- average: 1.7-8%
28% 52% 12%
Annual Household Income less than $20,000 8%
$20,001 - $60,000 32% $60,001 - $80,000 28% over $80,001 32%
Age -- average 44 years -
Educational Level less than 12 years 0% high school diploma 0% some college 4% undergraduate degree 16% graduate degree
Percentage of Respondents with
80%
Home Computers 92%
-
40

However, one "hi-tech baby boomer" pointed out that home shopping may not be the ultimate convenience. In fact, he believed home shopping was actually time consuming:
I disagree it saves time. I think it takes more time. The reason is, first you have to get on-line, and then my wife has to get involved and we discuss everything that I have to get. I normally do the shopping. Then you have to stay home in the ninety minutes during the delivery period, so you can't go anywhere, so that's another hour and a half that it takes, and then you have to reserve an hour after the delivery to go the store and get all the stuff that didn't come through on the order. Now I don't see any savings in time.
Several "hi-tech" home shoppers admited to being lured into home shopping because of the novelty of shopping for food via their home computer. One focus participant echoed this point:
Pm probably attracted to the service just because of the novelty. I think it's interesting and it might be the wave of the future, so I just like to be aware of what's going on.
Still other "hi-tech" computer shoppers described family and living arrangements which prompted them to go "on-line." One home shopper described how valuable home shopping was to him:
When I started this I had three boys at home that drank eleven gallons of milk a week. And so, you know hauling eleven gallons of milk up the stairs, along with twenty pounds ofcharcoal, and twenty pounds ofpotatoes and ten pounds ofrice, you know, I had a small army ofpeople to help. And so I think that was one ofthe other things, you know, just the amount ofgroceries that had to get schlepped up the stairs. I didn't care if they charged twice as much- I think I would have been very happy just to have eleven gallons ofmilk carried up the stairs.
The Process of Home Shopping:
On-Line Ordering
For most on-line home shoppers, at least initially, placing an order was a time consuming . process. However, on-line ordering experience coupled with personal shopping lists (provided by the home shopping service) proved to be two critical components to improving the efficiency of on-line ordering. One home shopper described the evolution of her experiences with on-line ordering:
Well, when I started offI used to spend lots oftime on it. But now I've got my personal lists-I have three of them organized. I've got non-food, food and beverage. What I finally started doing was I would download (the lists), I printed out my three lists blank. And then I made copies of them and I have them on the refrigerator. And so when I start running out of
41
things I mark on the lists. And now it takes me about fifteen-twenty minutes to shop.
Despite ownership of home computers, many "Hi-tech baby boomers" indicated they would have enjoyed more technological support and hand holding especially when they were novice home-shoppers. Misunderstandings about the necessary hardware required to operate the software program as well as confusion about the software itself, led many people to delay placing their first home shopping order. Several on-line shoppers suggested that software documentation could be more user friendly, while others felt they needed more technical assistance with both. hardware installation and software operation. In response to this need, some home shopping services offered periodic classes which instructed new users in software use and hardware requirements.
Delivery
Typically, home shoppers were offered a one and one-half to two hour window of time when they can receive delivery of their home shopping order. Many home shoppers would like a narrower time window; however, at the very least, they expected their food to delivered within the specified window, not later or earlier either. Several home shoppers commented on the difficulty of scheduling a delivery during busy holiday periods--generally a busy time for home shopping services and a high demand period for time-strapped consumers.
When asked how the delivery process could be improved, the most common consumer response called for additional delivery times--later on weekday evenings (e.g. an 8:00 - 10:00 PM delivery time) and earlier on Saturdays (e.g. an 8:00 - 10:00 am delivery time).
Generally these "hi-tech baby boomers" were very satisfied with the delivery personnel, commenting positively on their organization, high energy and friendliness.
Order Content
Out of stocks, item errors and poor food quality were the three primary concerns regarding order content of "Hi-tech baby boomers." Home shoppers have the same problems with out-of-stocks as supermarket shoppers. However, a supermarket shopper can make an immediate decision to either substitute with an alternative item, or, omit the item from their order altogether. A home shopper does not have this ability. Instead, for every item they order, a home shopper must indicate if substitutions are permissible, and if so, to what brand. This is time consuming, yet, for many brand conscious consumers a necessity. One consumer sumed up her feelings about out-of-stocks:
... there's nothing like being in a store and seeing what you want and you have to substitute and doing your own substitutions. So I mean the decisions they make in the store-by the time they get to my house I have to live with those decisions.
42

For home shoppers who are planning meals or special events around specific menu items, this presents a significant problem. Referring to this problem, one focus group participant commented: "...anybody planning a menu, 1don't know how they do it."
Perhaps the biggest problem and frustration encounter by these "hi-tech baby boomer" home shoppers were mistakes in their orders. Most home shoppers reported they almost always have at least a few mistakes in each order. However, at times, there could be many mistakes. One home shopper described a frustrating experience:
May I give you the example of my first order? Fifteen items. There were five substitutions andfive errors. So ten out offifteen items were wrong in some way.
Fees for Home Shopping Services
As might be expected, "hi-tech baby boomers," like most consumers, did not like incurring a fee for a service. However, they were quick to justify the expense, citing the convenience the service provides. One home shopper actually believed she saved money by home shopping despite delivery fees:
I think I'm going to save by being more organized in really using the service. I never use coupons in the grocery store because I forget them at home. And now I figure that now I'm going to use coupons. I'm going to do much better comparison, because when I'm in the grocery store I'm so eager to get out of there that I'll grab whatever, and um you know, I want to shop in fifteen minutes. And now I'm looking at the price comparison and I'm picking the right item pricewise. And I'm also planning to use the weekly circular in the newspaper a lot more effectively.
However, one on-line shopper admited that: "1 didn't feel good paying the delivery fee." Several focus group participants drew an analogy between home shopping for food and catalogue shopping for clothes. These well seasoned home shoppers pointed out the importance of accurate orders, quality products and outstanding customer service when ordering a product from a catalogue or computer. One woman's comment illustrated this point:
If the clothes are true to size and good quality, then you're willing to pay that shipping and handling fee. Ifyou have to return it three times out offour, and go through all these hassles, then it's not worth it. Good customer services makes you feel good. You are willing to pay the shipping and handling fees because there is never any hassle. If there is an error, or there was some sort of confusion, they take care ofit. With home shopping for food, if they have to come back to my home because they forgot a gallon ofmilk, it's a hassle, its not worth it.
43

Older and Physically Challenged Home Shoppers
A Profile
The second group of home shoppers could be characterized as individuals who were typically older (average age = 62), retired (91 % are not employed) and had a lower income than the average (64% reported incomes of less than $20,000) (Table 15). Generally these people were living alone (82%) and were very well educated (55% have a graduate degree). Only
•slightly over one-third (36%) reported owning a home computer.
Reasons for Utilizing Home Shopping
Typically, older and physically challenged home shoppers utilized this service because they experienced physical difficulty in going to the supermarket. For most, a permanent disability kept them out of the supermarket while for others, a temporary disability forced them to consider a home shopping service. For these people, who were largely unable to navigate a supermarket, having a home shopping service available to them solved a major dilemma in their lives.
A major difference between hi-tech home shoppers and older/physically challenged shoppers, was the latter group enjoyed shopping for food but had physical difficulties doing so. They had engaged the services of a home shopping service out of necessity-- for some, it was the only way they obtained food and grocery items. On the contrary, hi-tech baby boomers generally disliked food shopping, and were willing to pay for the luxury of having their groceries delivered to their homes.
The Process of Home Shopping
Orderin~
Unlike "hi-tech baby boomers," who almost exclusively make use of computer on-line services to access their groceries, the older/physically challenged group tended to phone their home shopping order to whichever retailer in their community who offered home shopping services.
With phone-in ordering, the phone operator receiving the calls becomes a critical success component in the entire home shopping process. Universally, the individuals who phoned in their orders were very satisfied with the phone operators commenting; "the operators are excellent and very patient." However, again there was generally universal agreement that phone ordering was very time consuming, sometimes taking upwards of 45 minutes.
In order to streamline order-taking time older/physically challenged shoppers wanted a home shopping catalogue of products which was easy for them to read.
44

Table 15 Demographic Profile of Older and Physically Challenged Home Shoppers
Percentage
Number of People per Household 1 2 3 4 5 or more
-- average: 1.3 -82% 9% 9%
People Employed per Household o 1 2 3 or more
-- average: 0 -91%
9%
Annual Household Income less than $20,000 64%
$20,001 - $60,000 $60,001 - $80,000 over $80,001
36%
Age -- average 62 years -
Educational Level less than 12 years 18% high school diploma 0% some college 18% undergraduate degree 9% graduate degree 55%
Respondents with a home computer 36%
45
Delivery
Generally older/physically challenged shoppers reported being very satisfied with the delivery service and personnel. For these people, who are largely shut-ins, delivery of food was nearly a social event, an opportunity to visit with the delivery person.
Order Content
This group of home shoppers mentioned similar problems as their hi-tech cOUllterparts-- . mistakes in their orders. Due to the consistency of mistakes in her order, one women commented; "1 never order anything 1want that day. 1don't want to be disappointed."
Fees for Home ShoPpinll Services
Unlike "hi-tech baby boomers", for the older/physically challenged group of home shoppers, most of whom were either retired or living with relative low incomes, the cost of the home shopping service was difficult to justify. Often living on fixed incomes, and typically only needing a few items per order, the cost of delivery relative to the order price was perceived as very high. However, these individuals frequently had few alternatives, and, as a result, tries to maximize their order size when possible and order less frequently.
Experiences Common to Both Demographic Groups
Source of Information about Home Shopping
Focus group participants discovered the home shopping services in their areas from several sources. Typically, they heard about home shopping from a friend already using the service, or, at the supermarket where they shopped. Some learned about home shopping through newspaper ads, direct mail or even on television. Several people first learned about home shopping when they saw home shopping workers in supermarkets picking orders for existing home shopping customers. One individual saw a brochure for home shopping in a computer store while others mentioned they learned about the service from a social worker and a human servIce agency.
General Concerns about Home Shopping
Many focus group participants mentioned security issues as their main concern regarding home shopping, and many orne shoppers did not feel comfortable giving a credit card number over the computer or to an operator. Others just did not like the idea of someone having a historical record of their purchases. One focus group participant described her feelings:
'" it scares the hell out ofme that a year form now somebody 's going to come and say, "You bought... whatever, and that means something about you." Like maybe a life insurance company seeing you buy cigarettes or alcohol or something like that.
46

However, their primary concern centered around the delivery portion of home shopping. Having a strange delivery person coming to their home left many feeling vulnerable. Most home shoppers indicated they felt more comfortable when the delivery person was wearing a uniform and had identification which identified them as delivery people from their home shopping company.
Another concern shared by every member of every focus group was the issue of tipping. Home shoppers were not certain if delivery people be tipped and if so how much. Many home shoppers did not like to tip but felt it was expected, yet others willingly tipped albeit varying amounts. It is imperative that home shopping services establish protocol for tipping and clearly communicate this to their clients.
The focus group participants generally had difficulty trusting the supermarkets or the home shopping service to select their groceries for them unless the service proved to them otherwise. Several concerns were raised:
A concern was as to whether everything is going to go right. I know if I'm walking through the store I can pick out exactly what I want and being able to watch the quality and the price because I know what I'm going to be charged. Even little things like having someone do all that and having it to my place on time, bringing what you thought you were going to get. You sort offeellike, you may not get a fair deal.
.. .1 don't want to risk someone else's judgment
Whether they would send the food that you really wanted. Whether they would take the highest priced items, rather than sending, like generic or store brands, that was my concern, and I found it to be true.
Related to this lack of trust was a concern regarding food quality--particularly perishables and frozen foods. Home shoppers' experiences varied considerably; some home shoppers indicated full satisfaction with overall food quality. However, other focus group participants related serious concerns citing instances of melted ice cream and poor quality produce. As a result, some home shoppers have either discontinued purchasing perishable items, or, in some cases, have discontinued home shopping altogether.
Many focus group participants admitted having difficulty ordering products without the benefit of seeing the product, packaging and labeling. A frequently cited example is confusion over brand names. For instance, a consumer knew she always bought the blue box of pasta but did not know the brand name. Other home shoppers confessed to having trouble distinguishing between various sizes of products--the 64 oz. vs. the 48 oz. package. As a result, although they readily admitted to being in error, they were often very surprised at the item once it is delivered. One consumer described this dilemma:
Pictures and scales would be helpful for judging size ofproducts. For example, I bought this giant thing of oatmeal. I guess I was thinking volume and it was
47

weight or vice versa and it was this giant thing. You know, we could have fed the whole building!
Several participants mentioned their desire to have access to nutrient labeling and ingredients for the items they purchase. For people who are on special diets or who suffer from allergies, without access to product labels, they are virtually unable to add new products to their home shopping purchases.
Home Shopping: A Temporary Solution
For some home shoppers, including both "hi-tech baby boomers" and "older/physically challenged" consumers, home shopping was viewed as a temporary solution. It provided a service to them during inclement weather or especially busy times in their lives. These individuals had no intention of becoming dedicated home shopping users, rather, they were occasional users of the service.
Effect on Impulse Shopping
Focus group participants were mixed in their viewpoints regarding the effect shopping at home had on their typical purchase patterns. Several individuals indicated frustration, because as a home shopper they were not exposed to the many new products lining supermarket shelves. Some remedied that problem by visiting the supermarket occasionally simply to learn about new products.
Some home shoppers believed that through comparison shopping on-line they were actually able to save money over in-store shopping. Two shoppers commented how they saved money by shopping for food at home:
I mean the prices aren't an attractive feature, but I can see overcoming that price objection by not buying things that, you know, I probably should't buy. I think it's a lot less tempting to buy a package of oreos offyour computer than it is when you're standing in front of it.
... ninety-six dollars, what did I order? And then you got hrough and you throw this out and. ..
Yet one person indicated: "I feel freer to order more because I don't have to schlep it home from the supermarket."
The Importance of Advertising Home Shopping Services
Some focus group participants admitted to simply forgetting about the home shopping service in their area. Shopping for food is a habit for most people, home shopping is not. Two former home shoppers explained this:
48

I think I'm sort of a creature of habit, so that I'm looking for a flyer on Wednesday, I put my order in on Thursday, and Saturday I know that it was going to come at a certain time and I could plan the rest ofmy day. I just thought that was gangbusters. But you break your routine, and you have to get yourself back into doing it. This is difficult.
Basically I kind offorgot the service was there. In the beginning I got all the information, you know, they sent it to me and I placed an order and they gave me more information and then I haven't heard any more from them. I never got, like, an update booklet or anything, and so I kind offorgot that the service was out there.
Reasons for NOT using Home Shopping Services
Some focus group participants reported they were reluctant to begin home shopping for food. Others in the focus group reported using home shopping but, for a variety of reasons, had discontinued using the service.
Interested. But Not Sure...
Technology, cost, and lack of trust were the three primary reasons why individuals were reluctant to utilize a home shopping service. Typically, regardless of which of the three reasons were cited, the individual usually did not possess the most up-to-date information regarding home shopping. Therefore, they were forming opinions based on dated, inaccurate information. Just as it is important to keep home shopping in the minds of recent home shoppers, it is also critical that general up-to-date information be communicated to the general public regarding the status of home shopping.
Tried It. But Didn't Like It...
The most common reason for discontinuing home shopping cited by focus group participants was a general with order accuracy and the quality of perishables. Two former home shoppers summed up their experiences with home shopping: .
We used it, I think, five times and then we stopped, because through the course of delivery they brought the wrong merchandise, I had melted ice cream, I had produce that was bad, so I mean that in itself said to me to just forget the whole thing and cancel, but my husband wanted to keep trying because it was a new thing, and he liked it , and he liked playing with the computer. Then we had to at one point have the delivery people come back and replace a box of crackers. I mean it just seemed pointless to me. I'd rather go back to myoid way ofdoing it. I thought is would be convenient and a time-saver but it just ended up being a bigger headache than it was worth.
49

After a few incorrect orders I began ordering less because of what the produce was like. It was what the meats looked like and I really didn't like it, so I started going to the fruit market for my produce and stuff, and then buying our meat elsewhere, and it kind of got narrowed down to just canned goods, or nonperishables and it just kink ofseemedpointless after awhile.

Section V: Supermarket Home Shopping:
Implications and Challenges
Home shopping is currently being tested and tried by supermarket companies with renewed enthusiasm. It appears to be an idea whose time has come. Home shopping has gained support due to new developments in technology as well as the growing use of home computers. Retailers recognizing that home shopping might suddenly become an important channel of distribution for food and grocery products want to be ready to step forward as a leader in this field. For many retailers, home shopping could well be one method of gaining incremental customers and sales. Some supermarkets with home shopping claim that approximately 50 percent of their home shoppers did not previously shop at their stores. In addition, Linneman, et al. (1995) reported that retailers with home shopping services started offering home delivery not only to meet specific market segment demands but to gain experience in electronic shopping and foster a progressive image.
Ultimately, when consumers judge the value of home shopping, they weigh the cost of the service against the perceived benefits. Consumers today have high expectations. Many are seasoned catalogue shoppers and have become accustomed to exemplary customer service. They expect this same level of customer service from their home shopping service. Sometimes their expectations are met, however, often, home shoppers are left frustrated. Ideally, home food shoppers are searching for excellence in customer service-from order entry to delivery, they expect the process to be seamless. It should be easy and error-free.
This study investigated retailer operational practices and promotional procedures with respect to their home shopping initiatives and also consumer perceptions of these practices. As such, the majority of the study's implications and challenges to the industry are of an operational nature. These key challenges are elaborated below.
Order Taking
One of the key operational problems of home shopping faced by both the retailer and the consumer is in placing the order. This study found that the primary ordering method was by telephone. Using this method, consumers perused a printed catalogue to search for the items they needed and then phoned the order in to a telephone operator. The method is inefficient for the consumer as well as the retailer and much information used by a shopper when buying buying items from the supermarket in the conventional way is lost by using this ordering method. Visual signals, display areas, aromas, product demonstrations and explanations are all absent, to name but a few.
Retailers must remember that the ordering method essentially replaces the entire information discovery process when the consumer walks through the store. Also, consumers must spend time searching the printed catalogue before compiling an order, thus spending time to perform a task that is intended to save them time and provide greater convenience. In the future,
51

horne shopping services should provide additional product information such as nutrient labeling and product ingredients. In addition, stimulation such as video and audio for on-line computers and pictures and easy to read catalogs for phone and fax ordering should be included in order to provide the shopper with more product information.
Of course, it is not practicable for printed catalogues to carry current prices or a complete listing of the store's items, however point of time prices to serve as benchmarks could be invaluable for consumers. As reported by this survey, fewer than 6 percent of supermarket companies that have printed catalogues list prices for their horne shopping consumers. And yet consumers use prices as a key decision making factor. When prices are not available, companies may find potential customers resisting making a horne shopping purchase. This may be particularly true of the segment with the elderly and shut-ins who may have fixed incomes and may in particular need price information in order to shop cost effectively.
Therefore the method of placing consumer orders must be improved. Computer ordering has the potential to be much more efficient for the consumer and the retailer. Computer catalogues have the ability to carry current prices, sales, new product information, etc. depending on the sophistication of the software and the commitment of the company to maintain current information. In most cases computer technology is not currently used to its best ability. Only 23 percent of the companies surveyed that had computer or on-line catalogues provided price lists. In addition, less than 40 percent of American households currently have a personal desktop or laptop computer at horne and only slightly more than half of these have a modern that will allow them to interface with computer based horne shopping systems. The challenge may be stated as follows: find a means of providing updated catalogues on the computer or provide current prices and product information to customers who do not have computers with moderns.
Order Picking
A strongly held retailer belief that emerged from this study is that horne shopping will never be profitable as long as orders are picked from the supermarket. The added expense of picking orders out of a store after the items have been shipped from the distribution center, and manually placed on the shelves, could be eliminated if a system were in place to pick directly from a central distribution center. A few such warehouse operations exist outside of the United States in Japan and the Netherlands. Several companies in the United States, such as Nash Finch, do have some experience servicing a horne shopping program from a warehouse. However, before warehouse picking becomes feasible, more information regarding logistics and consumer demand is needed.
Consumers demand high quality foods and service at a good value from their supermarkets and will demand the same from any horne shopping service. This means that food quality picked by the service employees needs to at least meet, and consistently meet, with consumers' expectations. This also means that consumers' orders must be error free. Part of the means of providing error free orders is first to ensure that consumers know what they are ordering so they will not be disappointed when the product is received. This should be done by maintaining an excellent ordering process. After this procedures should be in place to check orders received against orders picked. Some retailers have implemented monetary incentives for
52

employees for maintaining perfect orders, others have used radio and computer technology to scan products as they are picked and compare them against the order placed.
However, probably the biggest concern for consumers and retailers is the procedure for selecting products in the case of out-of-stocks or when substitutes are needed. No retailer should accept out-of-stock situations as they lose sales every time a shopper tries to buy product off of an empty shelf. And in the case of home shopping, out-of-stocks are a particular problem since the shopper cannot take part in the decision making process at that point. A program of maintaining all stocks, -especially the sales items and fast turnover items, will do much to avoid disappointing the home shopper. In addition, home shopping services could help educate the shopper on how to shop off the printed shelf as opposed to the supermarket shelf to help avoid disappointments when their orders come without certain products or with brands that they did not order.
Selecting Fresh Foods
Several studies have suggested that consumers who have had no experience with home shopping for food were skeptical about certain aspects of home shopping: "learning about new products," getting the right meats" and "getting the right produce" were considered by most consumers to be "very inconvenient." Yet evidence from some of the retailers in this study suggests that consumers, once educated about the quality of the perishables picked by the supermarket, are quite satisfied with the store's ability to select quality perishables.
For example, five individual home shopping companies reported their most frequently ordered items from a full month of home shopping orders (Table 16). In fact, fifty-six percent of the twenty most frequently purchased items were fresh produce and only an astonishingly low six items from the top 20 most frequently ordered items from all five stores were from the grocery aisles and not perishable products of some type. Moreover, in reports shared by Peapod from its experience in the Chicago market, nine of the top ten most frequently ordered items were also fresh fruits and vegetables (private correspondence). Such a large proportion of fresh food orders flies in the face of grocery industry conventional wisdom that long held that home shopping and delivery would benefit the well defined standards and familiar brand names associated with nonperishable groceries. It was widely assumed that fickle and ever demanding shoppers would not permit a faceless clerk to select fresh foods, sometimes characterized by variable quality. However, proper education for home shoppers about the commitment and ability of home shopping pickers to select fresh foods properly can apparently overcome the perceived problems
. consumers commonly associate with home shopping.
53

Table 16 Top 20 Most Frequently Ordered Items
5 home shopping stores
Supermarket 1 Supermarket 2 Supermarket 3 Supermarket 4 Supermarket 5
bananas bananas bananas bananas bananas iceberg lettuce doz. large eggs iceberg lettuce doz. large eggs baking potatoes navel oranges 1 gal 2% mi1k 1 gal skim milk 24 oz. WW bread California navel
orange doz. large eggs lettuce iceberg skim milk 1/2 gal I gal 2% milk Roma tomatoes 1/2 gal 2% milk cantaloupe green bell peppers 1 gal whole milk red delicious apple Roma tomatoes 1 gal skim milk . 1/2 gal 2% milk iceberg lettuce granny smith apple 12 roll white bath tissue
green seedless grapes
asparagus green bell peppers Anjou pear
1 gal 2% milk green bell peppers broccoli 1/2 gal 2% milk green seedless grapes
yellow onions potatoes 51b bag boneless skinless chicken breast fillet
coca cola classic 12 pk
vineripe tomatoes
extra lean gr beef gr sirloin 88% lean doz. large eggs Minute Maid oj 12 oz
golden delicious apple
celery tomatoes extra Ig fancy
white bread Fresh Express garden salad 1 Ib
green bell peppers
1 qt. 2% milk cucumbers Jennie-O turkey breast
Kleenex facial tissue
cucumber
broccoli strawberries pt grchuck,83%lean Idaho baking potatoes
Sunkist navel oranges
carrots 2 Ib potatoes, baking Campbell's cream of mushroom soup
diet Coke 12 pk strawberries
green onions bunch 1 gal 1% milk carrots 1 Ib tomatoes vine ripe doz. large eggs green cabbage hot dog buns Land 0 Lakes
butter Del Monte lite yellow cling peaches sliced 16
red delicious apple
oz skinless boneless split fryer breasts
I gal whole milk frozen orange juice Idaho potatoes 5 Ib 1 gal 2% milk
russet potatoes 1/2 gal 2% milk omons light wheat bread I gal skim milk Minute Maid frozen oj
onions, yellow lemons green cabbage iceberg lettuce
cottage cheese small curd pt
turkey breast carrots white onions royal gala apple
Delivery
Delivery poses severe operational problems for home shopping. Customers want their delivery at convenient times and expect prompt, accurate service. However, situations may exist when the customer is not at home at the time of delivery. Redelivery would double the cost and
54

may compromise the quality of the perishables. Frozen and refrigerated foods need to be kept at appropriate temperatures from the time they are picked at the store to the time of delivery. Responses from consumers indicated that keeping frozen foods frozen has been a problem even from the same service provider. Furthermore, especially in urban areas, many retailers have concluded that parking problems and security issues are significant enough to warrant at least two drivers effectively doubling delivery costs.
The delivery person becomes the only personal contact the customer has with the company providing the home shopping services, and it is critical that the delivery person be knowledgeable and well trained in handling customer complaints. Like many customer services, home shopping is very labor intensive and requires higher quality labor than other store positions. Order takers must be trained to respond and anticipate problems with customer orders, pickers must be extremely accurate yet quick, and delivery people must be trained and responsible in order to handle customer complaints and questions concerning the home shopping order. For example, King Soopers delivery people are authorized to make "on the spot" refunds if customers are not satisfied with the products that have been selected in this order.
Costs
In order for consumers to justify the cost of using a home shopping service, they must realize that the service provider is picking up certain costs that the consumer normally bears. The time to pick and deliver groceries along with the materials costs of delivery such as the delivery vehicle and gas are usually born by the shopper, however, the service now picks up these costs. However, it also means that the retailer has to provide at least the same quality service that the consumer provides themselves. This means accurate orders and quality goods, and it also means that they receive the same sales, coupon redemptions, frequent shopper purchases, etc.
The service may also consider providing some additional incentives to the consumer such as discounts for large orders, easily understandable receipts, coupon redemption at time of delivery instead of next delivery, or senior citizen discounts on deliveries. These additional efforts would help convince home shoppers that they are indeed getting a value for their money instead of spending extra money for the delivery.
Consumer Perceptions and Shopping Behaviors
The survey revealed that, in general, retailers do not know much about the consumers using home shopping services. Although some information was collected on gender and age, the vast majority of companies do not collect any other consumer information. In order to effectively market and strengthen consumer demand for home shopping, firms need to know who their home shopping customers are, why they are interested in the service and what they most value.
Firms also need to understand possible changes in shopping behavior that may occur when customers shop from a printed catalogue or from a computer screen. Home shopping without the sensory stimulations that are present in a supermarket could significantly change
55

consumers' shopping patterns and behavior. For instance, retailers know there is a reduction in impulse sales for shoppers who place orders from home without entering the store. These shoppers are not tempted by in-store displays or exposed to in-store advertising. One retailer that has been using home shopping for several years indicated that there were virtually no impulse sales from his home shopping customers. He said, "We don't sell any Snickers bars to our home shopping customers."
Also, as customers shop from the home and from limited assortment catalogues they will have little or no opportunity to become familiar with new products in the same way that store shoppers do. In-store samples, displays, and promotions will no longer be able to tempt home shopping customers into trying new products. Printed catalogs are not an effective method for communicating product availability to customers because they are not kept up to date with new products. Many companies print catalogs only a few times each year.
As reported in this study, retailers are relying extensively on outside companies for many of their home shopping operations. Only 25 percent of the firms responding to this survey indicated that they undertake all home shopping operations. Since retailers are not performing all of the functions related to home shopping, they are not gaining the necessary experience to develop their own home shopping system. Of all the operations involved in home shopping, the ones most frequently outsourced were order taking and delivery, two key operations that have many opportunities to improve efficiencies. What's more critical, however, is that these are the two key operations where there is contact with the consumer. Retailers allowing third party contractors to operate their home shopping service due primarily to short run contingencies, risk losing control of one of their single most valuable assets-their shopper data base. Lack of customer knowledge inhibits customer marketing and promotions and, in the long run, customer loyalty.
Communication with home shoppers could be vital. As many focus group participants indicated that they just forgot about the service, retailers should provide regular communications with home shoppers such as newsletters or flyers and should communicate regularly with prospective customers. Instructional classes on ordering methods and how to shop cost efficiently using home shopping could help garner and maintain home shopping customers.
Competition for Home Shopping for Food and Grocery Products
Supermarket companies are projected to face increased competition from a wide range of companies for home shopping dollars. New competitors will come from small, high tech firms that have access to computers and the Internet as well as from grocery wholesalers and distributors that have access to basic food products and understand distribution. Rapidly developing technology including more home computer use will continue to encourage this type of new competitor. The fact that most retailers today are using outside vendors for receiving customer orders and delivery places supermarkets in a precarious position.
56

Making Home Shopping More "Shopper Friendly"
Home shopping today is used principally by busy, time pressed people and seniors or shut-ins. Companies offering home shopping need to learn how to satisfy the average shopper's shopping experience before home shopping will become integrated into their shopping pattern. It will be necessary to solve the operational problems and to understand how to market this service if it is to become a "mainstream" channel of food distribution.
The Role of Food Manufacturers
As home shopping grows and more food is selected off the computer screen instead of the supermarket shelf, it is still unclear how food manufacturers will position themselves in this new venue. Strategies for new products must recognize that shopping via computers limits sensory appeal. Exposure to new products for home shoppers now is mainly gained by television commercials, radio or other mass media. Shoppers who don't visit the store or only visit the store occasionally will miss many of the new product promotions offered in-store.
Currently, home shopping catalogues only offer on average 35 percent of the stock keeping units available from the supermarket. Even many catalogues offered through the computer on-line services offer only a limited selection of the items available in the store. Food manufacturers must find new ways to achieve exposure for their products, in retail catalogues and other channels. This will be particularly a concern of the number 2 and 3 brands in the market. Catalogues generally list the number one brand and private label product. It is possible that limited catalogue space will force many of the lesser brands off the printed "shelf",
Finally, a number of computer catalogues with listed prices allow consumers to sort through various product characteristics: nutritional content, calories and price. Products, for example, can be listed from least to most expensive. This may lead manufacturers to reevaluate their pricing strategies and indeed other product marketing strategies.
Supermarket Strategies
Should home shopping become "mainstream" it could well have a negative effect on sales from the supermarket. Customers would presumedly travel to the supermarket less frequently and there would conceivably be both a reduction in supermarket sales as well as a shift in the mix of products purchased by consumers. Further, it is not clear that the margin
. structure(s) for the market basket that constitutes the home shopping product mix will be as profitable as the current in-store basket, especially without the added stimulus of in-store "impulse purchases". Such impulse purchases often tend to be high margin items. Retailers with excellent physical facilities in their stores and/or large new stores may not want to encourage this. alternative shopping method. Conversely, food companies with poorer/older retail stores might view home shopping as an important method of competing in the market place.
57


Appendix A
Selected International Home Shopping Services
Japan
Home delivery by consumer cooperatives in Japan is one of the most successful in the world. The largest and most successful co-op home delivery program is the Tokyo Co-op which processes 140,000 customers per week. Orders selected in the morning reach the customer by the afternoon of the same day. Home delivery accounts for 50% of co-op sales and from the coops account for 1.3% of all retail food sales.
German (1992) visited some of these successful distribution systems 10 Japan and reported four primary factors which account for their success.
1. good communications with "member" customers: good mailing lists are developed which communicate information to consumers about the benefits of their co-op, including the benefits of home delivery. Mailings about inform members of refunds and rebates. The system provides "an ongoing method of communicating with consumers and of developing new home delivery customers--a factor that is essential in sustaining a home delivery system.
2. large order sizes: consumers are organized into buying groups of 3 or more. Therefore order sizes average about $192.
3. economies of scale: large average orders allow economies of scale that provide low costs and low prices. Delivery charges do not exist, so consumers pay the same price for home delivery that they would shopping in the supermarket.
4. distribution efficiencies: orders are taken and deliveries made once a week. Orders are selected from a list of only 330 items. Most items remain the same throughout the year, however, some seasonal items change. Consumers receive a new catalogue of items and prices every week. Orders are selected from a distribution center where items are picked by pickers on an assembly line.
The Netherlands
Introduction: Albert Heijn Thuisservice (Homeservice) is a home shopping service in the Netherlands which was established in 1984 under the name of James Telesuper. It was bought two years later by Albert Heijn, a division of Royal Ahold. Albert Heijn sees the home shopping service as an investment for the future since the market is expected to grow rapidly, and therefore
59
it is constantly developing and improving its operations. It is the only home delivery service for groceries in the Netherlands offered by a supermarket chain.
Operations: Albert Heijn offers a printed catalogue as well as an on-line catalogue and CD-i. The catalogues contain approximately 3,500 items whereas an average Albert Heijn store contains about 10,000 items. The CD-i catalogue contains pictures of several of the products as ., well as TV advertisements and sound effects. Customers can place their orders by fax, telephone, PC, or CD-i.
Albert Heijn Thuisservice only operates in a relatively small area in Holland, roughly speaking The Randstad which encompasses the most heavily populated area of The Netherlands. Amsterdam, The Hague, Rotterdam, and Utrecht. The Thuisservice is currently picking most items from a centrally located picking center.
Picking: Products are picked from a central warehouse. Sticky labels are produced for each container by the Information Technology (IT) system. This system creates labels and generates the picking list according to the warehouse layout. Containers are pushed along roller conveyers and the pickers operated within zones. Meat and other short life products are delivered to the warehouse from the store and combined with the customer orders. Out of stock goods or substitutions are replenished from local stores. If the item is out of stock at the store, a similar item will be picked.
Delivery: Albert Heijn uses customized delivery vehicles with dry ice cooled freezers. Small box vans (18 ft.) are the largest it can operate with a passenger car license. During the day, there are two delivery periods: 9 a.m. -1 p.m. and 5 p.m.-9 p.m., within which customers can choose a two hour window. The minimum order is around $45. On delivery, recyclable bottles are collected.
Payment: Charges very depending on the delivery day, time and methods of ordering and payment. Credit cards are not accepted. The maximum delivery charge is $8.25 with discounts for electronic ordering and payment and the requested delivery time.
France
In 1984 Telemarket, a supermarket home delivery service, started service on France Telecom's new Minitel terminals. Minitel is a teletext service using a visual screen that is linked to the telephone line. Text information on holidays, travel, hotels, advertising, etc. can be provided on request through the telephone line. Minitel terminals were placed mainly in households to replace paper telephone directories. Currently there are 12,000 information service providers who offer 24,500 services via Minitel.
Interactive home shopping via Minitel was made possible. Consumers can place grocery orders which are then delivered for a fee of around 10 percent to the order. The delivery service, Telemarket, operates only in the center and suburbs of Paris and has no plans to expand the operation to other parts of France. Customers can use attractive color brochures with photographs of many products. Approximately 2,400 items are available. Products are also
60
listed on the Minitel tenninal, but the screen is small and the presentation is text based and therefore difficult to brave through.
Telemarket is backed by Monoprix, a supennarket, which has invested in the delivery company and which is very interested in the challenge of new technology.
About 50-60 percent of orders are sent through Minitel and received directly at a central picking center. Thirty to forty percent are placed via the telephone and approximately 10 percent are faxed to an outsourced telesales center operation then directed to the picking center. Deliveries are made in temperature controlled vans from Monday through Saturday.
Minitel users are as follows: 60% female 37% are between 35-49 years of age 68.8% working 56.8% middle management or senior executive 59.9% have access to Minitel at home only
Other supennarkets use Minitel but not for home shopping. Other uses include: consumer infonnation, receiving orders for customer pickup, and helping customers make lists before shopping.
61


Appendix B
Retailer Survey
Home Shopping: What's in Store
63

A STATUS SURVEY OF HOME SHOPPING
Home shopping is a tenn used to describe all of the various activities associated with buying retail goods from the home or office without having to visit the supennarket checkout lane. The supennarket industry is moving quickly to provide customers with home shopping in order to 1) meet specific market segment demands, 2) gain experience in providing home shopping services and 3) foster a progressive image.
The purpose of the following questions is to document the current status of home shopping acceptance, adoption, and perceived benefits to the supennarket retailer.
l.a. Do you currently offer any home shopping services?
___Yes, go to Question l.b.
__------'No, Why not? go to Question 2.
1b. Please check the services you offer.
home home office ordering delivery store pickup delivery
D D D D
2.a. Do you plan to offer home shopping services within 2 years?
__~Yes, go to Question 2.b.
__------'No, Why not? _
_____________________---..ego to Question 3.
2.b. Please check the services you plan to offer within 2 years.
home home office ordering delivery store pickup delivery
D D D D 3.a. Have you ever offered home shopping services that you do not currently offer?
___Yes, go to Question 3.b.
__------'No, go to Question 4.
3.b. Please check the services you used to but no longer offer.
home home office ordering delivery store pickup delivery
D D D D
64

3.c. When did you offer home shopping services that have since been discontinued?
service: when to when: _
3.d. Why did you discontinue the services checked above?
home orderinge. _
home delivery _
store pickup _
office delivery _
home pickup, _
Ifyou checked Yes to Question La. and therefore currently offer a home shopping service, please continue with the survey. Ifyou checked No to Question 1, please skip to Section D: Company Information, page 11.
4. When did your company introduce your home shopping service?
(month & year)
5. In what geographic areas do you offer home shopping? e.g. cities, counties, zipcodes, etc.
Section B: Customer Demographics Please leave this section blank ifcustomer demographics are unavailable to you.
1. What percent of your home shoppers are:
Female %
Male %
65

2. What percent of your home shoppers are in the following age groups?
under 35 %
35 to 64 %
65 and over %
3. What percent of your home shopper households are in the following income levels?
all shoppers home shoppers
$20,000 and under % %
$20,001 - $40,000 % 0/0
$40,001 - $60,000 % %
over $60,000 % 0/0
Section C: Operations Please answer this section as accurately as possible.
1. Please indicate the average number of households, orders per week, and sales per week accounted for by your home shopping service:
2 years data not 2 years ago currently from now available
households
orders per week
sales per week
2.
DDD
What is your average sales per home shopping order (not including delivery or other charges)?
$ D data not available
3. Home shopping sales are what percent of your company's total sales in the area(s) where you offer home shopping?
% D data not available
66
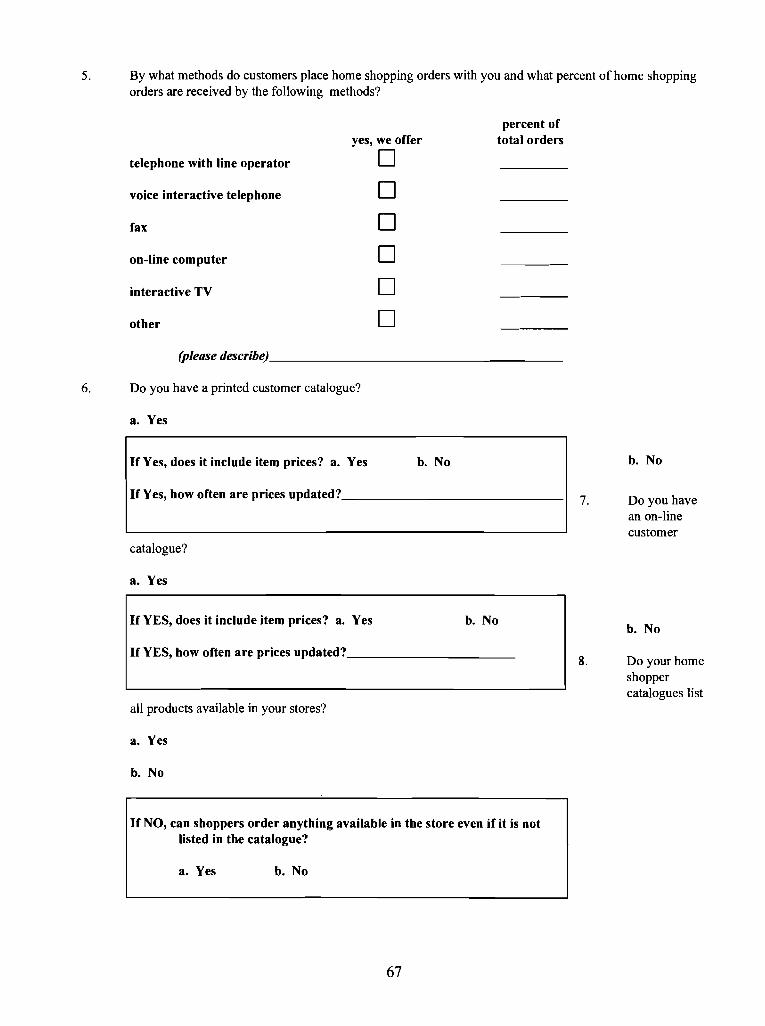
5. By what methods do customers place home shopping orders with you and what percent of home shopping orders are received by the following methods?
percent of yes, we offer total orders
telephone with line operator o voice interactive telephone o fax o on-line computer o interactive TV o other o
(please describe) _
6. Do you have a printed customer catalogue?
a. Yes
If Yes, does it include item prices? a. Yes b. No b. No
If Yes, how often are prices updated?
catalogue?
1 7. Do you have
an on-line customer
a. Yes
If YES, does it include item prices? a. Yes b. No b. No
If YES, how often are prices updated?
all products available in your stores?
_ 8. Do your home
shopper catalogues list
a. Yes
b. No
If NO, can shoppers order anything available in the store even if it is not listed in the catalogue?
a. Yes b. No
67
9. How many SKU's are available to home shoppers from your stores and from your home shopping catalogues in each of the following categories?
#SKU's in store catalogue
Total
groceries-food
groceries-non-food _
frozen
bakery
dairy
deli
meat
produce
GM/HBC
Other
10. On which days and times do you accept orders?
11. On which days and times do you deliver orders?
12. Do you have a minimum order size? (Please circle response)
a. Yes If Yes, what is the minimum order? _
b. No
68

13. Do you have a maximum order size? (Please circle response)
a. Yes IfYes, what is the maximum order? _
b. No
J
14. Do you offer (please check all that apply):
D same day delivery?
D same day delivery if ordered before ?
D next day delivery if ordered before ?
D other (please describe) _
?
15. Who carries out the following functions?
own contract does personnel service not apply
a. taking orders D D D b. order picking D D D c. order delivery D D D d. collecting payment D D D e. program promotion D D D f. other D D D
(please describe)
16. If you checked "contract service" for any of the above, whose services do you use? (Please list all those that apply)
69

17. Approximately how many employees perform the following functions?
number of number of does not full time personnel part time personnel apply
DDD
DDD
DDD
a. taking orders
b. order picking
c. order delivery
18. What percent of orders are picked from:
a. warehouse ----'---'O"C=o b. stores --'%~o
19. If you do pick from stores, from how many stores do you pick home shopping orders?
20. How much do you charge for delivery? (please circle andjill in all appropriate responses)
a. flat rate $, _
b. flat rate $, plus % of total bill %
c. other (please describe), _
21. What is your average delivery charge?
$,-------
22. Which of the following payment methods do you accept, and what percent of your orders are made by the following payment methods?
Yes, we accept %of data not available this method orders
D DCash %
D DCheck %
D DCredit card %
D DDebit card (EFT) 0/0
0/0Food stamps D D Women, Infants, and Children D 0/0 D
(WIC)
Other please specify 0/0
(Total 100%)
70

23. Please indicate how important your home shopping service is in regards to the following factors:
not somewhat very important important important important
a. enhancing store image D 0 D D b. being financial profitability D D D D c. increasing customer loyalty D D D D d. increasing store sales D D D D
24. Please indicate how you would rate the perfonnance of your home shopping service in regards to the following factors:
poor good excellent fantastic
a. enhancing store image D D D D b. being financial profitability D D D D c. increasing customer loyalty D D D D d. increasing store sales D D D D
25. How do you advertise your home shopping service? Please check all that apply.
___~instore flyers __~radio
___-'free standing inserts __-----!television
___-'catalogue mailings __-----!newspaper ads
__----'other (please describe), _
Section D: Company Information
1. My company operates supennarkets.
2. My company's approximate 1994 sales were $, (million).
3. My current job title is:
4. Do you have the primary responsibility for the home shopping program in your company?
71

a. Yes
b. No, ifNO,who, _
c. Phone numer ( ..)). _
THANK YOU FOR YOUR HELP IN THIS IMPORTANT STUDY! PLEASE ENCLOSE THE COMPLETE QUESTIONNAIRE IN THE
ENVELOPE PROVIDED AND MAIL IT TO US TODAY.
-
72

If you would like a copy of the report of the survey results, please provide the following information. (This page will be separatedfrom the questionnaire to ensure the confidentiality ofyour response).
Name _
Title, --'- _
Company _
Street Address, _
City ---"State ----'zip code _
Additionally, we would be happy to send you a copy of any ofthe following recent Cornell University' Food Industry Management Program reports. Please check those of interest, and we will enclose them with the survey results.
__German, Gene A., Gerard Hawkes, and Debra Perosio, "Supercenters: The Emerging Force in Food Retailing."
__McLaughlin, Edward W. and Gerard Hawkes, "Category Management: Current Status and Future Outlook."
__McLaughlin, Edward W., Gerard Hawkes, Kristen Park, and Debra Perosio, "Supermarket Bakery Consumers: Attitudes, Preferences, Behaviors."
__McLaughlin, Edward W., Gerard Hawkes, and Debra Perosio, "Wholesale Club Stores: The Emerging Challenge."
__McLaughlin, Edward W., and Debra Perosio, "Fresh Fruit and Vegetable Procurement Dynamics: The Role of the Supermarket Buyer."
If you have any questions regarding this study or this questionnaire, please contact:
Kristen Park Food Industry Management Program
252 Warren Hall Cornell University Ithaca, NY 14853
Phone: (607) 255-7215 Fax: (607) 255-4776
-
73
References
Bureau of the Census, Population and Housing. U.S. Department of Commerce. World Wide Web homepage: http://www.census.gov/.
Bureau of Labor Statistics. U.S. Department of Labor. World Wide Web: http://stats.bls.gov:80/cgi-binlsurveymost?lf.
Cauley, Leslie, "Bell Curves: Phone Giants Discover the Interactive Path is Full of Obstacles." Wall Street Journal, July 24, 1995.
Debow, Yvette, "Online Groceries: Retailers' Future?" Online Marketplace, July 1995. Jupiter Communications. http://www.jup.com.
Eng, Paul and Mark Lewyn, "On-Ramps to the Info Superhighway." Business Week, February 7, 1994.
Food Institute Report, "New Surveys: In-Store Promotions; Shopping "On-Line"; Brands Vs. PL." November 21,1994.
Food Marketing Speaks, 1994, Food Marketing Institute, Washington, D.C.
"Peapod Doesn't Sell Groceries, It Sells Time." Food People, May 1994.
Fox, Bruce, "Highway or Hypeway?" Chain Store Age Executive, January 1995.
German, Gene, "The Home Delivery System for Food and Non-food Products." Working paper, Agricultural Economics, Cornell University, Ithaca, New York.
"Growing Number of Grocery Shoppers in Chicago, San Francisco Think PeaPod® When It's Time to Shop." Grassroots, August 1995.
Illingworth, Montieth M., "Your Roadmap to the Information Superhighway." Hemispheres, August 1994.
"Information Highway Advice: Buckle Up!," Chain Store Age Executive, April 1995.
Linneman, Robert E., Patrick Kirschling, and Richard Kochersperger, "Home Delivery: Are There Solid Gains or are Payoffs Yet to Come?" Presentation at FMI Annual Trade Show, May 1995.
Loro, Laura, "Home-Shopping Tests Spread." Advertising Age, November 21, 1994.
Losee, Stephanie, "Information Technology." Fortune, April 18, 1994.
74

Maresca, Thomas, "Jupiter's Home PC Projections." Consumer Information Appliance, April 1995, Jupiter Communications.
Reda, Susan, "Will Consumers Catch up with Interactive Shopping?" Stores, March 1995.
"Selling Direct." Selling National Accounts Monthly, February 1995.
Tauber, Edward M., "Why do People Shop?" Journal ofMarketing, October 1972.
Trends in the United States: Consumer Attitudes and the Supermarket, 1994, Food Marketing Institute, Washington, D.C.
Triplett, Tim, "Smart Store Challenges Executives to Change." Marketing News, July 4, 1994.
-
75

Food Industry Management Program
Available Publications
The following publications are available at $25 each. Discounts are available on multiple copies ofany individual report. Direct orders to: Cornell University, 251 Warren Hall, Ithaca, NY 14853-7801, or phone 607/255-1622 or fax 607/255-4776.
Dairy Department Procurement Dynamics, Edward W. McLaughlin and Debra 1. Perosio, April 1996.
Supermarket Bakery Consumers, Attitudes, Preferences, Behaviors, Edward W. McLaughlin, Gerard Hawkes, Kristen Park and Debra Perosio, February 1995.
Category Management, Current Status and Future Outlook, Edward W. McLaughlin and Gerard F. Hawkes, December 1994.
Fresh Fruit and Vegetable Procurement Dynamics: The Role ofthe Supermarket Buyer, Edward W. McLaughlin and Debra 1. Perosio, February 1994.
Supercenters: The Emerging Force in Food Retailing, Gene A. German, Gerard F. Hawkes and Debra 1. Perosio, October 1993.
State of the New York Food Industry, Edward W. McLaughlin, Gerard Hawkes, Debra Perosio, and David Russo, February 1992.
Item Pricing in New York State, Gene A. German and Debra 1. Perosio, November 1991.
Strategic Directions in Supermarket Deli/Prepared Foods, 10hn W. Allen, Edward W. McLaughlin and Thomas R. Pierson, August 1990.
-
76

OT E S
No. 95-20
No. 95-21
No. 95-22
No. 95-23
No. 95-24
No. 96-01
. 96-02
No. 96-03
o. 96- 4
Seneca County's Local Governments: opportu i ies for Intergovernmental Cooperation, Needs for Educational and Tec nical Assistance
Farm Income Tax Management and Reporting Reference Manu I
Income Tax Implications for Farmers Receiving New York city Watershed Agricultural Program Paym ts
New York Economic Handbook 1996 Agricultural Situation and Outlook
Bee Economics A Computer Model for Economic Analysis of Beekeeping Operations
Fruit Farm B siness Summary Lake Ontario Region New York 1994
Micro DFBS A Guide to Processing Dairy Fa Business Summaries in County and Regional xtension Offices for Micro DFBS version 3.2
The Return of Agricultural Lands to Forest C anging Land Use in the Twentieth Century
DFBS Expert System For nalyzin Dairy Farm Bu ine ses Users' Guide for Version 6.0
David Kay Duane Wilcox
Stuart F. smit Charles H.
Cuykendall
John M. Thurgood
A.R.M.E. Staff
Lois Sc er z Willett Nicholas
Calderone Malcome T. Sanford
Gerald B. White Alison M. DeMarree Linda D. Putnam
Linda D. Putnam Wayne A. Knob auc Stuart F. Smith
Bernard . Stanto Nelson L. Bills
Linda D. Putnam Stuart . smith