habitat relationships and life history of the rota … · habitat relationships and life history of...
TRANSCRIPT

Habitat Relationships and Life History of the
Rota Bridled White-eye(Zosterops rotensis)
by
Frederick A. Amidon
Thesis submitted to the Faculty of the
Virginia Polytechnic Institute and State University
in partial fulfillment of the requirements for the degree of
MASTER OF SCIENCE
IN
FISHERIES AND WILDLIFE SCIENCE
APPROVED:
Carola A. Haas, ChairJohn M. MortonDean F. Stauffer
Jeffrey R. Walters
October 9, 2000Blacksburg, Virginia
Keywords: Habitat, Foraging Behavior, Breeding Biology, Zosterops rotensis,Zosterops conspicillata, Mariana Islands
ii
HABITAT RELATIONSHIPS AND LIFE HISTORY OF THE ROTA BRIDLED WHITE-EYE (Zosterops rotensis)
Frederick A. Amidon9 October 2000
(ABSTRACT)
The Rota bridled white-eye (Zosterops rotensis)(Aves, Passeriformes) has
experienced a severe population decline and range restriction over the last four decades.
Little is known about this species and factors involved in the decline and range restriction
are unclear. This study examined the potential roles of habitat alteration, introduced
black drongos (Dicrurus macrocercus), and introduced rats in the decline and gathered
more information on the behavior and breeding biology of this species. New life history
data were collected and Rota and Saipan bridled white-eyes were found to differ in nest
site characteristics and some behaviors. The importance of habitat alteration was
assessed by examining Rota bridled white-eye habitat relationships at the microhabitat,
within-range, Sabana-wide, and island-wide levels. Rota bridled white-eyes show a
preference for high elevation wet forest but what drives their distribution within their
current range was unclear. However, the alteration of this forest type by supertyphoon
Roy in 1988 was probably the major factor in the decline of Rota BWEs between 1982
and 1996. Black drongo and Rota bridled white-eye relationships were addressed using
current and historical survey data. Black drongos were found to prey on Rota bridled
white-eyes but they probably only played at most a partial role in the decline of the Rota
bridled white-eye. Introduced rats densities were assessed in Rota bridled white-eye areas

iii
and on other areas of the island and no evidence for rat numbers limiting Rota bridled
white-eyes to their current range was found.

iv
ACKNOWLEDGEMENTS
I would like to thank my advisor, Dr. Carola Haas, and the members of my
committee, Drs. John Morton, Dean Stauffer, and Jeffrey Walters, for critically reviewing
this thesis. John Morton and Carola Haas also deserve special thanks for providing me
with this valuable opportunity and many others. I would like to thank my technicians,
Rebecca Dymzarov and Michelle Rogne, for all of their assistance. Sheldon Plentovich
(USFWS- Honolulu), Nathan Johnson (CNMI-DFW), Shona Lawson, Tina Lee, Shane
Pruett, and Mike Vamstad also provided valuable field assistance. USFWS personnel
Leila Gibson, Michael Lusk, Karen Rosa, and Rob Low were very helpful in providing
me with much needed assistance and background information. Hiroyoshi Higuchi
provided a translation of information on the Japanese white-eye and Jiro Kikkawa
provided useful information on attracting and studying white-eyes. I would also like to
thank Dr. Glenn Olsen (BRD-Patuxent) for taking the time to help me with the avian
disease aspect of this study, even though it proved unproductive. Finally, I would like to
thank Stan Taisacan for allowing me access to his land and for providing valuable
information about the Rota bridled white-eye. All funding for this project was provided
by the USFWS Pacific Islands Ecoregion. All research was conducted under Federal Bird
Marking and Salvage Permit 22570 and CNMI Fish and Game Permit 98-1447.

v
TABLE OF CONTENTS
LIST OF TABLES............................................................................................................viii
LIST OF FIGURES............................................................................................................. x
LIST OF APPENDICES.................................................................................................. xiii
INTRODUCTION................................................................................................................1
METHODS AND STUDY AREA.......................................................................................9Data Collection.......................................................................................................11
Rota Bridled White-eye Life History..............................................................11Breeding Biology............................................................................11Behavior.........................................................................................12
Seasonal Effects..............................................................................................13White-eye Population Estimate.......................................................................15Habitat Alteration............................................................................................15
Microhabitat Relationships.............................................................15Within Range Relationships...........................................................17Sabana-wide Relationships.............................................................18Island-wide Relationships..............................................................21Insect Relationships....................................................................... 21
Black Drongos................................................................................................ 23Rat Populations...............................................................................................25
Statistical Analysis.................................................................................................26
RESULTS...........................................................................................................................30Rota Bridled White-eye Life History......................................................................30
Breeding Biology............................................................................................30Behavior......................................................................................................... 32
Seasonal Effects..................................................................................................... 34White-eye Population Estimate..............................................................................35Habitat Alteration...................................................................................................36
Microhabitat Relationships.............................................................................36Within Range Relationships...........................................................................36Sabana-wide Relationships.............................................................................38Island-wide Relationships...............................................................................38Insects Relationships.......................................................................................39
Black Drongos........................................................................................................41Rat Populations...................................................................................................... 43
vii
DISCUSSION.................................................................................................................... 44Rota Bridled White-eye Life History..................................................................... 44Seasonal Effects..................................................................................................... 46White-eye Population Estimate..............................................................................46Habitat Alteration...................................................................................................47Black Drongos........................................................................................................54Rat Populations...................................................................................................... 55Management Recommendations........................................................ ....................55
LITERATURE CITED.......................................................................................................59
VITA..................................................................................................................................121

viii
LIST OF TABLES
Table 1. Correlations between habitat variables and the first three principal componentsextracted from data recorded at 20 Rota bridled white-eye study sites on Rota,1998 and 1999..................................................................................................66
Table 2. Nest dimensions of Rota, Saipan, and Tinian bridled white-eye nests recordedin the Commonwealth of the Northern Mariana Islands, 1999. Wilcoxon rank-sum tests were used to determine the difference between Rota and Saipanbridled white-eye nests.....................................................................................67
Table 3. Nest site characteristics of Rota and Saipan bridled white-eye nests recordedon the islands of Rota and Saipan, CNMI, 1998 and 1999..............................67
Table 4. Method used to produce a crude estimate of the Rota bridled white-eyepopulation size within five study regions on Rota, CNMI in 1998 and 1999..68
Table 5. Mean habitat characteristics for Rota bridled white-eye foraging habitat use (n= 32) and availability (n = 32). See text for descriptions of habitatmeasurements...................................................................................................68
Table 6. Proportion of Rota bridled white-eye foraging substrate types and substratespecies used and available in two Rota bridled white-eye study plots on Rota,CNMI 1998 and 1999.......................................................................................69
Table 7. Mean density per hectare indices and frequency of birds detected over threesurvey periods in study plots designated high (> 2 white-eyes/ha) and low (< 2white-eyes/ha) density Rota bridled white-eye areas by Fancy and Snetsinger(1996) on Rota, 1998 and 1999........................................................................70
Table 8. Mean descriptive habitat characteristics for areas designated high (> 2 white-eyes/ha) and low (< 2 white-eyes/ha) density Rota bridled white-eye areas byFancy and Snetsinger (1996) on Rota, 1998 and 1999. See text fordescriptions of habitat measurements.............................................................. 71
Table 9. Composition of woody flora (> 10 cm dbh) per hectare within ten study plotsdesignated low (< white-eyes/ha) and ten study plots designated high (> 2white-eyes/ha) density Rota bridled white-eye areas by Fancy and Snetsinger(1996)...............................................................................................................72
Table 10. Regression coefficients from stepwise multiple linear regression analyses for

ix
three bird species occurring in Rota bridled white-eye study plots on Rota,1998 and 1999. Sample size for all regressions was 18..................................74
Table 11. Regression coefficients from stepwise multiple linear regression analysis forRota bridled white-eye abundance estimates on nine transects with 57 stationsin the Sabana region of Rota, 1999. Model was significant (P<0.001) with anR2 of 0.57..........................................................................................................74
Table 12. Presence and absence of woody flora (> 10 cm dbh) within five Rota bridledwhite-eye study areas on the Sabana and six Mariana crow study sites atvarious locations around the island of Rota, CNMI.........................................75
Table 13. The five woody species (> 10 cm dbh) in each of the twenty Rota bridledwhite-eye study plots with the highest basal areas and densities on Rota,CNMI, 1998 and 1999......................................................................................77
Table 14. Pearson’s correlation coefficients for abundance estimates of six bird specieswithin 35-m radius sampling stations along transects on the Sabana region ofRota in 1982 (n = 66) and 1994 (n = 136)........................................................78
Table 15. Mean black drongo detection per transect estimates for the Sinapalo, Sabana,and intermediate regions of Rota in 1982, 1995, and 1998..............................78
Table 16. Number of rats captured in 40 snaptraps in Rota bridled white-eye and fourMariana crow study areas in April 1999 on Rota, CNMI.................................79
Table 17. Approximate duration (days) of incubation period, nestling stage, andfledgling stage for four white-eye species (Zosteropidae)............................... 79
x
LIST OF FIGURES
Figure 1. Locations of the Sabana and the village of Songsong on the island of Rota,CNMI............................................................................................................... 80
Figure 2. Locations of areas designated high and low density Rota bridled white-eyeareas by Fancy and Snetsinger (1996)..............................................................81
Figure 3. Locations of Rota bridled white-eye study areas and study plots on the islandof Rota, CNMI................................................................................................. 82
Figure 4. Locations of Mariana crow study sites on the island of Rota, CNMI..............83
Figure 5. Locations of the 25 transects surveyed using the variable circular plot methodin 1982, 1997, 1994, 1995, and 1998 on Rota, CNMI. See Appendix E forinformation on how transect labels changed across years................................84
Figure 6. Locations of variable circular plot transects considered part of the Sabana,Sinapalo, and intermediate (areas not included in Sabana and Sinapaloregions) regions of Rota, CNMI.......................................................................85
Figure 7. Monthly rainfall levels (inches) recorded at the Rota Airport on the island ofRota, CNMI in 1998 and 1999. Data from the NOAA webpage for the RotaAirport (see text for details).............................................................................86
Figure 8. Rota bridled white-eye foraging behaviors observed during the wet (June -August) and dry (February - April) seasons on Rota in 1998 and 1999...........87
Figure 9. Foraging substrate types used by Rota bridled white-eyes in the wet (June -August) and dry (February - April) seasons on Rota in 1998 and 1999.......... 87
Figure 10. Tree species used for foraging by Rota bridled white-eyes in the wet (June -August) and dry (February - April) seasons on Rota in 1998 and 1999.......... 88
Figure 11. Perch diameters used by foraging Rota bridled white-eyes during the wet (June- August) and dry (February - April) seasons on Rota in 1998 and1999..................................................................................................................88
Figure 12. Foraging locations of Rota bridled white-eyes observed during the wet (June -August) and dry (February - April) seasons on Rota in 1998 and1999..................................................................................................................89

xi
Figure 13. Foraging heights used by Rota bridled white-eyes during the wet (June -August) and dry (February - April) seasons on Rota in 1998 and 1999.......... 89
Figure 14. Foraging methods used by Rota bridled white-eyes on Rota in 1998 and 1999and Saipan bridled white-eyes on Saipan (Craig 1989, 1990), CNMI.............90
Figure 15. Perch sizes used by foraging bridled white-eyes on Rota in 1998 and 1999 andSaipan bridled white-eyes on Saipan (Craig 1989, 1990), CNMI....................90
Figure 16. Foraging substrates used by Rota bridled white-eyes on Rota in 1998 and 1999and Saipan bridled white-eyes on Saipan (Craig 1989, 1990), CNMI.............91
Figure 17. Rota bridled white-eye non-foraging behaviors recorded in the wet (June -August) and dry (February - April) seasons on Rota in 1998 and 1999...........91
Figure 18. Mean (± SE) number of insects and snails per branch recorded during the wet(June - August) and dry (February - April) seasons in Rota bridled white-eyestudy areas on Rota, 1999.................................................................................92
Figure 19. Mean (± SE) number of insects recorded per branch in the wet (June - August)and dry (February - April) seasons on four tree species sampled in Rotabridled white-eye study areas on Rota in 1999.................................................92
Figure 20. Mean (± SE) number of snails recorded per branch in the wet (June - August)and dry (February - April) seasons on four tree species sampled in Rotabridled white-eye study areas on Rota in 1999.................................................93
Figure 21. Differences in the percentage of trees flowering or fruiting between the wet(June - August) and dry (February - April) seasons in five Rota bridled white-eye study areas on Rota in 1999.......................................................................93
Figure 22. Differences in percentage of tree species fruiting and flowering between the
wet (June - August) and dry (February - April) seasons in five Rota bridledwhite-eye study areas on Rota in 1999.............................................................94
Figure 23. Mean (± SE) abundance per hectare indices of six bird species in Rota bridledwhite-eye study plots in three survey periods on Rota, 1998 and 1999...........94
Figure 24. Locations of transects surveyed on the Sabana in April 1999 on Rota,CNMI............................................................................................................... 95

xii
Figure 25. Locations of upper and lower elevation insect biomass transects sampled inJuly 1999 on Rota, CNMI................................................................................ 96
Figure 26. Mean milligrams of eight insect orders per gram of plant mass between upper(380-450 m) and lower (150-250 m) elevations in mature Elaeocarpus jogatrees along three transects on Rota in July 1999..............................................97
Figure 27. Mean number of insects in six families sampled at upper (380-450 m) andlower (150-250 m) elevations in mature Elaeocarpus joga trees along threetransects on Rota in July 1999......................................................................... 97
Figure 28. Mean (± SE) number of snails and insects per branch sampled at three high (>2.5 white-eyes) and three low (< 1.0 white-eye) abundance Rota bridled white-eye study plots on Rota in 1999....................................................................... 98
Figure 29. Mean (± SE) milligrams of insect per gram of plant mass and mean number ofsnails per gram of plant mass sampled at upper (380-450 m) and lower (150-250 m) elevations in mature Elaeocarpus joga trees along three transects onRota in July 1999............................................................................................. 98
Figure 30. Mean (± SE) abundance estimates of six bird species recorded along fourtransects on the Sabana in 1982 (Engbring et al. 1986) and 1994 (USFWS,unpubl. data) on Rota, CNMI. An asterisk by the species indicates adifference between years (T-test, P < 0.10)..................................................... 99
Figure 31. Mean (± SE) black drongo abundance indices in exterior (< 150 m from edge)and interior (> 150 m from edge) Rota bridled white-eye study plots in threesurvey periods on Rota in 1998 and 1999........................................................99
Figure 32. Stomach contents of female and male rats (Rattus tanezumi) trapped on Rotabridled white-eye study sites in April 1999 on Rota, CNMI..........................100

xiii
LIST OF APPENDICES
Appendix A. GPS locations of Rota bridled white-eye study plots on Rota, CNMI, in1998 and 1999..........................................................................................101
Appendix B. Locations of study plot point count stations on Rota, CNMI during 1998and 1999. All point count stations marked with a square were notincluded in estimates of bird abundance...................................................103
Appendix C. Program Distance (Laake et al. 1998) estimates of effective detection radiiof 11 bird species recorded in Rota bridled white-eye study plots in 1998and 1999....................................................................................................104
Appendix D. Program Distance (Laake et al. 1998) estimates of effective detectionradius (EDR) for three point count stations in 20 Rota bridled white-eyestudy plots on Rota in 1998 and 1999.......................................................105
Appendix E. Number of stations and observers for each transect sampled using variablecircular plot counts of birds in five survey periods on Rota, CNMI. SeeFigure 5 for locations of transects.............................................................106
Appendix F. Program Distance (Laake et al. 1998) estimates of effective detectionradius (EDR) in meters for six bird species during 1982 and 1994 surveyson Rota, CNMI.........................................................................................108
Appendix G. Locations of Rota bridled white-eye nests found in 1997, 1998, and 1999on Rota, CNMI.........................................................................................109
Appendix H. Nest discovery dates, fledging dates, and approximate durations of theincubation and nestling stages for all known Rota bridled white-eye nestsdiscovered as active nests on Rota, CNMI...............................................110
Appendix I. Banding and resighting information on nine Rota bridled white-eyesbanded in 1998 and 1999 on Rota, CNMI................................................111
Appendix J. Photograph of a Rota bridled white-eye nest found in a Merrilliodendronmegacarpum in 1999 on Rota, CNMI......................................................112
Appendix K. Average number of insects and snails recorded per branch during sixsampling periods in Rota bridled white-eye study plots on the island ofRota, CNMI in 1999.................................................................................113

xiv
Appendix L. Percentage of five study areas containing fruiting (S) or flowering (F)members of 22 woody plant species over 12 two-week periods on Rota,CNMI in 1999.......................................................................................... 114
Appendix M. Breeding characteristics of 16 white-eye species (Zosteropidae).............118
Appendix N. Unsuccessful research methods used during this study on Rota bridledwhite-eyes on Rota in 1998 and 1999......................................................120

1
INTRODUCTION
The Rota bridled white-eye (Zosterops rotensis) is a small bird (9-10 g) found
only on the island of Rota, Commonwealth of the Northern Mariana Islands (CNMI).
Rota is part of the Mariana Archipelago, a chain of 15 volcanic islands located in the
western Pacific. The Rota bridled white-eye (Rota BWE) was originally classified
Zosterops conspicilliata rotensis, a subspecies of Zosterops conspicillata, with Mariana
Island subspecies found on both Saipan and Tinian (Z. c. saipani) and one, currently
extinct, subspecies on Guam (Z. c. conspicillata) (Stresemann 1931). However, based on
recent genetic work (Slikas et al. 2000) and observations of differences in plumage,
vocalizations, and behavior by H. D. Pratt and colleagues (Pratt et al. 1987, Collar et. al.
1994), the Rota BWE is treated here as a full species.
Unlike the well studied silvereye (Zosterops lateralis) (Catterall et al. 1982,
1989; Kikkawa and Wilson 1983; Wilson and Kikkawa 1987; and others) and the
recently studied Saipan bridled white-eye (Saipan BWE) (Craig 1989, 1990), the Rota
BWE has not received much research attention. Before this study, work on the Rota
BWE focused on population estimation (Engbring et al. 1986, Engbring 1987, Ramsey
and Harrod 1995, Fancy and Snetsinger 1996) along with a few publications on nest
descriptions (Yamashina 1932, Pratt 1985, Lusk and Taisacan 1997) and behavior (Craig
and Taisacan 1994). Consequently, little is known about this species.
In 1991, the Rota BWE was listed as threatened or endangered by the CNMI
government (the CNMI makes no distinction between the threatened and endangered

2
categories) (Public Law 2-51). Presently, the Rota BWE is also a candidate species for
protection under the U.S. endangered species act (61 FR 7596). The listing of this
species by both governments was a result of concern over the apparent population decline
and range restriction of the species over the last several decades.
Early descriptions of the Rota BWE by Baker (1948) describe this species as
“numerous” and found at lower elevations. Residents of Rota during the post-war years
(>1945) also remember seeing Rota BWEs at low elevations in Songsong village (Fig. 1)
(Engbring et al. 1986). However, in 1975, Pratt et al. (1979) found no Rota BWEs in the
lowland areas and only observed birds on the central plateau region (Sabana)(Fig. 1). In
1977, Ralph and Sakai (1979) estimated Rota BWE densities to be 22 birds/km2, (17% of
the density reported on Saipan, CNMI) although the majority of their work was done
using roadside counts on the Sabana, which may have resulted in lower counts.
The first island-wide survey of forest birds on Rota was conducted in 1982.
During this survey Rota BWEs were only found in forested areas above 300 m elevation
(Engbring et al. 1986). The average BWE density on Rota was determined to be 296/km2
(6% of the average density of BWEs on the island of Tinian, CNMI) with an island
population estimate of 10,763 birds (95% CI = 8,270 to 13,256 birds). Other surveys
following the 1982 survey showed little change in the Rota BWE distribution but did
show a decline in white-eye numbers (Engbring 1987, 1989; Craig and Taisacan 1994).
In 1994, the U.S. Fish and Wildlife Service (USFWS) did a survey focusing on the Rota
BWE and found that densities had decreased by approximately 50% (to 155 birds/km2)

3
from the 1982 estimate (Ramsey and Harrod 1995). In the fall of 1996, a survey by Fancy
and Snetsinger (1996) estimated the population of Rota BWEs to be 1,167 birds, an 89%
decline from the 1982 estimate.
The 1996 survey determined that the population was restricted primarily to
four patches of forest covering an area of 259 ha above 200 m elevation (this elevation
change from the 1982 estimate may reflect increased survey coverage and not a range
expansion) (Fig. 2). These patches were located near the Uyulan Hulo (65 ha) and As
Mundo areas, the southern cliffs of the Sabana (133 ha), and the northeast portion of the
Sabana (41 ha) (Fancy and Snetsinger 1996). Ninety-four percent of the Rota BWEs
were found to occur in these patches. The remaining 6% of the population was located in
what were considered low density areas (748 ha) (Fig. 2).
Factors implicated as potential causes of the population decline and range
restriction of the Rota BWE were: (1) habitat loss, (2) avian disease, (3) introduced
predators, and (4) pesticides. A thorough review of the available information on each
factor was given by Fancy and Snetsinger (1996). However, for completeness a brief
description of each factor is given below.
Habitat loss is an important factor in the decline and range restriction of many
white-eye species. Eleven of the 21 white-eye species listed in the IUCN’s list of
threatened birds are threatened by habitat loss (Collar et al. 1994). Loss of native habitat
on Rota is primarily a result of land clearing for agriculture or development and storm
damage from typhoons.

4
Rota can be divided into 10 main habitat types: native limestone forest (58%
of island), secondary vegetation (13%), introduced forest (1%), introduced ironwood
(Casuarina equisetifolia) thickets (2%), agroforest (5%), grassland (15%), strand (3%),
urban (1%), cultivated (< 1%), and barren (< 1%) (Falanruw et al. 1989). A full
description of each of these habitat types can be found in Fosberg (1960) and Falanruw et
al. (1989). The Rota BWE is believed to be primarily a native limestone forest species
(Fancy and Snetsinger 1996), though it has been recorded in secondary growth (Craig and
Taisacan 1994, pers. obs.) and introduced forest (Fancy and Snetsinger 1996, pers. obs.).
Native limestone forest on Rota can be divided into two categories based on elevation.
The forests at low elevation tend to be drier forests because of low levels of rainfall
during the dry season. Forests at high elevation tend to be predominantly wetter forests
because of the high levels of rainfall these areas receive year round caused by
accumulation of clouds over the Sabana (Fosberg 1960, Falanruw et al. 1989). The 1996
distribution of Rota BWEs shows that the highest densities are found in the wet limestone
forests (Falanruw et al. 1989, Fancy and Snetsinger 1996).
Documentation of land clearing on Rota began during the Japanese
administration (1914-1944) even though changes in vegetation communities have
occurred since the island was first colonized by humans (Chamarros) (Fosberg 1960).
Unfortunately, documentation on the changes in native forest did not distinguish between
low elevation dry and high elevation wet native limestone forests. During the Japanese
administration, much of the level land on Rota was cleared for sugar cane cultivation and
5
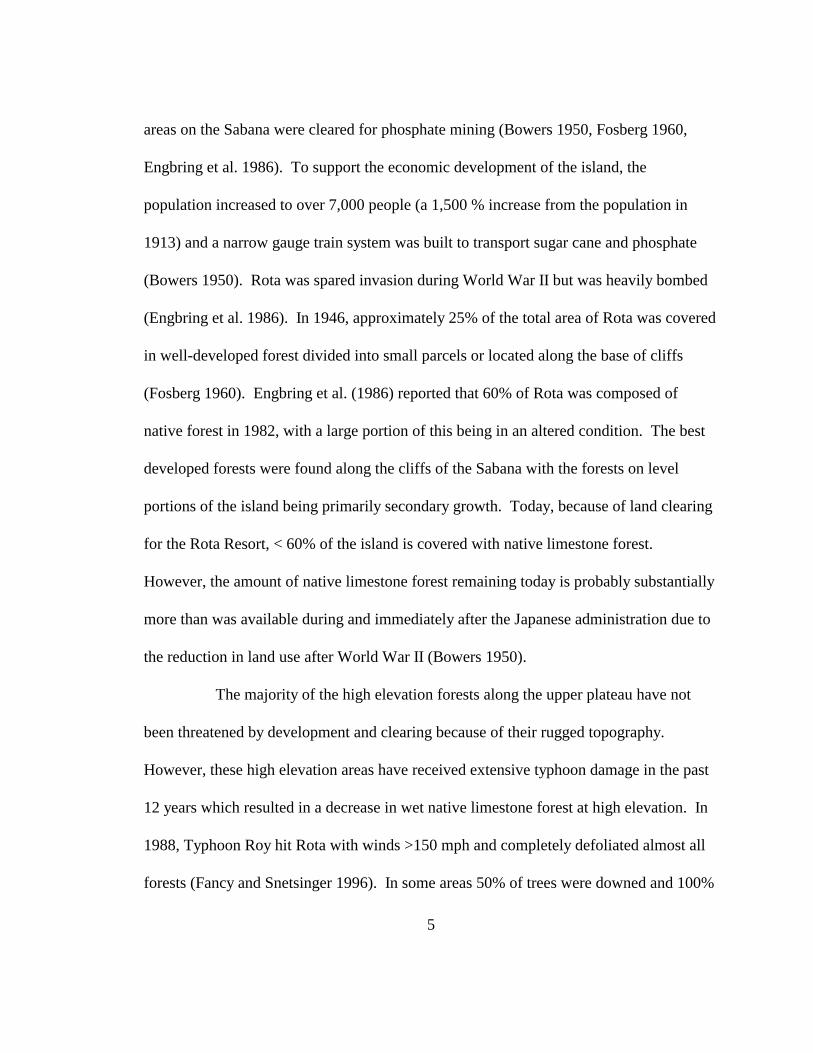
areas on the Sabana were cleared for phosphate mining (Bowers 1950, Fosberg 1960,
Engbring et al. 1986). To support the economic development of the island, the
population increased to over 7,000 people (a 1,500 % increase from the population in
1913) and a narrow gauge train system was built to transport sugar cane and phosphate
(Bowers 1950). Rota was spared invasion during World War II but was heavily bombed
(Engbring et al. 1986). In 1946, approximately 25% of the total area of Rota was covered
in well-developed forest divided into small parcels or located along the base of cliffs
(Fosberg 1960). Engbring et al. (1986) reported that 60% of Rota was composed of
native forest in 1982, with a large portion of this being in an altered condition. The best
developed forests were found along the cliffs of the Sabana with the forests on level
portions of the island being primarily secondary growth. Today, because of land clearing
for the Rota Resort, < 60% of the island is covered with native limestone forest.
However, the amount of native limestone forest remaining today is probably substantially
more than was available during and immediately after the Japanese administration due to
the reduction in land use after World War II (Bowers 1950).
The majority of the high elevation forests along the upper plateau have not
been threatened by development and clearing because of their rugged topography.
However, these high elevation areas have received extensive typhoon damage in the past
12 years which resulted in a decrease in wet native limestone forest at high elevation. In
1988, Typhoon Roy hit Rota with winds >150 mph and completely defoliated almost all
forests (Fancy and Snetsinger 1996). In some areas 50% of trees were downed and 100%

6
suffered limb damage. The wet forests of the upper cliffline were drastically altered by
this storm and did not recover quickly (Fancy and Snetsinger 1996). In December 1997,
super typhoon Paka hit Rota and much of the upper plateau was defoliated again (J. M.
Morton, USFWS, pers. comm.).
The spread of malaria (Plasmodium relictum capistranoe) and avian pox
(Poxvirus avium) by the introduced mosquito, Culex quinquefaciatus, was implicated as
the cause of the extinction of much of Hawaii’s avifauna from 1920 to the present
(Warner 1968, van Riper et al. 1986). However, no evidence of disease playing a role in
native bird population declines in the Mariana Islands has been reported. Observations
made by biologists and veterinarians working on Rota do not indicate the presence of
pathogens or of an epidemic occurring there (Pratt and Sileo 1983, Fancy and Snetsinger
1996). However, no extensive sampling for pathogens in native forest birds has occurred
on Rota, so it is not possible to completely rule out disease as a factor in the decline.
Introduced predators include the brown tree snake (Boiga irregularis), Asian
house rat (Rattus tanezumi), Polynesian rat (Rattus exulans) and the black drongo
(Dicrurus macrocercus). Black drongos were thought to have been introduced to Rota
from Taiwan by the Japanese South Seas Development Company in 1935 to control
destructive insects (Baker 1948). Black drongos are noted for their aggressiveness
toward and occasional predation on small passerines (Ali and Ripley 1972, Maben 1982).
On Guam, black drongos have been observed eating small birds such as Eurasian tree
sparrows (Passer montanus) (Maben 1982), rufous fantails (Rhipidura rufifrons), and

7
Guam swiftlets (Aerodramus vanikorensis) (Perez 1968). Craig and Taisacan (1994)
suggested that black drongos were responsible for the decline and range restriction of the
Rota BWE based on correlations between the increasing abundance of drongos on the
Sabana and the decline of Rota BWEs. They reported that survey data by Engbring et al.
(1986) showed that the density of potential black drongo prey species, like the Rota BWE
and rufous fantail, were lower in areas with high black drongo densities. They also
reported, based on personal observations, that black drongos became more abundant in
the 1960s when the decline of Rota BWEs was first noted. However, no data are
available to confirm this and the reason for the apparent increase in black drongo
numbers is unknown.
Two species of introduced rat, Rattus tanezumi and Rattus exulans, have been
recorded on Rota (Johnson 1962, Flannery 1995). Rattus tanezumi was thought to have
been introduced to Micronesia over 1,000 years ago, while Rattus exulans was believed to
have been introduced during European colonization between 200-500 years ago (Flannery
1995). The impact of Rattus tanezumi on bird populations is unknown. However, Olson
and James (1982) concluded that R. exulans was a contributing factor to the massive
extinctions of Hawaiian bird species that took place during the Polynesian occupation.
Little research has been done on the effects of introduced rats on Rota’s
avifauna. In fact, there was some uncertainty as to which species of rat was commonly
found on the island. However, morphometrics of trapped specimens indicate that Rattus
tanezumi is probably the most common species (Morton et al. 1999). Recent work by

8
Morton et al. (1999) indicates high densities of rats may exist on Rota. Nest success data
on the rufous fantail indicate that nest predation by rats may have important negative
impacts on nesting success (S. Plentovich, USFWS, pers. comm.). However, no data are
available on the effects of rats on Rota BWEs.
The brown tree snake was found to be the major factor in the decline of native
forest birds on Guam with the smallest species, such as the Guam BWE, experiencing
declines first (Savidge 1986, 1987). However, no observations of live brown tree snakes
have ever been reported on Rota (G. Rodda, U.S. Geological Survey, pers. comm.) and no
other bird species appear to be experiencing a severe decline. Because of this, Fancy and
Snetsinger (1996) did not believe that the brown tree snake was a factor in the decline of
the Rota BWE.
Pesticides were considered a factor in the decline of the Rota BWE due to the
reports that the U.S. military liberally applied DDT on the Mariana Islands during and
after WWII (Baker 1946, Grue 1985). Pesticide use on Guam was also implicated as a
potential factor in the decline of Guam’s avifauna (Diamond 1984, Jenkins 1983) but
concentrations of DDT and DDE in swiftlet carcasses and guano were considered to be
too low to cause mortality or reproductive failure (Grue 1985). The insecticide malathion
was used on Rota to control the melon fly in 1988 and 1989 (Engbring 1989). A study to
monitor the status of birds on Rota before and after the insecticide application did not
report any adverse effects on Rota’s bird populations (Engbring 1989). Based on this
information, Fancy and Snetsinger (1996) determined that there was no evidence for

9
pesticides being an important factor in the decline of the Rota BWE.
Based on a review of the available information and the recommendations of
Fancy and Snetsinger (1996), we decided to focus our research on accomplishing two
basic goals. The first goal was to gather more information on Rota BWE life history.
The second goal was to reassess the role that habitat alteration, black drongos, and
introduced rats played in the decline and range restriction of Rota BWE populations and
provide relevant management and research recommendations. The objectives of this
study were the following: (1) gather information on Rota BWE behavior and breeding
biology for comparison with Saipan BWEs; (2) examine seasonal differences in bird
abundance, insects, and fruiting and flowering tree species; (3) produce a crude estimate
of the Rota BWE population during the study period; (4) examine Rota BWE habitat
relationships at the microhabitat, within range, Sabana-wide, and island-wide levels; (5)
examine the relationships between black drongo and Rota BWE numbers using current
and historical survey data; and (6) determine if rat densities differ between the Rota
BWE’s current range and the rest of the island.
METHODS AND STUDY AREA
This study took place on the islands of Rota (14o 10' N, 145o 12' E), Saipan
(15o 12' N, 145o 45' E), and Tinian (15o 10' N, 145o 38' E) during June-August 1998 and
January-August 1999. This study encompassed two wet seasons (June - August 1998 and
1999) and one dry season (February - April 1999). Rota has the highest elevation (491 m)
of the three islands followed by Saipan (436 m) and Tinian (178 m). Saipan is the largest

10
(122 km2) of the three islands followed by Tinian (100 km2) and Rota (86 km2). The
climate on all three islands is tropical, with mean temperatures of 24 to 32o C, high
humidity, and average annual rainfall of 200 to 260 cm (NOAA 1998). We focused our
research on the island of Rota but did gather supplementary information from the Marpi
region of Saipan and the entire island of Tinian.
On Rota, we conducted our study on the five regions of the 450 m high
plateau known as the Sabana, which dominates the western half of the island. The
regions of the Sabana we used as study areas were as follows: (1) northeastern Sabana
(Area A); (2) As Mundo (Area B); (3) Uyulan Hulo (Area C); (4) southern cliffs of the
Sabana (Area D); and (5) the southeastern cliffs of the Sabana (Area E)(Fig. 3). We
selected these regions because they encompassed the areas designated high density Rota
BWE areas by Fancy and Snetsinger (1996).
We set up 20 study plots and distributed them among the five study areas
listed above (Fig. 3) (Appendices A and B). Each study plot consisted of four 50-m
radius point count stations arranged in a square. The centers of the point count stations
were 100 m apart and at 90o angles to one another. We determined the location of one
corner of each study plot by overlaying a grid on a map of Fancy and Snetsinger’s (1996)
high and low density Rota BWE areas and selecting a random location using a random
numbers table. We then placed the remaining corners of the study plot so that the entire
study plot was within the same habitat type and Rota BWE density. In addition, we
attempted to place all study plots at least 200-m apart, from 100 - 450 m elevation, and
11
within habitat classified as LI2H (mature native limestone forest with crown closure > 70
% and trees averaging > 30 cm diameter at breast height (dbh)) by Falanruw et al. (1989).
We placed our study plots within this habitat classification because over 80% of the
locations in which Fancy and Snetsinger (1996) detected Rota BWEs (n = 70) were in this
habitat type.
Eighteen study plots were set up during the 1998 field season and two
additional study plots (3HC and 3HD) were added in the 1999 field season. The 18 study
plots set up in 1998 were divided equally into high (> 2 white-eyes/ha) and low (< 2
white-eyes/ha) density Rota BWE areas as designated by Fancy and Snetsinger (1996).
The density estimates we obtained for the study plots after the 1998 field season
determined that fewer then half (n = 7) of the study plots actually contained high densities
of Rota BWEs. Therefore, we placed the two study plots added in 1999 in areas that
could be designated high density Rota BWE areas based on observations of Rota BWEs
by Fancy and Snetsinger (1996).
DATA COLLECTION
Rota Bridled White-eye Life History
Breeding Biology- We intensively searched for Rota BWE nests in six study
plots to obtain demographic and nest site characteristic information. Nests were
monitored a minimum of every four days using either a mirror on a telescoping pole or a
spotting scope. We also used precautions proposed by Martin and Geupel (1993) to
minimize observer-induced mortality. When possible we recorded clutch size, number of
12
nestlings, and number of fledged young and assessed reasons for nest or clutch failure.
When nests were accessible we attempted to band chicks with a USFWS aluminum band
and distinct combination of color bands prior to fledging.
We took the following measurements on all inactive nests: (1) dbh of nest
tree, (2) nest height, (3) tree height, (4) tree species, (5) distance from nest to bole, (6)
orientation of nest, and (7) elevation. When nests were accessible, we also recorded nest
dimensions (nest depth, inner diameter, outer diameter, total nest height, and material
used). We also recorded nest site characteristics and nest dimensions of inactive Saipan
and Tinian BWE nests for comparison with Rota BWE nests.
Behavior- We collected discrete behavioral observations on Rota BWEs to
examine seasonal differences in behavior and differences in foraging method and
microhabitat use between Rota and Saipan BWEs (Craig 1989, 1990). We recorded the
following at each behavioral observation: the activity (foraging, resting, flying,
maintenance, singing, and intra-and inter-specific agonism), foraging mode (search,
glean, reach, hang, pick, probe, lunge, leap, sally, and sally-hover), location (canopy or
understory tree; vertical zone: < 3 m, 3-6 m, and > 6 m; horizontal zone: inner and
outside tree), foraging substrate (branch, dead branch, trunk, leaf, dead leaf, rolled leaf,
bud, flower, fruit, epiphyte and air) to species if possible, perch diameter (in relation to
body size), and size and type of prey (in relation to bill size) (Craig 1989, 1990; Remsen
and Robinson 1990). In addition, for the 1999 field season, we collected discrete
behavioral observations of Saipan BWEs and recorded data on Rota and Saipan BWE
13
flock size at each observation. We only recorded data on behavioral observations after a
13 second monitoring period to avoid visibility bias (Bradley 1985). We determined the
duration of the monitoring period by taking continuous observations of eight individuals
and determining the average time (13 sec) necessary before a change in horizontal
location occurred. We also sampled only one Rota BWE from each 50-m radius point
count station during any time of day category (0600-1000, 1000-1400, 1400-1800) on a
given day in a study plot to minimize bias.
Seasonal Effects
We examined seasonal effects by looking at differences in fruiting, flowering,
insect and snail numbers, and bird abundance estimates between the wet and dry seasons.
We assessed percentage of tree species fruiting and flowering at two week intervals by
recording if a tree species was fruiting or flowering in each study region using methods
similar to those used by J. M. Morton (unpubl. data) for a study on the Mariana crow
(Corvus kubaryi). We used the fruiting and flowering data to calculate the percentage of
tree species in a study region fruiting or flowering in the dry or wet season. To calculate
this percentage we divided the number of tree species fruiting or flowering in the region
by the total number of tree species found in that region. We also used the fruiting and
flowering data to calculate the percentage of study regions with a tree species fruiting or
flowering in the dry and wet season. We calculated this percentage by dividing the
number of study regions with the tree species fruiting and flowering by the total number
of study regions (5).

14
We examined seasonal changes in insect and snail numbers using a branch
clipping technique described by Schowalter et al. (1981). Branches of four tree species
(Elaeocarpus joga, Hernandia labyrinthica, Merrilliodendron megacarpum, and Premna
obtusifolia) were covered in a plastic bag with a drawstring attached to a telescoping pole,
clipped with a branch pruner, sprayed with insecticide and searched for insects and snails.
We systematically sampled eight branches (approximately equal size) from eight trees of
each species among three high (> 2.5 Rota BWEs/ha) and three low (< 1.0 Rota BWE/ha)
abundance Rota BWE study plots. We calculated the number of insects or snails per
branch for each tree species and overall.
We assessed seasonal differences in bird abundance estimates by calculating
an abundance index for Rota BWEs, black drongos, and other forest birds in each study
plot using point count methods described by Ralph et al. (1995). We collected bird
detection distance data at three point count stations in each study plot. The three corners
used for the point counts were determined by using a random numbers table to select one
corner to not sample. One observer censused each point count station within a study plot
on the same day for 10 minutes between sunrise and 1100. We censused each study plot
a minimum of three times on non-consecutive days during the wet season (June - August)
of 1998 and the wet (June - August) and dry (February - March) seasons of 1999. We
calculated the effective detection radius for each species (Appendix C) and for each point
count station (Appendix D) using the DISTANCE program (Laake et al. 1998). We
determined that Rota BWEs had the smallest detection radius (25 m) and that this

15
detection radius was below the effective detection radii of each point count station. We
then used 25-m radius as the cut off point to determine bird abundance in each point
count station. We averaged the abundance estimates of each point count station in a
study plot for a particular survey day to calculate an abundance index for the study plot.
We then used the highest abundance index estimate within each survey period (wet
season 1998, dry season 1999, wet season 1999) as the abundance index estimate for that
survey period.
White-eye Population Estimate
We calculated a crude population estimate for Rota BWEs over the study
period using bird abundance indices for each study plot in each survey period (see
Seasonal Effects for methods). We averaged the abundance indices for all study plots
within a region to produce an overall abundance index for that region. We then
calculated the approximate area of forest represented by the study plots in a region. This
area was then multiplied by the abundance index for that region to produce a population
estimate for that region. The population estimates from each region were then totaled to
give an overall population estimate for Rota BWEs within our study area.
Habitat Alteration
Microhabitat Relationships- We examined foraging habitat selection by
comparing habitat characteristics of Rota BWE foraging sites and systematically sampled
locations in each study plot using methods similar to those used by VanderWerf (1993)
and Sillet (1994). The locations of Rota BWE foraging habitat sites were determined by

16
the first recordable foraging observation within a study plot (See Behavior section for
methods). We assessed foraging habitat use by recording habitat characteristics of
foraging sites at three hierarchically-nested scales (fine, intermediate, and broad) during
the 1999 field season (February - August). At the fine scale, we recorded the foraging
substrate and percent foliage volume within a 0.5-m radius sphere around the foraging
location. At the intermediate scale, we measured percent canopy cover and foliage
volume at three height classes (0-3 m, 3-9 m, 9-15 m) within 1.5 m of the foraging
location. We measured canopy cover by recording the presence or absence of canopy
while standing directly below the foraging location and at 0.5 m intervals along a 1.5 m
transect in each of the four cardinal directions. We measured percent foliage volume at
each height interval directly below the foraging location and at 1.5 m in each of the four
cardinal directions using a 15-m telescoping pole. The number of 10-cm sections
intercepted by vegetation within the five height classes was recorded and divided by the
total number of 10-cm sections available at each height class (0-3 m = 150, 3-9 m = 300,
9-15 m = 300). At the broad scale, we measured the dbh and species of all woody
vegetation > 10 cm dbh in a 400-m2 sampling area centered on the foraging location.
We determined availability of foraging habitat by taking the measurements
described above by randomly selecting (using a random numbers table) one of the two
systematically sampled habitat sampling areas within the same 50-m radius point count
station as the foraging observation. At each 50-m radius point count station within a
study plot we set up two 400-m2 circular habitat sampling areas (radius = 11.3 m). We

17
centered one habitat sampling area on the center of each point count station and the
remaining habitat sampling area was placed a random distance (23-39 m) and compass
direction from the center of the station. The broad scale habitat characteristics were
recorded in the 1998 and 1999 field seasons. The fine and intermediate foraging habitat
characteristics were measured at the center of the habitat sampling area during the 1999
field season (February - August). We took the percent foliage volume measurement on a
randomly selected substrate (using a random numbers table) intersecting an imaginary
0.5-m radius cylinder extending from 1.5 m above the ground to the top of the canopy.
We determined the availability of substrates by recording the species, substrate type, and
height of all substrates that intersected the 0.5-m radius cylinder.
Within Range Relationships- To assess Rota BWE within range relationships
we calculated the mean Rota BWE abundance index over the three survey periods for
each study plot (see Seasonal Effects for methods) and characterized the habitat in each
study plot using methods recommended by Noon (1981). We characterized the habitat in
each study plot by setting up two 400-m2 circular habitat sampling areas within each of
the three 50-m radius point count stations censused within a study plot (see Microhabitat
Relationships for methods). We then recorded the dbh and species (based on the
taxonomic classification reported in Raulerson and Rhinehart (1991)) of all woody
vegetation > 10 cm dbh, shrub density, canopy cover, and canopy height within each
habitat sampling area during the 1998 and 1999 field season. Epiphyte volume and
foliage volume were recorded within each habitat sampling area during the 1999 field

18
season (February - August). The estimates for each habitat variable in each habitat
sampling area were then averaged across the study plot to produce an estimate for the
study plot.
We measured shrub density (< 10 cm) by counting the number of stems at
breast height within a 11 x 1.8 m (length of outstretched arms = 1.8 m) transect in each
of the cardinal directions within the habitat sampling areas. We determined percentage
canopy cover by recording the presence or absence of canopy at 24 points 2 m apart along
11-m transects in the four cardinal directions. We measured average canopy height to the
nearest meter using a 15-m telescoping pole. We measured foliage and epiphyte volume
using a 15-m telescoping pole marked at 10-cm intervals using a method described by
MacArthur and Horn (1969). We set up the pole at the center of the habitat sampling area
and 1.5 m and 3.5 m from the center in the four cardinal directions. Foliage volume was
determined by calculating the total number of 10-cm sections intercepted by vegetation at
three height intervals (0-3 m, 3-9 m, 9-15 m) and dividing by the total number of 10-cm
sections available at each height interval (0-3 m = 270, 3-9 m = 540, 9-15 m = 540).
Epiphyte volume was calculated by determining the number of 10-cm sections
intercepted by an epiphyte in each epiphyte class (compound fern, simple fern, bird nest
fern, orchid, moss, and native vine) and dividing by the total number of 10-cm sections
available (150 10-cm sections x 9 sampling stations = 1350).
Sabana-wide Relationships- To obtain habitat and abundance data on Rota
BWEs outside the study plots we set up a survey of the Sabana region. We attempted to

19
sample forested habitat in all compass directions around the Sabana. To allocate transects
around the Sabana we divided the Sabana into nine blocks and placed one transect into
seven of the nine blocks and randomly selected two blocks for placement of a second
transect to obtain a total of nine transects. We excluded the block on the south side of the
Sabana because it contained large areas of open grassland, pasture, and cropland, which
we avoided because Rota BWEs have rarely been detected in these areas. We also
excluded the block on the top of the Sabana because this region is all the same elevation
and we were interested in examining changes in Rota BWE abundance with changes in
elevation. We determined the starting point for each transect by overlaying a grid on each
block and selecting a point within each block using a random numbers table. We then
started each transect at the nearest road to the point and headed toward the highest
elevation through as much forested area as possible. As we stated above, we avoided
large sections of treeless areas such as grassland, pastures, and croplands and we avoided
cliffs and other impassable terrain for safety reasons and to make the transects as long as
possible. We surveyed each transect with the assistance of USFWS personnel and
volunteers in teams consisting of a designated bird observer and habitat data recorder.
We ran each transect from sunrise to completion or 1000 depending on which came first.
At 150-m intervals along each transect, we set up a survey station, consisting
of a 35-m radius and 15-m radius sampling area, to record information on birds and
habitat characteristics. Inside and outside the 35-m radius sampling area we recorded the
number of Rota BWEs, black drongos, and Mariana crows over a 10 minute survey

20
period. In addition, we recorded the presence or absence of other forest birds. We also
recorded percent cover of the following habitat types within the 35-m radius sampling
area: (1) mature limestone forest, (2) young limestone forest, (3) faniok forest, (4)
introduced forest, (5) tangen-tangen thicket, (6) bamboo thicket, (7) screw pine thicket,
(8) secondary vegetation, (9) agroforest, (10) cropland/pasture, and (11) grassland.
Definitions of the habitat types used were based on descriptions given by Falanruw et al.
(1989) with some modifications. We defined mature limestone forest as native forest
with trees averaging > 30 cm dbh and we defined young limestone forest as all remaining
native limestone forest size classes. We defined faniok forest as forest dominated by
Merrilliodendron megacarpum. We defined tangen-tangen thicket and bamboo thicket as
introduced forest areas dominated by Leucaena leucocephala and Bambusa vulgaris
respectively. Finally, we defined screw pine thicket as areas dominated by thick growth
of Pandanus dubius or P. tectorius.
Within the 15-m radius survey area, we recorded the number of trees > 30 cm
dbh as well as a rating of the presence of succulent ground cover plants (Elatostema spp.
and Procris spp.). We determined the presence rating of these plants by dividing the 15-
m radius sampling area into four quarters using the four cardinal directions. We then
used the presence or absence of these plants in each quarter to calculate a presence rating
from 0 to 4 (4 being present in all quarters). In addition to the above measurements, we
recorded the elevation, survey conditions (percent cloud cover, wind speed, wind
direction, time, and presence or absence of rain), and elevation of first Rota BWE
21
observation (even if observed outside sampling stations).
Island-wide Relationships- To compare the presence and absence of tree
species within the current range of the Rota BWE with other areas of the island (primarily
low elevations), we compared habitat data we collected in each Rota BWE study site (see
Within Range Relationships for methods) with habitat data collected by J. M. Morton
(unpubl. data). Field crews under Morton’s direction collected habitat data in 1998 and
1999 as part of a Mariana crow study in six study sites (Fig. 4). In each of the six
Mariana crow study sites, they sampled habitat in ten 500-m2 circular habitat plots (12.6-
m radius). They determined the locations of habitat sampling plots by overlaying a grid
system on a map of each Mariana crow study site, dividing the site into sections, and
using a random numbers table to determine the latitude and longitude of the habitat
sampling plot in each section of the site. Within each habitat sampling plot, they
recorded the dbh and species of all woody stems > 2.5 cm dbh. They then calculated the
density and basal area of all woody species > 10 cm dbh in each Mariana crow study site.
Insect Relationships- Because the Rota BWE appears to be primarily
insectivorous (pers. obs.), we gathered some data on insect numbers to look for
relationships between insects, elevations, and Rota BWE abundance. We also examined
relationships between the Rota BWE and rufous fantail, a small insectivorous passerine
we observed foraging with Rota BWEs. Data on insect and snail numbers per branch
were collected in three high and low abundance Rota BWE study plots (see Seasonal
Effects for methods). In addition, we gathered data on insect and snail numbers at high

22
and low elevations. Rota BWE and rufous fantail relationships were examined using
abundance estimates for both species within the Rota BWE’s current range and along
transects on the Sabana (see Seasonal Effects and Sabana-wide Relationships for
methods) and using habitat data collected within the Rota BWE’s current range (see
Within Range Relationships for methods).
Data on insect numbers at different elevations were collected by setting up
three transects that passed through contiguous native limestone forest from low elevations
(150 - 250 m) to high elevations (380 - 450 m). The location of each transect was
determined by the presence of Elaeocarpus joga and contiguous limestone forest between
high and low elevations. At the extreme upper and lower elevations of each transect we
sampled five Elaeocarpus joga trees at least 20 m apart. We selected only Elaeocarpus
joga trees for sampling because of their high use by Rota BWEs, wide distribution among
elevations, and time constraints. We selected the first tree for sampling at each end of the
transect by entering the forest a random distance and direction and selecting the closest
tree. We selected the remaining trees by picking the closest tree > 20 m from the last tree
along the same general elevation gradient. At each tree sampled, we collected the highest
accessible branch (approximately 6 m above the ground) on opposite sides of the tree
(North and South if available). We covered each branch to be collected in a plastic bag
attached to a telescoping pole and closed it with a drawstring. The branch was clipped
with a tree pruner and insecticide was sprayed in the bag.
We searched the contents of each bag and preserved all insects (in formalin)
23
and branch samples (in bags) for weighing and identification at the lab. We counted all
snails found on each branch sample but did not weigh them because of potential problems
with importing them to the mainland United States. We identified all insects collected to
order and family (if possible), dried them for 24 hrs at 50oC, and weighed them. All
branch samples were divided into leaves and woody tissue, dried for 24 hrs at 50oC, and
weighed. To make the samples comparable, we then divided insect mass by the total
mass of leaves and branches in the sample to obtain the insect biomass per gram of plant
mass for that sample. We then took the mean of the samples for the high and low
elevation section of each transect.
Black Drongos
We used black drongo data collected in this study and from previous bird
surveys to look at black drongo and Rota BWE relationships in several ways. First, we
tried to determine if black drongo numbers were lower on the Sabana than other regions
of the island as was previously reported by Craig and Taisacan (1994). Then we used
data on bird numbers collected in this study and from previous surveys to look for
relationships between black drongos and small passerines, like Rota BWEs and rufous
fantails, that could be potential prey for black drongos. We also used previous survey
data to look at differences in black drongo, small passerine, and other bird numbers on
the Sabana over time. Finally, we tried to assess black drongo habitat relationships
within the Rota BWE’s current range and at the Sabana-wide level.
The data used from this study were collected at each Rota BWE study plot and

24
along each transect on Sabana using methods described earlier (see Within Range
Relationships and Sabana-wide Relationships for methods). The previous bird survey
data were collected using the variable circular plot (VCP) method (Reynolds et al. 1980)
and included data collected in 1982 (Engbring et al. 1986) and 1987 (Engbring 1987) and
unpublished data from 1994, 1995, and 1998 (USFWS, unpubl. data). Over the five
survey periods, 25 transects (Fig. 5) with sampling stations located 150-m apart were
sampled.
Due to inconsistencies in how and when the data for these previous surveys
were collected (Appendix E), we made a series of changes to the survey data to make
them more manageable. First, we calculated the effective detection radiuses of Rota
BWEs, black drongos, and four other bird species in 1982 and 1994 using the
DISTANCE program (Laake et al. 1998) (Appendix F). We then calculated the
abundance of each species by limiting observations to 50-m radius or the smallest
effective detection radius for each species in both years (if < 50-m radius). We used 50-
m radius or the effective detection radius because of concerns over detectability at long
distances and the independence of each survey station. In 1995 and 1998 survey sites
were only censused by one observer, while during the remaining years (1982, 1987, and
1994) each station was censused by two observers. To deal with this inconsistency, we
calculated abundance estimates for each survey station by taking the mean of both
observers. To make comparisons between years, we used only data from survey stations
that were censused in multiple years at the same time of year (March-May). Finally, to

25
compare black drongo numbers on the Sabana with other areas of the island we divided
the island into the Sabana, Sinapalo, and intermediate regions (Fig. 6).
Rat Populations
We surveyed rat populations in Rota BWE areas for comparison with rat
population estimates of Mariana crow study sites. In Rota BWE areas, we set up one
100-m trapping transect on each of eight study plots (2HA, 1HB, 1LB, 1HC, 1LC, 1HD,
2HD, 1LD) distributed among four different study regions. Each transect consisted of
five snaptraps spaced 25 m apart for a total of 40 traps. In Mariana crow study sites, two
500-m transects were set up in each study site (Morton et al. 1999). Each transect
consisted of 20 traps spaced 25 m apart for a total of 160 traps. Traps on all transects
were alternately set in a tree or on the ground and all transects were trapped for five
consecutive nights. All traps were checked each morning and baited with fresh coconut
and peanut butter. We recorded the status of each trap as: (1) empty, (2) rat, (3) missing,
(4) tripped and empty, and (5) tripped and containing a non-target species (e.g. hermit
crab). We also recorded morphometrics, weights, and stomach contents of most rats
trapped in Rota BWE study areas. Morphometrics and weights of rats trapped in Mariana
crow sites were also recorded by Morton et al. (1999).
We determined rat population estimates for each study area by calculating rats
per trap-night using two different versions of trap-night. One estimate was based on the
total number of traps per night (potential trap-nights). The second estimate was based on
the number of traps that were not missing, accidently sprung, or containing non-target

26
species (actual trap-nights).
STATISTICAL ANALYSIS
Prior to analysis we checked all data for normality using the Shapiro-Wilk
normality test. Statistical methods were then selected based upon the outcome of these
analyses. In instances where parametric and non-parametric tests were appropriate for
different measurements within a data set (e.g. measurements of nest site characteristics)
we always used non-parametric procedures. All analyses were considered significant at P
< 0.10.
Rota Bridled White-eye Life History
We compared nest site characteristics and nest dimensions of Rota and Saipan
BWE nests using the Wilcoxon rank sum procedure. We assessed differences in foraging
behavior and microhabitat use between Rota and Saipan BWE using descriptive statistics.
We also examined differences in behavior between the wet and dry season using
descriptive statistics. We defined the wet season as June-August and the dry season as
February-April based on monthly rainfall data collected at the Rota Airport (National
Weather Service website: www.nws.noaa.gov) during the 1998 and 1999 field seasons
(Fig. 7).
Seasonal Effects
We tested for differences in percentage of trees fruiting and flowering between
the dry (February - April) and wet (June - August) seasons using Wilcoxon signed-rank
tests. Differences in percentage fruiting and flowering of tree species across different
27
study sites were examined using descriptive statistics. Differences in insect and snail
numbers between seasons were also examined using descriptive statistics. Seasonal
differences in bird abundance indices were examined using a two-way ANOVA with
Tukey multiple comparison procedures.
Habitat Alteration
Microhabitat Relationships- We analyzed foraging habitat selection using a
paired t-test or, if several of the variables were related, with a Hotelling’s T2 (Rencher
1995) and paired t-tests. We analyzed foraging substrate type and species selection in
each study plot with > 20 foraging observations using methods described by Manly et al.
(1993). First, we used a G-test to test the hypothesis of no selection. If this hypothesis
was false, we calculated selection ratios and confidence intervals for those ratios.
Within Range Relationships- We assessed Rota BWE within range
relationships by looking at differences in habitat variables and bird abundance indices in
areas designated high and low density Rota BWE areas by Fancy and Snetsinger (1996)
and by looking at the relationship between Rota BWEs and habitat. We used Wilcoxon
rank sum tests to examine differences in habitat variables and a two-way ANOVA to
examine differences in mean bird abundance indices in areas designated high and low
density Rota BWE areas by Fancy and Snetsinger (1996). Not all tree species were
analyzed for differences between high and low density Rota BWE areas. Only Hernandia
labyrinthica, Merrilliodendron megacarpum, and Elaeocarpus joga were examined
because we believed they were important to Rota BWEs.

28
We used stepwise multiple linear regression (SAS Institute 1990) to determine
which habitat variables best predicted mean Rota BWE abundance indices. Any habitat
variables that we believed were important to Rota BWEs that were not included in
regression analysis were analyzed using Pearson correlations. Because we had so few
samples and so many independent variables, we reduced the total number of variables in
our stepwise regression in two ways. First, we eliminated all variables with zero values
in 25% or more of the study plots. Then we looked at the relationships between the
remaining variables by using PROC FACTOR (SAS Institute 1990) to calculate the first
three principal components of the habitat data (Table 1). We then selected the habitat
variables that were the most independent based on their correlation coefficients.
Sabana-wide Relationships- We analyzed the Sabana-wide survey data for
relationships between abundance estimates of Rota BWEs and different habitat variables.
We tested for these relationships using stepwise multiple linear regression analysis on
Rota BWE abundance estimates and eight habitat variables. In this test, we assumed all
survey stations were independent and used data from all transects.
Insect Relationships- We looked at potential relationships between Rota
BWEs and insects in several ways. First, we examined differences in insect and snail
numbers between high and low Rota BWE abundance study plots and in insect biomass
per gram of plant mass between high and low elevations using descriptive statistics.
Then we tested for relationships between the insectivorous rufous fantail and Rota BWEs.
We used Pearson correlations on rufous fantail and Rota BWE numbers with our study
29
plots and along the transects on the Sabana. We also used stepwise multiple linear
regression on mean rufous fantail abundance indices to determine which habitat variables
best predicted rufous fantail abundance within the Rota BWE’s range.
Black Drongos
We tested for differences in each region in each year using Kruskal-Wallis
tests with Bonferroni joint ranking multiple comparison procedures (Hollander and Wolfe
1999). Each year was examined separately because the 1982 data were not comparable to
the 1995 and 1998 data. Black drongo and small passerine relationships were assessed
using Pearson correlations on abundance data collected within our study plots (25-m
radius), along the Sabana transects (35-m radius), and in previous surveys (35-m radius).
We used two-sample T-tests to look at differences in abundance estimates between 1982
and 1994 along four transects (6, 7, 8, and 12) on the Sabana. Sabana-wide black drongo
habitat relationships were assessed using step-wise multiple linear regression. Black
drongo habitat relationships within the Rota BWE’s current range were assessed using
step-wise multiple linear regression and by comparing black drongo use of interior and
exterior study plots. All study plots > 200 m from a non-forest habitat (as defined by
Falanruw et al. 1989) were defined as interior forest plots while the remainder were
classified exterior forest plots. We then looked for differences in black drongo
abundance indices in each plot type for each survey period using two-way ANOVAs with
Tukey’s multiple comparison procedures.
30
Rat Populations
We used estimates of potential and actual rats per trap-night to test for
differences in rat population estimates between Rota BWE and Mariana crow study areas
using a one-way ANOVA and Tukey’s multiple comparison procedure. We summarized
rat stomach contents by calculating the percentage of stomachs containing each food
category.
RESULTS
Rota Bridled White-eye Life History
Breeding Biology- We found a total of 19 Rota BWE nests during the 1998
and 1999 field seasons (Appendix G). A USFWS employee, Sheldon Plentovich, found
an additional nest in December 1997 during preliminary field work for this project. We
also found eight BWE nests on Saipan and one on Tinian during May and June of 1999.
All nests found on Saipan and Tinian were inactive and their fate was unknown. Nine of
the Rota BWE nests were active when found and of these six produced one or two
fledglings. One active nest appeared to be depredated at the nestling stage and the 1997
nest appeared to be destroyed during typhoon Paka in December 1997. The remaining
nest was abandoned or depredated, potentially due to observer disturbance.
We found active nests in December (n = 1), March (n = 4), May (n = 2), and
July (n = 2). Fledging dates of two nests also indicate that breeding occurs in April and
June and an observation of a Rota BWE carrying nest material (spider webs) in August
indicates that breeding occurs then as well. In addition, we observed what appeared to be

31
two recently fledged Rota BWEs (no eye-rings and scruffy appearance) in late January.
We observed clutch sizes of one and two eggs and observed the fledging of
two nestlings. Incubation and nestling periods appeared to be at least 10 and up to 12
days based on our observations of seven active nests (Appendix H). During the
incubation and brooding stages we observed adults switching and observed two adults
simultaneously bringing food to nestlings. We also banded one nestling (Appendix I) and
observed a fledgling period of at least eight days. (This bird was seen approximately 10 m
from the nest with both parents and another fledgling, possibly its one nest mate which
fledged prior to banding).
We recorded nest dimension information on four Rota BWE, four Saipan
BWE, and one Tinian BWE nest (Table 2). The dimensions of Rota and Saipan BWE
nests did not differ except for nest wall width which was larger in Saipan BWE nests
(Table 2). The Rota BWE nests we found appeared to be composed of rootlets, woven
grass or Pandanus spp. fibers, spider webs, light green moss, and a yellow cottony
material (Appendix J). The inner cup appeared to be of woven grass or Pandanus spp.
fibers. The Saipan and Tinian BWE nests we found appeared to be of a similar
composition.
We described nest site characteristics for 18 of the Rota BWE nests and for
eight of the Saipan BWE nests (Table 3). Rota BWE nests were found in Acacia confusa
(n = 3), Elaeocarpus joga (n = 7), Hernandia labyrinthica (n = 6), and Merrilliodendron
megacarpum (n = 4) trees at elevations between 320 and 460 m. Saipan BWE nests were

32
found in Cynometra ramiflora (n = 2) and Guamia mariannae (n = 6) trees and the Tinian
BWE nest was found in a Leucaena leucocephala tree. Rota BWE nests were higher and
farther from the trunk of the tree than Saipan BWE nests (Table 3). Rota BWE nest trees
were also taller and had larger diameters than Saipan BWE nest trees. Distances from the
nest to the top of the tree did not differ between Rota BWE and Saipan BWE nests.
Behavior- We collected a total of 204 discrete Rota BWE behavioral
observations during the 1998 and 1999 field seasons with 116 of foraging and 88 of non-
foraging behaviors. In 1999, we also recorded 154 discrete behavioral observations of
Rota BWE flock size and 10 discrete behavioral observations of Saipan BWEs. We
recorded no discrete behavioral observations of Tinian BWEs.
Of the 116 Rota BWE foraging observations, 43 were in the dry season
(February - April) and 51 were in the wet season (June - August). Over 75% of the
foraging observations in both seasons were of Rota BWEs searching for food (Fig. 8).
The most commonly used foraging technique was gleaning. In both the dry and wet
seasons, five different substrate types were used for foraging. In both seasons, leaves
were the primary foraging substrate type followed by branches (Fig. 9). Nine tree species
were used for foraging. Over 25% of the foraging observations in both seasons were
recorded in Elaeocarpus joga and over 10% of the observations were recorded in each of
Hernandia labyrinthica and Premna obtusifolia trees (Fig. 10). Foraging microhabitat
was also similar between the wet and dry seasons. In both seasons over 60% of the Rota
BWE foraging observations were on perches < 1.0 cm in diameter (Fig. 11), in the canopy

33
(Fig. 12), and > 3 m high (Fig. 13).
Of the foraging observations we recorded, only the 24 observations of Rota
BWEs attempting to capture food were comparable to Saipan BWE (n = 146) foraging
observations reported in Craig (1989, 1990). Over 75% of the Rota and Saipan BWE
foraging observations were of gleaning (Fig. 14) and the use of perches < 1.0 cm diameter
(Fig. 15). Observations of foraging substrate use (Fig. 16) between this study and those
described for Saipan BWEs were also similar except for the use of flowers. Both Rota
and Saipan BWEs both used leaves/buds in 50% or more of the observations. However,
Rota BWEs were observed foraging in flowers (21%) more frequently than Saipan BWEs
(6%) (Fig. 16).
Of the 88 Rota BWE non-foraging observations, 41 were recorded in the dry
season and 16 were recorded in the wet season. The majority of the observations in both
seasons were of maintenance behavior (preening) and vocalizations (singing, calling, and
alarm calling) (Fig. 17). Over 20% of the maintenance observations (n = 22) were of
Rota BWEs mutual preening or allopreening in groups of two. The most commonly
heard vocalization was the call that Pratt et al. (1987) described as “a low-pitched tsheip.”
We also observed Rota BWEs giving a scolding alarm call, often in response to collared
kingfishers, which could be described as a series of the tsheip calls described above. We
also observed Rota BWEs singing from the upper branches of canopy trees throughout
the study period. Their song could be described as a discontinuous series of their calls
produced in a very abrupt manner. Carola Haas observed that the calls of Rota, Tinian,

34
and Saipan BWE all differed. The Rota BWE’s call was more buzzy than the calls of the
Tinian and Saipan BWEs. The Tinian BWE calls were a series of whistles, while the
Saipan BWE calls were a series of short “cheeps.” We did not observe Tinian or Saipan
BWEs singing when visiting these islands.
Behavioral observations of inter and intra-specific interactions were also
recorded. Five percent of the foraging observations recorded in 1999 (n = 84) were of
Rota BWEs foraging with one to two rufous fantails. On 3 July 1999 we recorded one
behavioral observation of a group of 10 Saipan BWEs foraging with a rufous fantail. We
observed groups of two to three Rota BWEs in 53% of the behavioral observations in
1999 (n = 154). We observed flocks of up to 14 birds on two occasions (17 February and
7 March 1999) and 18% of the behavioral observations (n = 154) included groups of four
to five Rota BWEs. On Saipan, as part of behavioral observations (n = 10) we recorded
Saipan BWE flock sizes that ranged from 2 - 10 birds.
Seasonal Effects
We sampled insect and snail numbers per branch on four tree species seven
times in the 1999 field season (Appendix K) and assessed percent fruiting and flowering
on 22 tree species at 11 two-week intervals through the 1999 field season (Appendix L).
We also assessed differences in abundance indices of six bird species over three survey
periods. Both total number of insects and snails per branch appeared higher in the wet
season than in the dry season (Fig. 18). Total insects and snails per branch also appeared
higher in the wet season for all tree species sampled, except Elaeocarpus joga (insects)

35
and Hernandia labyrinthica (snails) (Figs. 19 and 20). We found that percentage of trees
flowering in all five study regions decreased (Wilcoxon signed-rank, T = 15.0, P = 0.06)
and the percentage of trees fruiting increased (Wilcoxon signed-rank, T = 0.0, P = 0.06)
between the dry and wet seasons (Fig. 21). A similar pattern was observed in the
percentage of Elaeocarpus joga, Hernandia labyrinthica, Eugenia thompsonii, Premna
obtusifolia, Pipturus argenteus, and Macaranga thompsonii (species where Rota BWEs
were observed foraging for fruits or flowers) trees fruiting and flowering between the dry
and wet seasons (Fig. 22). However, Pipturus argenteus had high levels of flowering in
both seasons along with an increase in fruiting in the wet season (Fig. 22).
Abundance indices of all bird species, except Rota BWEs, did not differ
between survey periods (Fig. 23) (two-way ANOVA, F = 3.04, df = 10, P = 0.001). Rota
BWE abundance indices were higher in the wet season of 1998 than in the wet season of
1999 (Fig. 23) (Tukey test, P < 0.05). However, no difference in Rota BWE abundance
indices between wet seasons and dry season were observed. We analyzed the Rota BWE
data again using means instead of maximum abundance indices for each study plot in
each survey period because of concern over rare observations of Rota BWEs influencing
results. No difference in Rota BWE abundance indices between survey periods were
observed when we used mean instead of maximum abundance indices for each study plot
(One-way ANOVA, F = 1.53, df = 2, P = 0.23).
White-eye Population Estimate
We estimated a population size of 1,092 Rota BWEs within our study area.

36
However, the 95% confidence interval for this estimate was 147 to 2,710 Rota BWEs.
Over 85% of our population estimate was from study areas A, B, and C (Table 4). Area E
had the lowest estimated Rota BWE population within our study area.
Habitat Alteration
Microhabitat Relationships- We collected foraging habitat (foliage volume,
intermediate scale characteristics, and broad scale characteristics) information on 32 Rota
BWEs in 12 study plots (Table 5). At the fine scale, Rota BWEs selected for areas with
higher foliage volume than available within their current range. However, no overall
differences in use versus availability of foraging habitat characteristics at the intermediate
(Hotelling’s T2, T2 = 4.15, F = 0.94, df = 3, P = 0.46) or broad scales (Hotelling’s T2, T2 =
4.24, F = 2.05, df = 4, P = 0.15) were detected. Because we detected no overall
differences at the broad and intermediate scales we did not examine differences in
individual variables at these scales.
We recorded foraging substrate type and species use information from
observations of 116 Rota BWEs (other habitat characteristics were not recorded due to
time constraints). Only study sites 1HA and 1HB contained more than 20 observations of
Rota BWE foraging. We compared foraging use with the availability of substrates and
substrate species and detected no overall differences in the use and availability of
substrate types and substrate species in these study plots (Table 6).
Within Range Relationships- We calculated the mean abundance indices of 11
bird species in areas designated high and low density Rota BWE areas by Fancy and

37
Snetsinger (1996) over three survey periods (Table 7). All bird species, except Rota
BWEs, did not differ in mean abundance indices between high and low density Rota
BWE areas. Rota BWE mean abundance indices were higher in areas designated high
density Rota BWE areas by Fancy and Snetsinger (1996).
We also calculated estimates of descriptive habitat characteristics (Table 8)
and density and basal areas of woody species (Table 9) for areas designated high and low
density Rota BWE areas by Fancy and Snetsinger (1996). We detected lower tree basal
area and higher epiphyte density and elevation in high density Rota BWE areas than low
density Rota BWE areas. No differences in tree density estimates for Elaeocarpus joga,
Hernandia labyrinthica, and Merrilliodendron megacarpum were detected between areas
designated high and low density Rota BWE areas (Wilcoxon rank sum test, P > 0.10).
We used eight habitat variables as independent variables in stepwise multiple
linear regression analysis of mean Rota BWE abundance indices over the three survey
periods (Table 10). The model was significant and canopy height, Ficus prolixa density,
foliage volume (3-9 m), and Elaeocarpus joga density were selected as significant
predictors of Rota BWE abundance indices. Both canopy height and Ficus prolixa
density were negatively related to Rota BWE abundance while foliage volume and
Elaeocarpus joga density were positively related to Rota BWE abundance. We detected
no relationship between mean Rota BWE abundance indices and Hernandia labyrinthica
density (Pearson’s correlation, r = 0.02, P = 0.94, n = 18). However, we did detect a
positive relationship between Merrilliodendron megacarpum density and mean Rota

38
BWE abundance indices (Pearson’s correlation, r = 0.61, P = 0.01, n = 18).
Sabana-Wide Relationships- We sampled a total of 57 stations on nine
transects as part of the Sabana-wide survey (Fig. 24). All transects began between 100
and 370 m elevation and ended between 250 and 450 m elevation. We detected Rota
BWEs at nine stations on six transects in areas classified as mature limestone forest,
young limestone forest, or disturbed limestone forest. We detected no Rota BWEs in any
other habitat type (35% of the 57 stations were not classified as limestone forest) and all
Rota BWEs were detected at the stations above 250 m elevation (82% of the 57 stations
were above 250 m elevation). We used eight habitat variables as independent variables in
a step-wise multiple linear regression analysis of Rota BWE abundance estimates along
the nine transects (Table 11). The model was significant and Hernandia labyrinthica and
Ficus spp. densities and Elatostema and Procris spp. index were selected as predictors of
Rota BWE abundance along the transects. Both Hernandia labyrinthica density and
Elatostema and Procris spp. index were positively related to Rota BWE abundance while
Ficus spp. density was negatively related.
Island-Wide Relationships- We sampled a total of 41 woody species in the
five Rota BWE study areas and J. M. Morton (unpubl. data) sampled 35 woody species in
the six Mariana crow study sites (Table 12). Fourteen woody species were recorded only
in Rota BWE study areas and eight woody species were recorded only in Mariana crow
study sites. Of the 14 species recorded only in Rota BWE study areas, three were
introduced species (Areca cathecu, Bambusa vulgaris, and Persea americana) and six

39
(Geniostoma micranthum, Allophylus spp., Ixora triantha, Tarenna sambucina, Eugenia
thompsonii and Eugenia spp.) were observed in Mariana crow study sites but not
recorded during habitat sampling (J. M. Morton, USFWS, pers. comm.). Of the eight
species recorded only in Mariana crow study sites, two were introduced (Casuarina
littorea and Citrus spp.) and two (Maytenus thompsonii and Morinda citrifolia) were
recorded in Rota BWE study areas as trees with diameters at breast height of < 10 cm.
Therefore, we recorded five native tree species that were found only in Rota BWE study
areas and J. M. Morton recorded four species that were found only in Mariana crow study
sites.
To assess which of the five species recorded only in Rota BWE study areas
were important components of the forests in these areas we determined which five woody
species in each study plot had the highest densities and basal areas (Table 13). We did
not determine this for the Mariana crow sites because only 10 plots were sampled in each
site, which was probably not enough to characterize each site. Of the five tree species,
only Hernandia labyrinthica and Merrilliodendron megacarpum were considered
important forest components in more than one of the Rota BWE study plots. Rota BWEs
were recorded in all study plots in which Hernandia labyrinthica or Merrilliodendron
megacarpum was an important forest component. However, Rota BWE abundance
estimates were not high in all study plots with Hernandia labyrinthica as an important
forest component.
Insect Relationships- We collected a total of 30 high elevation (380-450 m)

40
and 30 low elevation (150-250 m) samples from three transects (10 samples per transect )
(Fig. 25). Of the eight insect orders sampled (Fig 26), we were able to identify individual
insects to family in four orders (Fig. 27) using identification keys in Borror et al. (1987).
We were unable to identify Dipteran and Lepidopteran adult and larvae to family because
of damage to the specimens in those orders. In addition, we sampled three high and three
low Rota BWE abundance sites for total insect and snail numbers per branch (Fig. 28).
We found the number of snails per sample appeared higher for high elevation sites than
low elevation sites (Fig. 29). In addition, we found milligrams of Homoptera appeared
lower at high elevations than low elevations (Fig. 26). We found one family of
Coleopteran (Curculionidae), consisting of nine specimens, only at high elevation sites
and one family of Homopteran (Membracidae), consisting of one specimen, only at low
elevation sites (Fig. 27). In addition snail numbers per branch appeared higher in Rota
BWE high abundance areas than low abundance areas (Fig. 28).
We detected rufous fantails in 100% of the 20 Rota BWE study plots we
surveyed and in 75% of the transect survey stations (n = 57) on the Sabana. There was a
positive relationship between mean rufous fantail abundance estimates and mean Rota
BWE abundance indices (Pearson’s correlation, r = 0.67, P < 0.01, n = 18) within the
Rota BWE’s current range. There was also a positive relationship between Rota BWE
abundance estimates and the presence of rufous fantails along the transects of the Sabana
(Pearson’s correlation, r = 0.23, P = 0.09, n = 57). The stepwise multiple linear
regression analysis of mean rufous fantail abundance indices and eight habitat variables

41
was significant and 3-9 m foliage volume and Elaeocarpus joga density were selected as
good predictors of mean rufous fantail abundance indices (Table 10). Both variables
were positively related to mean rufous fantail abundance indices.
Black Drongos
On 18 August 1998 we observed a black drongo eating a Rota BWE in an
Elaeocarpus joga tree in study plot 2HA. When the black drongo was first observed, it
was plucking the feathers of the white-eye while a nearby Rota BWE gave alarm calls.
When we attempted to approach the drongo a Micronesian starling chased it out of view.
The Rota BWE was not a nestling (eye ring was present) but we were unable to determine
if it was an adult or juvenile. No other observations of attempted or successful predation
of drongos on Rota BWEs were observed.
We looked at black drongo and small passerine relationships within the Rota
BWE’s current range, along transects on the Sabana, and along transects surveyed in 1982
and 1994. No relationship between mean black drongo abundance index estimates and
the abundance estimates of Rota BWEs, rufous fantails, and Micronesian honeyeaters
were detected within the Rota BWE’s current range (Pearson correlations, P > 0.10). In
addition, no significant relationship between black drongo abundance estimates along the
transects on the Sabana and the abundance estimates of Rota BWEs was detected
(Pearson’s correlation, r = -0.109, P = 0.42, n = 57). Results of Pearson correlations on
Rota BWE and black drongo abundance within 35-m of all stations on the Sabana were
not significant in 1982 but were significant in 1994 (Table 14). Significant relationships

42
between black drongo detections and Micronesian honeyeater detections were observed in
1982 and 1994 (Table 14). In addition, a significant relationship between rufous fantail
and black drongo detections was observed in 1994 (Table 14).
We were able to look at differences in black drongo abundance between the
Sabana and other regions of the island in three years (Table 15) and to look at changes in
black drongo and small passerine detections between 1982 and 1994 (Fig. 30). In each
year there was a difference in black drongo detections between regions with significantly
fewer black drongos detected on the Sabana than in other regions of the island (Table 15).
There was also an increase in black drongo detections per station between years and a
decrease in Rota bridled white-eyes (Fig. 30). No difference in rufous fantail and
Micronesian honeyeater detections were detected between 1982 and 1994 but
Micronesian starling and collared kingfisher numbers did increase (Fig. 30).
We detected black drongos from 150 - 420 m elevation along transects on the
Sabana. Sixty-nine percent of the observations (n = 17) were in non-forested habitats
(secondary vegetation, cropland, and pasture) while the remainder were in partially
forested habitats. No habitat variable meet the 0.15 significance level for stepwise
multiple linear regression analysis of black drongo abundance along transects on the
Sabana.
Black drongo abundance estimates within the Rota BWE study plots were also
used to look at black drongo habitat relationships. We used eight habitat variables as
independent variables in a stepwise multiple linear regression analysis of mean black

43
drongo abundance (Table 10). The model was significant and canopy height and
Pandanus tectorius density were selected as significant predictors of mean black drongo
abundance. Canopy height was negatively related to mean black drongo abundance while
Pandanus tectorius density was positively related to mean abundance. We detected no
difference in black drongo abundance estimates for forest interior study plots in the dry
season (when the canopy is more open because of leaf-fall) compared to the wet seasons
of 1998 and 1999 (two-way ANOVA, F = 0.14, df = 2, P = 0.87) (Fig. 31).
Rat Populations
We trapped a total of 31 rats over 200 potential trapnights (40 traps x 5 nights)
in the Rota BWE areas. However, 132 traps were either missing, unbaited, or were
tripped and did not contain rats when checked. Therefore, the actual number of
trapnights equaled 68. Actual and potential number of rats per trapnight for Mariana
crow study sites were obtained from Morton et al. (1999) (Table 16). There was a
difference in number of rats per potential trapnight among all study areas but no
difference in rats per actual trapnight was detected among all study areas (Table 16).
Results of Tukey’s multiple comparison procedure on rats per potential trapnight indicate
no difference in rats per potential trapnight between Rota BWE study areas and any
Mariana crow study site.
We collected the stomach contents of 22 rats (Fig. 32). The stomach contents
of the rats captured in Mariana crow study sites were not recorded. None of the stomachs
examined contained any bird remains (feathers, bones, etc.) or eggs. The majority of the

44
stomachs collected contained some sort of vegetation (leaves, fruit, seeds, etc.) though
animal remains were also found.
DISCUSSION
Rota Bridled White-eye Life History
Limited research had been done on the life history of the Rota BWE prior to
this study. However, the limited data available on Rota BWE nesting (Yamashina 1932,
Pratt 1985, Lusk and Taisacan 1997) and foraging (Craig and Taisacan 1994) are similar
overall to the data collected in this study. Two of the previous three nests were reported
in Hernandia labyrinthica (Lusk and Taisacan 1997) or Hernandia spp. (presumably H.
labyrinthica) (Pratt 1985). We observed the use of three other tree species including one
introduced species, Acacia confusa. Lusk and Taisacan (1997) reported that the Rota
BWE breeding season extended from at least March until June. The observations of
breeding activity from this study indicate a breeding season from at least December until
August. We also expanded upon the foraging data previously reported by Craig and
Taisacan (1994). We noted the use of flowers for foraging and that Rota BWEs will
occasionally forage with rufous fantails.
The breeding biology of the Rota BWE is similar in most respects to that of
several other white-eye species (Table 17) (Appendix M). However, we found that
Saipan and Rota BWEs differ in their nest site characteristics and vocalizations. Data
collected on Saipan BWEs by Craig (1989, 1996) also indicate that they may differ from
Rota BWEs in habitat use, flock size, and interspecific interactions. We believe some of

45
these differences may be related to the restricted range and small population size of Rota
BWEs.
Rota BWEs are restricted to elevations > 200 m and are found primarily in
high elevation wet forest. These forests tend to have a higher canopy, larger diameter
trees, and a different composition than the forests where we found Saipan BWE nests.
So, the differences in nest site characteristics may be related to differences in the structure
of the forests used by each species. In addition, Rota BWEs are primarily found in native
and introduced forests at high elevations while Saipan BWEs are found in urban areas,
grassland, and both introduced and native forests (Craig 1989, 1996) at a wide range of
elevations (pers. obs.). This difference appears to be related to the apparent specialization
to high elevation forest by Rota BWEs.
The small size of the Rota BWE population in comparison to the Saipan BWE
may explain differences in flock size and interspecific interactions. Craig (1989) reported
that Saipan BWE flocks were normally 10-40 birds (maximum: 50) while our normal
flock size was only 2-3 birds (maximum: 14). Rota BWEs also appear to forage in mixed
species flocks more often than reported for Saipan BWEs (Craig 1989, 1996). The low
population size of Rota BWEs may have led to their small flock sizes. Jenkins (1983)
reported that Guam BWE flock size was lower when the population had decreased. Since
their flock sizes are smaller, Rota BWEs may also become more involved in mixed
species flocks to receive the benefits of flocking, such as increased foraging efficiency
(Krebs 1973) and reduced risk of predation with group vigilance (Powell 1974, Popp

46
1988).
Seasonal Effects
The decline in Rota BWE abundance indices between the wet seasons of 1998
and 1999 may or may not reflect a true decline of Rota BWEs. The 1998 survey period
was preceded by typhoon Paka in December 1997 and a severe drought in early 1998.
These conditions may have effected the overall distribution of Rota BWEs during the
1998 survey causing Rota BWEs to be observed in some study plots only once in 1998
and not being reported in these study plots in subsequent surveys. This may have biased
the overall abundance estimates for these plots since we used the highest estimates of
Rota BWE abundance for each plot in the analysis. When we used the means for each
study plot we no longer observed a difference between survey periods so the differences
noted earlier may have been due to changes in movement or forest use by Rota BWEs and
not a population decline. This is important to note because the conditions (seasonal or
otherwise) during a survey could have serious impacts on attempts to estimate the Rota
BWE’s population size or distribution.
White-eye Population Estimate
Our population estimate was very similar to one provided by Fancy and
Snetsinger (1996). This may be an indication that the Rota BWE population has not
changed since 1996. However, this sort of conclusion needs to be approached with
caution for two reasons. First, the methods used to determine the number of birds in an
area were very different and may have affected the population estimate in different ways.

47
Second, the basis for determining study areas for this study was the work done by Fancy
and Snetsinger (1996), which may have biased our estimate by focusing our efforts in
areas previously surveyed. However, whether the population has increased or decreased
since 1996, it is clear from our estimate that the population is much lower than the 1982
estimate and that the Rota BWE population is still threatened with extinction.
In addition to a population estimate, we learned more about the distribution of
Rota BWEs. Our study plot and survey data indicate that the Rota BWE’s distribution is
more fragmented than reported in Fancy and Snetsinger (1996). Rota BWEs were not
observed in large numbers in many areas that were defined as high density areas.
Therefore, the classification of high and low density areas by Fancy and Snetsinger
(1996) should be used with caution. Instead the locations where they detected Rota
BWEs during their 1996 survey (Figure 9 in Fancy and Snetsinger (1996)) would be more
useful in determining where the highest densities of Rota BWEs occur.
Habitat Alteration
For the past 25 years, Rota BWEs have only been consistently recorded above
200 m elevation on Rota. We believe that this high elevation distribution is related to the
distribution of wet forests on Rota and that Rota BWEs prefer this forest type. We are
not certain what characteristics of this forest type are important to Rota BWEs but we
believe that the alteration of this forest type may have played a major role in the decline
of Rota BWEs from 1982 until today.
Native high elevation wet forests appear to be restricted to elevations > 200 m
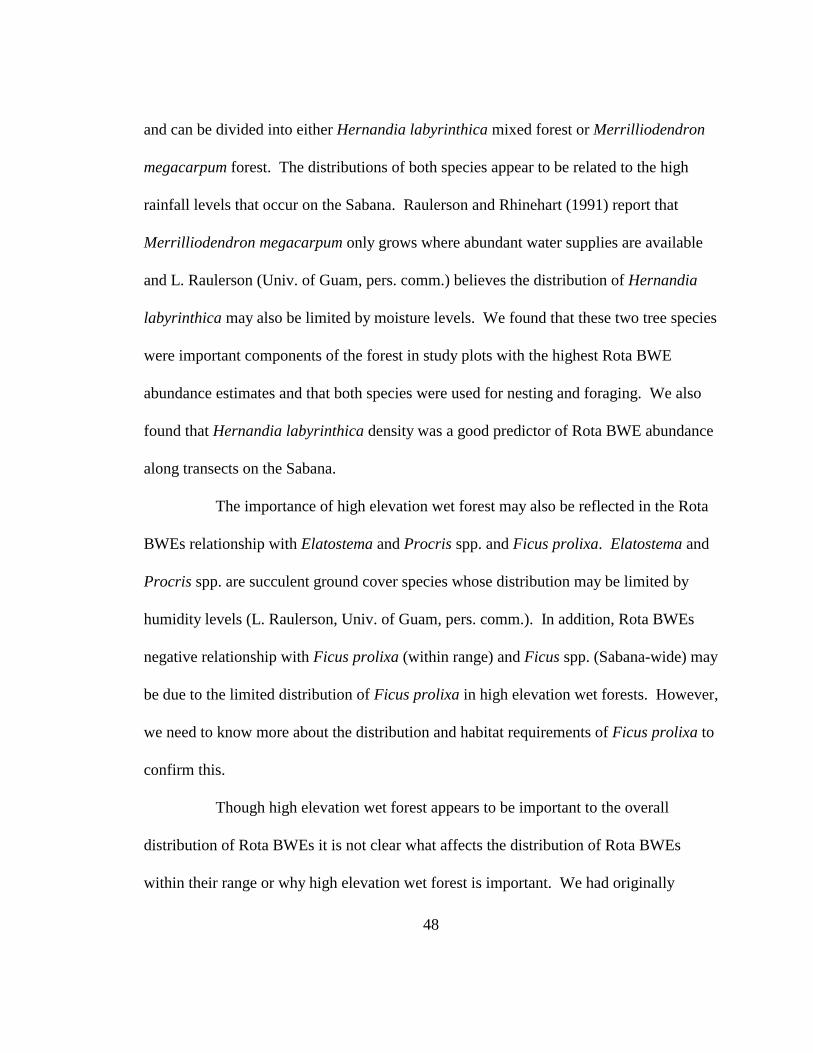
48
and can be divided into either Hernandia labyrinthica mixed forest or Merrilliodendron
megacarpum forest. The distributions of both species appear to be related to the high
rainfall levels that occur on the Sabana. Raulerson and Rhinehart (1991) report that
Merrilliodendron megacarpum only grows where abundant water supplies are available
and L. Raulerson (Univ. of Guam, pers. comm.) believes the distribution of Hernandia
labyrinthica may also be limited by moisture levels. We found that these two tree species
were important components of the forest in study plots with the highest Rota BWE
abundance estimates and that both species were used for nesting and foraging. We also
found that Hernandia labyrinthica density was a good predictor of Rota BWE abundance
along transects on the Sabana.
The importance of high elevation wet forest may also be reflected in the Rota
BWEs relationship with Elatostema and Procris spp. and Ficus prolixa. Elatostema and
Procris spp. are succulent ground cover species whose distribution may be limited by
humidity levels (L. Raulerson, Univ. of Guam, pers. comm.). In addition, Rota BWEs
negative relationship with Ficus prolixa (within range) and Ficus spp. (Sabana-wide) may
be due to the limited distribution of Ficus prolixa in high elevation wet forests. However,
we need to know more about the distribution and habitat requirements of Ficus prolixa to
confirm this.
Though high elevation wet forest appears to be important to the overall
distribution of Rota BWEs it is not clear what affects the distribution of Rota BWEs
within their range or why high elevation wet forest is important. We had originally

49
thought that their distribution may be related to native forest or native tree species found
only at high elevations, such as Hernandia labyrinthica and Merrilliodendron
megacarpum. However, within the Rota BWE’s current range we found no relationship
between Rota BWE abundance indices and Hernandia labyrinthica and found large
concentrations of Rota BWEs outside Merrilliodendron meagacarpum forest. We also
recorded Rota BWEs foraging and nesting in the introduced tree, Acacia confusa, at high
elevations. The forests which contain Acacia confusa lack a well defined understory
which can be found in native forests containing Hernandia labyrinthica and
Merrilliodendron meagacarpum. Since the distribution of Rota BWEs does not appear to
be related to the distribution of native forest within their range there must be something
about both native and non-native high elevation wet forest which is important to Rota
BWEs. One possibility is prey availability.
Mid-story foliage volume was found to be a good predictor of Rota BWE and
rufous fantail abundance indices within the Rota BWE’s range in native forest. Both
species prey on insects and higher mid-story foliage volume may indicate a more complex
forest structure, which may increase the overall area available for both species to forage
for insects. In addition, we found that Rota BWEs selected for areas with higher foraging
volume when foraging, which could reflect higher insect availability in these areas. We
attempted to address the possibility of differences in insect availability with some limited
sampling but were unsuccessful. However, prey availability is still a possible explanation
for the Rota BWEs distribution.

50
The apparent preference for high elevation wet forest by Rota BWEs may
partially explain their population decline from 1982 to 1996. The population decline
reported over this period was primarily based upon a decline in Rota BWE detections
along four transects located in native limestone forest (Falanruw et al. 1989) on the
Sabana. If we assume that these forests were similar to the high elevation wet forests
currently used by Rota BWEs, then the alteration of these forests by supertyphoon Roy in
1988 may explain their decline.
Supertyphoon Roy was reported to have done extensive damage to the forests
of the Sabana (Fancy and Snetsinger 1996). The level of damage caused by this storm
may have been affected by the amount of land cleared on the Sabana for agricultural
purposes which may have increased the exposure of the forest to high winds. Our
personal observations of the areas damaged by supertyphoon Roy indicate that the
emergent canopy trees in these areas appear to be heavily damaged and have less
extensive crowns than trees on other areas of the island. The damage to these canopy
trees may be related to the increased susceptibility of large trees to typhoon damage
(Brokaw and Walker 1991, Basnet et al. 1992). We also found that the understory of
these forests were overgrown with Pandanus tectorius and that the forest structure
differed markedly from forests currently used by Rota BWEs. Rota BWEs primarily
forage and nest in canopy trees and the highest densities of this species are found in
forests with well developed canopies. The alteration of the canopy and the overall forest
composition by the storm may have made the habitat less desirable for Rota BWEs.
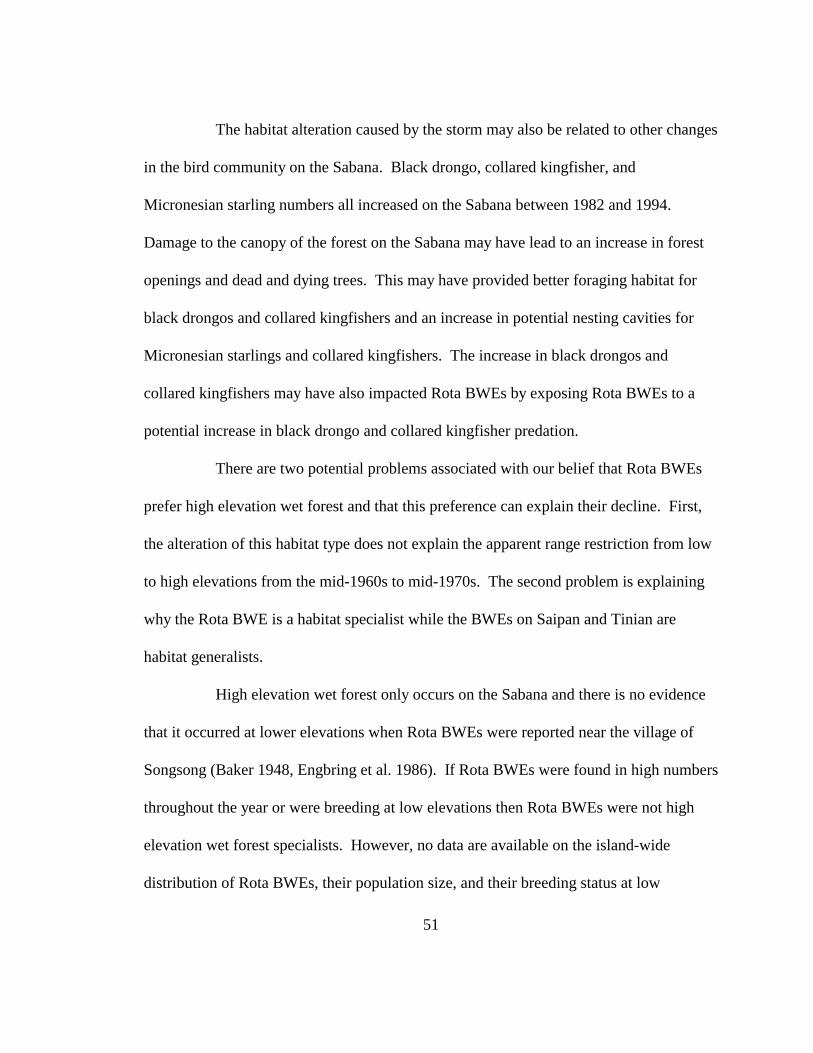
51
The habitat alteration caused by the storm may also be related to other changes
in the bird community on the Sabana. Black drongo, collared kingfisher, and
Micronesian starling numbers all increased on the Sabana between 1982 and 1994.
Damage to the canopy of the forest on the Sabana may have lead to an increase in forest
openings and dead and dying trees. This may have provided better foraging habitat for
black drongos and collared kingfishers and an increase in potential nesting cavities for
Micronesian starlings and collared kingfishers. The increase in black drongos and
collared kingfishers may have also impacted Rota BWEs by exposing Rota BWEs to a
potential increase in black drongo and collared kingfisher predation.
There are two potential problems associated with our belief that Rota BWEs
prefer high elevation wet forest and that this preference can explain their decline. First,
the alteration of this habitat type does not explain the apparent range restriction from low
to high elevations from the mid-1960s to mid-1970s. The second problem is explaining
why the Rota BWE is a habitat specialist while the BWEs on Saipan and Tinian are
habitat generalists.
High elevation wet forest only occurs on the Sabana and there is no evidence
that it occurred at lower elevations when Rota BWEs were reported near the village of
Songsong (Baker 1948, Engbring et al. 1986). If Rota BWEs were found in high numbers
throughout the year or were breeding at low elevations then Rota BWEs were not high
elevation wet forest specialists. However, no data are available on the island-wide
distribution of Rota BWEs, their population size, and their breeding status at low

52
elevations prior to 1975. Therefore we are forced to come up with possible explanations
for the contradiction between current data and past distribution information. One
possible explanation proposed by Fancy and Snetsinger (1996) is that what occurred was
not a range restriction but a decline in dispersing birds from high elevation wet forest.
Based upon observations from this study, we believe this hypothesis may be true.
On 29 July 1999 we observed two Rota BWEs foraging in a flame tree
(Delonix regia) in the Taiapu region (140 m elevation), approximately 800 m from where
they were commonly encountered. Flame trees are introduced ornamental trees with
bright red flowers (easily observed from long distances) which were commonly planted
along streets or in gardens (Stone 1970, Raulerson and Rhinehart 1991) and are used by
foraging Saipan BWEs (pers. obs.). These flame trees were flowering at the time of our
observation and we believe the Rota BWEs may have traveled to low elevations
specifically to forage in these trees. If this was the case, we believe that Rota BWEs may
occasionally foray outside their normal range to visit particular flowering tree species.
Safford (1997) reported that Mauritius olive white-eyes were observed
wandering below their altitudinal limits (350-400 m elevation) to exploit isolated habitats
over 3 km away. He also reported that most of these recorded forays were to exceptional
nectar sources. It is therefore quite possible that the Rota BWEs previously observed at
low elevations in the village of Songsong could have been wandering or dispersing from
their normal range approximately 3 km away at high elevations.
Unfortunately we do not know why the number of dispersers declined. One

53
potential explanation is the heavy use of pesticides that was reported in the Mariana
Islands (Baker 1946). Sheath-tailed bats (Emballonura semicaudata) and island swiftlets
(Aerodramus vanikorensis) both went extinct on the island of Rota in the mid-1960s and
1970s (Engbring et al. 1986, Lemke 1986) at approximately the same time Rota BWEs
were no longer observed at low elevations. All three species prey on insects and a
reduction in prey base from pesticide use may explain the decline of all three species.
Understanding why the Rota BWE may be a habitat specialist is very difficult.
First, less than half of the island of Rota is within the elevation range for high elevation
wet forest. So, historically it was probably not the dominant habitat type on the island.
Second, there does not appear to be any potential niche competition between Rota BWEs
and other species at low elevations which would restrict Rota BWEs to high elevations.
All the bird species whose niche is potentially similar to that of the Rota BWE are found
on the neighboring islands of Saipan and Tinian at all elevations with Saipan and Tinian
BWEs. Therefore we could find no obvious reason to explain this apparent specialization
for high elevation wet forest. However, this does not imply the Rota BWE has to be a
habitat generalist. Even though many white-eye species are described as habitat
generalists (Skead and Ranger 1958, Ali and Ripley 1974, Greig-Smith 1979, Jenkins
1983, Cheke 1987, Pratt et al. 1987, Craig 1989, Langrand 1990, Brazil 1991, Kennedy et
al. 2000), there are some species that appear to be habitat specialists. The Mauritius olive
white-eye (Zosterops chloronthus) is reported to prefer very wet areas of native forest at
high elevations on Mauritius (Cheke 1987). In the Philippines, the mountain white-eye

54
(Zosterops montanus) and black-masked white-eye (Lophozosterops goodfellowi) are
both confined to forests above 1,000 m elevation (Kennedy et al. 2000). The Samoan
white-eye (Zosterops samoanensis) is believed to be restricted to cloud forests above 900
m elevation on the island of Savaii (Reed 1980, Bellingham and Davis 1988). Further
work is clearly needed on the interactions of Rota BWEs with other forest birds and its
preferred habitat to explain their apparent habitat specialization.
Black Drongos
Our results indicate that black drongos do prey on Rota BWEs, black drongo
numbers are lower on the Sabana than other regions of the island as reported by Craig and
Taisacan (1994), and that black drongo numbers have increased on the Sabana from 1982
to 1994 while Rota BWEs numbers have decreased. However, we detected no negative
relationship between black drongo numbers and any of the small native passerines,
including Rota BWEs, that drongo predation could impact. Therefore, we are still
uncertain what role black drongos played in the decline and range restriction of the Rota
BWE. We believe that the habitat alteration discussed earlier may have played the major
role in the decline by reducing the availability of preferred Rota BWE habitat. However,
this habitat alteration may have also helped increase the incidence of black drongo and
collared kingfisher predation on Rota BWEs by making the habitat more suitable for
black drongo and collared kingfishers and increasing their populations on the Sabana.
The impact of habitat alteration is important because it could reflect on
management of black drongo numbers. Maben (1982) found that black drongos forage

55
predominately in open areas surrounded by disturbed vegetation on perches well outside
the foliage. We also found that black drongos were normally found near openings or
disturbed vegetation along our Sabana transects. Therefore, the differences in black
drongo numbers on the sabana between years and between different parts of the island
could be related to habitat differences. If this is the case then habitat protection for Rota
BWEs could also impact black drongo and potentially collared kingfisher predation by
minimizing the availability of habitat suitable for these two avian predators. Research on
black drongo and collared kingfisher habitat selection is needed however.
Rat Populations
We found no difference between rat densities within the Rota BWE’s range
and the rat densities within Mariana crow study sites at low elevations on the island of
Rota. Therefore, we do not believe that the distribution of Rota BWEs is limited by rat
densities at lower elevations. However, the impact of introduced rats on Rota BWEs has
not been addressed so the role of rats in the decline of the Rota BWE is still unclear.
Management Recommendations
1. The biggest potential threat to the Rota BWE and other native birds on Rota is
the accidental introduction of the brown tree snake. Therefore, we
recommend that the Rota BWE management priority should be to prevent the
introduction of the brown tree snake to Rota. This should include increased
interdiction efforts to check all cargo transported to Rota from Guam and
perhaps Saipan by sea or air.

56
2. All high elevation wet forests (forests above 200 m elevation) should be
protected for Rota BWEs, including native and non-native forests as well as
areas of damaged forest. Our research indicates that Rota BWEs have been
restricted to these high elevation wet forests for at least the past 25 years and
these areas are likely critical to the continued existence of the Rota BWE.
This protection is especially important due to the increased risk of extinction
from potential future catastrophes (e.g. typhoons) on Rota (Mangel and Tier
1994). Potentially this habitat could be designated critical habitat under the
Endangered Species Act, protected under a Habitat Conservation Plan
(Section 10, ESA), or preserved by some other mechanism. However, it
should be emphasized that the Rota BWE is the rarest endemic vertebrate
species in the Marianas and is clearly a candidate for critical habitat
designation. It should also be emphasized that this protection is urgent before
further land clearing reduces the connectivity of the forest and increases the
exposure of the forest to the full force of high winds from tropical storms.
3. A captive breeding program for the Rota BWE is probably warranted. The
Rota BWE has experienced a 90% population decline in the last 14 years, it
appears to be a high elevation wet forest specialist, and it is found only on the
island of Rota. This makes the Rota BWE the rarest species in the Mariana
Islands. Since the causes of the population decline are not well understood it
is imperative that a captive breeding program be started to establish a second

57
population off the island of Rota.
4. An active population monitoring program for the Rota BWE is needed to
keep track of changes in the Rota BWE population. This monitoring program
should consist of a series of permanent survey stations within the current and
historical range of the Rota BWE. These survey stations should be placed
along previous survey transects, within the study plots used in this study, and
in areas which have not been well studied. In addition, we recommend that
the variable circular plot technique be used to allow for both density and
abundance estimates and that monitoring be undertaken under similar
conditions. These conditions include trained observers, the time of year, and
good weather.
5. Our understanding of why the Rota BWE population declined and why it is
restricted to high elevation wet forest is still unclear. Therefore, further
research (see Appendix N for other research methods used in this study) in the
following areas are needed:
a. Population dynamics - Active nest monitoring and color banding are
needed to provide information on nest success and both juvenile and adult
survival. This information would help determine the main causes of
mortality (e.g. native and non-native predators) in the different age classes
and allow more effective management of the species.
b. Habitat and prey selection - It is not clear from this study what

58
characteristics of high elevation forest affect the distribution of Rota
BWEs within this forest type. Therefore, a better understanding of nesting
and foraging habitat selection (with larger sample sizes than those
obtained in this study and a focus on the importance of flowers as foraging
substrates) as well as prey selection may provide us with information to
explain their distribution within their range.
c. Predators - We know very little about the impacts of native and non-native
predators on the Rota BWE population. Therefore research on the impact
of potential predators like black drongos, rats, monitor lizards, collared
kingfishers, and feral cats is needed. This is especially true for introduced
rats and the black drongo which have both been implicated in the decline
of the Rota BWE. Research on these two introduced predators may
included research on effective control measures. However, we feel this
should not be a priority over brown tree snake interdiction efforts and
protection of habitat. In addition, we feel that any predator control should
be undertaken as a well designed research study (including replicated
treatment and control plots) that would not have negative effects on native
wildlife populations and the environment (e.g. Fancy and Snetsinger’s
(1996) proposed use of satellite dumping for black drongo control).

59
LITERATURE CITED
Ali, S., and S. D. Ripley. 1972. Handbook of the birds of India and Pakistan. Volume 5.Oxford University Press, London.
Ali, S., and S. D. Ripley. 1974. Handbook of the birds of India and Pakistan. Volume10. Oxford University Press, London.
Baker, R. H. 1946. Some effects of the war on the wildlife of Micronesia. Transactionsof the Eleventh North American Wildlife Conference:205-213.
Baker, R. H. 1948. Report on collections of birds made by United States Naval MedicalResearch Unit No. 2 in the Pacific war area. Smithsonian MiscellaneousCollections 107:1-74.
Baker, R. H. 1951. The avifauna of Micronesia, its origin, evolution, and distribution.University of Kansas Publication Museum of Natural History 3:1-359.
Basnet, K., G. E. Likens, F. N. Scatena, and A. E. Lugo. 1992. Hurricane Hugo: damageto a tropical rain forest in Puerto Rico. Journal of Tropical Ecology 8:47-55.
Bellingham, M., and A. Davis. 1988. Forest bird communities in western Samoa.Notornis 35:117-128.
Borror, D. J., D. M. De Long, and C. A. Triplehorn. 1987. An introduction to the studyof insects. 5th edition. Saunders College Publishing, New York.
Bowers, N. M. 1950. Problems of resettlement on Saipan, Tinian and Rota, MarianaIslands. Ph.D. dissertation, University of Michigan, Ann Arbor.
Bradley, D. W. 1985. The effects of visibility bias on time-budget estimates of nichebreadth and overlap. Auk 102:493-499.
Brazil, M. A. 1991. The birds of Japan. Smithsonian Institution Press, Washington D.C.
Broekhuysen, G. J., and J. M. Winterbottom. 1968. Breeding activity of the cape white-eye Zosterops virens capensis Sundevall in the South-west Cape. Ostrich39:163-176.
Brokaw, N. V. L., and L. R. Walker. 1991. Summary of the effects of Caribbeanhurricanes on vegetation. Biotropica 23:442-447.
Catterall, C. P., W. S. Wyatt, and L. J. Henderson. 1982. Food resources, territory

60
density and reproductive success of an island silvereye population Zosteropslateralis. Ibis 124:405-421.
Catterall, C. P., J. Kikkawa, and C. Gray. 1989. Inter-related age-dependent patterns ofecology and behaviour in a population of silvereyes (Aves: Zosteropidae).Journal of Animal Ecology 58:557-570.
Cheke, A. S. 1987. The ecology of the smaller land-birds of Mauritius. Pages 151-207 inStudies of Mascarene Island Birds (A. W. Diamond, Ed). CambridgeUniversity Press, Cambridge.
Collar, N. J., M. J. Crosby, and A. J. Stattersfield. 1994. Birds to watch 2: the world listof threatened birds. Birdlife Conservation Series No. 4. SmithsonianInstitution Press, Washington D.C.
Craig, R. J. 1989. Observations on the foraging ecology and social behavior of thebridled white-eye. Condor 91:187-192.
Craig, R. J. 1990. Foraging behavior and microhabitat use of two species of white-eyes(Zosteropidae) on Saipan, Micronesia. Auk 107:500-505.
Craig, R. J. 1996. Seasonal population surveys and natural history of a Micronesian birdcommunity. Wilson Bulletin 108:246-267.
Craig, R. J., and E. Taisacan. 1994. Notes on the ecology and population decline of theRota Bridled White-eye. Wilson Bulletin 106:165-169.
Diamond, J. M. 1984. Possible effects of unrestricted pesticide use on tropical birds.Nature 310:452.
Engbring, J. 1987. Status of the forest birds of Rota, April 1987. U.S. Fish and WildlifeService, Honolulu, Hawaii.
Engbring, J. 1989. Fluctuations in bird populations on the island of Rota as related to anexperimental program to control the Melon Fly. U.S. Fish and WildlifeService, Honolulu, Hawaii.
Engbring, J., F. L. Ramsey, and V. J. Wildman. 1986. Micronesian forest bird survey,1982: Saipan, Tinian, Agiguan, and Rota. U.S. Fish and Wildlife Service,Honolulu, Hawaii.
Falanruw, M. C., T. G. Cole, and A. H. Ambacher. 1989. Vegetation survey of Rota,Tinian, and Saipan, Commonwealth of the Northern Mariana Islands.

61
Resource Bulletin PSW-27, Forest Service, USDA.
Fancy, S. G., and T. J. Snetsinger. 1996. Potential reasons for the decline of the bridledwhite-eye population on Rota, Mariana Islands. U.S. Geological Survey,Biological Resources Division, Hawaii.
Flannery, T. 1995. Mammals of the southwest Pacific and Moluccan Islands. CornellUniversity Press, Ithaca.
Fosberg, F. R. 1960. The vegetation of Micronesia. Bulletin of the American Museum ofNatural History 119:1-75.
Greig-Smith, P. W. 1979. Observations of nesting and group behaviour of Seychelleswhite-eyes Zosterops modesta. Ibis 121:344-348.
Grue, C. E. 1985. Pesticides and the decline of Guam’s native birds. Nature 316:301.
Hartert, E. 1898. On the birds of the Mariana Islands. Novitates Zoologicae 5:51-69.
Hollander, M., and D. A. Wolfe. 1999. Nonparametric statistical methods, 2nd Edition.John Wiley and Sons, Inc. New York.
Isobe, S. 1997. White-eyes. Page 136 in Encyclopedia of Japanese Animals 4 Birds II(H. Higuchi, H. Morioka, and S. Yamagishi, Eds.). Heibonsha, Tokyo. [inJapanese].
Jenkins, J. M. 1983. The native forest birds of Guam. Ornithological Monographs 31:1-61.
Johnson, D. H. 1962. Rodents and other Micronesian mammals collected. Pages 21-38in Pacific Island Rat Ecology (T. I. Storer, Ed.). Bernice P. Bishop Museum,Bulletin 225.
Kennedy, R. S., P. C. Gonzales, E. C. Dickinson, H. C. Miranda, Jr., and T. H. Fisher. 2000. A guide to the birds of the Philippines. Oxford University Press.
Kikkawa, J. 1961. Social behaviour of the white-eye Zosterops lateralis in winter flocks.Ibis 103:428-442.
Kikkawa, J., and J. M. Wilson. 1983. Breeding and dominance among the Heron Islandsilvereyes Zosterops lateralis chlorocephala. Emu 83:181-198.
Krebs, J. R. 1973. Social learning and the significance of mixed-species flocks of
62
chickadees (Parus spp.). Canadian Journal of Zoology 51:1275-1288.
Laake, T. L., J. L. Derry, S. T. Buckland, D. L. Barchers, D. R. Anderson, K. P. Burnham,S. Strindberg, S. L. Hedley, M. L. Best, F. F. C. Marques, J. H. Pollard, andR. M. Fewster. 1998. Distance 3.5. Research Unit for Wildlife PopulationAssessment, University of St. Andrews, U. K.
Langrand, O. 1990. Guide to the birds of Madagascar. Yale University Press, NewHaven.
Lemke, T.O. 1986. Distribution and status of the sheath-tailed bat (Emballonurasemicaudata) in the Mariana Islands. Journal of Mammalogy 67:743-746.
Lusk, M. R., and E. Taisacan. 1997. Description of a bridled white-eye nest from Rota,Mariana Islands. Micronesica 30:183-185.
Maben, A. F. 1982. The feeding ecology of the black drongo Dicrurus macrocercus onGuam. M.S. thesis, California State University, Long Beach.
MacArthur, R. H., and H. S. Horn. 1969. Foliage profile by vertical measurements.Ecology 50:802-804.
Mangel, M. and C. Tier. 1994. Four facts every conservation biologist should knowabout persistence. Ecology 75:607-614.
Manly, B. F. J., L. L. MacDonald, and D. L. Thomas. 1993. Resource selection byanimals: statistical design and analysis for field studies. Chapman and Hall,London.
Martin, T. E., and G. R. Geupel. 1993. Nest-monitoring plots: methods for locating nestsand monitoring success. Journal of Field Ornithology 64:507-519.
Morton, J. M., S. Plentovich, and T. Sharp. 1999. Reproduction and juvenile dispersal ofMariana crows (Corvus kubaryi) on Rota 1996-1999. U.S. Fish and WildlifeService Report, Honolulu, Hawaii.
National Oceanic and Atmospheric Administration. 1998. Climatological data annualsummary: Hawaii and Pacific. Volume 4. No. 13. National Climatic DataCenter, Asheville, North Carolina.
Noon, B. R. 1981. Techniques for sampling avian habitats. Pages 42-51 in The use ofmultivariate statistics in studies of wildlife habitat (D. E. Capen, Ed.).General Technical Report RM-87, U.S. Forest Service, USDA.

63
Olson, S. L., and H. F. James. 1982. Prodromus of the fossil avifauna of the HawaiianIslands. Smithsonian Contributions to Zoology. 365:1-59.
Perez, G. 1968. Relative status and ecological notes of some Guam birds. UnpublishedReport, Guam Division of Wildlife Resources.
Pizzey, G. 1980. A field guide to the birds of Australia. Princeton University Press,Princeton.
Popp, J. W. 1988. Scanning behavior of finches in mixed-species groups. Condor90:510-512.
Powell, G. V. N. 1974. Experimental analysis of the social value of flocking by starlings(Sturnus vulgaris) in relation to predation and foraging. Animal Behaviour22:501-505.
Pratt, H. D., P. L. Bruner, and D. G. Berrett. 1979. America’s unknown avifauna: thebirds of the Mariana Islands. American Birds 33:227-235.
Pratt, H. D., P. L. Bruner, and D. G. Berrett. 1987. A field guide to the birds of Hawaiiand the tropical Pacific. Princeton University Press, Princeton.
Pratt, T. K. 1985. Land and freshwater investigations. Pages 87-96 in Annual ReportFiscal Year 1984 (A. I. Palacios, T. O. Lemke, and T. K. Pratt, Eds.). Pittman-Robertson Federal Aid in Wildlife Restoration Program. Divisionof Fish and Wildlife, Commonwealth of the Northern Mariana Islands.
Pratt, T. K., and L. Sileo. 1983. Letter To: Chief of fish and wildlife, CNMI Division ofFish and Wildlife. Rota field trip (2-5 August 1983).
Raim, A. 1978. A radio transmitter for small passerine birds. Bird-Banding 49:326-332.
Ralph, C. J., S. Droege, and J. R. Sauer. 1995. Managing and monitoring birds usingpoint counts: standards and applications. Pages 161-168 in Monitoring birdpopulations by point counts ( C. J. Ralph, J. R. Sauer, and S. Droege, Eds.).General Technical Report PSW-GTR-149. Albany, CA: Pacific SouthwestResearch Station, Forest Service, U.S. Department of Agriculture.
Ralph, C. J., and H. F. Sakai. 1979. Forest bird and fruit bat populations and theirconservation in Micronesia: notes on a survey. Elepaio 40:20-26.
Ramsey, F. L., and L. A. Harrod. 1995. Results from the avian surveys of Rota andTinian islands, Northern Marianas, 1982 and 1994. Unpublished Report to

64
U.S. Fish and Wildlife Service. Plus addendum.
Rappole, J. H., and A. R. Tipton. 1991. New harness design for attachment of radiotransmitters to small passerines. Journal of Field Ornithology 62:335-337.
Raulerson, L., and A. Rinehart. 1991. Trees and shrubs of the Northern Mariana Islands.Coastal Resources Management, Office of the Governor, Commonwealth ofthe Northern Mariana Islands, Saipan.
Reed, S. 1980. The birds of Savai’i, Western Samoa. Notornis 27:151-159.
Remsen, Jr., J. V., and S. K. Robinson. 1990. A classification scheme for foragingbehavior of birds in terrestrial habitats. Pages 144-160 in Avian foragingtheory, methodology, and applications (M. L. Morrison, C. J. Ralph, J.Verner, and J. R. Jehl, Jr. Eds.). Studies in Avian Biology No. 13.
Rencher, A. 1995. Methods of multivariate analysis. John Wiley and Sons, New York.
Reynolds, R. T., J. M. Scott, and R. A. Nussbaum. 1980. A variable circular-plot methodfor estimating bird numbers. Condor 82:309-313.
Robson, C. 2000. A guide to the birds of Southeast Asia. Princeton University Press,Princeton.
Safford, R. J. 1997. Distribution studies of the forest-living native passerines ofMauritius. Biological Conservation 80:189-198.
SAS Institute. 1990. SAS/STAT user’s guide. Version 6. Fourth edition. Volume 2. SASInstitute , Cary, North Carolina.
Savidge, J. A. 1986. The role of disease and predation in the decline of Guam’savifauna. Ph.D. dissertation, University of Illinois, Champaign.
Savidge, J. A. 1987. Extinction of an island forest avifauna by an introduced snake.Ecology 68:660-668.
Schowalter, T. D., J. W. Webb, and D. A. Crossley, Jr.. 1981. Community structure andnutrient content of canopy arthropods in clearcut and uncut forestecosystems. Ecology 62:1010-1019.
Sillet, T. S. 1994. Foraging ecology of epiphyte-searching insectivorous birds in CostaRica. Condor 96:863-877.

65
Skead, C. J., and G. A. Ranger. 1958. A contribution to the biology of the Cape provincewhite-eyes (Zosterops). Ibis 100:319-333.
Slikas, B., I. B. Jones, S. R. Derrickson, and R. C. Fleischer. 2000. Phylogeneticrelationships of Micronesian white-eyes based on mitochondrial sequencedata. Auk 117:355-365.
Stone, B. C. 1970. The flora of Guam. Micronesica 6:1-659.
Stresemann, E. 1931. Die Zosteropiden der indo-austalischen Region. Mitteilungen AusDem Zoologischen Museum in Berlin17:201-238.
van Riper, C. III, S. G. van Riper, M. L. Goff, and M. Laird. 1986. The epizootiology andecological significance of malaria in Hawaiian land birds. EcologicalMonographs 56:327-344.
van Riper, S. G. 2000. Japanese White-eye (Zosterops japonicus). In The Birds of NorthAmerica, No. 487 (A. Poole and F. Gill, Eds.). Birds of North America, Inc.,Philadelphia.
VanderWerf, E. A. 1993. Scales of habitat selection by foraging ‘elepaio in undisturbedand human-altered forests in Hawaii. Condor 95:980-989.
Warner, R. E. 1968. The role of introduced diseases in the extinction of the endemicHawiian avifauna. Condor 70:101-120.
Wilson, S. M., and J. Kikkawa. 1988. Post-fledging parental investment in the Capricornsilvereye. Emu 88:81-87.
Yamashina, Y. 1932. On a collection of birds' eggs from Micronesia. Tori 7:393-413.

66
Table 1. Correlations between habitat variables and the first three principal componentsextracted from data recorded at 20 Rota bridled white-eyes study sites on Rota, 1998 and1999.________________________________________________________________________
Component_________________________________Habitat variable I II III________________________________________________________________________Elaeocarpus joga density 0.33 0.71 0.12Pandanus tectorius density 0.71 -0.03 0.35Guettarda speciosa density -0.45 0.30 0.50Premna obtusifolia density 0.30 -0.21 -0.23Ficus tinctoria density 0.26 0.10 -0.76Ficus prolixa density 0.31 -0.14 0.27Hernandia labyrinthica density 0.53 0.67 0.28Total tree basal area -0.49 0.50 0.27Total tree density 0.69 -0.16 0.12Stem density 0.59 -0.40 0.55Canopy height -0.58 0.41 0.09Epiphyte density 0.17 0.66 -0.40Foliage volume (3-9m) -0.17 -0.27 -0.51Elevation 0.68 0.45 -0.39Percent of total variance 23 17 15Cumulative percent of variance 23 40 55________________________________________________________________________

67
Table 2. Nest dimensions of Rota, Saipan, and Tinian bridled white-eye nests recorded in the Commonwealth of the NorthernMariana Islands, 1999. Wilcoxon rank-sum tests were used to determine the difference between Rota and Saipan bridledwhite-eye nests.__________________________________________________________________________________________________
WilcoxonTinian Rota (n = 4) Saipan (n = 4) rank-sum______ __________________________ _________________________ ________
Nest Dimension (mm) (n = 1) Mean ± SE Median Range Mean ± SE Median Range Z P__________________________________________________________________________________________________Nest depth 35.0 27.8 ± 1.0 28.5 25.0 - 29.0 29.0 ± 0.8 29.0 27.0 - 31.0 15.0 0.44Inner diameter 39.1 45.9 ± 0.7 45.6 44.6 - 47.7 43.5 ± 1.8 43.9 39.3 - 47.0 21.0 0.47Outer diameter 67.0 59.0 ± 0.7 58.7 57.7 - 60.8 57.5 ± 1.9 57.4 53.0 - 62.3 21.0 0.47Total nest height 53.0 39.8 ± 1.0 39.5 36.0 - 44.0 46.8 ± 3.0 45.5 41.0 - 55.0 12.0 0.11Nest wall width 14.6 8.0 ± 0.4 8.2 7.0 - 8.8 9.3 ± 0.2 9.4 8.9 - 9.6 10.0 0.03__________________________________________________________________________________________________
Table 3. Nest site characteristics of Rota and Saipan bridled white-eye nests recorded on the islands of Rota and Saipan,CNMI, 1998 and 1999.__________________________________________________________________________________________________
WilcoxonRota Saipan rank-sum_____________________________ ____________________________ _________
Nest Site Characteristic n Mean ± SE Median Range n Mean ± SE Median Range Z P__________________________________________________________________________________________________Nest height (m) 18 8.3 ± 0.7 9.2 2.5 - 12.8 8 1.7 ± 0.2 1.5 1.2 - 2.6 37.5 <0.01Nest-bole distance (m) 17 3.1 ± 0.4 2.7 0.9 - 6.7 8 1.1 ± 0.2 1.0 0.5 - 1.7 50.0 <0.01Nest tree height (m) 16 10.3 ± 0.8 10.8 3.3 - 14.6 8 4.1 ± 0.5 4.0 1.5 - 6.3 44.0 <0.01Nest tree dbh (cm) 17 29.9 ± 40.2 291.0 23.0 - 602.0 7 3.8 ± 8.3 35.0 7.0 - 70.0 36.0 <0.01Distance from nestto top of tree (m) 16 2.2 ± 0.5 1.3 0.4 - 6.0 8 2.3 ± 0.5 2.1 0.1 - 5.1 113.0 0.44__________________________________________________________________________________________________

68
Table 4. Method used to produce a crude estimate of the Rota bridled white-eyepopulation size within five study regions on Rota in 1998 and 1999. ________________________________________________________________________
Actual Estimated area Mean (± SE)Study area surveyed represented abundance index Populationarea n (ha) (ha) (no./ha) estimate 95% CI________________________________________________________________________A 4 0.8 26.5 9.9 ± 1.8 262 111 - 413B 2 0.4 40.6 8.4 ± 1.9 341 0 - 1,320C 5 1.0 37.2 9.5 ± 3.5 353 0 - 714D 5 1.0 59.4 2.0 ± 0.5 119 36 - 202E 4 0.8 17.3 1.0 ± 0.8 17 0 - 61____
1092 Total________________________________________________________________________
Table 5. Mean habitat characteristics for Rota bridled white-eye foraging habitat use (n =32) and availability (n = 32). See text for description of habitat measurements. ________________________________________________________________________
Use Available___________ ___________
Habitat scale Habitat characteristic Meana SE Mean SE________________________________________________________________________Broad scale (400 m2)
Tree basal area (> 10 cm)(m2/ha) 32.6 3.0 31.5 2.6Total tree density (> 10 cm) (no./ha) 628 37.5 719 50.7Density by size class (no./ha)
10.0 - 19.9 cm 398 32.3 461 43.620.0 - 29.9 cm 125 15.6 142 15.9> 30 cm 105 12.3 118 13.8
Intermediate scale (3-m radius)
Foliage volume (%)0-3 m 12.8 1.0 13.4 1.23-9 m 13.1 1.1 10.8 1.19-15 m 4.4 0.9 3.0 0.6Canopy cover (%) 91 2.0 82 4.7
Fine scale (0.5-m radius)
Foliage volume (%) 31* 3.8 20* 3.5________________________________________________________________________a Means marked with an asterisk are different (Paired t-test, P < 0.10).
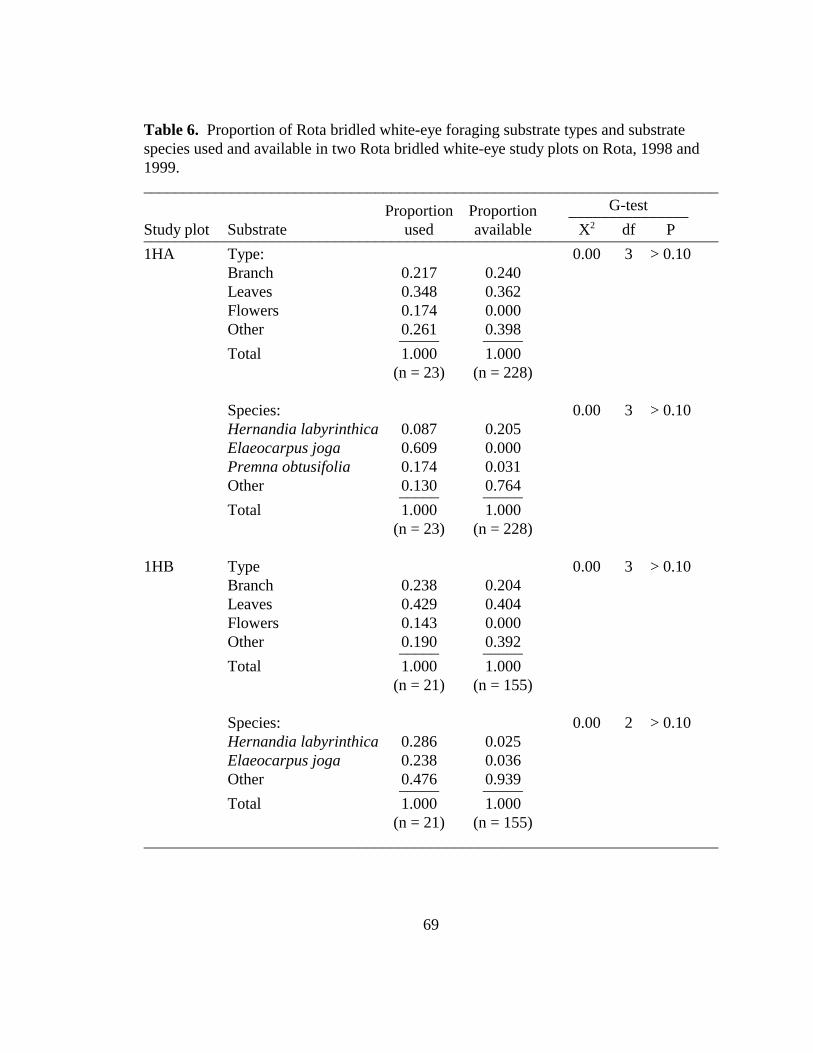
69
Table 6. Proportion of Rota bridled white-eye foraging substrate types and substratespecies used and available in two Rota bridled white-eye study plots on Rota, 1998 and1999.________________________________________________________________________
G-testProportion Proportion _______________Study plot Substrate used available X2 df P________________________________________________________________________1HA Type: 0.00 3 > 0.10
Branch 0.217 0.240Leaves 0.348 0.362Flowers 0.174 0.000Other 0.261 0.398_____ _____Total 1.000 1.000
(n = 23) (n = 228)
Species: 0.00 3 > 0.10Hernandia labyrinthica 0.087 0.205Elaeocarpus joga 0.609 0.000Premna obtusifolia 0.174 0.031Other 0.130 0.764_____ _____Total 1.000 1.000
(n = 23) (n = 228)
1HB Type 0.00 3 > 0.10Branch 0.238 0.204Leaves 0.429 0.404Flowers 0.143 0.000Other 0.190 0.392_____ _____Total 1.000 1.000
(n = 21) (n = 155)
Species: 0.00 2 > 0.10Hernandia labyrinthica 0.286 0.025Elaeocarpus joga 0.238 0.036Other 0.476 0.939_____ _____Total 1.000 1.000
(n = 21) (n = 155)________________________________________________________________________

70
Table 7. Mean density per hectare indices and frequency of birds detected over threesurvey periods in study plots designated high (> 2 white-eyes/ha) and low (< 2 white-eyes/ha) density Rota bridled white-eye areas by Fancy and Snetsinger (1996) on Rota,1998 and 1999.
High (n = 9) Low (n = 9)__________________ __________________
Bird species Frequency Meana SE Frequency Mean SE Rota bridled white-eye 9 9.8* 2.6 6 2.0* 0.8(Zosterops rotensis)
Black drongo 8 1.8 0.5 8 1.8 0.5(Dicrurus macrocercus)
Rufous fantail 9 7.0 0.8 9 5.2 0.5(Rhipidura rufifrons)
Micronesian honeyeater 9 2.6 0.5 8 1.7 0.4(Myzomela rubratra)
Micronesian starling 9 8.9 0.7 9 13.1 1.3(Aplonis opaca)
Mariana crow 1 0.1 0.1 4 0.3 0.1(Corvus kubaryi)
Collared kingfisher 7 2.2 0.5 8 1.8 0.4(Halcyon chloris)
Mariana fruit-dove 8 1.7 0.4 9 2.3 0.3(Ptilinopus roseicapilla)
White-throated ground-dove 6 1.0 0.4 5 0.5 0.2(Gallicolumba xanthonura)
Philippine turtle-dove 0 0.0 0.0 1 0.1 0.1(Streptopelia bitorquata)
Common fairy-tern 9 6.2 1.3 9 9.2 1.2(Gygis alba) a Means with an asterisk are different (Tukey test preceded by two-way ANOVA forspecies and density classification interaction, F = 6.73, df = 7, P < 0.01). Philippine turtle-dove and Mariana crow estimates were not tested because of low frequencies.

71
Table 8. Mean descriptive habitat characteristics for areas designated high (> 2 white-eyes/ha) and low (< 2 white-eyes/ha) density Rota bridled white-eye areas by Fancy andSnetsinger (1996) on Rota, 1998 and 1999. See text for descriptions of habitatmeasurements.________________________________________________________________________
High Low(n = 10) (n = 10)____________ ____________
Habitat Characteristic Mean SE Mean SE________________________________________________________________________
Total tree basal area (> 10 cm) (m2/ha) 31.17* 2.06 35.57* 2.97
Tree Density (> 10 cm) (no./ha) 665.8 51.7 625.4 68.0
Stem Density (< 10 cm) (no./ha) 4813 476 4663 474
Canopy Height (m) 12.1 0.6 12.1 0.6
Canopy Cover (%) 74 4 79 2
Epiphyte Density (no./ha) 0.109* 0.018 0.057* 0.017
Foliage Volume (3-9 m) (%) 9.8 1.4 15.7 5.4
Elevation (m) 386* 11 289* 19________________________________________________________________________a Means with an asterisk are different (Wilcoxon rank sum test, P < 0.10).

72
Table 9. Composition of woody flora (>10 cm dbh) per hectare within ten study plotsdesignated low (< 2 white-eyes/ha) and ten study plots designated high (> 2 white-eyes/ha) density Rota bridled white-eye areas by Fancy and Snetsinger (1996).
Frequencya Density Dominance
Species Low High Low High Low High Aglaia mariannensis 8 5 8.8 3.8 0.12 0.04Allophylus spp. 2 2 0.4 1.7 TRb 0.02Areca cathecu 0 1 0.0 0.8 0.00 0.01Artocarpus altilis 7 5 15.0 4.6 6.51 1.52Artocarpus mariannensis 1 1 0.4 0.8 0.20 0.01Bambusa vulgaris 0 1 0.0 1.7 0.00 0.01Barringtonia asiatica 3 3 15.8 3.3 0.98 0.14Cocos nucifera 0 1 0.0 0.8 0.00 0.03Cycas circinalis 1 0 0.4 0.0 0.01 0.00Cynometra ramiflora 1 0 7.5 0.0 0.27 0.00Dendrocnide latifolia 7 3 21.7 2.1 0.41 0.05Elaeocarpus joga 9 10 17.5 35.0 4.81 4.61Erythrina variegata 2 0 1.7 0.0 0.50 0.00Eugenia thompsonii 4 4 3.3 7.9 0.04 0.11Eugenia spp. 2 0 0.8 0.0 0.01 0.00Fagraea berteriana 2 3 1.7 4.2 0.06 0.16Ficus prolixa 10 5 12.1 11.3 0.74 0.32Ficus tinctoria 8 9 15.0 19.6 2.24 0.61Geniostoma micranthum 1 2 0.4 1.3 0.01 0.02Guamia mariannae 8 4 9.2 3.3 0.11 0.04Guettarda speciosa 9 7 17.1 18.7 0.42 0.78Hernandia labyrinthica 6 8 85.4 162.9 5.96 14.16Hernandia sonora 3 0 20.8 0.0 3.13 0.00Hibiscus tiliaceus 0 2 0.0 0.8 0.00 0.04Intsia bijuga 2 0 0.8 0.0 0.04 0.00Ixora triantha 1 2 0.4 0.8 TR 0.01Macaranga thompsonii 8 8 17.9 14.6 0.79 0.54Melanolepis multiglandulosa 2 0 2.1 0.0 0.02 0.00Merrilliodendron megacarpum 2 2 60.4 111.3 1.90 3.99Neisosperma oppositifolia 9 3 10.4 8.3 0.30 0.25Ochrosia mariannensis 2 0 3.3 0.0 0.06 0.00Pandanus dubius 9 4 45.0 17.5 0.62 0.22Pandanus tectorius 10 9 137.5 166.7 1.76 1.90Persea americana 0 1 0.0 4.6 0.00 0.17
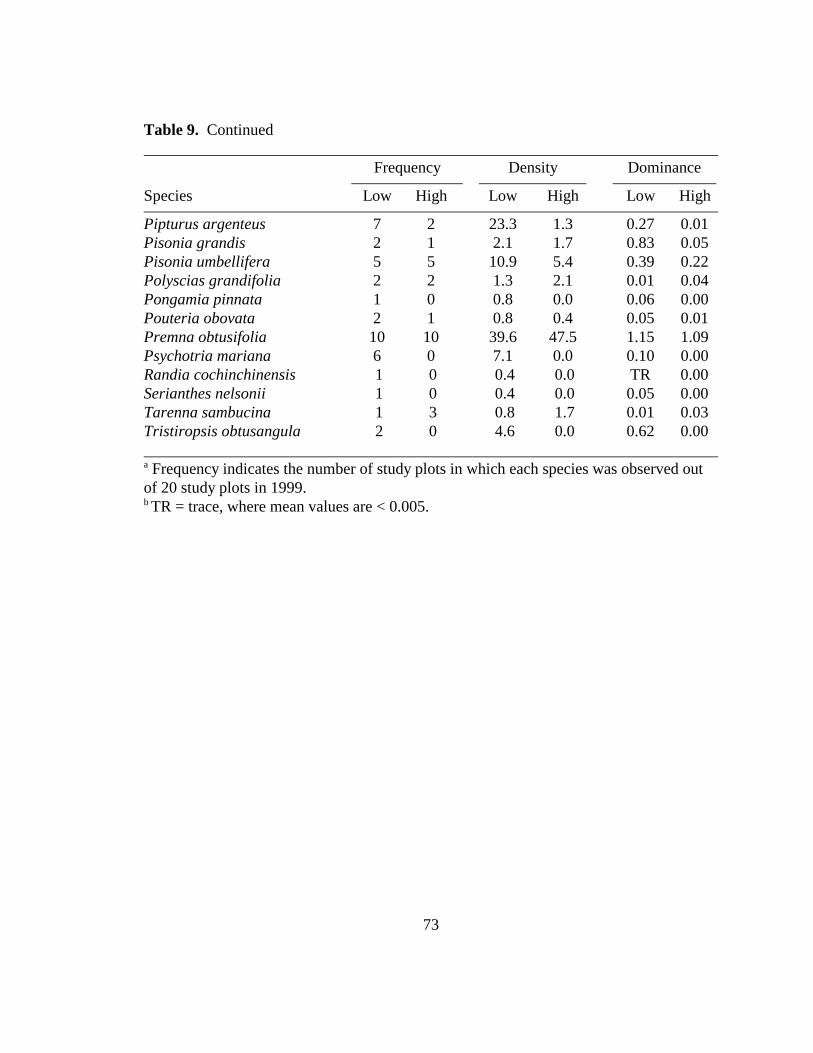
73
Table 9. Continued
Frequency Density Dominance
Species Low High Low High Low High Pipturus argenteus 7 2 23.3 1.3 0.27 0.01Pisonia grandis 2 1 2.1 1.7 0.83 0.05Pisonia umbellifera 5 5 10.9 5.4 0.39 0.22Polyscias grandifolia 2 2 1.3 2.1 0.01 0.04Pongamia pinnata 1 0 0.8 0.0 0.06 0.00Pouteria obovata 2 1 0.8 0.4 0.05 0.01Premna obtusifolia 10 10 39.6 47.5 1.15 1.09Psychotria mariana 6 0 7.1 0.0 0.10 0.00Randia cochinchinensis 1 0 0.4 0.0 TR 0.00Serianthes nelsonii 1 0 0.4 0.0 0.05 0.00Tarenna sambucina 1 3 0.8 1.7 0.01 0.03Tristiropsis obtusangula 2 0 4.6 0.0 0.62 0.00 a Frequency indicates the number of study plots in which each species was observed outof 20 study plots in 1999.b TR = trace, where mean values are < 0.005.

74
Table 10. Regression coefficients from stepwise multiple linear regression analyses forthree bird species occurring in Rota bridled white-eye study plots on Rota, 1998 and1999. Sample size for all regressions was 18.________________________________________________________________________
Dependent variable________________________________________________Rota bridled
white-eye Rufous fantail Black drongoIndependent variable (Zosterops rotensis) (Rhipidura rufifrons) (Dicrurus macrocercus)________________________________________________________________________Elaeocarpus joga density 0.101 0.053Pandanus tectorius density 0.003Ficus tinctoria densityFicus prolixa density -0.239Stem densityCanopy height -1.352 -0.295Epiphyte densityFoliage volume (3-9m) 99.918 45.324
Intercept 13.038 0.359 4.888R2 0.71 0.54 0.44F 7.92 8.75 5.80df 4 2 2P 0.002 0.003 0.014________________________________________________________________________
Table 11. Regression coefficients from stepwise multiple linear regression analysis forRota bridled white-eye abundance estimates on nine transects with 57 stations in theSabana region of Rota, 1999. Model was significant (P < 0.001) with an R2 of 0.57.________________________________________________________________________Independent variable Coefficient SE F P________________________________________________________________________Hernandia labyrinthica density 0.201 0.038 27.6 < 0.01Ficus spp. density -1.140 0.502 5.16 0.03Elatostema and Procris spp. index 0.418 0.121 11.9 < 0.01Intercept -0.074 0.155 0.2 0.63________________________________________________________________________

75
Table 12. Presence and absence of woody flora (>10 cm dbh) within five Rota bridledwhite-eye study areas on the Sabana and six Mariana crow study sites at various locationsaround the island of Rota, CNMI.
Rota Bridled White-eye Study Areas Mariana Crow Study Sites______________________________ _____________________
Species A B C D E 1 2 3 4 5 6 Aglaia mariannensis x x x x x x x x xAllophylus spp. x x xAreca cathecu xArtocarpus spp. x x x x x xBambusa vulgaris xBarringtonia asiatica x x x x x x x xCasuarina equisetifolia x xCitrus sp. xCocos nucifera x xCordia subcordata x xCycas circinalis x x x xCynometra ramiflora x x x xDendrocnide latifolia x x x x x x x xDrypetes dolichocarpa x x xElaeocarpus joga x x x x x x x xErythrina variegata x x xEugenia thompsonii x x x xEugenia spp. x xFagraea berteriana x x x xFicus spp. x x x x x x x x x xGeniostoma micranthum x xGuamia mariannae x x x x x x x xGuettarda speciosa x x x x x x x x x x xHernandia labyrinthica x x x x xHernandia sonora x x xHibiscus tiliaceus x x x x xIntsia bijuga x x x x x x xIxora triantha x x xMacaranga thompsonii x x x x x x x x x xMammea odorata x x xMaytenus thompsonii x x x x xMelanolepis multiglandulosa x x xMerrilliodendron megacarpum xMorinda citrifolia x

76
Table 12. Continued
Rota Bridled White-eye Study Areas Mariana Crow Study Sites____________________________ _____________________Species A B C D E 1 2 3 4 5 6 Neisosperma oppositifolia x x x x x x x x x xOchrosia mariannensis x x xPandanus spp. x x x x x x x x x x xPersea americana xPipturus argenteus x x x x x x x x xPisonia spp. x x x x x x x x xPolyscias grandifolia x x x x x xPongamia pinnata x xPouteria obovata x x x x x xPremna obtusifolia x x x x x x x x x x xPsychotria mariana x x x x x x x x xRandia cochinchinensis x xSerianthes nelsonii xTarenna sambucina x x xTournefortia argentea xTristiropsis obtusangula x x

77
Table 13. The five woody species (> 10 cm d.b.h.) in each of the twenty Rota bridled white-eye study plots with the highestbasal areas and densities on Rota, CNMI, 1998 and 1999.______________________________________________________________________________________________________Species 1HA 2HA 1LA 2LA 1HB 1LB 1HC 2HC 3HC 1LC 2LC 1HD 2HD 3HD 1LD 2LD 1HE 2HE 1LE 2LE______________________________________________________________________________________________________Artocarpus spp. x x x x x x x x xBarringtonia asiatica x xCynometra ramiflora xDendrocnide latifolia x xElaeocarpus joga x x x x x x x x x x x x x x x xErythrina variegata xFagraea berteriana xFicus spp. x x x x x x x x xGuettarda speciosa x x x x xHernandia labyrinthica x x x x x x x x x x x xHernandia sonora x xHibiscus tiliaceus xMacaranga thompsonii x x x x xMerrilliodendron megacarpum x x xPandanus spp. x x x x x x x x x x x x x xPersea americana xPipturus argenteus xPisonia spp. x x x xPremna obtusifolia x x x x x x x x x x xTristiropsis obtusangula x_________________________________________________________________________________________________________________________

78
Table 14. Pearson’s correlation coefficients for abundance estimates of six bird specieswithin 35-m radius sampling stations along transects on the Sabana region of Rota in1982 (n = 66) and 1994 (n = 136). ________________________________________________________________________Year Speciesa Black drongob Rota bridled white-eye Rufous fantail________________________________________________________________________1982
Black drongo 1.000Rota bridled white-eye -0.178 1.000Rufous fantail 0.247* 0.134 1.000Micronesian honeyeater 0.394* -0.115 0.169
1994Black drongo 1.000Rota bridled white-eye 0.149* 1.000Rufous fantail 0.104 0.106 1.000Micronesian honeyeater 0.146* 0.091 0.504*________________________________________________________________________
a Black drongo (Dicrurus macrocercus), Rota bridled white-eye (Zosterops rotensis),rufous fantail (Rhipidura rufifrons), and Micronesian honeyeater (Myzomela rubratra).b An asterisk indicates a relationship between the two bird species (P < 0.10).
Table 15. Mean black drongo detection per transect estimates for the Sinapalo, Sabana,and intermediate regions of Rota in 1982, 1995, and 1998.________________________________________________________________________
Sabana Intermediate Sinapalo Kruskal-Wallis______________ ______________ ______________ __________Year n Mean ± SEa n Mean ± SE n Mean ± SE H P________________________________________________________________________1982 4 0.26 ± 0.10A 5 0.60 ± 0.16B 5 0.68 ± 0.07B 4.56 0.101995 4 0.19 ± 0.09A 7 0.81 ± 0.17B 6 0.90 ± 0.21C 6.66 0.041998 4 0.45 ± 0.28A 7 1.93 ± 0.42B 6 1.16 ± 0.28B 6.28 0.04________________________________________________________________________a Regions with the same letter are not different (Bonferroni Joint Ranking P< 0.10).

79
Table 16. Number of rats captured in 40 snaptraps in Rota bridled white-eye and fourMariana crow study areas in April 1999 on Rota, CNMI.________________________________________________________________________
Rats/Trap-nightNumber of Actual Potential _______________Study Area Rats Captured Trap-nightsa Trap-nightsb Actual Potentialc________________________________________________________________________Rota Bridled White-eye 31 68 200 0.456 0.155ABMochong 32 72 200 0.582 0.160ARail-release 49 99 200 0.495 0.245BGolf Course 23 72 200 0.319 0.115ABPalii 13 29 200 0.448 0.065A________________________________________________________________________a Number of trap-nights excluding traps that were missing, unbaited, or were tripped anddid not contain rats when checked.b Number of trap-nights including all traps that were missing, unbaited, or were trippedand did not contain rats when checked.c Areas with same letter are not different (Tukey test preceded by one-way ANOVA, F =5.61, df = 4, P < 0.01).
Table 17. Approximate duration (days) of incubation period, nestling stage, andfledgling stage for four white-eye species (Zosteropidae).________________________________________________________________________Species Incubation Nestling stage Fledgling stage________________________________________________________________________Rota bridled white-eyea 8 - 12 10 - 12 > 8(Zosterops rotensis)
Green-bellied white-eyeb 11 - 12 10 - 12 -(Z. virens)
Heron Island white-eyec 12 - 14 12 - 14 14(Z. lateralis chlorocephala)
Japanese white-eyedef 11 10 - 12 15 - 20(Z. japonicus)________________________________________________________________________a This studyb Broekhuysen and Winterbottom (1968)c Kikkawa and Wilson (1983)d Brazil (1991)e Isobe (1997)f van Riper (2000)
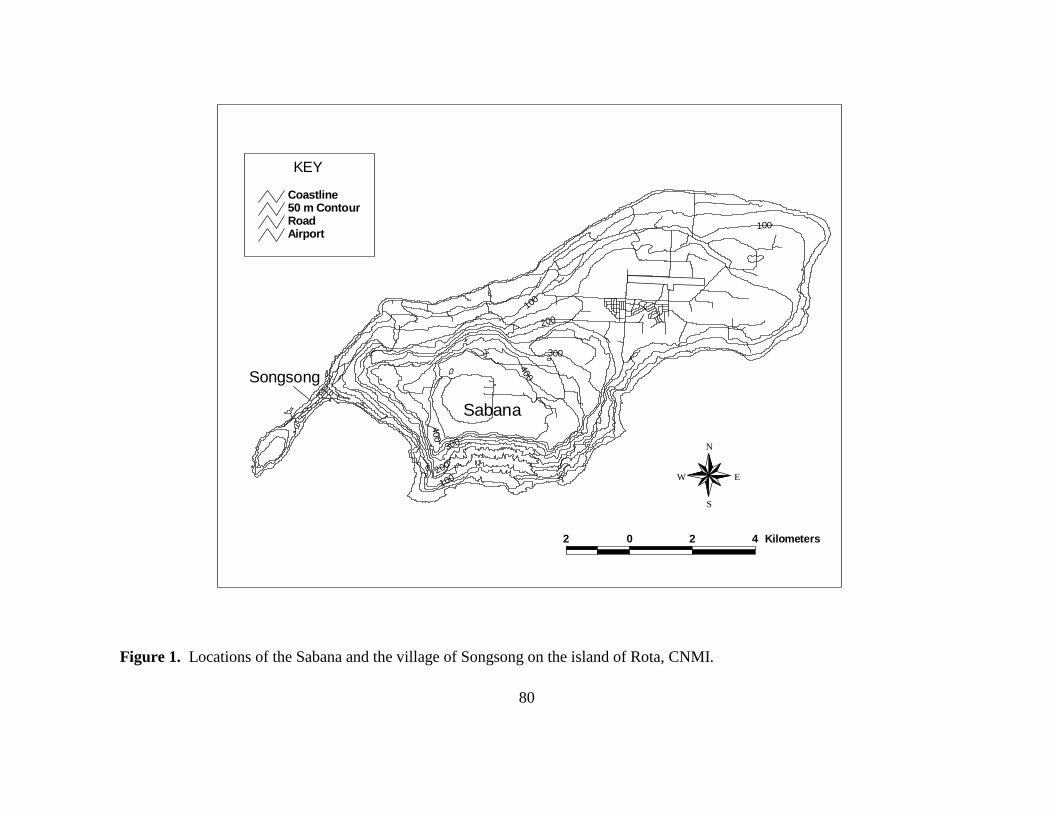
80
100
200
100
300
400
400
300
200
100
Sabana
Songsong
AirportRoad50 m ContourCoastline
2 0 2 4 Kilometers
N
EW
S
KEY
Figure 1. Locations of the Sabana and the village of Songsong on the island of Rota, CNMI.

81
1996 White-eye DensitiesHighLowVery Low
AirportRoad50 m ContourCoastline
2 0 2 4 Kilometers
N
EW
S
KEY
Figure 2. Locations of areas designated high and low density Rota bridled white-eye areas by Fancy and Snetsinger (1996).

82
��
�
�
�
�
�
��
�
�
���
�
�
�
�
�
�
1HA
2HA1LA
2LA
1HE
1LE
2LE
2HE3HD
1HD1LD
2LD
2HD
2LC 1LC 1HC2HC
3HC1HB
1LB
Study Area B
Study Area C
Study Area A
Study Area E
Study Area D
� Rota Bridled White-eye Study PlotAirportRoad50 m ContourCoastline
2 0 2 4 Kilometers
N
EW
S
KEY
Figure 3. Locations of Rota bridled white-eye study areas and study plots on the island of Rota, CNMI.

83
Study Site 1: Lalayak Study Site 2: Mochong
Study Site 3: Golf Course
Study Site 5: Rail-Release
Study Site 6: Palii
Study Site 4: Duge
Mariana Crow Study SitesAirportRoad50 m ContourCoastline
2 0 2 Kilometers
N
EW
S
KEY
Figure 4. Locations of Mariana crow study sites on the island of Rota, CNMI.
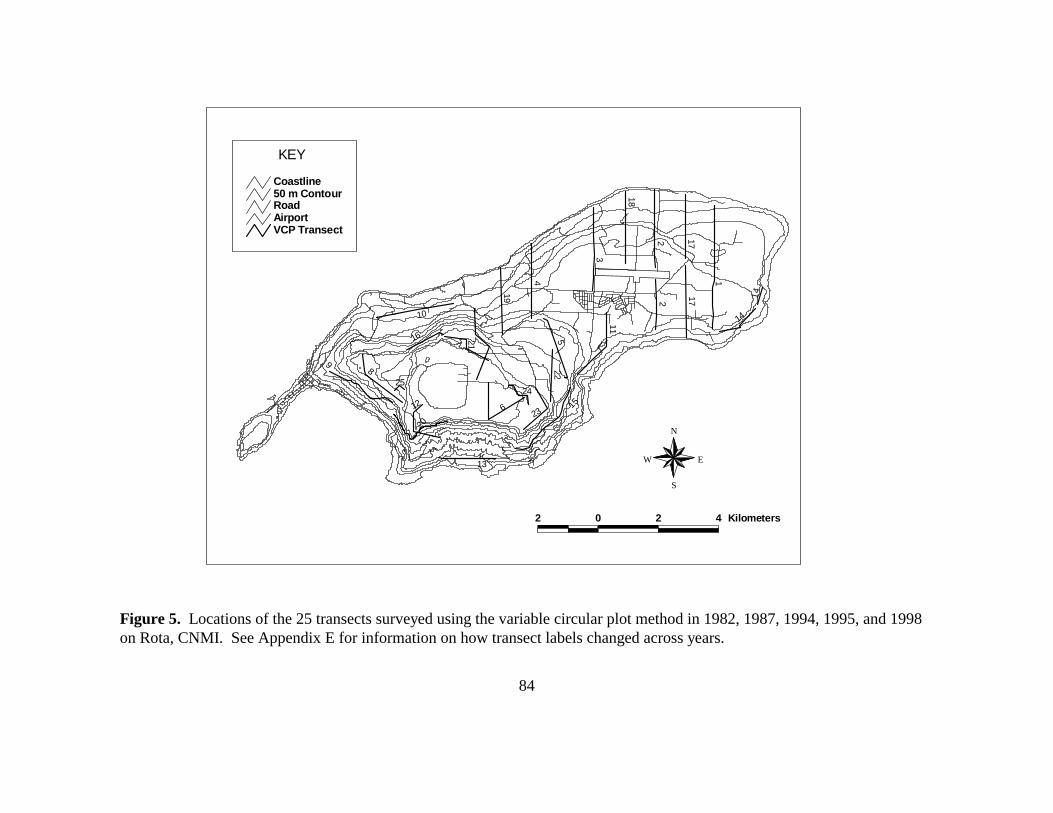
84
15
19
1717
18
16
14
20
9
14
1
22
3
4
5
10
8
13
12 6
7
23
22
21
2425
11
VCP TransectAirportRoad50 m ContourCoastline
2 0 2 4 Kilometers
N
EW
S
KEY
Figure 5. Locations of the 25 transects surveyed using the variable circular plot method in 1982, 1987, 1994, 1995, and 1998on Rota, CNMI. See Appendix E for information on how transect labels changed across years.

85
15
19
1717
18
16
14
20
9
141
22
3
4
5
10
8
13
12 6
7
23
22
21
2425
11
Sabana
Sinapalo
VCP TransectAirportRoad50 m ContourCoastline
2 0 2 4 Kilometers
N
EW
S
KEY
Figure 6. Locations of variable circular plot transects considered part of the Sabana, Sinapalo, and intermediate (areas notincluded in Sabana and Sinapalo regions) regions of Rota, CNMI.

86
Figure 7. Monthly rainfall levels (inches) recorded at the Rota Airport on the island ofRota, CNMI in 1998 and 1999. Data from the NOAA webpage for the Rota Airport (seetext for details).
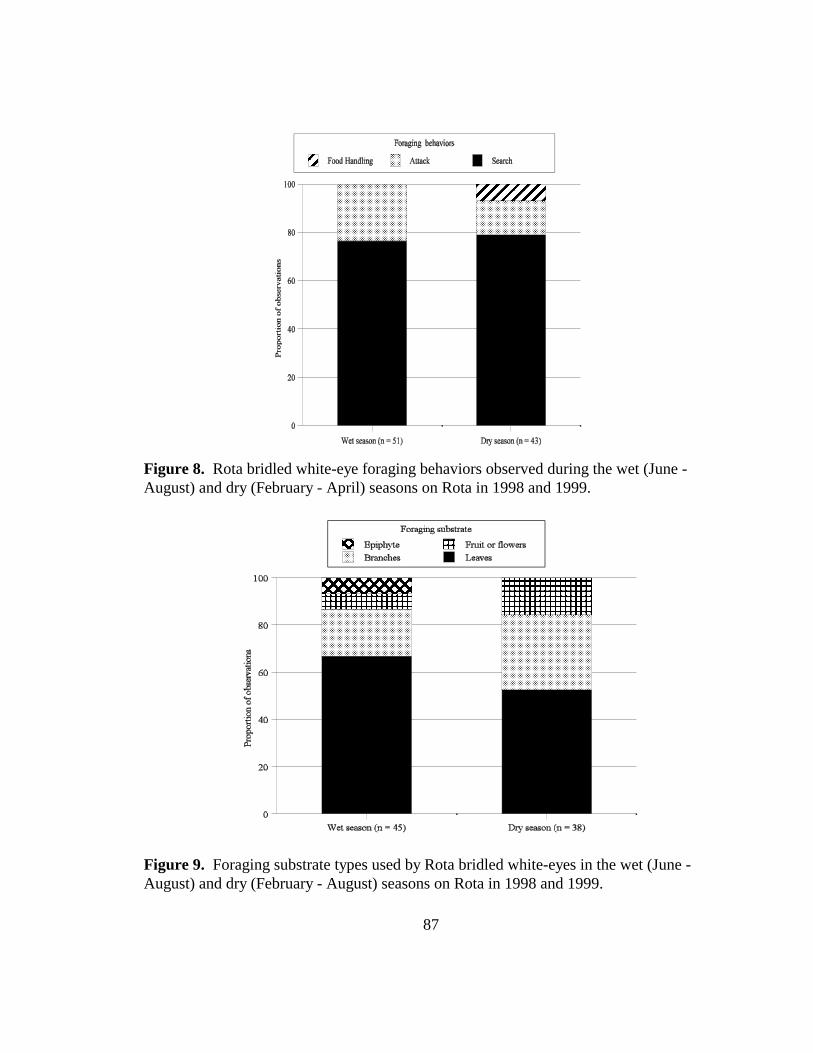
87
Figure 8. Rota bridled white-eye foraging behaviors observed during the wet (June -August) and dry (February - April) seasons on Rota in 1998 and 1999.
Figure 9. Foraging substrate types used by Rota bridled white-eyes in the wet (June -August) and dry (February - August) seasons on Rota in 1998 and 1999.

88
Figure 10. Tree species used for foraging by Rota bridled white-eyes in the wet (June -August) and dry (February - April) seasons on Rota in 1998 and 1999.
Figure 11. Perch diameters used by foraging Rota bridled white-eyes during the wet(June - August) and dry (February - April) seasons on Rota in 1998 and 1999.

89
Figure 12. Foraging locations of Rota bridled white-eyes observed during the wet (June -August) and dry (February - April) seasons on Rota in 1998 and 1999.
Figure 13. Foraging heights used by Rota bridled white-eyes during the wet (June -August) and dry (February - April) seasons on Rota in 1998 and 1999.

90
Figure 14. Foraging methods used by Rota bridled white-eyes on Rota in 1998 and 1999and Saipan bridled white-eyes on Saipan (Craig 1989,1990), CNMI.
Figure 15. Perch sizes used by foraging Rota bridled white-eyes on Rota in 1998 and1999 and Saipan bridled white-eyes on Saipan (Craig 1989,1990), CNMI.

91
Figure 16. Foraging substrates used by Rota bridled white-eyes on Rota in 1998 and1999 and Saipan bridled white-eyes on Saipan (Craig 1989,1990), CNMI.
Figure 17. Rota bridled white-eye non-foraging behaviors recorded in the wet (June -August) and dry (February - April) seasons on Rota in 1998 and 1999.
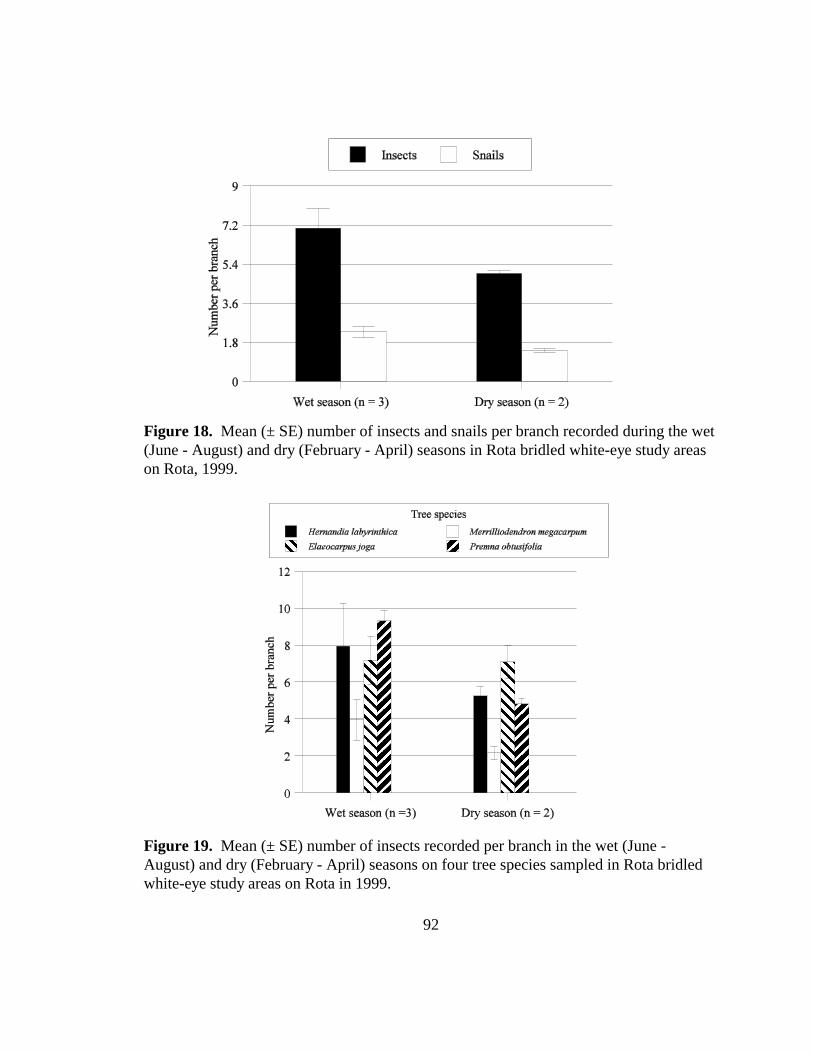
92
Figure 18. Mean (± SE) number of insects and snails per branch recorded during the wet(June - August) and dry (February - April) seasons in Rota bridled white-eye study areason Rota, 1999.
Figure 19. Mean (± SE) number of insects recorded per branch in the wet (June -August) and dry (February - April) seasons on four tree species sampled in Rota bridledwhite-eye study areas on Rota in 1999.

93
Figure 20. Mean (± SE) number of snails recorded per branch in the wet (June - August)and dry (February - April) seasons on four tree species sampled in Rota bridled white-eyestudy areas on Rota in 1999.
Figure 21. Difference in the percentage of trees fruiting or flowering between the wet(June - August) and dry (February - April) seasons in five Rota bridled white-eye studyareas on Rota in 1999

94
Figure 22. Difference in percentage of selected tree species fruiting and floweringbetween the wet (June - August) and dry (February - April) seasons in five Rota bridledwhite-eye study areas on Rota in 1999.
Figure 23. Mean (± SE) abundance per hectare indices of six bird species in Rota bridledwhite-eye study plots in three survey periods on Rota, 1998 and 1999.

95
Transect 5
Transect 9
Transect 1
Transect 6
Transect 7
Transect 4 Transect 3
Transect 2
Transect 8
AirportRoad50 m ContourCoastline
2 0 2 4 Kilometers
N
EW
S
KEY
Figure 24. Locations of transects surveyed on the Sabana in April 1999 on Rota, CNMI.

96
Transect 2
Transect 1
Transect 3
AirportRoad50 m ContourCoastline
2 0 2 4 Kilometers
N
EW
S
KEY
Figure 25. Locations of upper and lower elevation insect biomass transects sampled in July 1999 on Rota, CNMI.

97
Figure 26. Mean milligrams of eight insect orders per gram of plant mass between upper(380-450 m) and lower (150-250 m) elevations in mature Elaeocarpus joga trees alongthree transects on Rota in July 1999.
Figure 27. Mean number of insects in six families sampled at upper (380-450 m) andlower (150-250 m) elevations in mature Elaeocarpus joga trees along three transects onRota in July 1999.

98
Figure 28. Mean (± SE) number of snails and insects per branch sampled at three high (>2.5 white-eyes) and three low (< 1.0 white-eye) abundance Rota bridled white-eye studyplots on Rota in 1999.
Figure 29. Mean (± SE) milligrams of insects per gram of plant mass and mean numberof snails per gram of plant mass sampled at upper (380-450 m) and lower (150-250 m)elevations in mature Elaeocarpus joga trees along three transects on Rota in July 1999.

99
Exterior (n = 11) Interior (n = 7)
0
0.5
1
1.5
2
2.5
3
3.5
Wet season 1998 Dry season 1999 Wet season 1999
Figure 30. Mean (± SE) abundance estimates of six bird species recorded along fourtransects on the Sabana in 1982 (Engbring et al. 1986) and 1994 (USFWS, unpubl. data)on Rota, CNMI. An asterisk by the species indicates a difference between years (T-test, P< 0.10).
Figure 31. Mean (± SE) black drongo abundance indices in exterior (< 150 m from edge)and interior (> 150 m from edge) Rota bridled white-eye study plots in three surveyperiods on Rota in 1998 and 1999.

100
Figure 32. Stomach contents of female and male rats (Rattus tanezumi) trapped on Rotabridled white-eye study sites in April 1999 on Rota, CNMI.

101
Appendix A. GPS locations of the Rota bridled white-eye study plots on Rota, CNMI in1998 and 1999.
Plot Corner Easting Northing Elevation (m) Error (m)
1HA 1 0307115 1563347 396 12.0
2 0307194 1563414 375 15.0
3 0307250 1563337 370 13.0
1HB 2 0304848 1564837 450 7.1
4 0304755 1564743 464 9.3
1HC 2 0302878 1564939 410 6.3
3 0302826 1565008 352 17.0
1HD 1 0303841 1562444 305 8.2
4 0303814 1562515 355 8.2
1HE 1 0306594 1562195 332 8.7
2 0306585 1562295 370 9.7
4 0306680 1562212 304 8.0
1LA 2 0307545 1563735 323 8.9
3 0307492 1563794 371 11.0
4 0307414 1563746 318 8.9
1LB 4 0304401 1565362 398 14.0
1LC 1 0302556 1565067 257 11.0
1LE 3 0307093 1562317 219 8.0
4 0307011 1562308 231 7.8
2HA 2 0306944 1563587 390 12.0
3 0306862 1563646 391 16.0
2HC 2 0303272 1565124 391 13.0
3 0303201 1565188 375 7.5

102
Appendix A. Continued.
Plot Corner Easting Northing Elevation (m) Error (m)
2HD 1 0302783 1562531 413 7.9
2 0302868 1562531 429 9.0
3 0302881 1562621 455 16.0
4 0302782 1562631 411 7.7
2HE 1 0306196 1562314 399 12.0
2LA 2 0307398 1563080 282 27.0
3 0307470 1563021 281 13.0
4 0307533 1563083 253 8.4
2LC 4 0302177 1565685 178 8.2
2LD 2 0302933 1561974 283 8.8
3 0302996 1562048 288 9.1
2LE 1 0307059 1562559 321 7.9
4 0307108 1562485 285 9.4
3HC 2 0303176 1565475 329 11.0
3 0303129 1565498 211 12.0
4 0303208 156563 211 14.0
3HD 3 0304656 1562629 455 16.0

103
�
�
�
�
�
�
�
� �
�
�
�
�
�
�
�
�
�
�
�
��
� �
��
�
�
�
���
��
�
��
�
��
�
�
��
���
���
� �
�
�
��
���
�
� �
��
�
���
���
��
�
�
� ����
1HA
1
1
1
1
12
3
4
23
4
23
4
43
2
23
4
1 24 3
1
2
4
312
34
1
2 3
412
3 4
1
2 3
4
12
34
1 2
34
4 1
3 2
12
43
34
21
3
21
4
34
12
3 4
2 1
3 4
12
2HA
1LA
2LA2LE
1LE
1HE2HE
3HD1HD
1LD
2HD
2LD
1HB
1LB3HC
2HC
1HC
1LC
2LC
AirportRoad50 m ContourCoastline
� Study Plot Point Count Station Dropped� Study Plot Point Count Station
1 0 1 Kilometers
N
EW
SKEY
Appendix B. Locations of study plot point count stations on Rota, CNMI during 1998 and 1999. All point count stationsmarked with a square were not included in estimates of bird abundance.

104
Appendix C. Program Distance (Laake et al. 1998) estimates of effective detection radiiof 11 bird species recorded in Rota bridled white-eye study plots in 1998 and 1999.________________________________________________________________________
Number Effective detectionBird Species observed radius (m) 95% CI________________________________________________________________________Collared kingfisher 617 74.4 67.8 - 81.6(Halcyon chloris)
Common fairy tern 842 32.3 30.5 - 34.3(Gygis alba)
Mariana crow 64 76.6 70.1 - 83.7(Corvus kubaryi)
Mariana fruit-dove 826 66.3 63.3 - 70.4(Ptilinopus roseicapilla)
Micronesian honeyeater 254 34.7 32.6 - 37.0(Myzomela rubratra)
Micronesian starling 2018 33.0 32.2 - 33.7(Aplonis opaca)
Philippine turtle-dove 21 90.8 74.6 - 110.6(Streptopelia bitorquata)
Rota bridled white-eye 1215 25.5 23.5 - 27.6(Zosterops rotensis)
Rufous fantail 877 33.0 31.7 - 34.3(Rhipidura rufifrons)
White-throated ground-dove 61 31.0 26.8 - 35.8(Gallicolumba xanthonura)________________________________________________________________________

105
Appendix D. Program Distance (Laake et al. 1998) estimates of effective detectionradius (EDR) in meters for three point count stations in 20 Rota bridled white-eye studyplots on Rota in 1998 and 1999.________________________________________________________________________
Station A Station B Station C_______________ _______________ _______________Study plot n EDR 95% CI EDR 95% CI EDR 95% CI________________________________________________________________________1HA 11 48.2 44.8 - 51.8 42.1 38.5 - 46.1 46.2 43.5 - 49.12HA 10 34.2 30.9 - 37.8 29.2 26.8 - 31.9 20.4 18.0 - 23.01LA 10 30.3 26.5 - 34.8 48.9 45.6 - 52.4 30.0 26.9 - 33.32LA 11 48.9 45.7 - 52.4 44.5 42.4 - 46.8 38.7 35.2 - 42.41HB 9 44.1 35.1 - 55.5 46.7 44.2 - 49.5 46.4 43.6 - 49.51LB 9 39.6 35.4 - 44.3 47.4 42.6 - 52.7 48.5 45.2 - 52.11HC 10 31.3 27.3 - 35.9 24.6 21.2 - 28.4 30.1 28.1 - 32.22HC 11 33.7 31.8 - 35.8 35.2 33.2 - 37.4 36.9 33.7 - 40.53HC 6 58.8 37.3 - 92.7 49.7 43.9 - 56.2 49.0 45.1 - 53.31LC 11 42.3 39.1 - 45.8 44.1 41.5 - 46.9 32.0 29.5 - 34.82LC 11 32.6 30.2 - 35.2 33.1 30.6 - 35.7 39.4 33.2 - 46.71HD 10 36.5 34.3 - 38.8 43.9 40.1 - 48.0 36.9 34.5 - 39.42HD 9 36.2 32.6 - 40.2 39.0 36.0 - 42.2 40.8 36.8 - 45.33HD 6 36.8 34.0 - 39.8 57.7 37.4 - 89.0 37.1 32.1 - 42.91LD 10 39.0 32.2 - 47.2 37.9 35.1 - 40.9 30.8 27.8 - 34.22LD 9 40.7 36.4 - 45.7 48.5 43.8 - 54.2 25.3 20.7 - 31.11HE 9 56.7 52.1 - 61.7 61.4 46.9 - 80.4 48.8 44.7 - 53.32HE 9 46.8 44.2 - 49.5 46.0 40.6 - 52.2 48.0 45.0 - 51.11LE 9 39.4 36.9 - 42.0 47.8 44.2 - 51.7 33.6 30.2 - 37.42LE 9 38.7 36.1 - 41.6 38.5 34.6 - 42.8 31.1 28.0 - 34.5________________________________________________________________________

106
Appendix E. Number of stations and observers for each transect sampled using variable circular plot counts of birds in fivesurvey periods on Rota, CNMI. See Figure 5 for locations of transects.
TransectMarch - April 1982 April 1987a May 1994b October - November 1995 October - November 1998
Stations Observers Stations Observers Stations Observers Stations Observers Stations Observers
1 28 2 - - - - 29 1 29 1
2 30 2 - - - - 30 1 29 1
3 19 2 - - - - 18 1 18 1
4 17 2 15 2 - - 17 1 18 1
5 17 2 16 2 - - 17 1 17 1
6 18 2 7 2 18 2 - - - -
7 19 2 3 2 20 2 - - - -
8 15 2 14 2 15 2 14 1 14 1
9 17 2 11 2 - - 17 1 17 1
10 18 2 - - - - 18 1 18 1
11 16 2 - - - - 14 1 14 1
12 14 2 - - 14 2 - - - -
13 16 2 - - 15 2 13 1 15 1
14 10 2 - - - - 15 1 15 1
15 - - - - - - 12 1 13 1
16 - - 10 2 10 2 10 1 10 1
17 - - - - - - 32 1 32 1

107
Appendix E. Continued.
TransectMarch - April 1982 April 1987 May 1994 October - November 1995 October - November 1998
Stations Observers Stations Observers Stations Observers Stations Observers Stations Observers
18 - - - - - - 17 1 17 1
19 - - - - - - 16 1 16 1
20 - - - - 20 2 18 1 19 1
21 - - - - 14 2 - - - -
22 - - - - 13 2 - - - -
23 - - - - 6 1 - - - -
24 - - - - 11 2 - - - -
25 - - - - 5 1 - - - -a In 1987, transects 6 and 7 were sampled as one transect (transect 6) and transect 16 was labeled transect 15. See Engbring (1987) for more details.b In 1994, data collected from transects 16, 21, 22, 23, 24, and 25 were recorded as transects 22, 15, 16, 17, 18, and 19 respectively.

108
Appendix F. Program Distance (Laake et al. 1998) estimates of effective detectionradius (EDR) in meters for six bird species during 1982 and 1994 surveys on Rota,CNMI.
Species1982 1994
n EDR (+ SE) n EDR (+ SE)
Black drongo(Dicrurus macrocercus)
471 103.3 + 3.8 384 60.5 + 5.2
Collared kingfisher(Halcyon chloris)
464 164.7 + 3.5 524 81.5 + 8.4
Micronesian honeyeater(Myzomela rubratra)
509 60.2 + 2.0 426 34.2 + 0.7
Micronesian starling(Aplonis opaca)
488 71.6 + 3.0 903 41.6 + 0.7
Rota bridled white-eye(Zosterops rotensis)
92 38.1 + 1.8 119 35.2 + 13.8
Rufous fantail(Rhipidura rufifrons)
449 56.5 + 2.5 361 38.6 + 4.0

109
�
��
�
�
�����
��
����
�
�
��
� Rota Bridled White-eye NestAirportRoad50 m ContourCoastline
2 0 2 4 Kilometers
N
EW
S
KEY
Appendix G. Locations of Rota bridled white-eye nests found in 1997, 1998, and 1999 on Rota, CNMI.

110
Appendix H. Nest discovery dates, fledging dates, and approximate durations of theincubation and nestling stages for all known Rota bridled white-eye nests discovered asactive nests on Rota, CNMI.________________________________________________________________________
Approximate Incubation Approximate NestlingNest Discovery Fledging Stage Duration Stage DurationNumber Date Date (Days) (Days)________________________________________________________________________Y32a 3/7/32 ? ? ?P84b 5/19/84 ? ? ?L93c 6/9/93 ? ? ?197 12/3/97 ? ? ?199 3/01/99 ? ? ?299 3/31/99 4/22/99 ? 10-12399 3/3/99 3/18/99 ? 10499 3/5/99 4/3/99 9 8-101199 5/26/99 5/31/99 ? > 51299 5/26/99 6/19/99 8-10 101599 7/6/99 7/16/99 ? 101699 7/6/99 NA 10-12 Predated________________________________________________________________________a Yamashina (1932).b Pratt (1985).c Lusk and Taisacan (1997).

111
Appendix I. Banding and resighting information on nine Rota bridled white-eyes banded in 1998 and 1999 on Rota, CNMI.
Band
number
Color band placementa
Sex Ageb
Banded Last observed
Left RightDate Location Date Location
Top Bottom Top Bottom
190083183 red USFWS white red ? AF 98/08/09 Plot 1HA - -
190083186 white blue USFWS red ? AF 99/03/24 Plot 1HA 99/05/20 Plot 1HA: near banding site
190083187 - red - USFWS ? AF 99/05/12 Plot 1HA - -
190083188 - blue - USFWS ? AF 99/05/14 Plot 1HA 99/05/20 Plot 1HA: near banding site
190083189 - green - USFWS ? AF 99/05/19 Plot 1HA - -
190083191 - white - USFWS ? AF 99/05/19 Plot 1HA 99/05/20 Plot 1HA: near banding site
190083192 blue red blue USFWS ? AF 99/06/29 Plot 1HB 00/05/17 Plot 1HB
190083193 green white USFWS white ? AF 99/06/29 Plot 1HB - -
190083194 red blue red USFWS ? Nestling 99/07/14 Plot 1HC 99/07/23 Plot 1HC: near nest sitea USFWS = aluminum U.S. Fish and Wildlife Service band.b AF = after fledging. Bird had complete eyerings.
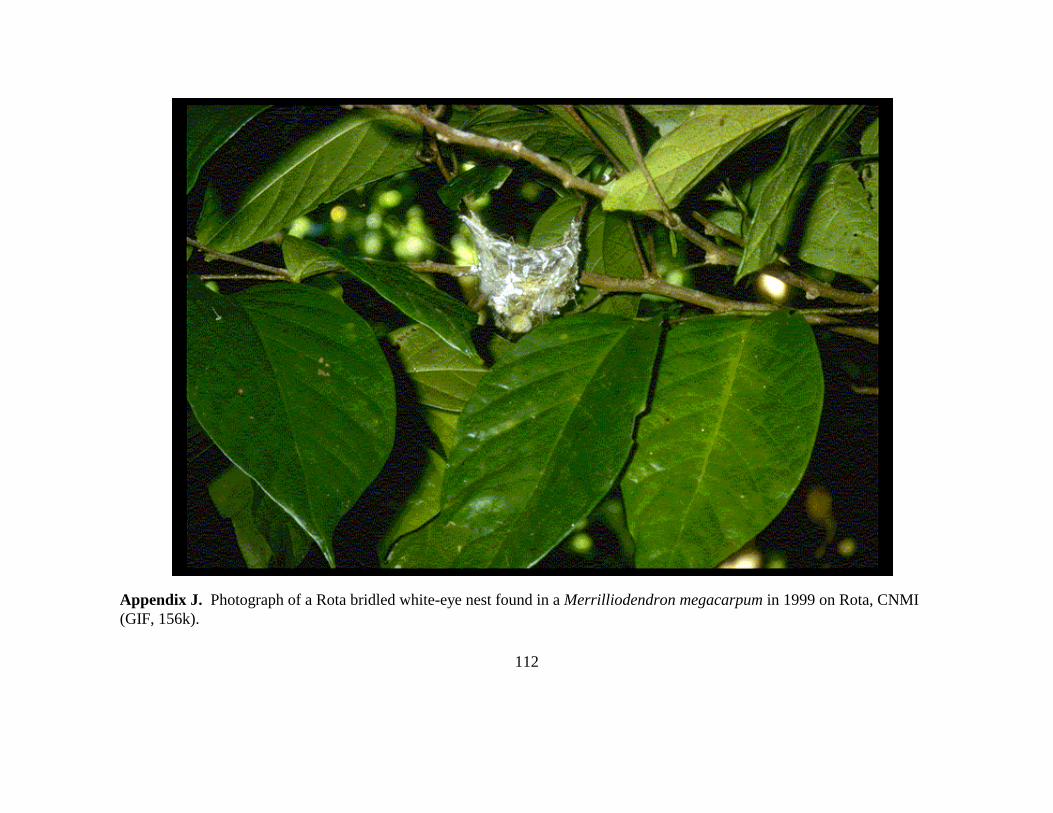
112
Appendix J. Photograph of a Rota bridled white-eye nest found in a Merrilliodendron megacarpum in 1999 on Rota, CNMI(GIF, 156k).

113
Appendix K. Average number of insects and snails recorded per branch during six sampling periods in Rota bridled white-eyestudy plots on the island of Rota, CNMI in 1999.
Order15 April(n = 35)
29 April(n = 35)
17 May(n = 32)
01 June(n = 32)
16 June(n = 32)
10 July(n = 40)
26 July(n = 32)
Araneida 0.74 0.34 0.47 0.59 0.34 0.45 1.06
Hymenoptera 2.83 2.60 1.66 2.97 2.16 1.70 2.53
Hemiptera 0.03 0 0.06 0.03 0 0 0
Homoptera 0.89 0.34 0.94 2.72 3.38 0.95 1.16
Orthoptera 0.14 0.17 0.03 0.13 0.06 0.25 0.13
Diptera 0.14 0.17 0.19 0.31 0.19 0.50 0.28
Coleoptera 0.14 0.31 0.34 0.31 0.25 0.20 0.53
Lepidoptera (Larvae)
0.14 0.20 0.13 0.31 0.19 0.18 0.13
Lepidoptera (Adult)
0 0 0.07 0.03 0 0.08 0.19
Unknown 0.06 0.69 0.75 1.59 1.28 0.95 2.09
Total Insect 5.11 4.83 4.63 9.00 7.84 5.25 8.09
Snail 1.49 1.34 1.88 1.50 2.78 2.10 1.97

114
Appendix L. Percentage of five study areas containing fruiting (S) or flowering (F)members of 22 woody plant species over 12 two-week periods on Rota, CNMI in 1999.
SpeciesFeb. 7-20 Feb. 21-Mar. 6 Mar. 6-20
F S F S F S
Aglaia mariannensis ABCDE 20% 0% 80% 0% 100% 0%
Artocarpus atilisACDE 0% 20% 20% 40% 20% 40%
Barringtonia asiatica ACDE 20% 0% 20% 20% 60% 60%
Carica papaya BC 0% 0% 0% 20% 20% 20%
Dendrocnide latifoliaABCDE 40% 0% 20% 0% 60% 0%
Discocalyx megacarpaACDE 20% 0% 20% 40% 0% 80%
Elaeocarpus jogaABCDE 0% 0% 0% 60% 80% 20%
Eugenia thompsoniiABDE 40% 20% 80% 20% 40% 0%
Guamia mariannae 20% 20% 40% 40% 20% 20%
Guettarda speciosaACDE 0% 0% 0% 0% 20% 0%
Hernandia labyrinthicaABCDE 40% 40% 60% 60% 60% 60%
Hibiscus tiliaceus 0% 0% 20% 0% 0% 0%
Leucaena leucocephalaB 0% 20% 20% 20% 40% 40%
Macaranga thompsoniiABCDE 0% 0% 0% 0% 100% 100%
Melanolepis multiglandulosaACDE 0% 20% 0% 0% 40% 0%
Merrilliodendron megacarpumC 0% 0% 0% 0% 0% 0%
Neisosperma oppositifoliaABCDE 20% 50% 40% 60% 60% 80%
Pandanus dubiusABCDE 0% 20% 0% 60% 0% 60%
Pandanus tectoriusABCDE 0% 60% 20% 100% 40% 100%
Persea americanaC 40% 0% 40% 20% 40% 40%
Pipturus argenteusABCDE 40% 0% 80% 0% 100% 0%
Premna obtusifoliaABCDE 20% 0% 60% 0% 100% 0%

115
Appendix L. Continued.
SpeciesMar. 21-Apr. 3 Apr. 4-17 Apr. 18-May 1
F S F S F S
Aglaia mariannensis 20% 0% 0% 0% 20% 20%
Artocarpus atilis 0% 0% 0% 20% 0% 20%
Barringtonia asiatica 20% 20% 20% 40% 0% 20%
Carica papaya 20% 20% 0% 60% 40% 40%
Dendrocnide latifolia 0% 0% 0% 0% 0% 0%
Discocalyx megacarpa 0% 0% 0% 20% 20% 0%
Elaeocarpus joga 60% 60% 60% 20% 80% 60%
Eugenia thompsonii 40% 0% 0% 0% 0% 20%
Guamia mariannae 20% 40% 20% 20% 0% 20%
Guettarda speciosa 0% 0% 0% 0% 0% 0%
Hernandia labyrinthica 80% 80% 60% 60% 60% 60%
Hibiscus tiliaceus 20% 0% 20% 0% 0% 0%
Leucaena leucocephala 20% 40% 20% 20% 20% 40%
Macaranga thompsonii 60% 0% 80% 0% 100% 20%
Melanolepis multiglandulosa 20% 0% 0% 20% 0% 20%
Merrilliodendron megacarpum 0% 0% 0% 0% 0% 0%
Neisosperma oppositifolia 20% 60% 0% 80% 60% 20%
Pandanus dubius 0% 40% 0% 40% 0% 20%
Pandanus tectorius 0% 60% 0% 60% 0% 60%
Persea americana 0% 40% 0% 40% 0% 40%
Pipturus argenteus 20% 0% 100% 0% 80% 80%
Premna obtusifolia 100% 20% 100% 20% 60% 40%
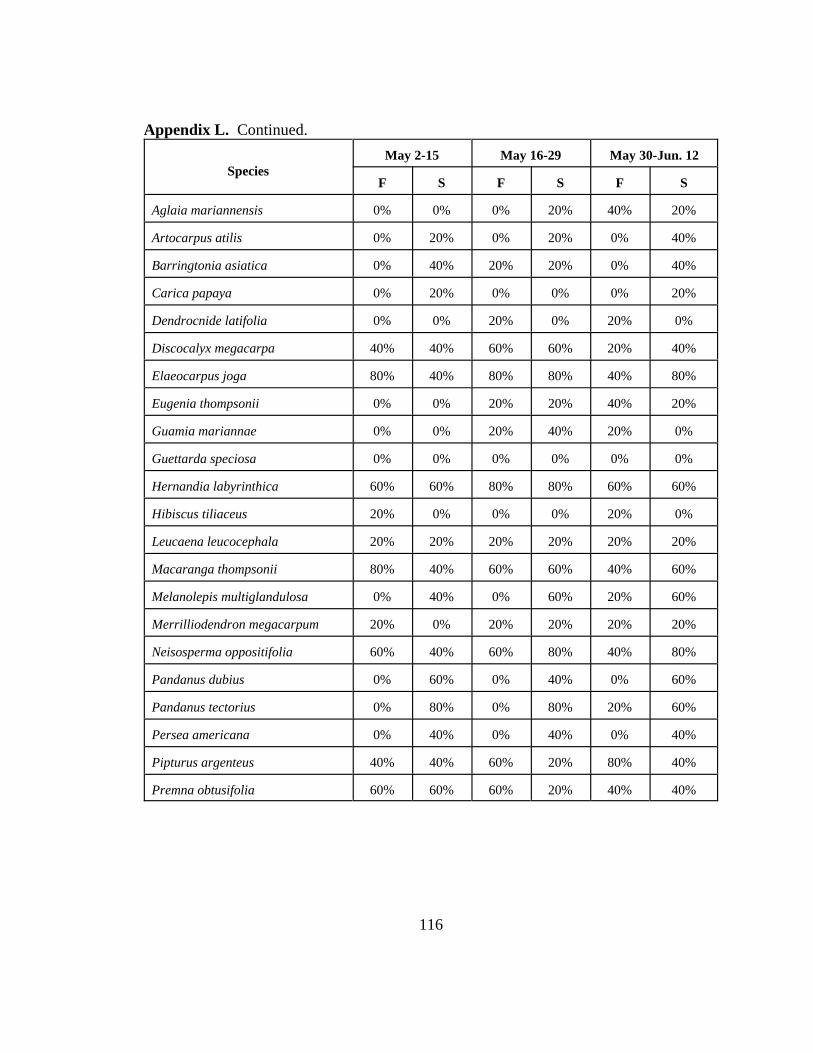
116
Appendix L. Continued.
SpeciesMay 2-15 May 16-29 May 30-Jun. 12
F S F S F S
Aglaia mariannensis 0% 0% 0% 20% 40% 20%
Artocarpus atilis 0% 20% 0% 20% 0% 40%
Barringtonia asiatica 0% 40% 20% 20% 0% 40%
Carica papaya 0% 20% 0% 0% 0% 20%
Dendrocnide latifolia 0% 0% 20% 0% 20% 0%
Discocalyx megacarpa 40% 40% 60% 60% 20% 40%
Elaeocarpus joga 80% 40% 80% 80% 40% 80%
Eugenia thompsonii 0% 0% 20% 20% 40% 20%
Guamia mariannae 0% 0% 20% 40% 20% 0%
Guettarda speciosa 0% 0% 0% 0% 0% 0%
Hernandia labyrinthica 60% 60% 80% 80% 60% 60%
Hibiscus tiliaceus 20% 0% 0% 0% 20% 0%
Leucaena leucocephala 20% 20% 20% 20% 20% 20%
Macaranga thompsonii 80% 40% 60% 60% 40% 60%
Melanolepis multiglandulosa 0% 40% 0% 60% 20% 60%
Merrilliodendron megacarpum 20% 0% 20% 20% 20% 20%
Neisosperma oppositifolia 60% 40% 60% 80% 40% 80%
Pandanus dubius 0% 60% 0% 40% 0% 60%
Pandanus tectorius 0% 80% 0% 80% 20% 60%
Persea americana 0% 40% 0% 40% 0% 40%
Pipturus argenteus 40% 40% 60% 20% 80% 40%
Premna obtusifolia 60% 60% 60% 20% 40% 40%
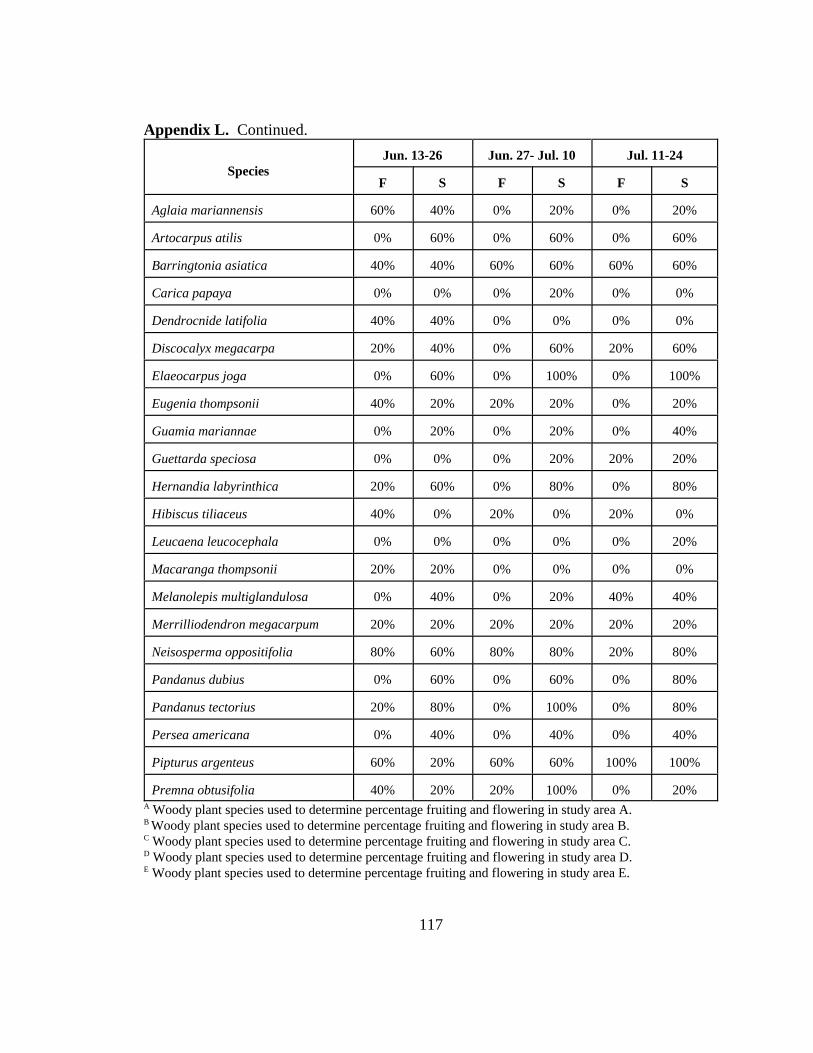
117
Appendix L. Continued.
SpeciesJun. 13-26 Jun. 27- Jul. 10 Jul. 11-24
F S F S F S
Aglaia mariannensis 60% 40% 0% 20% 0% 20%
Artocarpus atilis 0% 60% 0% 60% 0% 60%
Barringtonia asiatica 40% 40% 60% 60% 60% 60%
Carica papaya 0% 0% 0% 20% 0% 0%
Dendrocnide latifolia 40% 40% 0% 0% 0% 0%
Discocalyx megacarpa 20% 40% 0% 60% 20% 60%
Elaeocarpus joga 0% 60% 0% 100% 0% 100%
Eugenia thompsonii 40% 20% 20% 20% 0% 20%
Guamia mariannae 0% 20% 0% 20% 0% 40%
Guettarda speciosa 0% 0% 0% 20% 20% 20%
Hernandia labyrinthica 20% 60% 0% 80% 0% 80%
Hibiscus tiliaceus 40% 0% 20% 0% 20% 0%
Leucaena leucocephala 0% 0% 0% 0% 0% 20%
Macaranga thompsonii 20% 20% 0% 0% 0% 0%
Melanolepis multiglandulosa 0% 40% 0% 20% 40% 40%
Merrilliodendron megacarpum 20% 20% 20% 20% 20% 20%
Neisosperma oppositifolia 80% 60% 80% 80% 20% 80%
Pandanus dubius 0% 60% 0% 60% 0% 80%
Pandanus tectorius 20% 80% 0% 100% 0% 80%
Persea americana 0% 40% 0% 40% 0% 40%
Pipturus argenteus 60% 20% 60% 60% 100% 100%
Premna obtusifolia 40% 20% 20% 100% 0% 20%A Woody plant species used to determine percentage fruiting and flowering in study area A.B Woody plant species used to determine percentage fruiting and flowering in study area B.C Woody plant species used to determine percentage fruiting and flowering in study area C.D Woody plant species used to determine percentage fruiting and flowering in study area D.E Woody plant species used to determine percentage fruiting and flowering in study area E.

118
Appendix M. Breeding characteristics of 16 white-eye species (Zosteropidae).
SpeciesClutch
size
Egg dimensions (mm) Parental involvement (sex)
Length Width Nest
construction IncubationTending
young
Rota bridled white-eye(Zosterops rotensis)ab
1-2 17.0-17.2 (n = 2)
13.0 (n = 2)
? Both Both
Saipan/Tinian bridled white-eye (Z. conspicillatus saypani)b
2-3 15.0-15.5 (n = 3)
11.2-11.5 (n = 3)
? ? ?
Guam bridled white-eye (Z. c. conspicillatus)c
2-3 16.9 (n = 5)
12.9 (n = 5)
? ? ?
Caroline Islands white-eye (Z. semperi takatsukasai)b
1 17.2-18.2 (n = 3)
13.0-14.0(n=3)
? ? ?
Gray white-eye (Z. cinereus ponapensis)b
1 18.5 (n = 1) 13.5 (n = 1) ? ? ?
Indian white-eye (Z. palpebrosa)d 2-4 15.2 (n = 48) 11.5 (n = 48) Female Both Both
Ceylon white-eye (Z. cylonensis)d 2-3 16.5 (n = 33) 12.0 (n = 33) Both Both Both
Green-bellied white-eye (Z. virens)e 1-3 17.3 (n = 24) 12.8 (n = 24) Both Both Both
Mauritius grey white-eye (Z. borbonicus)f
2-3 ? ? ? ? ?

119
Appendix M. Continued.
SpeciesClutch
size
Egg dimensions (mm) Parental involvement (sex)
Length Width Nest
construction IncubationTending
young
Mauritius olive white-eye (Z. chloronthos)f
2-3 ? ? ? ? ?
Madagascar white-eye (Z. maderaspatana)g
2-3 15.4 (n = ?)
12.0 (n = ?)
? ? ?
Heron Island silvereye (Z. lateralis chlorocephala)h
3 ? ? Both Both Both
Pale white-eye (Z. citrinella)i 2-4 ? ? ? ? ?
Yellow white-eye (Z. lutea)i 3-4 ? ? ? ? ?
Japanese white-eye (Z. japonicus)jk 3-6 16.5 (n = 35) 12.7 (n = 35) ? ? ?
Oriental white-eye (Z. palpebrosus)l 2-4 15.2 (n = ?) 11.4 (n = ?) ? ? ?
Lowland white-eye (Z. meyeni)m 4 ? ? ? ? ?a This Study b Yamashina (1932) c Hartert (1898) as cited in Baker (1951)d Ali and Ripley (1974) e Broekhuysen and Winterbottom (1968) f Cheke (1987)g Langrand (1990) h Kikkawa and Wilson (1983) i Pizzey (1980)j Brazil (1991) k van Riper (2000) l Robson (2000)m Kennedy et al. (2000)

120
Appendix N. Unsuccessful research methods used during this study on Rota bridledwhite-eyes on Rota in 1998 and 1999.
Radio telemetry- We attempted to attach LB-2 radio transmitters (HolohilTM,
Ontario, Canada) to five Rota bridled white-eyes in May of 1999 using the glueing
technique described by Raim (1978). All transmitters either fell off shortly after
attachment or were preened off during the following 12 hour period. We recommend that
future researchers use an alternative radio transmitter attachment technique like the
figure-eight harness described by Rappole and Tipton (1991).
Blood smears- We collected blood samples from two Rota bridled white-eyes
using a toe nail clipping technique. Previously, we attempted to collect blood samples
from the brachial vein but were unsuccessful due to the size of the vein. We created blood
smears on 24 mm x 60 mm cover slips and preserved the smears with 100% methanol.
These stains were then stained and examined by Dr. Glenn Olsen at the Patuxent Wildlife
Research Center for white blood cell counts and parasites. No white blood cell counts
were possible due to problems with the blood smears. However, no blood parasites were
observed in blood smears taken from either bird.
White-eye baiting- Bait stations were successfully employed in research on
silvereyes (Zosterops lateralis) (Kikkawa 1961). We attempted to bait Rota bridled
white-eyes by providing sugar water in hummingbird feeders and fruit (oranges and
apples) displays. We never observed Rota bridled white-eyes using either bait station.

121
VITA
Frederick A. Amidon
EDUCATION09/90 - 12/93 UNIVERSITY OF MAINE, ORONO, ME
B.S. with honors in Wildlife Management
WORK EXPERIENCE01/96 - 12/97 U.S. FISH AND WILDLIFE SERVICE, HONOLULU, HI
Biological Technician. Worked on a project to develop recovery techniques for theendangered island swiftlet on Guam. Primary duties included using a closed-circuitvideo system to monitor nesting, swiftlet surveys, insect sampling, and trapping browntree snakes at swiftlet nesting colony.
05/95 - 10/95 U.S. FISH AND WILDLIFE SERVICE, KING SALMON, AKIntern Biologist. Carried out field work on the Becharof Ecosystem Study andMonitoring Avian Productivity Survey (MAPS) program. Primary duties includedbanding passerines during the breeding season and fall migration.
01/95 - 04/95 U.S. FISH AND WILDLIFE SERVICE, HONOLULU, HIField Assistant. Carried out field work as part of a study to determine the effects ofaircraft disturbance on populations of endangered Mariana crows and Mariana fruitbats on Air Force lands. Primary duties included searching for and characterizingMariana crow nests and collecting time budget data on crow nests and a Mariana fruitbat colony.
05/94 - 10/94 UNIVERSITY OF SOUTHERN MISSISSIPPI, HATTIESBURG, MSField Assistant. Mist-netted migrating passerines on the Gulf Coast during fallmigration and censused forest birds in DeSoto National Forest, MS during springmigration and the breeding season.
01/94 - 04/94 MAINE DEPARTMENT OF INLAND FISH AND WILDLIFE, BANGOR, MEWildlife Technician. Censused populations of wintering Barrow’s Goldeneye, aspecies of special concern in Maine.
05/93 - 08/93 MISSOURI STATE UNIVERSITY, COLUMBIA, MOIntern. Worked on the Missouri Ozark Forest Ecosystem Project, a long-term study ofthe effects of forest cutting practices on forest ecosystems. Primary duties includedcensusing breeding birds, banding passerines, and searching for and monitoring nests.