habitat structure and body size distributions: cross
TRANSCRIPT
University of Nebraska - Lincoln University of Nebraska - Lincoln
DigitalCommons@University of Nebraska - Lincoln DigitalCommons@University of Nebraska - Lincoln
Nebraska Cooperative Fish & Wildlife Research Unit -- Staff Publications
Nebraska Cooperative Fish & Wildlife Research Unit
2014
Habitat structure and body size distributions: cross-ecosystem Habitat structure and body size distributions: cross-ecosystem
comparison for taxa with determinate and indeterminate growth comparison for taxa with determinate and indeterminate growth
Kirsty L. Nash James Cook University, [email protected]
Craig R. Allen University of Nebraska-Lincoln, [email protected]
Chris Barichievy University of Witwatersrand
Magnus Nyström Stockholm University
Nicholas A.J. Graham University of Nebraska-Lincoln, [email protected]
Follow this and additional works at: https://digitalcommons.unl.edu/ncfwrustaff
Part of the Aquaculture and Fisheries Commons, Environmental Indicators and Impact Assessment
Commons, Environmental Monitoring Commons, Natural Resource Economics Commons, Natural
Resources and Conservation Commons, and the Water Resource Management Commons
Nash, Kirsty L.; Allen, Craig R.; Barichievy, Chris; Nyström, Magnus; and Graham, Nicholas A.J., "Habitat structure and body size distributions: cross-ecosystem comparison for taxa with determinate and indeterminate growth" (2014). Nebraska Cooperative Fish & Wildlife Research Unit -- Staff Publications. 167. https://digitalcommons.unl.edu/ncfwrustaff/167
This Article is brought to you for free and open access by the Nebraska Cooperative Fish & Wildlife Research Unit at DigitalCommons@University of Nebraska - Lincoln. It has been accepted for inclusion in Nebraska Cooperative Fish & Wildlife Research Unit -- Staff Publications by an authorized administrator of DigitalCommons@University of Nebraska - Lincoln.
971
Habitat structure and body size distributions: cross-ecosystem comparison for taxa with determinate and indeterminate growth
Kirsty L. Nash , Craig R. Allen , Chris Barichievy , Magnus Nystr ö m , Shana Sundstrom and Nicholas A. J. Graham
K. L. Nash ([email protected])(orcid.org/0000-0003-0976-3197) and N. A. J. Graham, ARC Centre of Excellence for Coral Reef Studies, James Cook Univ., Townsville, QLD, 4811, Australia. – C. R. Allen, US Geological Survey - Nebraska Cooperative Fish and Wildlife Research Unit, Univ. of Nebraska, Lincoln, NE 68583, USA. – C. Barichievy, Ezemvelo KZN Wildlife, Ithala Game Reserve, Louwsberg 3150, South Africa, and: Centre for African Ecology, Univ. of Witwatersrand 2050, Johannesburg, South Africa. – M. Nystr ö m, Stockholm Resilience Centre, Stockholm Univ., SE-106 91, Stockholm, Sweden. – S. Sundstrom, School of Natural Resources, Univ. of Nebraska, Lincoln, NE 68583, USA.
Habitat structure across multiple spatial and temporal scales has been proposed as a key driver of body size distributions for associated communities. Th us, understanding the relationship between habitat and body size is fundamental to developing predictions regarding the infl uence of habitat change on animal communities. Much of the work assessing the relationship between habitat structure and body size distributions has focused on terrestrial taxa with determinate growth, and has primarily analysed discontinuities (gaps) in the distribution of species mean sizes (species size relationships or SSRs). Th e suitability of this approach for taxa with indeterminate growth has yet to be determined. We provide a cross-ecosystem comparison of bird (determinate growth) and fi sh (indeterminate growth) body mass distributions using four independent data sets. We evaluate three size distribution indices: SSRs, species size – density relationships (SSDRs) and individual size – density relationships (ISDRs), and two types of analysis: looking for either discontinuities or abundance patterns and multi-modality in the distributions. To assess the respective suitability of these three indices and two analytical approaches for understanding habitat – size relationships in diff erent ecosystems, we compare their ability to diff erentiate bird or fi sh communities found within contrasting habitat conditions. All three indices of body size distribution are useful for examining the relationship between cross-scale patterns of habitat structure and size for species with determinate growth, such as birds. In contrast, for species with indeterminate growth such as fi sh, the relationship between habitat structure and body size may be masked when using mean summary metrics, and thus individual-level data (ISDRs) are more useful. Furthermore, ISDRs, which have traditionally been used to study aquatic systems, present a potentially useful common currency for comparing body size distributions across terrestrial and aquatic ecosystems.
Th e complexity of community dynamics has driven the search for simple proxies of key life history and ecological traits, measurable across multiple taxa (White et al. 2007). Th is has led to considerable interest in body size, which correlates with a broad range of species ’ traits such as home range, dispersal, trophic level, metabolism and extinc-tion risk (Blackburn and Gaston 1994, Woodward et al. 2005). Body size distributions have been used to quantify energy transfer and biogeochemical cycling in ecosystems (Yvon-Durocher and Allen 2012), to examine the division of resources within a community (White et al. 2007), and to quantify the relative resilience of diff erent communities (Peterson et al. 1998).
Habitat and resource availability are thought to be fundamental drivers of body size distributions over ecologi-cal timescales (Holling 1992). Consequently, habitat degra-dation and land use modifi cation will have implications for body size distributions, with knock-on eff ects for community interactions, ecosystem processes and resilience (Peterson
et al. 1998). Th e discontinuity hypothesis proposes that the interaction between patterns of habitat structure and resources at diff erent scales, and the scale at which species interact with their environment, infl uences body size distri-butions within a community (Holling 1992). Such an inter-action occurs because resources are patchily distributed so their availability varies among spatial and temporal scales (Wiens 1989), and the scale or spatio-temporal resolution at which an organism perceives its environment and procures resources is a function of its size (Peters 1983). Species are expected to be clustered in aggregations (or modes) along a body size axis corresponding to scales where resources are available, and separated from neighbouring body size aggre-gations by discontinuities (gaps or troughs), corresponding to scales where resources are limited (Holling 1992).
To date, the discontinuity hypothesis has primarily been tested in terrestrial ecosystems on mammal and avian fauna (Fischer et al. 2008). Th ese studies have predominantly analyzed patterns in the distribution of species ’ mean
Oikos 123: 971–983, 2014 doi: 10.1111/oik.01314
© 2014 Th e Authors. Oikos © 2014 Nordic Society Oikos Subject Editor: Ulrich Brose. Accepted 20 February 2014
972
body masses (hereafter species size relationships (SSRs); Table 1A), and have provided evidence to support the discontinuity hypothesis (reviewed by Nash et al. 2014). Evaluating SSRs demonstrates how patterns of habitat structure infl uence associated communities via the availabil-ity of niches for diff erent sized species (Robson et al. 2005). However, species size relationships do not account for species ’ abundances. Distributions quantifying the abun-dance of diff erent sized species provide an alternative index (hereafter termed species size – density relationships (SSDRs); Table 1B; White et al. 2007). Th is approach allows examination of how resources are distributed among spe-cies, or which size classes predominantly drive energy fl ow within a system (Ernest 2013). Th is is important as incor-porating abundance and examining how resources are apportioned among size classes may provide a more appropriate test of the discontinuity hypothesis (Th ibault et al. 2011).
Th ere are two key assumptions to using both SSRs and SSDRs: 1) summarising size information at the species-level is more informative than using individual-level size data for understanding community structure (Doledec and Statzner 1994), and 2) mean body mass is an appropriate metric to represent the size of a species. Th e fi rst assumption has underpinned much of the terrestrial body size literature, and is appropriate where there are close ties between species iden-tity, and key life history and ecological traits such as size and mobility, meaning that species-level data is representative of
individuals within a population (Doledec and Statzner 1994) . Th e second assumption should hold for taxa with determinate growth and where parental care means that pre-dominantly adults are interacting directly with resources available in their environment, giving a narrow range of body sizes from which to calculate the summary metric. Importantly, variation in the mean body masses among spe-cies must exceed size variability within species (Robson et al. 2005).
Little research regarding the discontinuity hypothesis has been carried out in aquatic systems or for taxa exhibiting indeterminate growth such as fi sh (but see Havlicek and Carpenter 2001, Nash et al. 2013), despite considerable evidence that habitat is important in structuring fi sh com-munities (Graham and Nash 2013). It is unlikely that the assumptions underlying SSRs and SSDRs will hold for fi sh. Th ere has been considerable research suggesting that aquatic communities are strongly size structured, and that individual size may be more informative than species-level data in understanding the functioning of aquatic eco-systems (Shurin et al. 2006). Furthermore, unlike many terrestrial vertebrates, individual fi sh may vary over orders of magnitude in length during the course of their life (Webb et al. 2011), undergo signifi cant ontogenetic changes in habitat and resource requirements (Green and Bellwood 2009), and fi sh often do not exhibit any form of parental care (Smith and Wootton 1995). Th us, size variability within species may exceed variation among species, such that
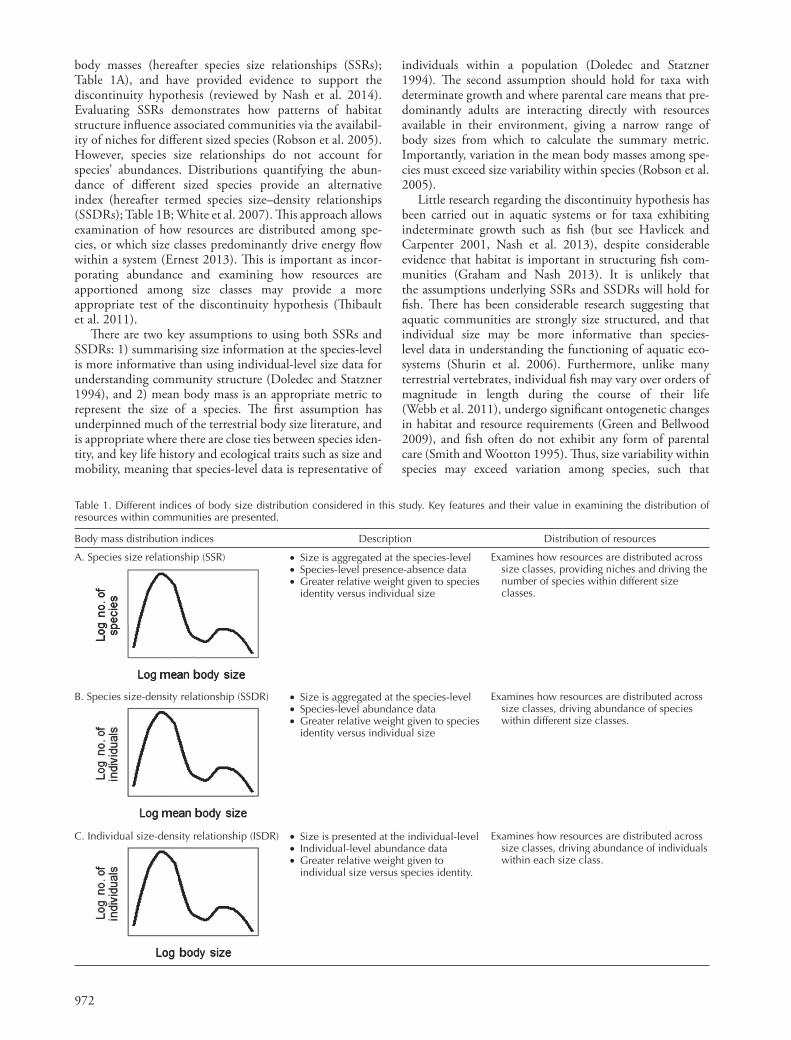
Table 1. Different indices of body size distribution considered in this study. Key features and their value in examining the distribution of resources within communities are presented.
Body mass distribution indices Description Distribution of resources
A. Species size relationship (SSR) • Size is aggregated at the species-level • Species-level presence-absence data • Greater relative weight given to species
identity versus individual size
Examines how resources are distributed across size classes, providing niches and driving the number of species within different size classes.
B. Species size-density relationship (SSDR) • Size is aggregated at the species-level • Species-level abundance data • Greater relative weight given to species
identity versus individual size
Examines how resources are distributed across size classes, driving abundance of species within different size classes.
C. Individual size-density relationship (ISDR) • Size is presented at the individual-level • Individual-level abundance data • Greater relative weight given to
individual size versus species identity.
Examines how resources are distributed across size classes, driving abundance of individuals within each size class.
973
species ’ mean body size may not be an appropriate metric to represent the size of individuals within a population. As a result, there is a need to investigate appropriate indices for use when examining the relationship between habitat and the shape of fi sh size distributions.
In studies of fi sh where species identity is of interest, max-imum and asymptotic species ’ body sizes have been suggested as appropriate alternatives to mean size (Jennings et al. 2001). Th ese metrics may be particularly useful in the context of evaluating habitat – body size relationships, as maximum size is likely to be directly infl uenced by habitat structure in taxa with indeterminate growth (Cumming and Havlicek 2002). However, two issues arise from using maximum length, 1) fi sh exhibit growth patterns driven by location, latitude and exposure to fi shing pressure (Choat and Robertson 2002, DeMartini et al. 2008), so obtaining maximum size data from published sources may introduce bias, and 2) species ’ maximum size is a summary metric and may not represent intra-specifi c size variability any better than species ’ mean size.
For communities where greater relative weight is given to individual body size rather than species-specifi c traits, a dis-tribution quantifying the abundance of diff erent sized individuals may be a more appropriate body size index (here-after termed individual size – density relationships (ISDRs); Table 1C; White et al. 2007). Th is approach examines how resources are divided among individuals within diff er-ent size classes regardless of an individual ’ s taxonomic affi nity. Individual- versus species-level indices have often been applied to diff erent sides of a marine-terrestrial disci-plinary divide (size vs species, respectively), and are not generally compared within studies (but see Reuman et al. 2008, O ’ Gorman and Emmerson 2011). As a result, there has been a lack of clarity regarding the shape of body size distributions and reinforcement of the perspective that marine and terrestrial systems are fundamentally diff erent (White et al. 2007, Webb et al. 2011). Th is problem has been compounded by a dearth of comparative studies exam-ining body size patterns across multiple ecosystems (but see Petchey and Belgrano 2010, Webb et al. 2011), or among taxa with determinate versus indeterminate growth patterns (but see Forys and Allen 2002).
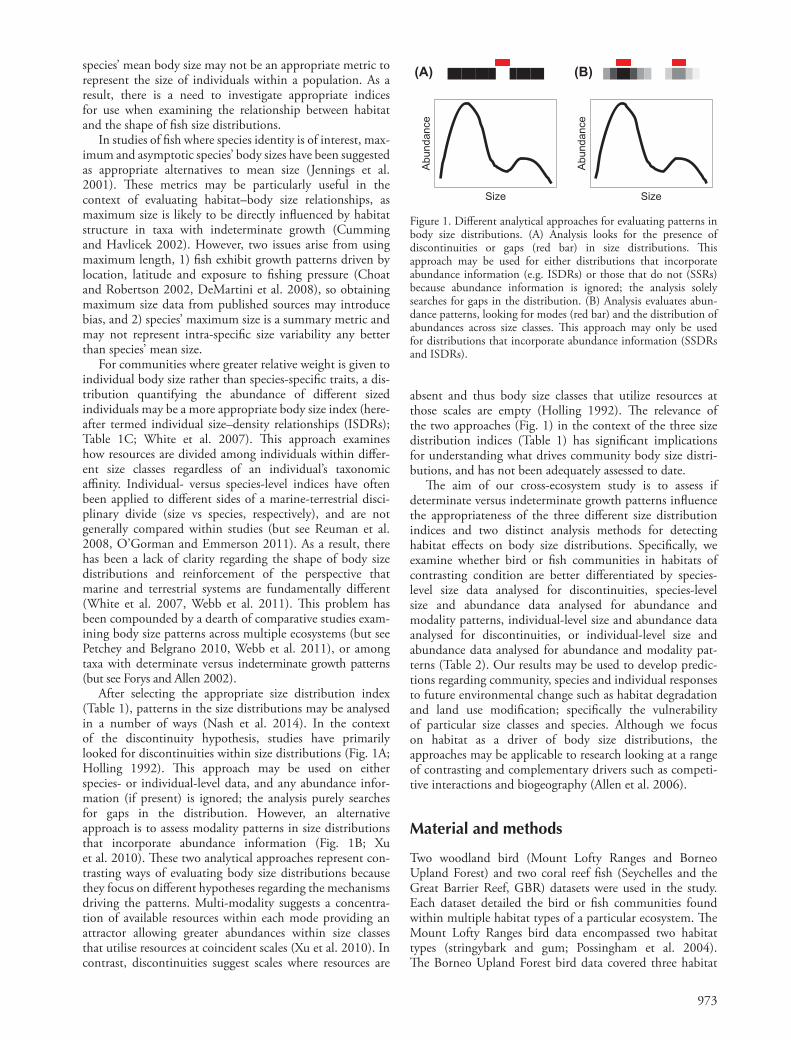
After selecting the appropriate size distribution index (Table 1), patterns in the size distributions may be analysed in a number of ways (Nash et al. 2014). In the context of the discontinuity hypothesis, studies have primarily looked for discontinuities within size distributions (Fig. 1A; Holling 1992). Th is approach may be used on either species- or individual-level data, and any abundance infor-mation (if present) is ignored; the analysis purely searches for gaps in the distribution. However, an alternative approach is to assess modality patterns in size distributions that incorporate abundance information (Fig. 1B; Xu et al. 2010). Th ese two analytical approaches represent con-trasting ways of evaluating body size distributions because they focus on diff erent hypotheses regarding the mechanisms driving the patterns. Multi-modality suggests a concentra-tion of available resources within each mode providing an attractor allowing greater abundances within size classes that utilise resources at coincident scales (Xu et al. 2010). In contrast, discontinuities suggest scales where resources are
absent and thus body size classes that utilize resources at those scales are empty (Holling 1992). Th e relevance of the two approaches (Fig. 1) in the context of the three size distribution indices (Table 1) has signifi cant implications for understanding what drives community body size distri-butions, and has not been adequately assessed to date.
Th e aim of our cross-ecosystem study is to assess if determinate versus indeterminate growth patterns infl uence the appropriateness of the three diff erent size distribution indices and two distinct analysis methods for detecting habitat eff ects on body size distributions. Specifi cally, we examine whether bird or fi sh communities in habitats of contrasting condition are better diff erentiated by species-level size data analysed for discontinuities, species-level size and abundance data analysed for abundance and modality patterns, individual-level size and abundance data analysed for discontinuities, or individual-level size and abundance data analysed for abundance and modality pat-terns (Table 2). Our results may be used to develop predic-tions regarding community, species and individual responses to future environmental change such as habitat degradation and land use modifi cation; specifi cally the vulnerability of particular size classes and species. Although we focus on habitat as a driver of body size distributions, the approaches may be applicable to research looking at a range of contrasting and complementary drivers such as competi-tive interactions and biogeography (Allen et al. 2006).
Material and methods
Two woodland bird (Mount Lofty Ranges and Borneo Upland Forest) and two coral reef fi sh (Seychelles and the Great Barrier Reef, GBR) datasets were used in the study. Each dataset detailed the bird or fi sh communities found within multiple habitat types of a particular ecosystem. Th e Mount Lofty Ranges bird data encompassed two habitat types (stringybark and gum; Possingham et al. 2004). Th e Borneo Upland Forest bird data covered three habitat
Size
Abun
danc
e
Size
(A) (B)
Abun
danc
e
Figure 1. Diff erent analytical approaches for evaluating patterns in body size distributions. (A) Analysis looks for the presence of discontinuities or gaps (red bar) in size distributions. Th is approach may be used for either distributions that incorporate abundance information (e.g. ISDRs) or those that do not (SSRs) because abundance information is ignored; the analysis solely searches for gaps in the distribution. (B) Analysis evaluates abun-dance patterns, looking for modes (red bar) and the distribution of abundances across size classes. Th is approach may only be used for distributions that incorporate abundance information (SSDRs and ISDRs).
974
bird surveys, and indeed are rarely assessed in bird studies (Ernest 2013) due to the diffi culty of estimating the sizes of cryptic species. Th erefore, mean body mass data for each bird species were sourced from the Handbook of Avian Body Masses, averaging across estimates where sepa-rate male and female records were presented (Dunning Jr. 2008). In addition, maximum recorded body mass of each species were sourced from Dunning Jr. (2008), where available. Th ibault et al. (2011) present a method for constructing individual size distributions for bird commu-nities using published mean size and variance data for each species. Information on the variance of some species is not provided by Dunning Jr (2008), therefore species mean body mass data were used to calculate the variance of the mass for each species using the scaling relationship var(mass) � 0.0055 � mean(mass) 1.98 . Th is relationship is based on the mean-variance relationship of 376 bird species (R 2 � 0.92; Th ibault et al. 2011). Individual body sizes were generated for each dataset by randomly drawing the observed number of individuals from a normal distri-bution with the estimated mean and variance values of each species. As this method assumes normal distributions and is based on summary statistics it only provides an esti-mation of the likely size distribution within a community. However, by accounting for intraspecifi c variability it is more representative of individual size distributions than mean data alone, and this approach has successfully been used to highlight consistency in the shape of bird community ISDRs at macroecological scales (Th ibault et al. 2011). For fi sh, individual length data were recorded in the fi eld, therefore individual, mean and maximum observed body masses were calculated using length:body mass conversions available from FishBase (Froese and Pauly 2012). In addition, maximum recorded body mass of each species were sourced from FishBase (Froese and Pauly 2012).
A critical issue when studying body size distributions is how to eff ectively compare diff erent distributions. Tradi-tionally, such comparisons have relied on visual assessments (Holling 1992), which are subjective and may not detect key similarities and diff erences. More recently, comparisons have been made using nested mixture models (Xu et al. 2010) but these rely on a priori decisions regarding the shape of the distributions, or using univariate approaches such as phi correlations (Forys and Allen, 2002) and distri-bution overlap indices (Ernest 2005). Non-metric multi-dimensional scaling (nMDS) is a multivariate approach that is commonly used to compare either presence – absence or abundance of species among sites. In this study this approach was extended to allow a comparison of the patterns in the body size distributions among sites. Analysis of similarities (ANOSIM) was used to statistically test for diff erences in size classes among sites of distinct habitat types (following Hua et al. 2013).
Four groups of analyses were conducted on each dataset, comparing either fi sh or bird communities among sites of diff erent habitat types, for example comparing the size distributions of bird communities among sites in stringybark and gum habitat (Lofty Ranges dataset). Th ese four groups of analyses evaluated diff erent combinations of the three types of body mass distribution and the two
types (unlogged, logged in 1993, and logged in 1989; Cleary et al. 2007). Th e Seychelles coral reef fi sh data incor-porated three habitat types (coral dominated, algal domi-nated, granitic reefs; Nash et al. 2013), and the GBR coral reef fi sh data encompassed three habitat types (undisturbed, disturbed, recovering; Graham et al. unpubl.). Full details of the datasets, the habitats, and the methods used to collect them are provided in the Supplementary material Appendix 1 Text A1. Th e various habitat types possessed distinct pat-terns of cross-scale habitat structure. Th e body mass distri-butions of communities from sites within the same habitat type, and thus with similar cross-scale patterns of structure, were expected to be more similar than those from habitats with diff erent structural patterns.
Bird and fi sh communities were chosen because: 1) they are dominant, species-rich vertebrate groups in their respective ecosystems; 2) they have been the focus of com-plimentary studies on body mass distributions examining occupancy and abundance patterns (Webb et al. 2011); and 3) our aim was to determine the appropriateness of diff erent approaches for detecting habitat eff ects on body size distributions rather than to test the discontinuity hypothesis per se; therefore it was important to choose taxa and systems where habitat is known to have a strong infl u-ence on body size, and thus the signature of habitat eff ects should be evident within the size distributions. Most research on the discontinuity hypothesis has been per-formed on birds, so their relationship to habitat and patterns of discontinuities are well studied. Furthermore, examples from the wider literature have shown that woodland birds are infl uenced by physical habitat structure (De la Monta ñ a et al. 2006). Similarly, the infl uence of habitat structure on coral reef fi sh communities has been particularly well documented (Graham and Nash 2013), and the availability of habitat correlates with fi sh size (Nash et al. 2013).
Data analysis
Body mass was used for all size measurements in the analyses. Individual body sizes were not recorded in the
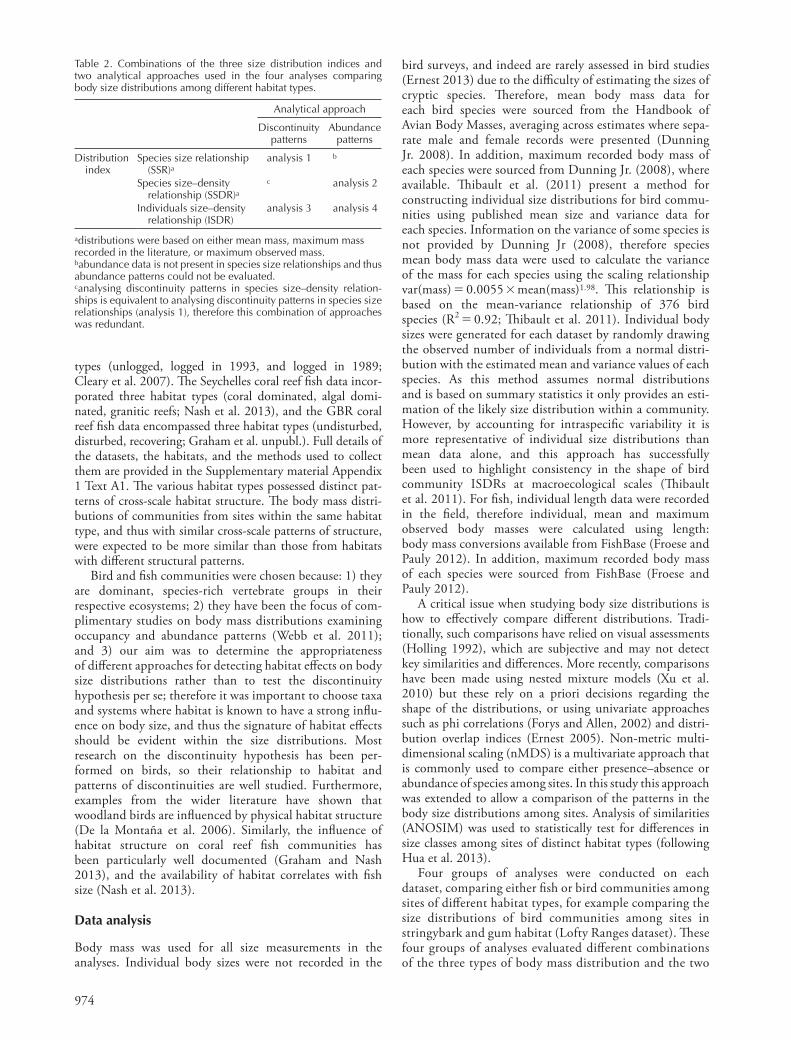
Table 2. Combinations of the three size distribution indices and two analytical approaches used in the four analyses comparing body size distributions among different habitat types.
Analytical approach
Discontinuity patterns
Abundance patterns
Distribution index
Species size relationship (SSR) a
analysis 1 b
Species size – density relationship (SSDR) a
c analysis 2
Individuals size – density relationship (ISDR)
analysis 3 analysis 4
a distributions were based on either mean mass, maximum mass recorded in the literature, or maximum observed mass. b abundance data is not present in species size relationships and thus abundance patterns could not be evaluated. c analysing discontinuity patterns in species size – density relation-ships is equivalent to analysing discontinuity patterns in species size relationships (analysis 1), therefore this combination of approaches was redundant.
975
analytical approaches (Table 2). ANOSIM signifi cance values will be infl uenced by the number of replicates within each analysis, therefore Global R values from the ANOSIM results were used to provide a comparative measure of the strength of the diff erentiation between habitat types for each analysis (Clarke and Warwick 2001).
Analysis 1 and 3
For each dataset, discontinuities (Fig. 1A) were evaluated in the species size relationships (analysis 1) or the individual size-density relationships (analysis 3) of either the bird or fi sh community at each site, using the gap rarity index (GRI). Th e GRI compares the diff erences between body masses of observed data with those of a null model to assess whether there are signifi cant discontinuities or ‘ gaps ’ in the observed size distribution. Th e null model is produced by fi tting a kernel density estimate to the observed rank-ordered log-transformed body masses, using the smallest bandwidth that results in a smoothed, con-tinuous, unimodal null distribution (Silverman 1986). Th e kernel density estimate is transformed to a rank order versus body mass distribution by multiplying the densities by the number of species in the observed dataset. Diff er-ences in the mass between consecutive, rank ordered body masses from the observed dataset are compared to the change in rank among similar diff erences in body mass from the unimodal null model. Th is comparison generates a measure of the probability of the diff erence between con-secutive masses in the observed dataset being signifi cantly diff erent from that expected from the null distribution, and thus whether the diff erence can be considered a dis-continuity. Clusters of species between signifi cant discon-tinuities are defi ned as aggregations. Further details of the GRI method may be found in Restrepo et al. (1997) and Wardwell et al. (2008).
For each of the datasets, a matrix of sites (columns) by log mean body mass (rows) was developed. Values of log body mass (to three decimal places) between the mini-mum and maximum for the community were included as separate rows. Th e matrix was populated using the GRI results, with 0s for discontinuities between aggregations, and 1s within aggregations (Table 3A). Patterns of disconti-nuities and aggregations were compared among sites using nMDS in PRIMER (Clarke 1993). ANOSIM was then used to test for statistical diff erences in discontinuity and aggregation patterns between sites of defi ned habitat types (e.g. unlogged, logged_89, logged_93 in the Borneo dataset). Euclidean distances were used to calculate the distance matrices to ensure that double zeros were included as a basis for comparing among sites, because we were interested in the discontinuity structure of the sites ’ respective communities (Legendre and Legendre 1998). For the Lofty Ranges bird dataset, analysis 1 was also per-formed using maximum body mass from the literature (Dunning Jr. 2008). Th is was not possible for the Borneo dataset due to lack of maximum mass data. For the two fi sh datasets, analysis 1 was also performed using both maxi-mum body mass from FishBase and maximum observed body mass.
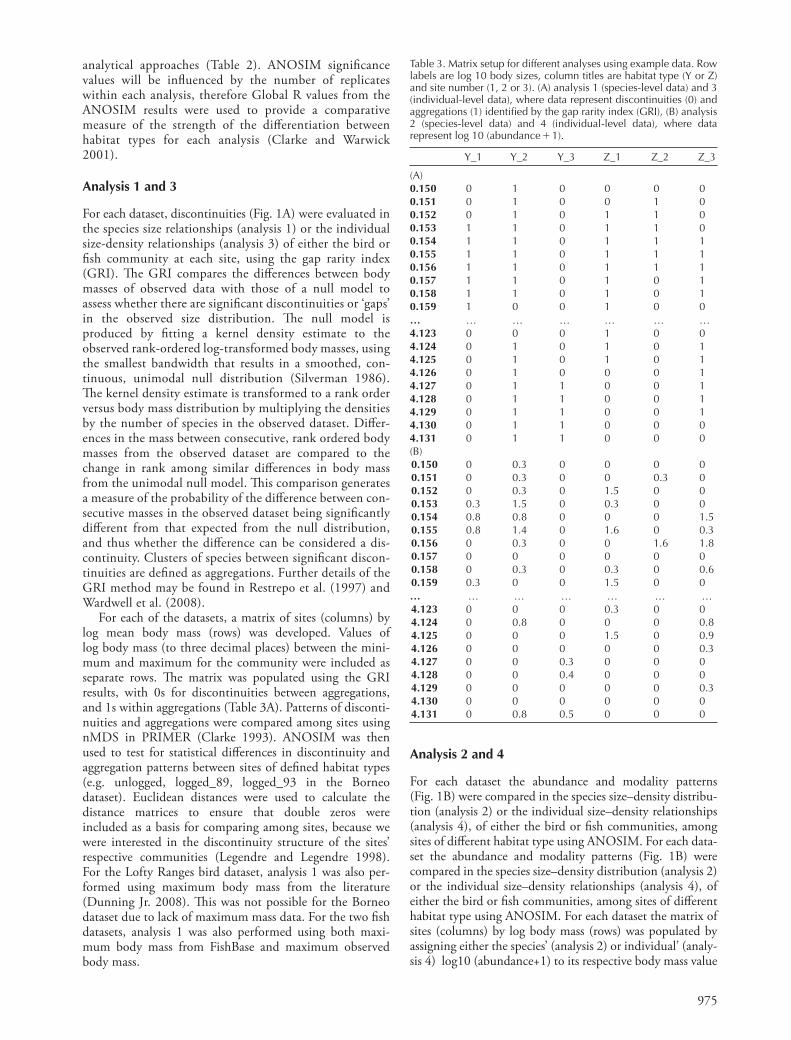
Table 3. Matrix setup for different analyses using example data. Row labels are log 10 body sizes, column titles are habitat type (Y or Z) and site number (1, 2 or 3). (A) analysis 1 (species-level data) and 3 (individual-level data), where data represent discontinuities (0) and aggregations (1) identifi ed by the gap rarity index (GRI), (B) analysis 2 (species-level data) and 4 (individual-level data), where data represent log 10 (abundance � 1).
Y_1 Y_2 Y_3 Z_1 Z_2 Z_3
(A) 0.150 0 1 0 0 0 0 0.151 0 1 0 0 1 0 0.152 0 1 0 1 1 0 0.153 1 1 0 1 1 0 0.154 1 1 0 1 1 1 0.155 1 1 0 1 1 1 0.156 1 1 0 1 1 1 0.157 1 1 0 1 0 1 0.158 1 1 0 1 0 1 0.159 1 0 0 1 0 0 º … … … … … … 4.123 0 0 0 1 0 0 4.124 0 1 0 1 0 1 4.125 0 1 0 1 0 1 4.126 0 1 0 0 0 1 4.127 0 1 1 0 0 1 4.128 0 1 1 0 0 1 4.129 0 1 1 0 0 1 4.130 0 1 1 0 0 0 4.131 0 1 1 0 0 0(B) 0.150 0 0.3 0 0 0 0 0.151 0 0.3 0 0 0.3 0 0.152 0 0.3 0 1.5 0 0 0.153 0.3 1.5 0 0.3 0 0 0.154 0.8 0.8 0 0 0 1.5 0.155 0.8 1.4 0 1.6 0 0.3 0.156 0 0.3 0 0 1.6 1.8 0.157 0 0 0 0 0 0 0.158 0 0.3 0 0.3 0 0.6 0.159 0.3 0 0 1.5 0 0 º … … … … … … 4.123 0 0 0 0.3 0 0 4.124 0 0.8 0 0 0 0.8 4.125 0 0 0 1.5 0 0.9 4.126 0 0 0 0 0 0.3 4.127 0 0 0.3 0 0 0 4.128 0 0 0.4 0 0 0 4.129 0 0 0 0 0 0.3 4.130 0 0 0 0 0 0 4.131 0 0.8 0.5 0 0 0
Analysis 2 and 4
For each dataset the abundance and modality patterns (Fig. 1B) were compared in the species size – density distribu-tion (analysis 2) or the individual size – density relationships (analysis 4), of either the bird or fi sh communities, among sites of diff erent habitat type using ANOSIM. For each data-set the abundance and modality patterns (Fig. 1B) were compared in the species size–density distribution (analysis 2) or the individual size–density relationships (analysis 4), of either the bird or fi sh communities, among sites of diff erent habitat type using ANOSIM. For each dataset the matrix of sites (columns) by log body mass (rows) was populated by assigning either the species’ (analysis 2) or individual’ (analy-sis 4) log10 (abundance+1) to its respective body mass value
976
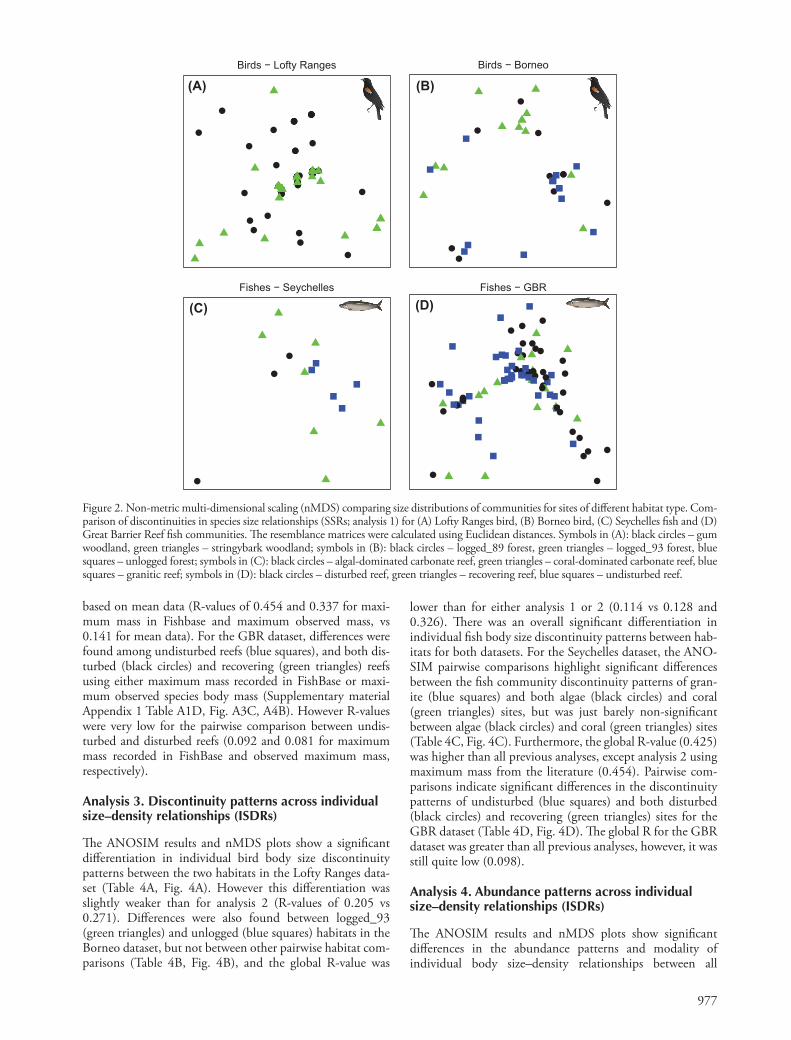
A2A). For the GBR dataset, there were signifi cant diff erences among disturbed reefs (black circles), and both undisturbed (blue squares) and recovering (green triangles) reefs using species size relationships based on maximum mass recorded in FishBase (Supplementary material Appendix 1 Table A1D, Fig. A1C). However the R value for the disturbed – undisturbed reef comparison was extremely low (R � 0.097) suggesting there is little real separation between these two groups. Diff er-ences were only found among disturbed (black circles) and undisturbed (blue squares) habitats using maximum observed species body mass distributions (Supplementary material Appendix 1 Table A1D, Fig. A2B).
Analysis 2. Abundance patterns across species size – density relationships (SSDRs)
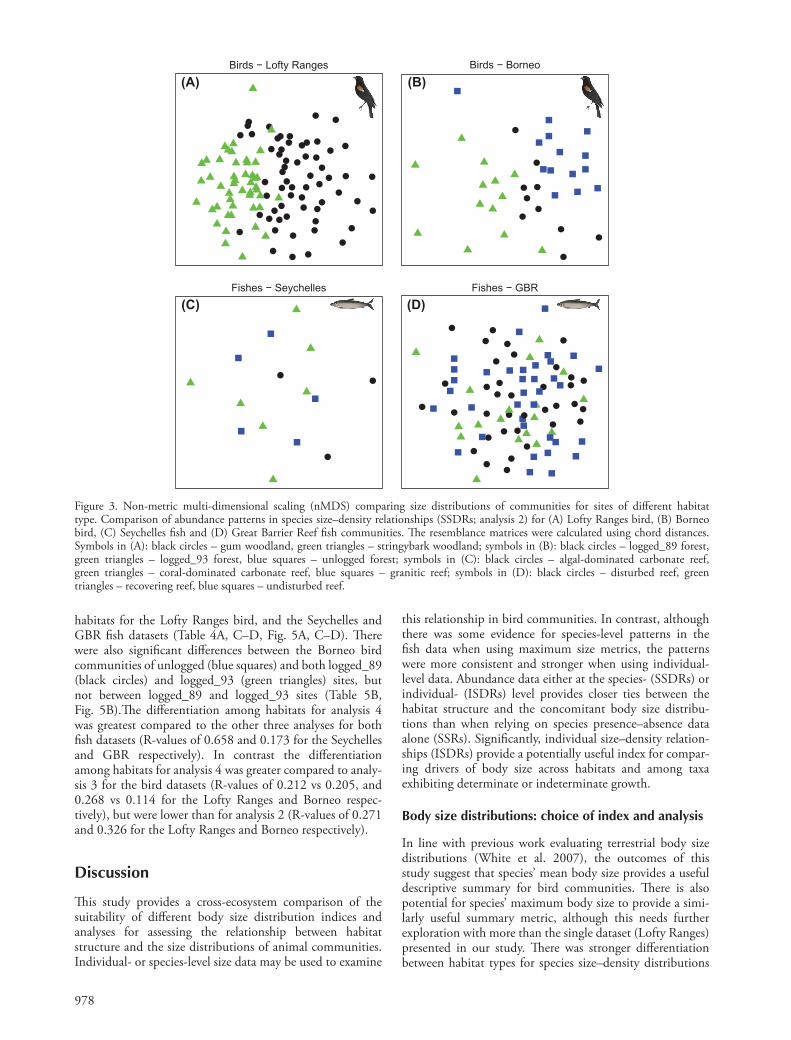
Th e ANOSIM results and nMDS plots show a stronger diff erentiation among sites of diff erent habitat type when the species size – density relationships of bird communities were analysed for abundance patterns (analysis 2), com-pared to assessment of species size relationships for discon-tinuity patterns (analysis 1). Th is outcome holds among all habitats for both the Lofty Ranges and Borneo datasets (R-values of 0.271 vs 0.115, and 0.326 vs 0.128, respectively; Table 4A – B, Fig. 3A – B). No signifi cant diff erences were found among habitats in either fi sh dataset (Table 3C – D, Fig. 3C – D). When using maximum species body mass data recorded in the literature, the Lofty Ranges bird communities showed signifi cant diff erences among the two habitats (Supplementary material Appendix 1 Table A1A, Fig. A3A), although this diff erentiation was not as strong as when mean data were used (R-values of 0.217 vs 0.271). Th e Seychelles fi sh communities showed diff erences among all habitats for both maximum mass recorded in FishBase and observed maximum mass (Supplementary material Appendix 1 Table A1C, Fig. A3B, A4A). In addi-tion, global R-values were higher compared with analysis 2
(Table 3B). Patterns of abundance of diff erent body sizes were then compared among sites using nMDS and ANO-SIM. Chord distances were used to calculate the distance matrices, because this allowed comparison of the proportion of individuals recorded within body mass classes (Legendre and Legendre 1998). Pairs of sites that have peaks (and troughs) in abundance in the same size classes as well as sim-ilar proportions of individuals within size classes give the smallest chord distances, while pairs of sites that do not share overlapping modes in the abundance distribution or similar proportions of individuals in size classes give the largest dis-tances. Analysis 2 was repeated using maximum body mass data, as detailed for analysis 1 above.
Results
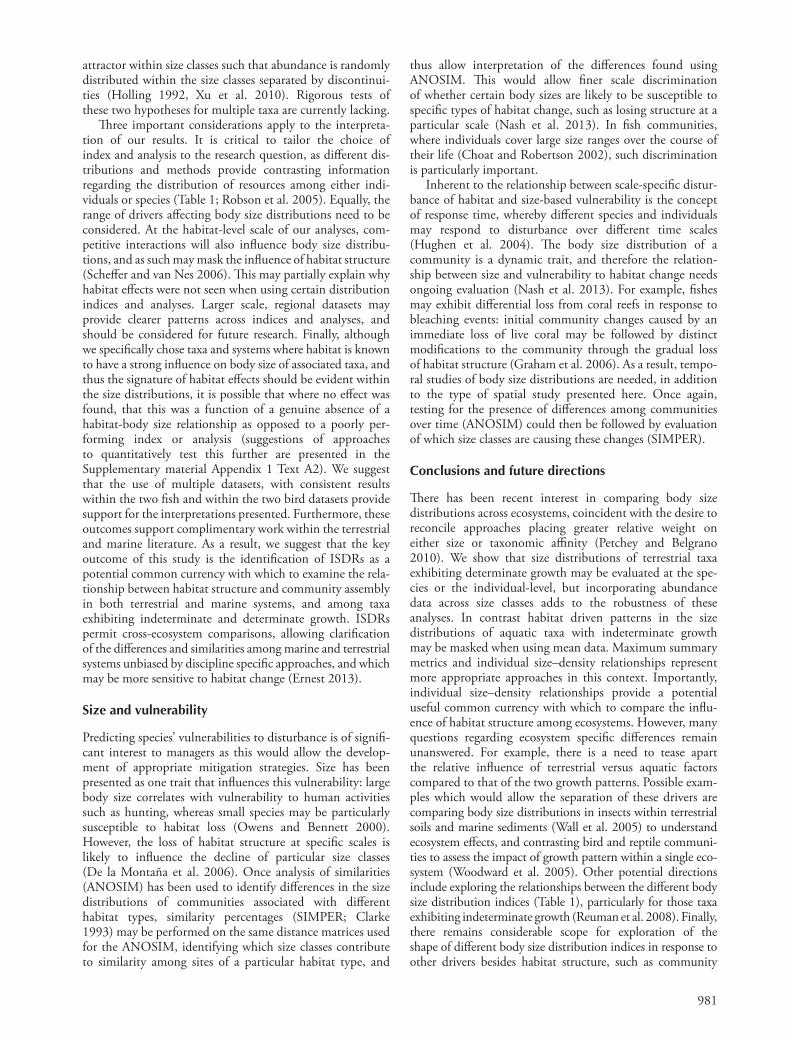
Analysis 1. Discontinuity patterns across species size relationships (SSRs)
Th e ANOSIM results and nMDS plots show a diff erentiation in bird mean body size discontinuity patterns between sites in gum (black circles) and stringybark (green triangles) habitats in the Lofty Ranges dataset (Table 4A, Fig. 2A). Diff erences were also found between sites in logged_93 (green triangles) and unlogged (blue squares) habitats in the Borneo dataset, but not between remaining pairwise comparisons (Table 4B, Fig. 2B). Th e discontinuity patterns in fi sh mean species size relation-ships were not signifi cantly diff erent among habitats for either dataset (Table 4C – D, Fig. 2C – D). When using maxi-mum species body mass data recorded in the literature, the Lofty Ranges bird communities showed signifi cant diff erences among the two habitats (Supplementary material Appendix 1 Table a1A, Fig. A2A). Th e Seychelles fi sh communities showed no signifi cant diff erences among habitats for either maximum mass recorded in FishBase, or for observed maximum mass (Supplementary material Appendix 1 Table A1C, Fig. A1B,
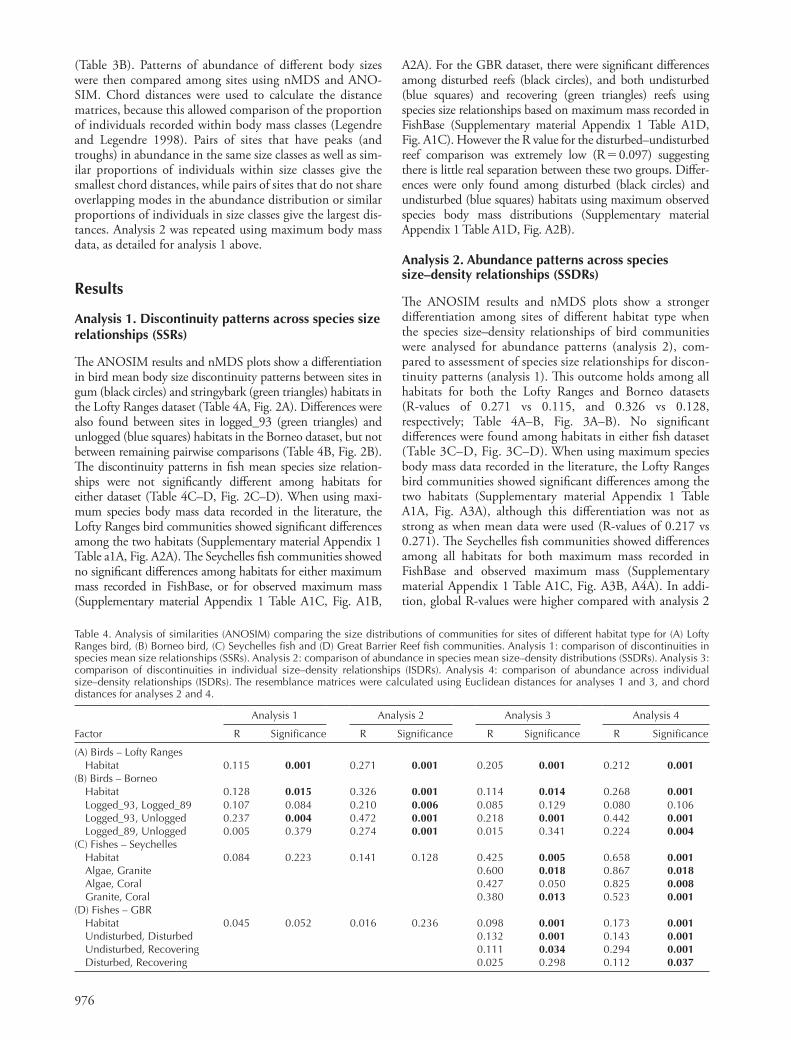
Table 4. Analysis of similarities (ANOSIM) comparing the size distributions of communities for sites of different habitat type for (A) Lofty Ranges bird, (B) Borneo bird, (C) Seychelles fi sh and (D) Great Barrier Reef fi sh communities. Analysis 1: comparison of discontinuities in species mean size relationships (SSRs). Analysis 2: comparison of abundance in species mean size – density distributions (SSDRs). Analysis 3: comparison of discontinuities in individual size – density relationships (ISDRs). Analysis 4: comparison of abundance across individual size–density relationships (ISDRs). The resemblance matrices were calculated using Euclidean distances for analyses 1 and 3, and chord distances for analyses 2 and 4.
Analysis 1 Analysis 2 Analysis 3 Analysis 4
Factor R Signifi cance R Signifi cance R Signifi cance R Signifi cance
(A) Birds – Lofty RangesHabitat 0.115 0.001 0.271 0.001 0.205 0.001 0.212 0.001
(B) Birds – BorneoHabitat 0.128 0.015 0.326 0.001 0.114 0.014 0.268 0.001 Logged_93, Logged_89 0.107 0.084 0.210 0.006 0.085 0.129 0.080 0.106Logged_93, Unlogged 0.237 0.004 0.472 0.001 0.218 0.001 0.442 0.001 Logged_89, Unlogged 0.005 0.379 0.274 0.001 0.015 0.341 0.224 0.004
(C) Fishes – SeychellesHabitat 0.084 0.223 0.141 0.128 0.425 0.005 0.658 0.001 Algae, Granite 0.600 0.018 0.867 0.018 Algae, Coral 0.427 0.050 0.825 0.008 Granite, Coral 0.380 0.013 0.523 0.001
(D) Fishes – GBRHabitat 0.045 0.052 0.016 0.236 0.098 0.001 0.173 0.001 Undisturbed, Disturbed 0.132 0.001 0.143 0.001 Undisturbed, Recovering 0.111 0.034 0.294 0.001 Disturbed, Recovering 0.025 0.298 0.112 0.037
977
(A)
Birds − Lofty Ranges
(B)
Birds − Borneo
(C)
Fishes − Seychelles
(D)
Fishes − GBR
Figure 2. Non-metric multi-dimensional scaling (nMDS) comparing size distributions of communities for sites of diff erent habitat type. Com-parison of discontinuities in species size relationships (SSRs; analysis 1) for (A) Lofty Ranges bird, (B) Borneo bird, (C) Seychelles fi sh and (D) Great Barrier Reef fi sh communities. Th e resemblance matrices were calculated using Euclidean distances. Symbols in (A): black circles – gum woodland, green triangles – stringybark woodland; symbols in (B): black circles – logged_89 forest, green triangles – logged_93 forest, blue squares – unlogged forest; symbols in (C): black circles – algal-dominated carbonate reef, green triangles – coral-dominated carbonate reef, blue squares – granitic reef; symbols in (D): black circles – disturbed reef, green triangles – recovering reef, blue squares – undisturbed reef.
based on mean data (R-values of 0.454 and 0.337 for maxi-mum mass in Fishbase and maximum observed mass, vs 0.141 for mean data). For the GBR dataset, diff erences were found among undisturbed reefs (blue squares), and both dis-turbed (black circles) and recovering (green triangles) reefs using either maximum mass recorded in FishBase or maxi-mum observed species body mass (Supplementary material Appendix 1 Table A1D, Fig. A3C, A4B). However R-values were very low for the pairwise comparison between undis-turbed and disturbed reefs (0.092 and 0.081 for maximum mass recorded in FishBase and observed maximum mass, respectively).
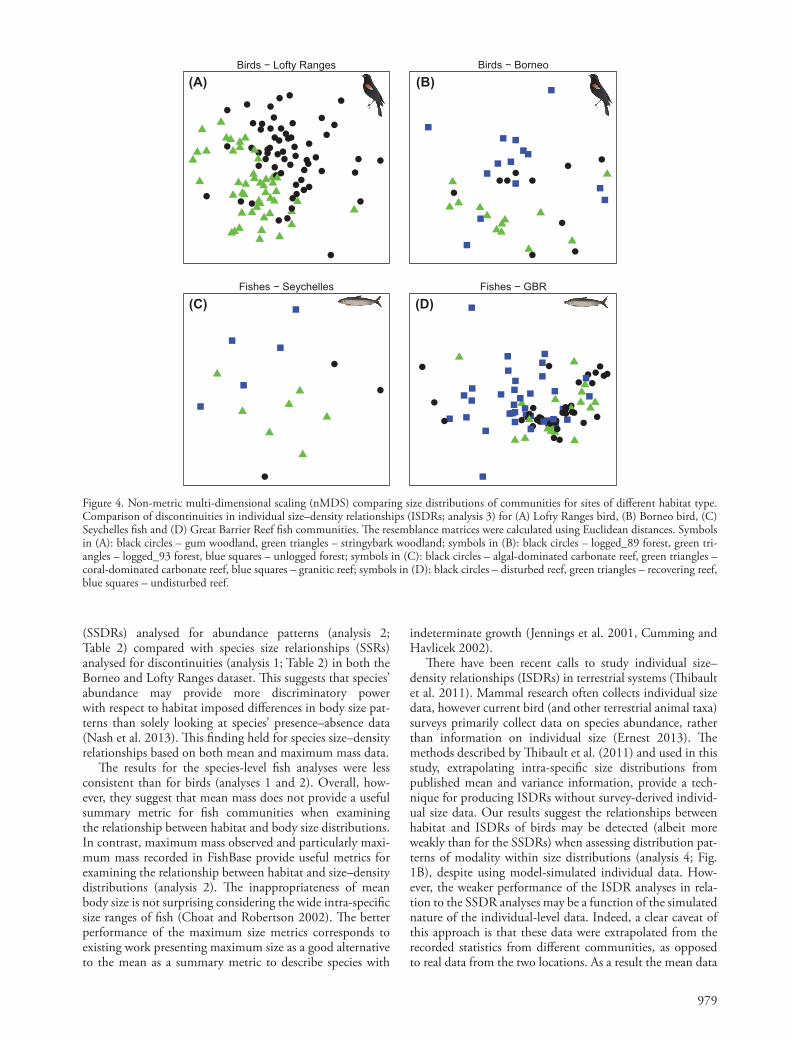
Analysis 3. Discontinuity patterns across individual size – density relationships (ISDRs)
Th e ANOSIM results and nMDS plots show a signifi cant diff erentiation in individual bird body size discontinuity patterns between the two habitats in the Lofty Ranges data-set (Table 4A, Fig. 4A). However this diff erentiation was slightly weaker than for analysis 2 (R-values of 0.205 vs 0.271). Diff erences were also found between logged_93 (green triangles) and unlogged (blue squares) habitats in the Borneo dataset, but not between other pairwise habitat com-parisons (Table 4B, Fig. 4B), and the global R-value was
lower than for either analysis 1 or 2 (0.114 vs 0.128 and 0.326). Th ere was an overall signifi cant diff erentiation in individual fi sh body size discontinuity patterns between hab-itats for both datasets. For the Seychelles dataset, the ANO-SIM pairwise comparisons highlight signifi cant diff erences between the fi sh community discontinuity patterns of gran-ite (blue squares) and both algae (black circles) and coral (green triangles) sites, but was just barely non-signifi cant between algae (black circles) and coral (green triangles) sites (Table 4C, Fig. 4C). Furthermore, the global R-value (0.425) was higher than all previous analyses, except analysis 2 using maximum mass from the literature (0.454). Pairwise com-parisons indicate signifi cant diff erences in the discontinuity patterns of undisturbed (blue squares) and both disturbed (black circles) and recovering (green triangles) sites for the GBR dataset (Table 4D, Fig. 4D). Th e global R for the GBR dataset was greater than all previous analyses, however, it was still quite low (0.098).
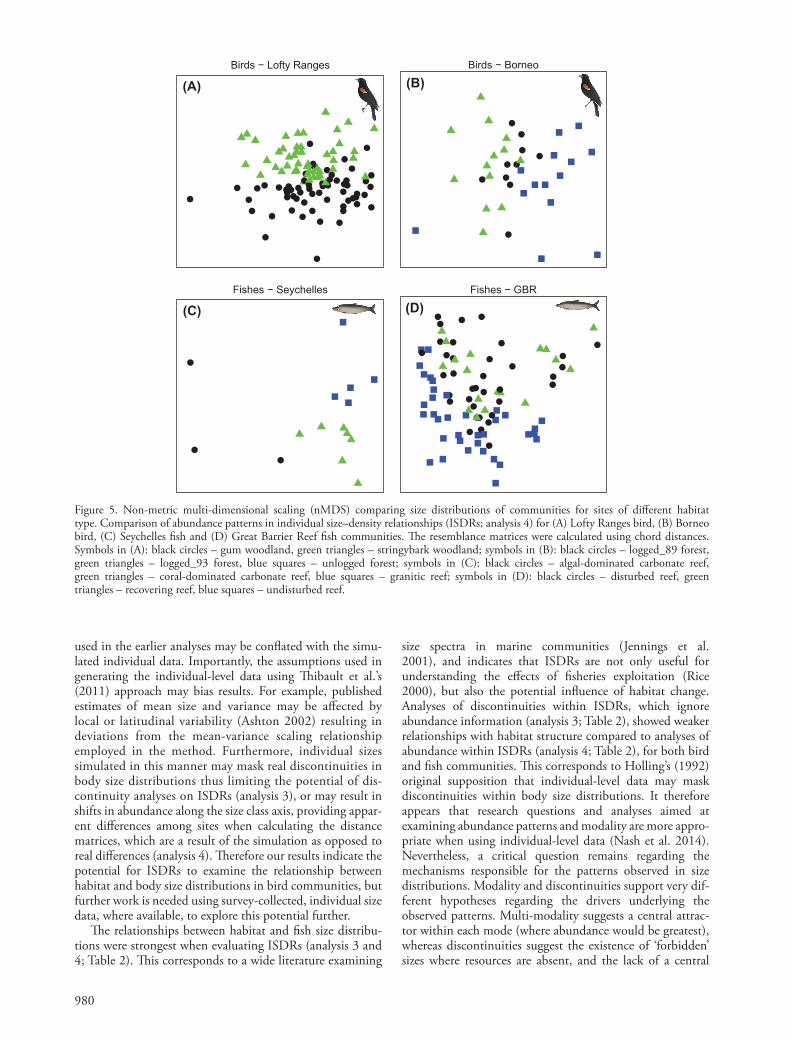
Analysis 4. Abundance patterns across individual size–density relationships (ISDRs)
Th e ANOSIM results and nMDS plots show signifi cant diff erences in the abundance patterns and modality of individual body size – density relationships between all
978
(A)
Birds − Lofty Ranges(B)
Birds − Borneo
(C)
Fishes − Seychelles(D)
Fishes − GBR
Figure 3. Non-metric multi-dimensional scaling (nMDS) comparing size distributions of communities for sites of diff erent habitat type. Comparison of abundance patterns in species size – density relationships (SSDRs; analysis 2) for (A) Lofty Ranges bird, (B) Borneo bird, (C) Seychelles fi sh and (D) Great Barrier Reef fi sh communities. Th e resemblance matrices were calculated using chord distances. Symbols in (A): black circles – gum woodland, green triangles – stringybark woodland; symbols in (B): black circles – logged_89 forest, green triangles – logged_93 forest, blue squares – unlogged forest; symbols in (C): black circles – algal-dominated carbonate reef, green triangles – coral-dominated carbonate reef, blue squares – granitic reef; symbols in (D): black circles – disturbed reef, green triangles – recovering reef, blue squares – undisturbed reef.
habitats for the Lofty Ranges bird, and the Seychelles and GBR fi sh datasets (Table 4A, C – D, Fig. 5A, C – D). Th ere were also signifi cant diff erences between the Borneo bird communities of unlogged (blue squares) and both logged_89 (black circles) and logged_93 (green triangles) sites, but not between logged_89 and logged_93 sites (Table 5B, Fig. 5B).Th e diff erentiation among habitats for analysis 4 was greatest compared to the other three analyses for both fi sh datasets (R-values of 0.658 and 0.173 for the Seychelles and GBR respectively). In contrast the diff erentiation among habitats for analysis 4 was greater compared to analy-sis 3 for the bird datasets (R-values of 0.212 vs 0.205, and 0.268 vs 0.114 for the Lofty Ranges and Borneo respec-tively), but were lower than for analysis 2 (R-values of 0.271 and 0.326 for the Lofty Ranges and Borneo respectively).
Discussion
Th is study provides a cross-ecosystem comparison of the suitability of diff erent body size distribution indices and analyses for assessing the relationship between habitat structure and the size distributions of animal communities. Individual- or species-level size data may be used to examine
this relationship in bird communities. In contrast, although there was some evidence for species-level patterns in the fi sh data when using maximum size metrics, the patterns were more consistent and stronger when using individual-level data. Abundance data either at the species- (SSDRs) or individual- (ISDRs) level provides closer ties between the habitat structure and the concomitant body size distribu-tions than when relying on species presence – absence data alone (SSRs). Signifi cantly, individual size – density relation-ships (ISDRs) provide a potentially useful index for compar-ing drivers of body size across habitats and among taxa exhibiting determinate or indeterminate growth.
Body size distributions: choice of index and analysis
In line with previous work evaluating terrestrial body size distributions (White et al. 2007), the outcomes of this study suggest that species ’ mean body size provides a useful descriptive summary for bird communities. Th ere is also potential for species ’ maximum body size to provide a simi-larly useful summary metric, although this needs further exploration with more than the single dataset (Lofty Ranges) presented in our study. Th ere was stronger diff erentiation between habitat types for species size – density distributions
979
(A)
Birds − Lofty Ranges(B)
Birds − Borneo
(C)
Fishes − Seychelles
(D)
Fishes − GBR
Figure 4. Non-metric multi-dimensional scaling (nMDS) comparing size distributions of communities for sites of diff erent habitat type. Comparison of discontinuities in individual size – density relationships (ISDRs; analysis 3) for (A) Lofty Ranges bird, (B) Borneo bird, (C) Seychelles fi sh and (D) Great Barrier Reef fi sh communities. Th e resemblance matrices were calculated using Euclidean distances. Symbols in (A): black circles – gum woodland, green triangles – stringybark woodland; symbols in (B): black circles – logged_89 forest, green tri-angles – logged_93 forest, blue squares – unlogged forest; symbols in (C): black circles – algal-dominated carbonate reef, green triangles – coral-dominated carbonate reef, blue squares – granitic reef; symbols in (D): black circles – disturbed reef, green triangles – recovering reef, blue squares – undisturbed reef.
(SSDRs) analysed for abundance patterns (analysis 2; Table 2) compared with species size relationships (SSRs) analysed for discontinuities (analysis 1; Table 2) in both the Borneo and Lofty Ranges dataset. Th is suggests that species ’ abundance may provide more discriminatory power with respect to habitat imposed diff erences in body size pat-terns than solely looking at species ’ presence – absence data (Nash et al. 2013). Th is fi nding held for species size – density relationships based on both mean and maximum mass data.
Th e results for the species-level fi sh analyses were less consistent than for birds (analyses 1 and 2). Overall, how-ever, they suggest that mean mass does not provide a useful summary metric for fi sh communities when examining the relationship between habitat and body size distributions. In contrast, maximum mass observed and particularly maxi-mum mass recorded in FishBase provide useful metrics for examining the relationship between habitat and size – density distributions (analysis 2). Th e inappropriateness of mean body size is not surprising considering the wide intra-specifi c size ranges of fi sh (Choat and Robertson 2002). Th e better performance of the maximum size metrics corresponds to existing work presenting maximum size as a good alternative to the mean as a summary metric to describe species with
indeterminate growth (Jennings et al. 2001, Cumming and Havlicek 2002).
Th ere have been recent calls to study individual size – density relationships (ISDRs) in terrestrial systems (Th ibault et al. 2011). Mammal research often collects individual size data, however current bird (and other terrestrial animal taxa) surveys primarily collect data on species abundance, rather than information on individual size (Ernest 2013). Th e methods described by Th ibault et al. (2011) and used in this study, extrapolating intra-specifi c size distributions from published mean and variance information, provide a tech-nique for producing ISDRs without survey-derived individ-ual size data. Our results suggest the relationships between habitat and ISDRs of birds may be detected (albeit more weakly than for the SSDRs) when assessing distribution pat-terns of modality within size distributions (analysis 4; Fig. 1B), despite using model-simulated individual data. How-ever, the weaker performance of the ISDR analyses in rela-tion to the SSDR analyses may be a function of the simulated nature of the individual-level data. Indeed, a clear caveat of this approach is that these data were extrapolated from the recorded statistics from diff erent communities, as opposed to real data from the two locations. As a result the mean data
980
(A)
Birds − Lofty Ranges
(B)
Birds − Borneo
(C)
Fishes − Seychelles
(D)
Fishes − GBR
Figure 5. Non-metric multi-dimensional scaling (nMDS) comparing size distributions of communities for sites of diff erent habitat type. Comparison of abundance patterns in individual size – density relationships (ISDRs; analysis 4) for (A) Lofty Ranges bird, (B) Borneo bird, (C) Seychelles fi sh and (D) Great Barrier Reef fi sh communities. Th e resemblance matrices were calculated using chord distances. Symbols in (A): black circles – gum woodland, green triangles – stringybark woodland; symbols in (B): black circles – logged_89 forest, green triangles – logged_93 forest, blue squares – unlogged forest; symbols in (C): black circles – algal-dominated carbonate reef, green triangles – coral-dominated carbonate reef, blue squares – granitic reef; symbols in (D): black circles – disturbed reef, green triangles – recovering reef, blue squares – undisturbed reef.
used in the earlier analyses may be confl ated with the simu-lated individual data. Importantly, the assumptions used in generating the individual-level data using Th ibault et al. ’ s (2011) approach may bias results. For example, published estimates of mean size and variance may be aff ected by local or latitudinal variability (Ashton 2002) resulting in deviations from the mean-variance scaling relationship employed in the method. Furthermore, individual sizes simulated in this manner may mask real discontinuities in body size distributions thus limiting the potential of dis-continuity analyses on ISDRs (analysis 3), or may result in shifts in abundance along the size class axis, providing appar-ent diff erences among sites when calculating the distance matrices, which are a result of the simulation as opposed to real diff erences (analysis 4). Th erefore our results indicate the potential for ISDRs to examine the relationship between habitat and body size distributions in bird communities, but further work is needed using survey-collected, individual size data, where available, to explore this potential further.
Th e relationships between habitat and fi sh size distribu-tions were strongest when evaluating ISDRs (analysis 3 and 4; Table 2). Th is corresponds to a wide literature examining
size spectra in marine communities (Jennings et al. 2001), and indicates that ISDRs are not only useful for understanding the eff ects of fi sheries exploitation (Rice 2000), but also the potential infl uence of habitat change. Analyses of discontinuities within ISDRs, which ignore abundance information (analysis 3; Table 2), showed weaker relationships with habitat structure compared to analyses of abundance within ISDRs (analysis 4; Table 2), for both bird and fi sh communities. Th is corresponds to Holling ’ s (1992) original supposition that individual-level data may mask discontinuities within body size distributions. It therefore appears that research questions and analyses aimed at examining abundance patterns and modality are more appro-priate when using individual-level data (Nash et al. 2014). Nevertheless, a critical question remains regarding the mechanisms responsible for the patterns observed in size distributions. Modality and discontinuities support very dif-ferent hypotheses regarding the drivers underlying the observed patterns. Multi-modality suggests a central attrac-tor within each mode (where abundance would be greatest), whereas discontinuities suggest the existence of ‘ forbidden ’ sizes where resources are absent, and the lack of a central
981
thus allow interpretation of the diff erences found using ANOSIM. Th is would allow fi ner scale discrimination of whether certain body sizes are likely to be susceptible to specifi c types of habitat change, such as losing structure at a particular scale (Nash et al. 2013). In fi sh communities, where individuals cover large size ranges over the course of their life (Choat and Robertson 2002), such discrimination is particularly important.
Inherent to the relationship between scale-specifi c distur-bance of habitat and size-based vulnerability is the concept of response time, whereby diff erent species and individuals may respond to disturbance over diff erent time scales (Hughen et al. 2004). Th e body size distribution of a community is a dynamic trait, and therefore the relation-ship between size and vulnerability to habitat change needs ongoing evaluation (Nash et al. 2013). For example, fi shes may exhibit diff erential loss from coral reefs in response to bleaching events: initial community changes caused by an immediate loss of live coral may be followed by distinct modifi cations to the community through the gradual loss of habitat structure (Graham et al. 2006). As a result, tempo-ral studies of body size distributions are needed, in addition to the type of spatial study presented here. Once again, testing for the presence of diff erences among communities over time (ANOSIM) could then be followed by evaluation of which size classes are causing these changes (SIMPER).
Conclusions and future directions
Th ere has been recent interest in comparing body size distributions across ecosystems, coincident with the desire to reconcile approaches placing greater relative weight on either size or taxonomic affi nity (Petchey and Belgrano 2010). We show that size distributions of terrestrial taxa exhibiting determinate growth may be evaluated at the spe-cies or the individual-level, but incorporating abundance data across size classes adds to the robustness of these analyses. In contrast habitat driven patterns in the size distributions of aquatic taxa with indeterminate growth may be masked when using mean data. Maximum summary metrics and individual size – density relationships represent more appropriate approaches in this context. Importantly, individual size – density relationships provide a potential useful common currency with which to compare the infl u-ence of habitat structure among ecosystems. However, many questions regarding ecosystem specifi c diff erences remain unanswered. For example, there is a need to tease apart the relative infl uence of terrestrial versus aquatic factors compared to that of the two growth patterns. Possible exam-ples which would allow the separation of these drivers are comparing body size distributions in insects within terrestrial soils and marine sediments (Wall et al. 2005) to understand ecosystem eff ects, and contrasting bird and reptile communi-ties to assess the impact of growth pattern within a single eco-system (Woodward et al. 2005). Other potential directions include exploring the relationships between the diff erent body size distribution indices (Table 1), particularly for those taxa exhibiting indeterminate growth (Reuman et al. 2008). Finally, there remains considerable scope for exploration of the shape of diff erent body size distribution indices in response to other drivers besides habitat structure, such as community
attractor within size classes such that abundance is randomly distributed within the size classes separated by discontinui-ties (Holling 1992, Xu et al. 2010). Rigorous tests of these two hypotheses for multiple taxa are currently lacking.
Th ree important considerations apply to the interpreta-tion of our results. It is critical to tailor the choice of index and analysis to the research question, as diff erent dis-tributions and methods provide contrasting information regarding the distribution of resources among either indi-viduals or species (Table 1; Robson et al. 2005). Equally, the range of drivers aff ecting body size distributions need to be considered. At the habitat-level scale of our analyses, com-petitive interactions will also infl uence body size distribu-tions, and as such may mask the infl uence of habitat structure (Scheff er and van Nes 2006). Th is may partially explain why habitat eff ects were not seen when using certain distribution indices and analyses. Larger scale, regional datasets may provide clearer patterns across indices and analyses, and should be considered for future research. Finally, although we specifi cally chose taxa and systems where habitat is known to have a strong infl uence on body size of associated taxa, and thus the signature of habitat eff ects should be evident within the size distributions, it is possible that where no eff ect was found, that this was a function of a genuine absence of a habitat-body size relationship as opposed to a poorly per-forming index or analysis (suggestions of approaches to quantitatively test this further are presented in the Supplementary material Appendix 1 Text A2). We suggest that the use of multiple datasets, with consistent results within the two fi sh and within the two bird datasets provide support for the interpretations presented. Furthermore, these outcomes support complimentary work within the terrestrial and marine literature. As a result, we suggest that the key outcome of this study is the identifi cation of ISDRs as a potential common currency with which to examine the rela-tionship between habitat structure and community assembly in both terrestrial and marine systems, and among taxa exhibiting indeterminate and determinate growth. ISDRs permit cross-ecosystem comparisons, allowing clarifi cation of the diff erences and similarities among marine and terrestrial systems unbiased by discipline specifi c approaches, and which may be more sensitive to habitat change (Ernest 2013).
Size and vulnerability
Predicting species ’ vulnerabilities to disturbance is of signifi -cant interest to managers as this would allow the develop-ment of appropriate mitigation strategies. Size has been presented as one trait that infl uences this vulnerability: large body size correlates with vulnerability to human activities such as hunting, whereas small species may be particularly susceptible to habitat loss (Owens and Bennett 2000). However, the loss of habitat structure at specifi c scales is likely to infl uence the decline of particular size classes (De la Monta ñ a et al. 2006). Once analysis of similarities (ANOSIM) has been used to identify diff erences in the size distributions of communities associated with diff erent habitat types, similarity percentages (SIMPER; Clarke 1993) may be performed on the same distance matrices used for the ANOSIM, identifying which size classes contribute to similarity among sites of a particular habitat type, and
982
Forys, E. A. and Allen, C. R. 2002. Functional group change within and across scales following invasions and extinctions in the Everglades ecosystem. – Ecosystems 5: 339 – 347.
Froese, R. and Pauly, D. 2012. FishBase. – � www.fi shbase.org � . Graham, N. A. J. and Nash, K. L. 2013. Th e importance of
structural complexity in coral reef ecosystems. – Coral Reefs 32: 315 – 326.
Graham, N. A. J. et al. 2006. Dynamic fragility of oceanic coral reef ecosystems. – Proc. Natl Acad. Sci. USA 103: 8425 – 8429.
Green, A. L. and Bellwood, D. R. 2009. Monitoring functional groups of herbivorousreef fi shes as indicators of coral reef resilience: a practical guide for coral reef managers in the Asia Pacifi c Region. IUCN working group on Climate Change and Coral Reefs. – IUCN, p. 70.
Havlicek, T. D. and Carpenter, S. R. 2001. Pelagic species size distributions in lakes: are they discontinuous? – Limnol. Oceanogr. 46: 1021 – 1033.
Holling, C. S. 1992. Cross-Scale morphology, geometry and dynamics of ecosystems. – Ecol. Monogr. 62: 447 – 502.
Hua, E. et al. 2013. Pattern of benthic biomass size spectra from shallow waters in the east China Seas. – Mar. Biol. 160: 1723 – 1736.
Hughen, K. A. et al. 2004. Abrupt tropical vegetation response to rapid climate changes. – Science 304: 1955 – 1959.
Jennings, S. et al. 2001. Weak cross-species relationships between body size and trophic level belie powerful size-based trophic structuring in fi sh communities. – J. Anim. Ecol. 70: 934 – 944.
Legendre, P. and Legendre, L. 1998. Numerical ecology. – Elsevier Science.
Nash, K. L. et al. 2013. Cross-scale habitat structure drives fi sh body size distributions on coral reefs. – Ecosystems 16: 478 – 490.
Nash, K. L. et al. 2014. Discontinuities, cross-scale patterns and the organization of ecosystems. – Ecology 95: 654 – 667.
O’Gorman, E. J. and Emmerson, M. C. 2011. Body mass – abundance relationships are robust to cascading eff ects in marine food webs. – Oikos 120: 520 – 528.
Owens, I. P. F. and Bennett, P. M. 2000. Ecological basis of extinction risk in birds: habitat loss versus human persecution and introduced predators. – Proc. Natl Acad. Sci. USA 97: 12144 – 12148.
Petchey, O. L. and Belgrano, A. 2010. Body-size distributions and size-spectra: universal indicators of ecological status? – Biol. Lett. 6: 434 – 437.
Peters, R. H. 1983. Th e ecological implications of body size. – Cambridge Univ. Press.
Peterson, G. D. et al. 1998. Ecological resilience, biodiversity and scale. – Ecosystems 1: 6 – 18.
Possingham, M. L. et al. 2004. Species richness and abundance of birds in Mt Lofty Ranges stringybark habitat: 1999 – 2000 survey. – S. Aust. Ornithol. 34: 153 – 169.
Restrepo, C. et al. 1997. Frugivorous birds in fragmented Neotropical montane forests: landscape pattern and body mass distribution. – In: Laurance, W. F. and Bierregaard Jr., R. O. (eds), Tropical forest remnants: ecology, management and conservation of fragmented landscapes. Univ. of Chicago Press, pp. 171 – 189.
Reuman, D. C. et al. 2008. Th ree allometric relations of population density to body mass: theoretical integration and empirical tests in 149 food webs. – Ecol. Lett. 11: 1216 – 1228.
Rice, J. C. 2000. Evaluating fi shery impacts using metrics of community structure. – ICES J. Mar. Sci. 57: 682 – 688.
Robson, B. J. et al. 2005. Methodological and conceptual issues in the search for a relationship between animal body-size distributions and benthic habitat architecture. – Mar. Freshwater Rev. 56: 1 – 11.
Scheff er, M. and van Nes, E. H. 2006. Self-organized similarity, the evolutionary emergence of groups of similar species. – Proc. Natl Acad. Sci. USA 103: 6230 – 6235.
interactions and phylogeny, which may be evident at diff erent spatial or temporal scales (Allen et al. 2006).
Acknowledgements – Th is work was supported by Th e US Geological Survey ’ s John Wesley Powell Centre for Analysis and Synthesis. Collection of fi sh data was supported by the Queensland Smart Futures Fund and the Australian Research Council. Th ank you to Hugh Possingham and the Nature Conservation Society of South Australia for the use of the Lofty Ranges dataset, and to Daniel Cleary and co-authors for availability of the Borneo data. Th e Nebraska Cooperative Fish and Wildlife Research Unit is jointly supported by a cooperative agreement among the US Geological Survey, the Nebraska Game and Parks Commission, the University of Nebraska, the US Fish and Wildlife Service and the Wildlife Management Institute. Any use of trade names is for descriptive purposes only and does not imply endorsement by the US goverment. Fish and bird graphics courtesy of Tracey Saxby: Integration and Application Network, � http://ian.umces.edu/imagelibrary/ � .
References
Allen, C. R. et al. 2006. Patterns in body mass distributions: sifting among alternative hypotheses. – Ecol. Lett. 9: 630 – 643.
Ashton, K. G. 2002. Patterns of within-species body size variation of birds: strong evidence for Bergmann’s rule. – Global Ecol. Biogeogr. 11: 505 – 523.
Blackburn, T. M. and Gaston, K. J. 1994. Animal body size distri-butions: patterns, mechanisms and implications. – Trends Ecol. Evol. 9: 471 – 474.
Choat, J. H. and Robertson, D. R. 2002. Age-based studies on coral reef fi shes. – In: Sale, P. F. (ed.), Coral reef fi shes: dynamics and diversity in a complex ecosystem. Academic Press, Elsevier Science, pp. 57 – 80.
Clarke, K. R. 1993. Non-parametric multivariate analyses of changes in community structure. – Aust. J. Ecol. 18: 117 – 143.
Clarke, K. R. and Warwick, R. M. 2001. Change in marine com-munities: an approach to statistical analysis and interpretation. – PRIMER-E, Plymouth.
Cleary, D. F. R. et al. 2007. Bird species and traits associated with logged and unlogged forest in Borneo. – Ecol. Appl. 17: 1184 – 1197.
Cumming, G. S. and Havlicek, T. D. 2002. Evolution, ecology and multimodal distributions of body size. – Ecosyst. 5: 705 – 711.
De la Monta ñ a, E. et al. 2006. Response of bird communities to silvicultural thinning of Mediterranean maquis. – J. Appl. Ecol. 43: 651 – 659.
DeMartini, E. E. et al. 2008. Diff erences in fi sh-assemblage struc-ture between fi shed and unfi shed atolls in the northern Line Islands, central Pacifi c. – Mar. Ecol. Prog. Ser. 365: 199 – 215.
Doledec, S. and Statzner, B. 1994. Th eoretical habitat templets, species traits and species richness: 548 plant and animal species in the Upper Rh ô ne River and its fl oodplain. – Freshwater Biol. 31: 523 – 538.
Dunning Jr., J. B. (ed.) 2008. CRC handbook of avian body masses. – CRC Press.
Ernest, S. K. M. 2005. Body size, energy use and community structure of small mammals. – Ecology 86: 1407 – 1413.
Ernest, S. K. M. 2013. Using size distributions to understand the role of body size in mammalian community assembly. – In: Smith, F. A. and Lyons, S. K. (eds), Animal body size. Univ. of Chicago Press.
Fischer, J. et al. 2008. Th e role of landscape texture in conservation biogeography: a case study on birds in southeastern Australia. – Divers. Distrib. 14: 38 – 46.
983
Webb, T. J. et al. 2011. Th e birds and the seas: body size reconciles diff erences in the abundance – occupancy relation-ship across marine and terrestrial vertebrates. – Oikos 120: 537 – 549.
White, E. P. et al. 2007. Relationships between body size and abundance in ecology. – Trends Ecol. Evol. 22: 323 – 330.
Wiens, J. A. 1989. Spatial scaling in ecology. – Funct. Ecol. 3: 385 – 397.
Woodward, G. et al. 2005. Body size in ecological networks. – Trends Ecol. Evol. 20: 402 – 409.
Xu, L. et al. 2010. Hypothesis tests on mixture model components with applications in ecology and agriculture. – J. Agric. Biol. Environ. Stat. 15: 308 – 326.
Yvon-Durocher, G. and Allen, A. P. 2012. Linking community size structure and ecosystem functioning using metabolic theory. – Phil. Trans. R. Soc. B 367: 2998 – 3007.
Shurin, J. B. et al. 2006. All wet or dried up? Real diff erences between aquatic and terrestrial food webs. – Proc. R. Soc. B 273: 1 – 9.
Silverman, B. W. 1986. Density estimation for statistics and data analysis. – Chapman and Hall/CRC Press.
Smith, C. and Wootton, R. 1995. Th e costs of parental care in teleost fi shes. – Rev. Fish Biol. Fish. 5: 7 – 22.
Th ibault, K. M. et al. 2011. Multimodality in the individual size distributions of bird communities. – Global Ecol. Biogeogr. 20: 145 – 153.
Wall, D. H. et al. 2005. Soils, freshwater and marine sediments: the need for integrative landscape science. – Mar. Ecol. Prog. Ser. 304: 271 – 307.
Wardwell, D. A. et al. 2008. A test of the cross-scale resilience model: functional richness in Mediterranean-climate ecosystems. – Ecol. Complex. 5: 165 – 182.
Supplemenaty material (available online as Appendix oik-01314 at � www.oikosjournal.org/readers/appendix � ). Appendix 1.