had cm3 hadley centre coupled model ,version
TRANSCRIPT


HadCM3Hadley Centre Coupled Model ,version

HadCM3
• Abbreviation for Hadley Centre Coupled Model, version 3
• coupled atmosphere-ocean general circulation model (AOGCM) developed at the Hadley Centre in the United Kingdom
• the major models used in the IPCC Third Assessment Report in 2001
• HadCM3 does not need flux adjustment (additional "artificial" heat and freshwater fluxes at the ocean surface) to produce a good simulation
• HadCM3 is composed of two components: the atmospheric model HadAM3 and the ocean model (which includes a sea ice model).

HadCM3
• HadCM3 atmospheric model (HadAM3) is a grid point model and has a horizontal resolution of 3.75×2.5 degrees in longitude × latitude
• This gives 96×73 grid points on the scalar (pressure, temperature and moisture) grid; the vector (wind velocity) grid is offset by 1/2 a grid box.
• ocean model (HadOM3) has a resolution of 1.25×1.25 degrees,
• HadCM3 deals with the land and sea surface temperatures, precipitation, ocean circulation and vegetation

HadCM3
• HadCM3 has been heavily used during the last 15 years for a range of future (and past) climate change studies but is now largely being replaced by more recent models

HadCM3Atmosphere
Temperature
• more than 10 thousand stations for temperature
• More than 25 thousand stations for precipitation
• .The differences between the 1960–1990 climate means compared to the 1860–1890 climate means
• mean warming between the two periods being 0.6 C◦
HadCM3Atmosphere


HadCM3Precipitation
• Deals with frontal, convective and mesoscale.
• Convective precipitation is generally more intense, and of shorter duration, than stratiform precipitation. Orographic precipitation occurs when moist air is forced upwards over rising terrain, such as a mountain. Precipitation can also fall in either liquid or solid phases, or transition between them.
• Stratiform precipitation, in general, is relatively continuous and uniform in intensity (i.e., steady rain versus rain showers).
• Mesoscale an intermediate scale between those of weather systems and of microclimates, on which storms and other phenomena occur

HadCM3Precipitation
• Monsoonal regions of south-east Asia,Austral-Asia,southern South America, Westland central Africa, over estimate precipitation by 0.5 mm day−1 to 2 mm day−1
• Precipitation in the Indian and northern arm of the South American 10 region by 1mm day−1 to 4 mm day−1∼• It is also noted that an increase in resolution does not produce a
noticeable improvement on spatial annual precipitation bias in certain monsoon regions
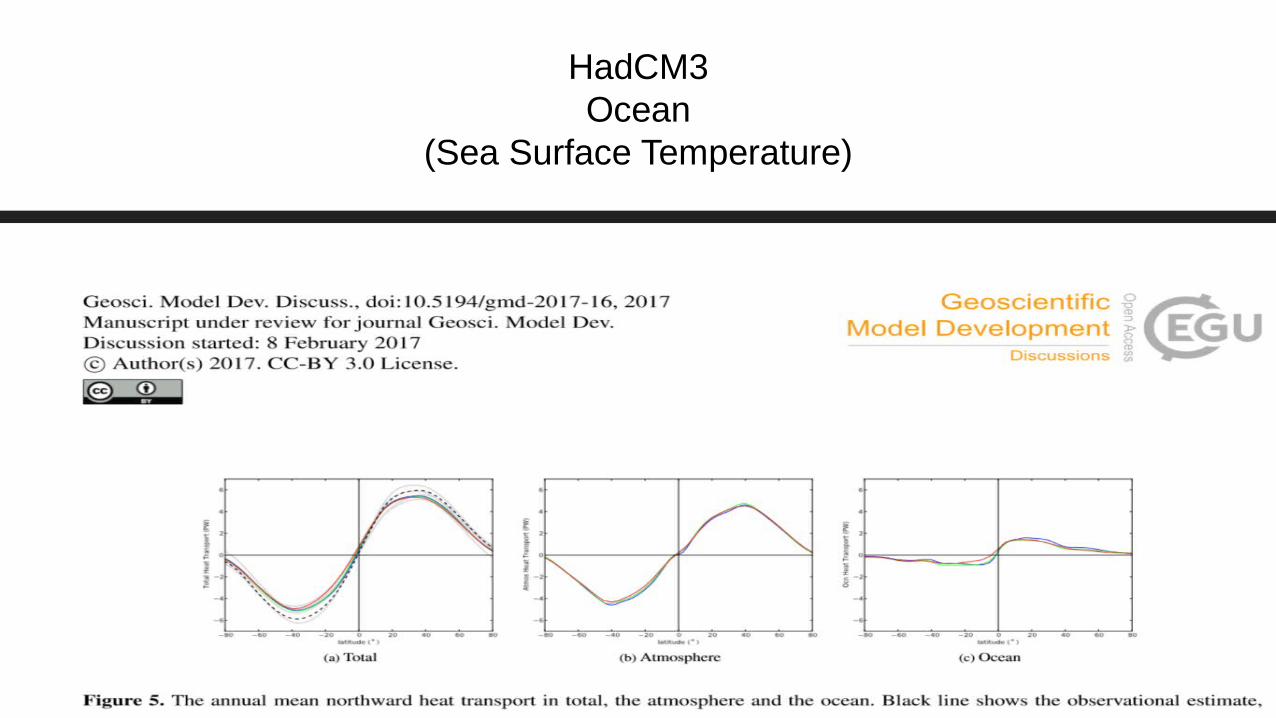
HadCM3Ocean
(Sea Surface Temperature)

HadCM3Sea Surface Salinity
• in the global average, the models show a fresh bias of about 0.5 gkg−1
• exhibiting higher salinities (up to 10 gkg−1) in the Kara Sea and generally north of Russia. Generally lower salinities (of up to 5 gkg−1) are found in the10 Chukchi and Beaufort seas.
• The largest differences are found in enclosed or semi-enclosed basins,
HadCM3Land
(Vegetation Distribution)
• These models have a simple representation of terrestrial vegetation, with five plant functional types that each covers a large climatic range.
• The broadleaf trees in the models have a known problem of extending too far, especially in the Southern Hemisphere, and this can be seen in Fig. The southern mid-latitudes are difficult to capture accurately, for a variety of reasons, including the challenge of precipitation patterns in this region.

HadCM3Land
(Vegetation Distribution)
