haemodynamic monitoring - pulsion€¦ · key points • standard monitoring does not give...
TRANSCRIPT
Haemodynamic Monitoring
Dr. Wouter De Corte
az groeninge Kortrijk
2
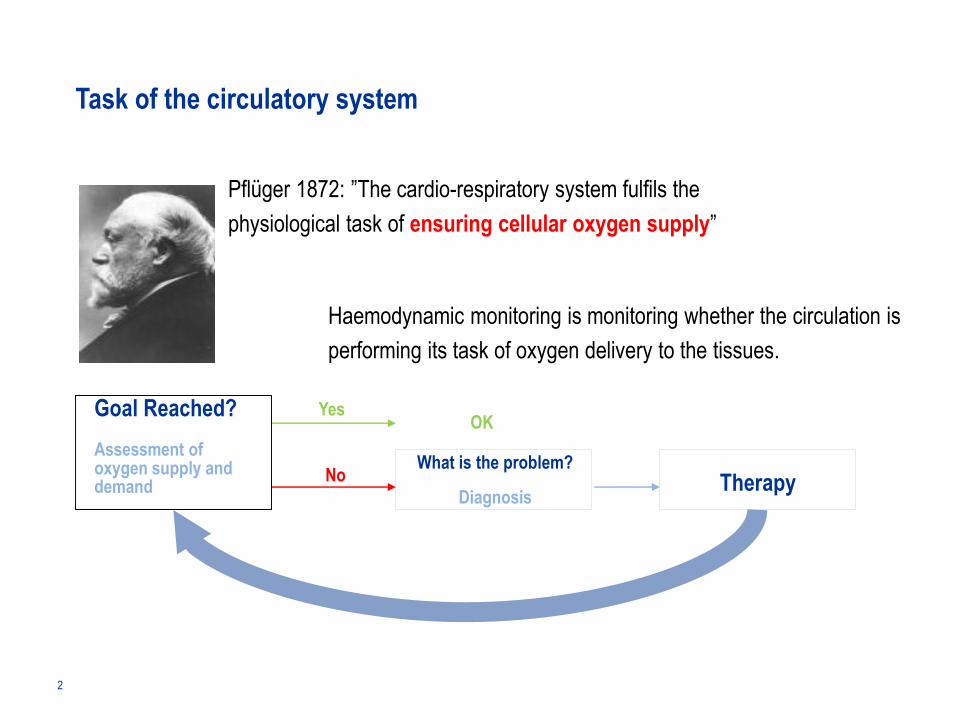
Task of the circulatory system
Pflüger 1872: ”The cardio-respiratory system fulfils the
physiological task of ensuring cellular oxygen supply”
Goal Reached?
Assessment of oxygen supply and demand
OK
No
Yes
What is the problem?
DiagnosisTherapy
Haemodynamic monitoring is monitoring whether the circulation is
performing its task of oxygen delivery to the tissues.
3
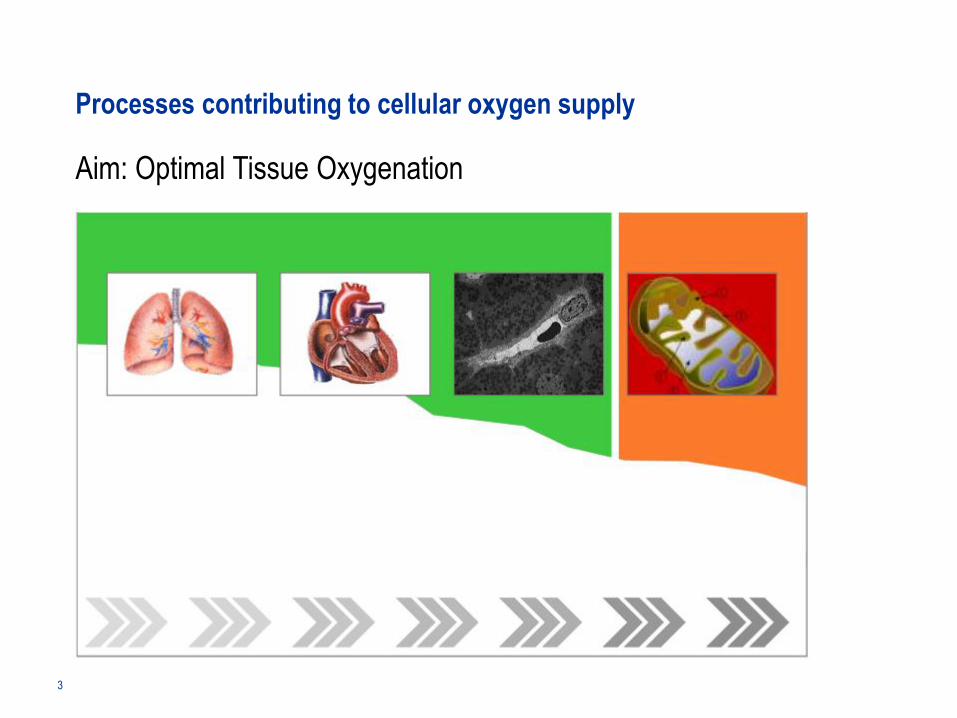
Processes contributing to cellular oxygen supply
Aim: Optimal Tissue Oxygenation
Pulmonary gas exchange Macrocirculation Microcirculation Cell function
Direct Control Indirect
Oxygen AbsorptionLungs
Oxygen TransportationBlood
Oxygen DeliveryTissues
Oxygen UtilisationCells / Mitochondria
Volume Catecholamines
Oxygen carriers Ventilation
4
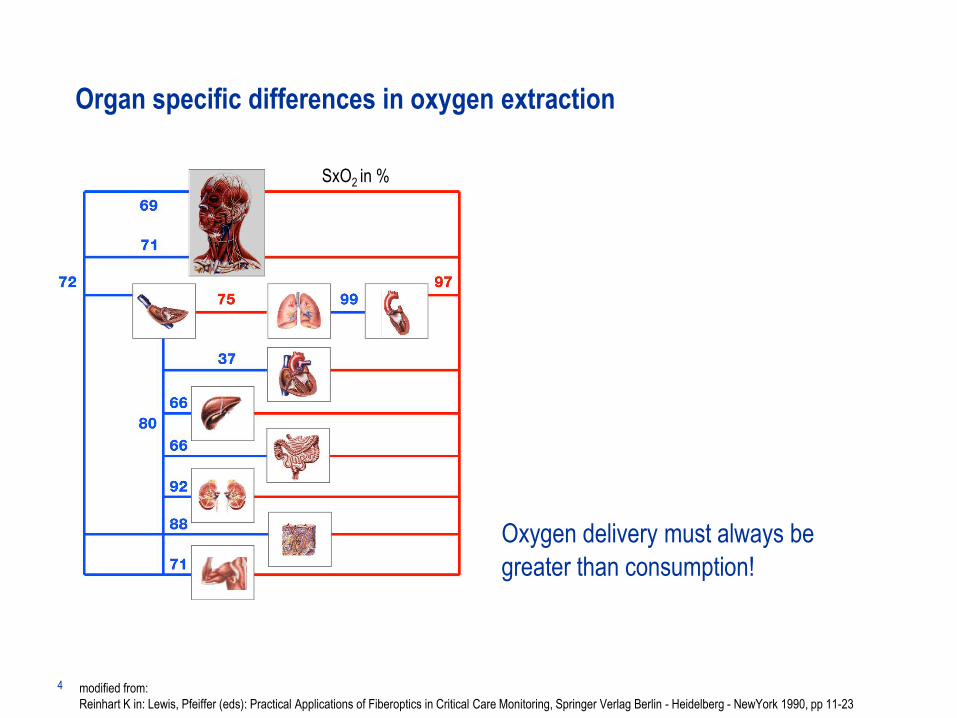
Organ specific differences in oxygen extraction
Oxygen delivery must always be
greater than consumption!
SxO2 in %
modified from:
Reinhart K in: Lewis, Pfeiffer (eds): Practical Applications of Fiberoptics in Critical Care Monitoring, Springer Verlag Berlin - Heidelberg - NewYork 1990, pp 11-23
5
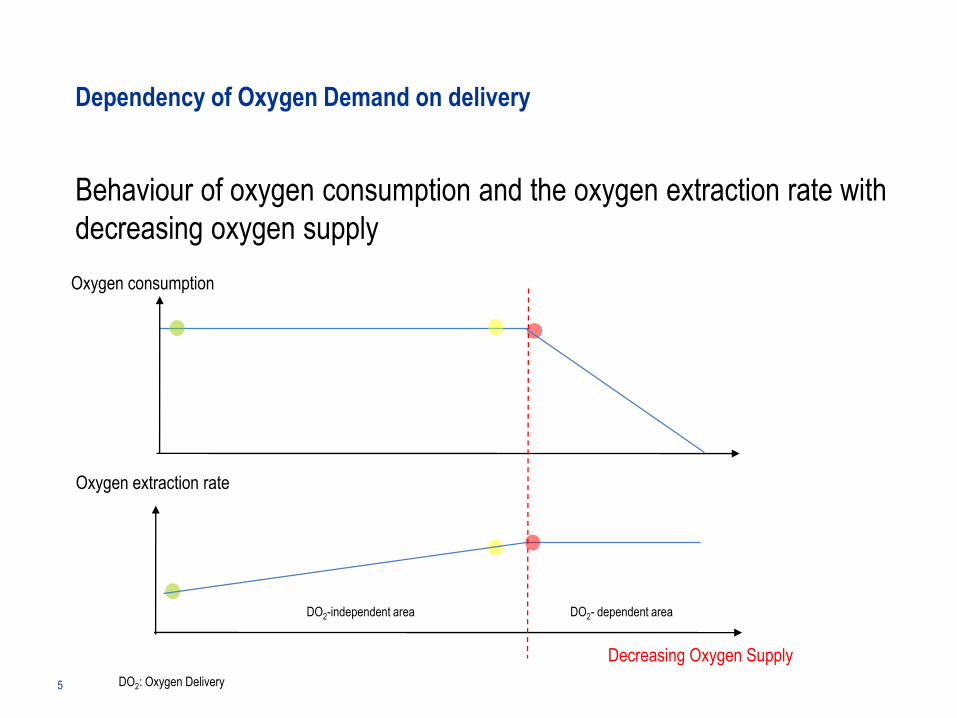
Dependency of Oxygen Demand on delivery
Behaviour of oxygen consumption and the oxygen extraction rate with
decreasing oxygen supply
Oxygen consumption
DO2-independent area DO2- dependent area
Oxygen extraction rate
Decreasing Oxygen Supply
DO2: Oxygen Delivery
6
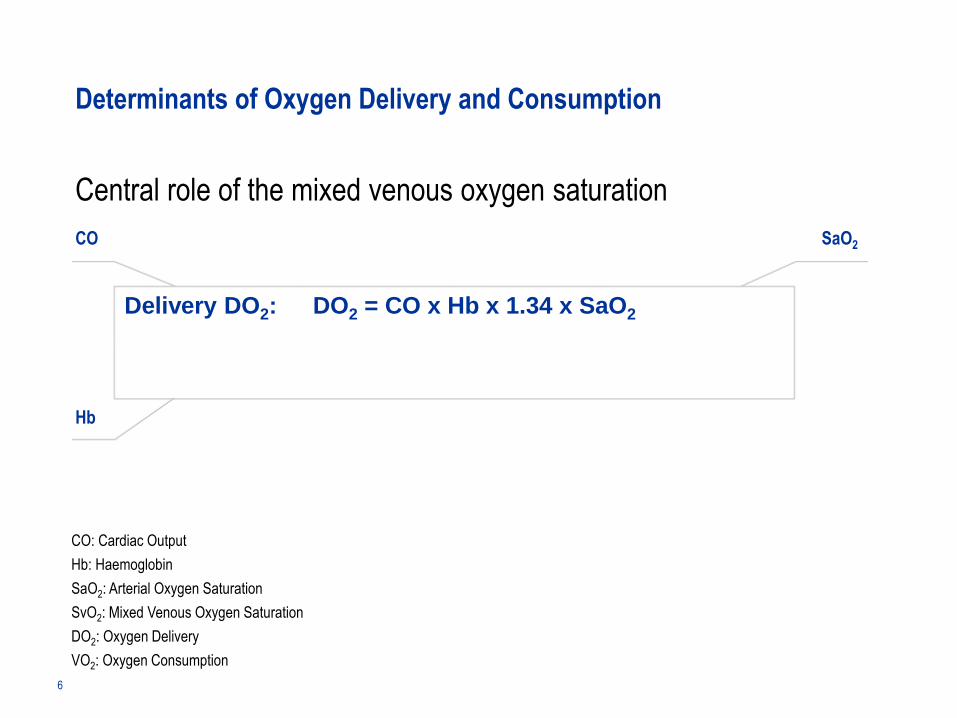
Central role of the mixed venous oxygen saturation
Determinants of Oxygen Delivery and Consumption
Delivery DO2: DO2 = CO x Hb x 1.34 x SaO2
CO: Cardiac Output
Hb: Haemoglobin
SaO2: Arterial Oxygen Saturation
SvO2: Mixed Venous Oxygen Saturation
DO2: Oxygen Delivery
VO2: Oxygen Consumption
SaO2CO
Hb
7
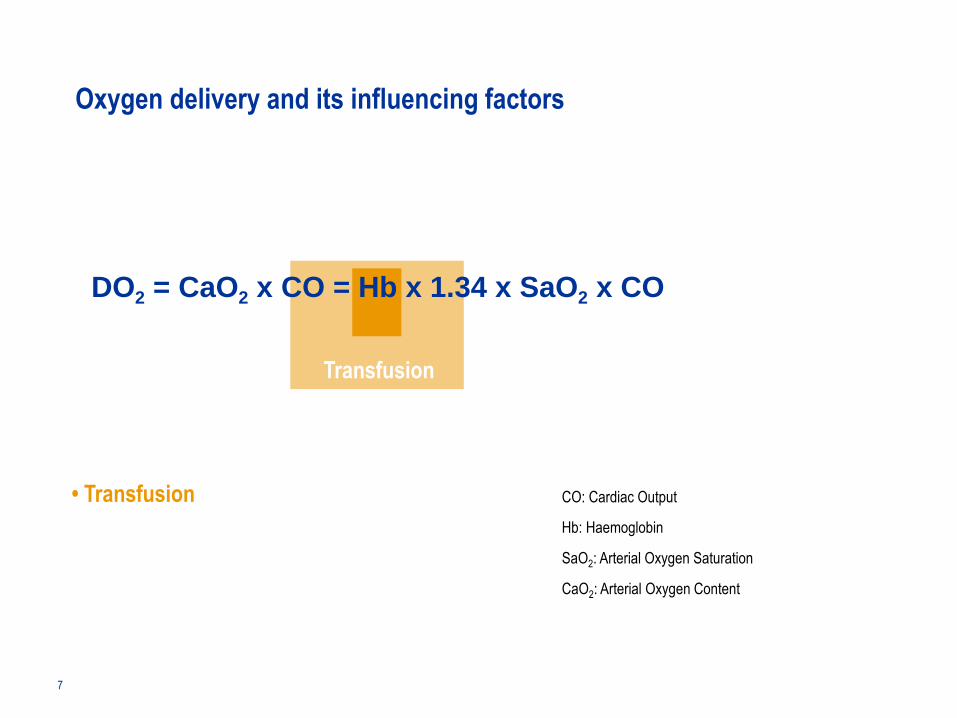
Oxygen delivery and its influencing factors
DO2 = CaO2 x CO = Hb x 1.34 x SaO2 x CO
Transfusion
• Transfusion CO: Cardiac Output
Hb: Haemoglobin
SaO2: Arterial Oxygen Saturation
CaO2: Arterial Oxygen Content
8
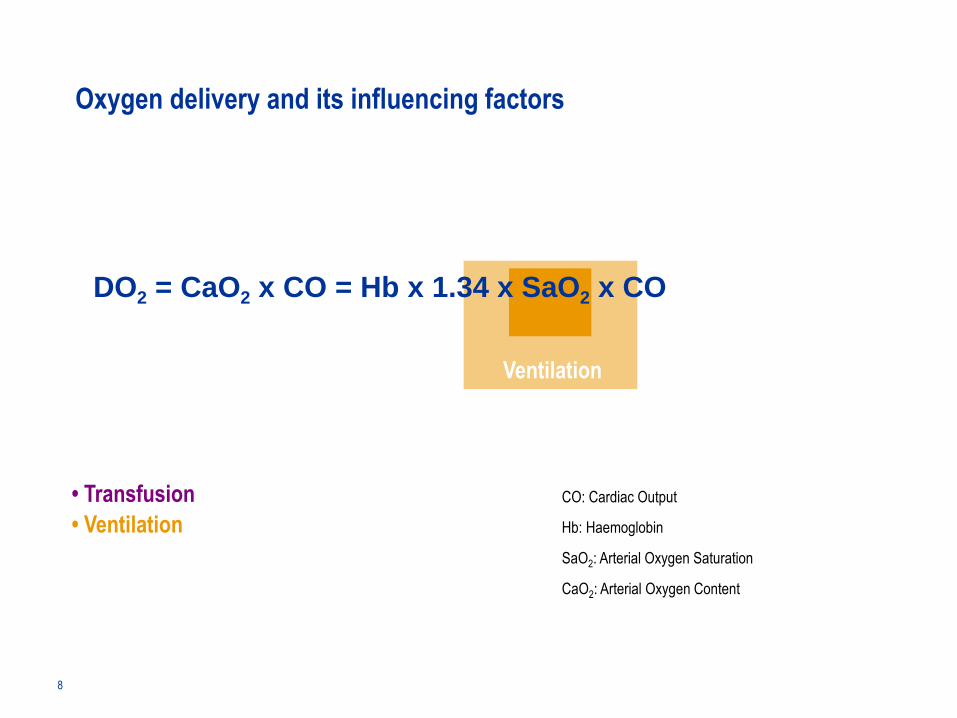
Oxygen delivery and its influencing factors
DO2 = CaO2 x CO = Hb x 1.34 x SaO2 x CO
Ventilation
• Transfusion
• Ventilation
CO: Cardiac Output
Hb: Haemoglobin
SaO2: Arterial Oxygen Saturation
CaO2: Arterial Oxygen Content
9
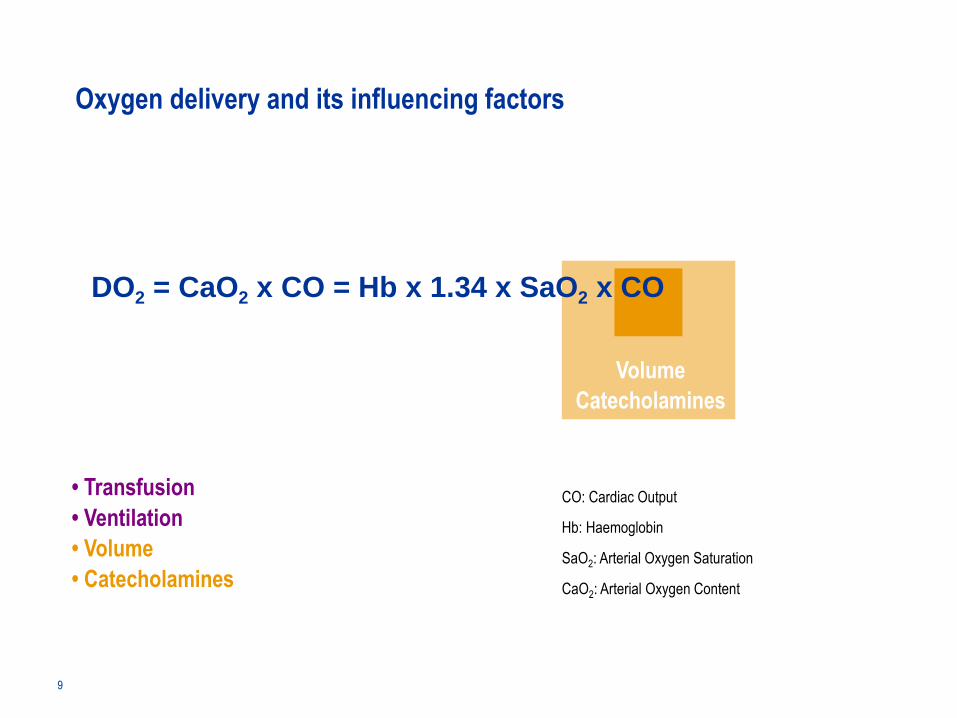
Oxygen delivery and its influencing factors
DO2 = CaO2 x CO = Hb x 1.34 x SaO2 x CO
Volume
Catecholamines
• Transfusion
• Ventilation
• Volume
• Catecholamines
CO: Cardiac Output
Hb: Haemoglobin
SaO2: Arterial Oxygen Saturation
CaO2: Arterial Oxygen Content
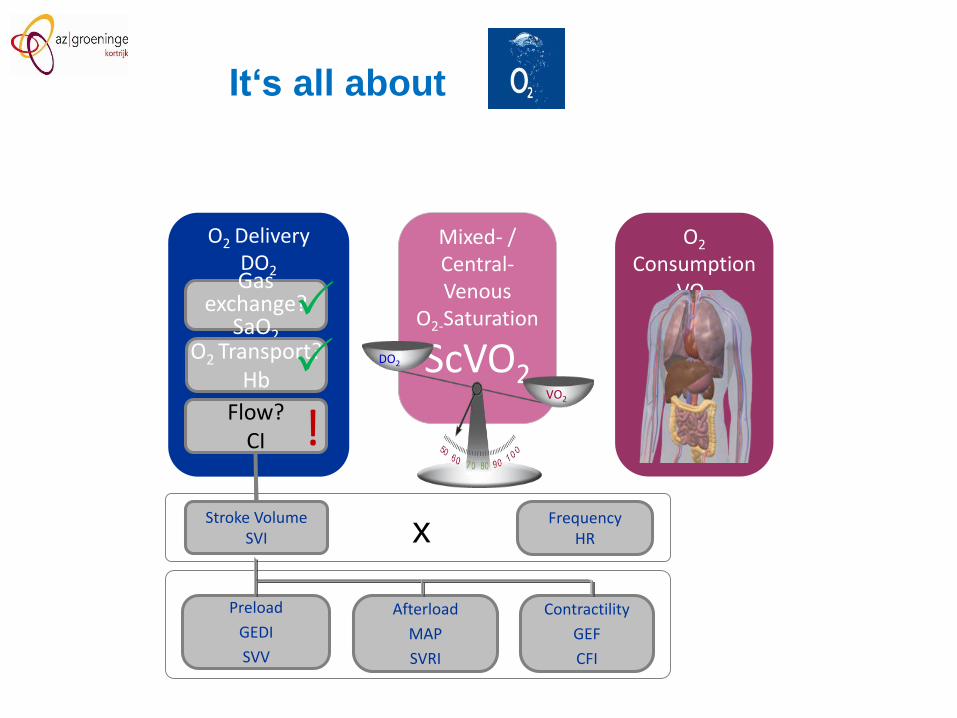
O2 Delivery DO2Gas
exchange?SaO2
O2 Transport?Hb
Flow?CI
O2
ConsumptionVO2
Mixed- / Central-Venous
O2-Saturation
ScVO2DO2
VO2
!
xStroke Volume
SVIFrequency
HR
Preload
GEDI
SVV
Afterload
MAP
SVRI
Contractility
GEF
CFI
It‘s all about
11
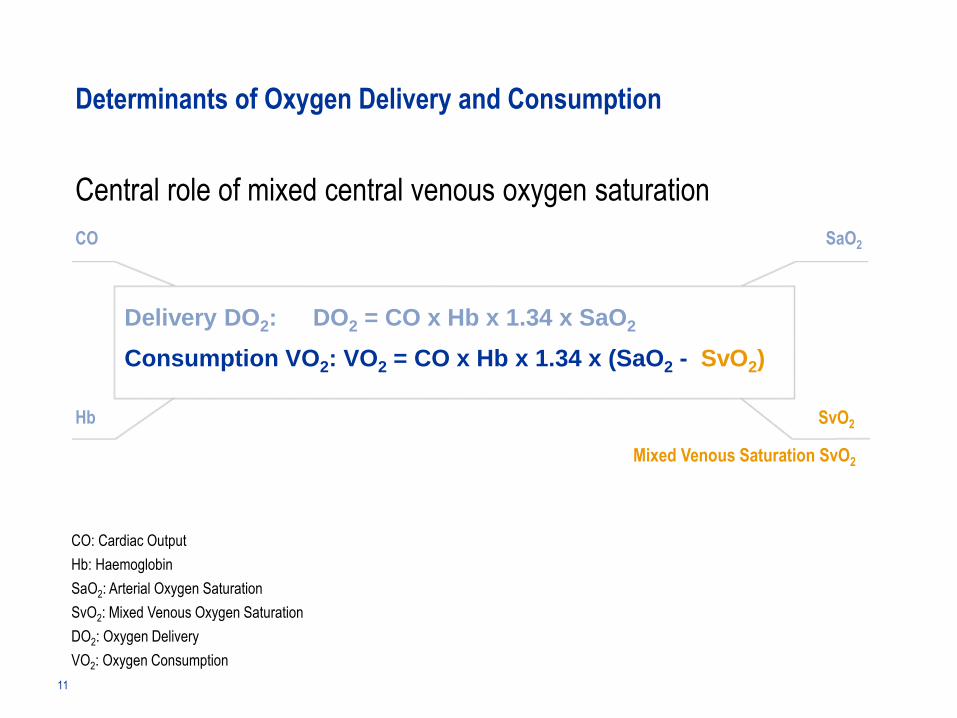
Central role of mixed central venous oxygen saturation
Determinants of Oxygen Delivery and Consumption
SaO2
S(c)vO2
Consumption VO2: VO2 = CO x Hb x 1.34 x (SaO2 - SvO2)
Delivery DO2: DO2 = CO x Hb x 1.34 x SaO2
CO
Hb
Mixed Venous Saturation SvO2
SvO2
CO: Cardiac Output
Hb: Haemoglobin
SaO2: Arterial Oxygen Saturation
SvO2: Mixed Venous Oxygen Saturation
DO2: Oxygen Delivery
VO2: Oxygen Consumption
12
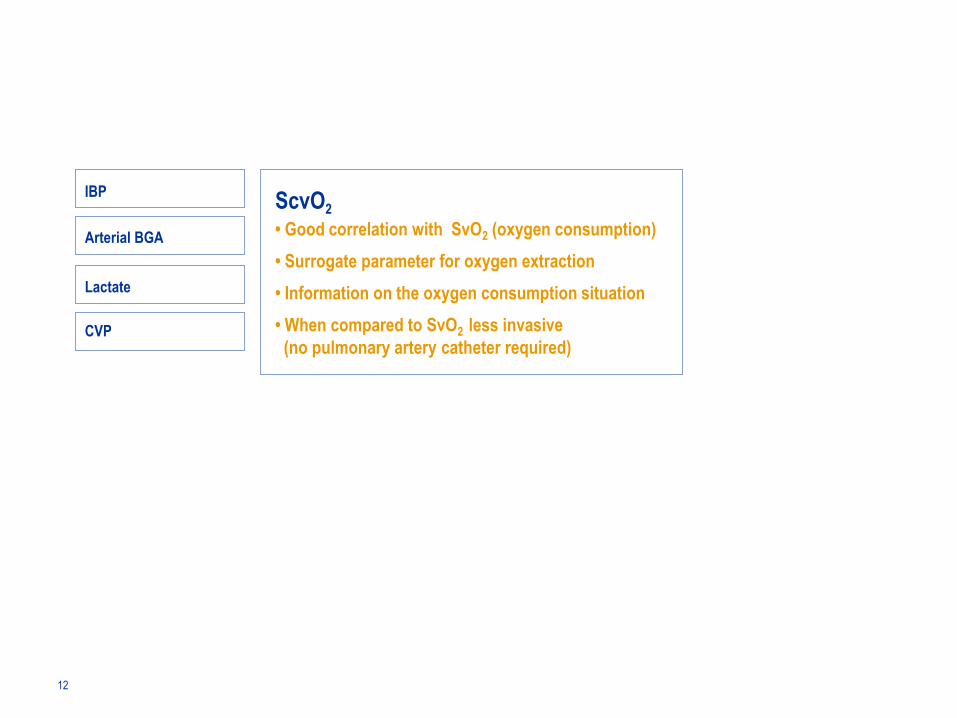
IBPScvO2
• Good correlation with SvO2 (oxygen consumption)
• Surrogate parameter for oxygen extraction
• Information on the oxygen consumption situation
• When compared to SvO2 less invasive
(no pulmonary artery catheter required)
Arterial BGA
Lactate
CVP
13
Key Points
• The purpose of the circulation is cellular oxygenation
• For an optimal oxygen supply at the cellular level the macro and micro-circulation
as well as the pulmonary gas exchange have to be in optimal balance
• Next to CO, Hb and SaO2 is SvO2 which plays a central role in the assessment of
oxygen supply and consumption
• No single parameter provides enough information for a full assessment of oxygen
supply to the tissues.
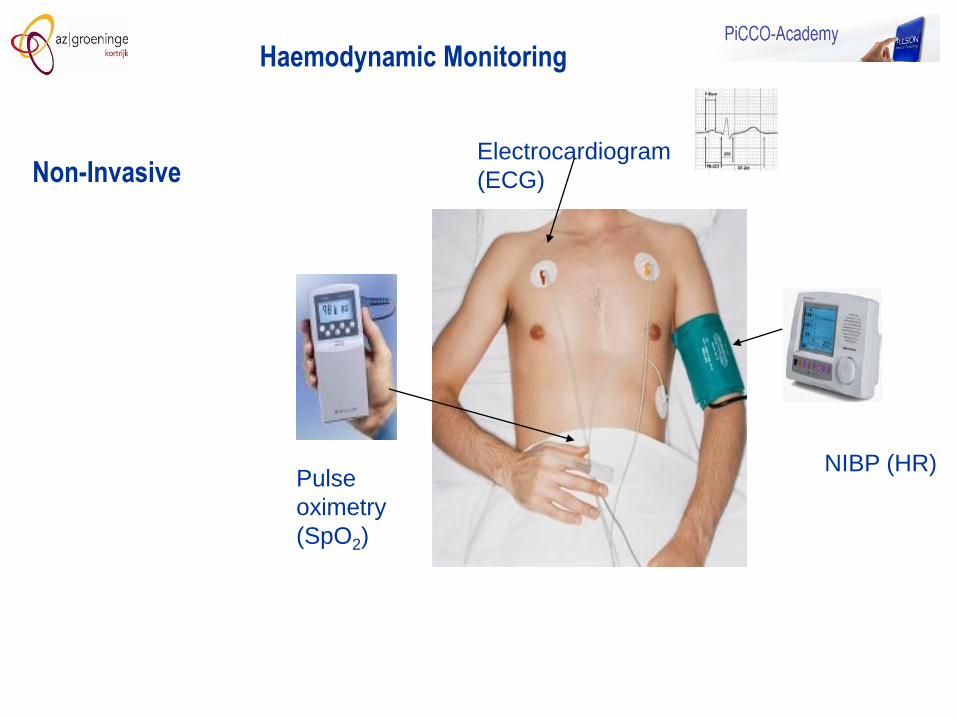
Electrocardiogram
(ECG)
Pulse
oximetry
(SpO2)
NIBP (HR)
Haemodynamic Monitoring
Non-Invasive
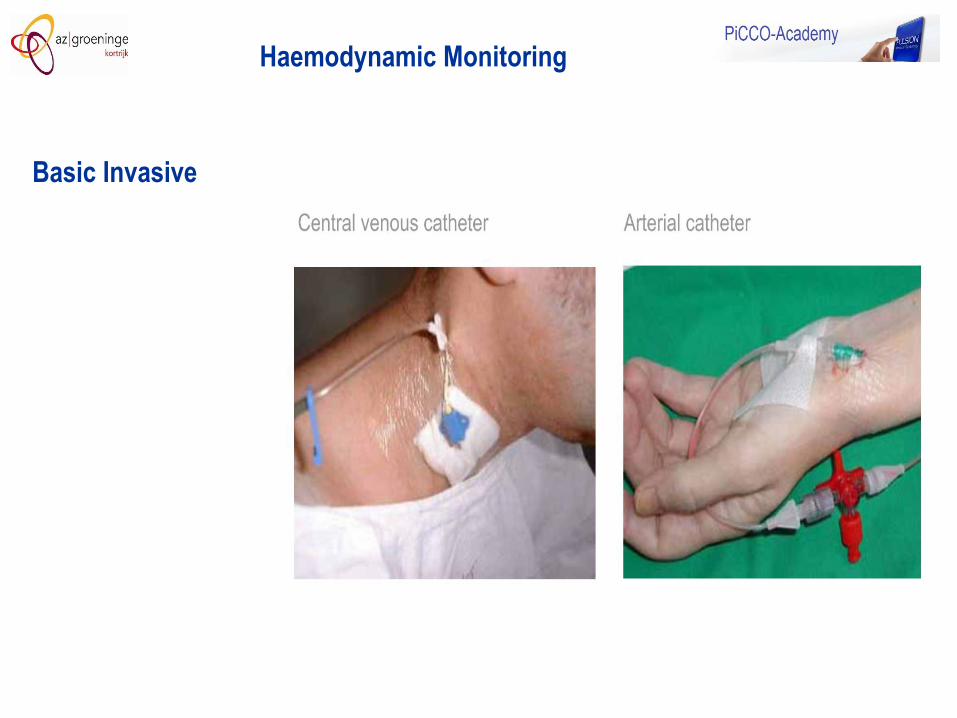
Haemodynamic Monitoring
Basic Invasive
16
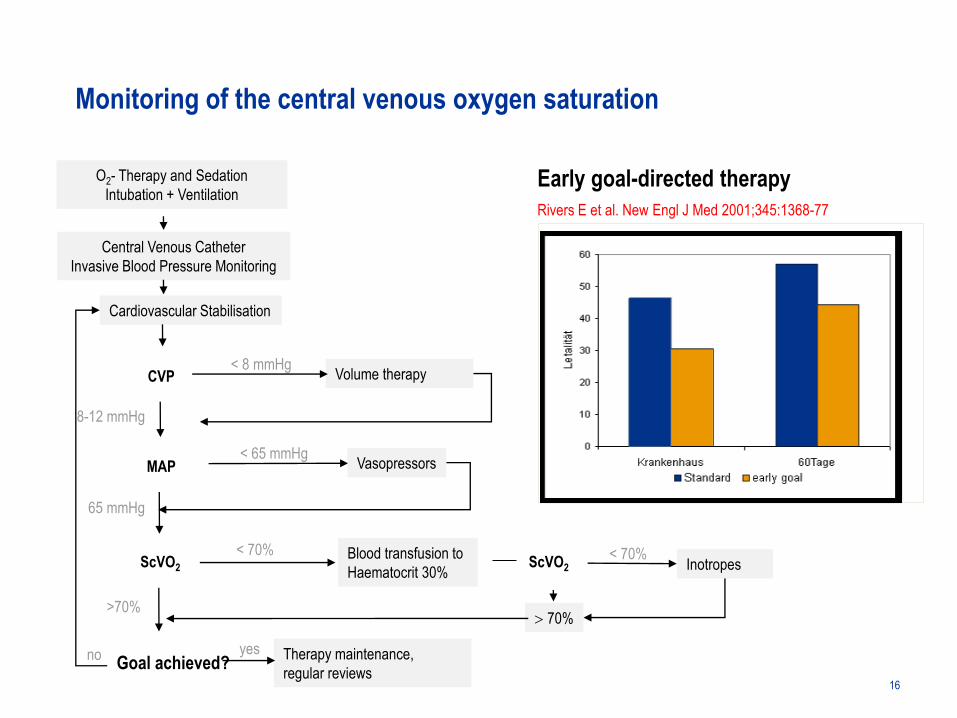
Early goal-directed therapy
Rivers E et al. New Engl J Med 2001;345:1368-77
O2- Therapy and Sedation
Intubation + Ventilation
Central Venous Catheter
Invasive Blood Pressure Monitoring
CVP
MAP
ScVO2
Cardiovascular Stabilisation
Volume therapy
8-12 mmHg
< 8 mmHg
65 mmHg
Inotropes
>70% 70%
< 70%
no Therapy maintenance,
regular reviews
< 65 mmHgVasopressors
Blood transfusion to
Haematocrit 30%
Monitoring of the central venous oxygen saturation
< 70%
Goal achieved?yes
ScVO2
Hospital 60 days
Mo
rtality
Key Points
• Standard monitoring does not give information re the volume status or the
adequacy of oxygen delivery and consumption.
• The CVP is not a valid parameter to measure volume status
• The measurement of central venous oxygen saturation gives important
information over global oxygenation balance and oxygen extraction
• Measuring the central venous oxygenation can reveal when more
advanced monitoring is indicated
17
18
What other parameters do I need?
Advanced Monitoring
The standard parameters do not give
enough information in unstable patients.
19
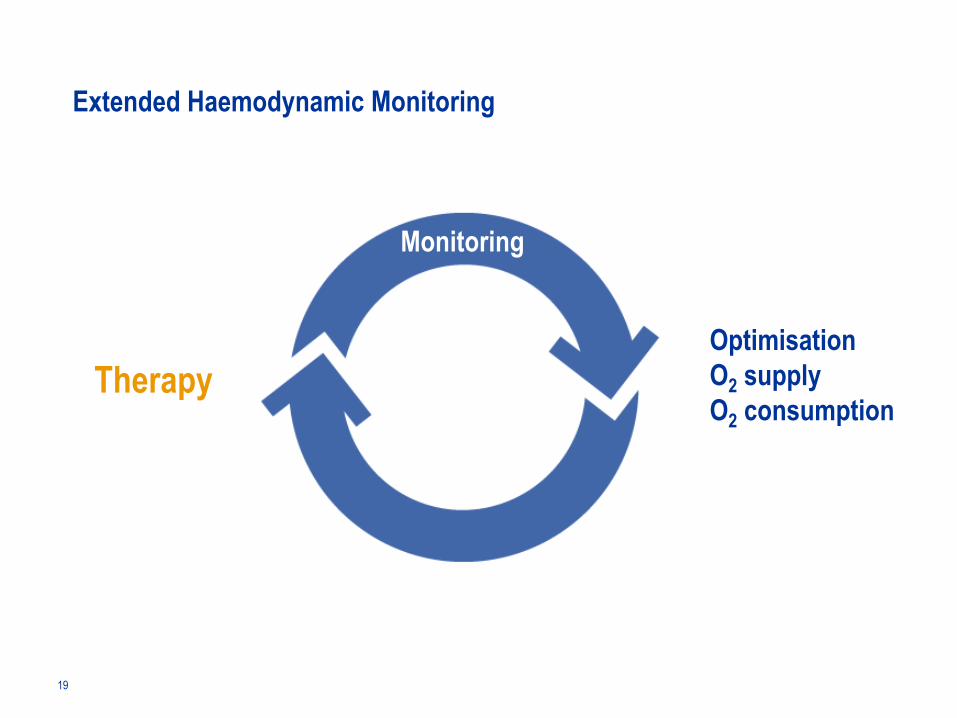
Extended Haemodynamic Monitoring
TherapyOptimisation
O2 supply
O2 consumption
Monitoring
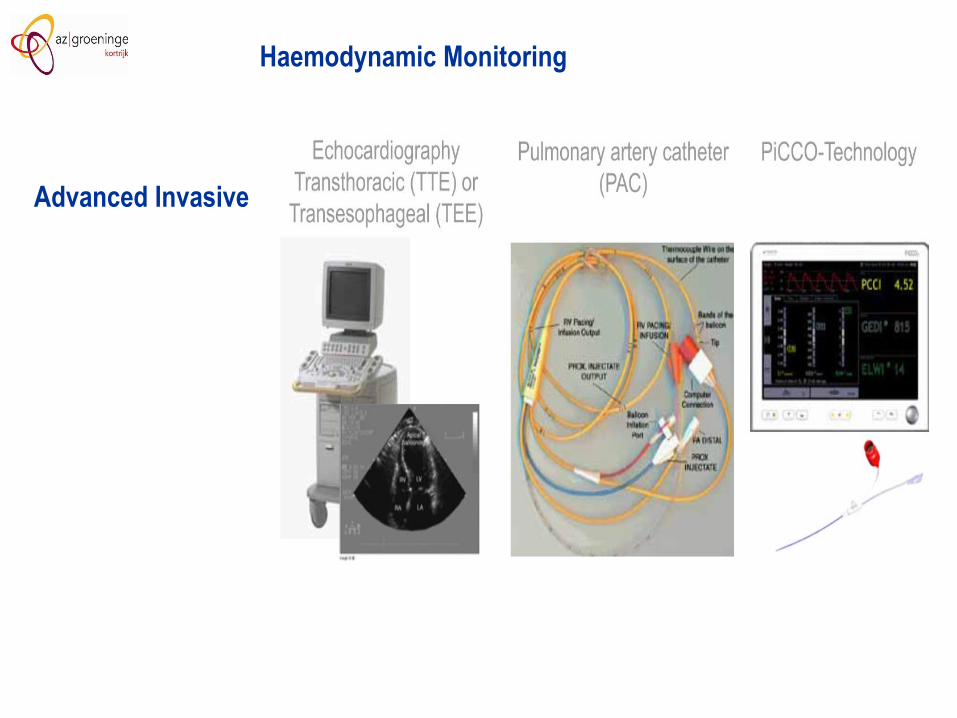
Advanced Invasive
Haemodynamic Monitoring
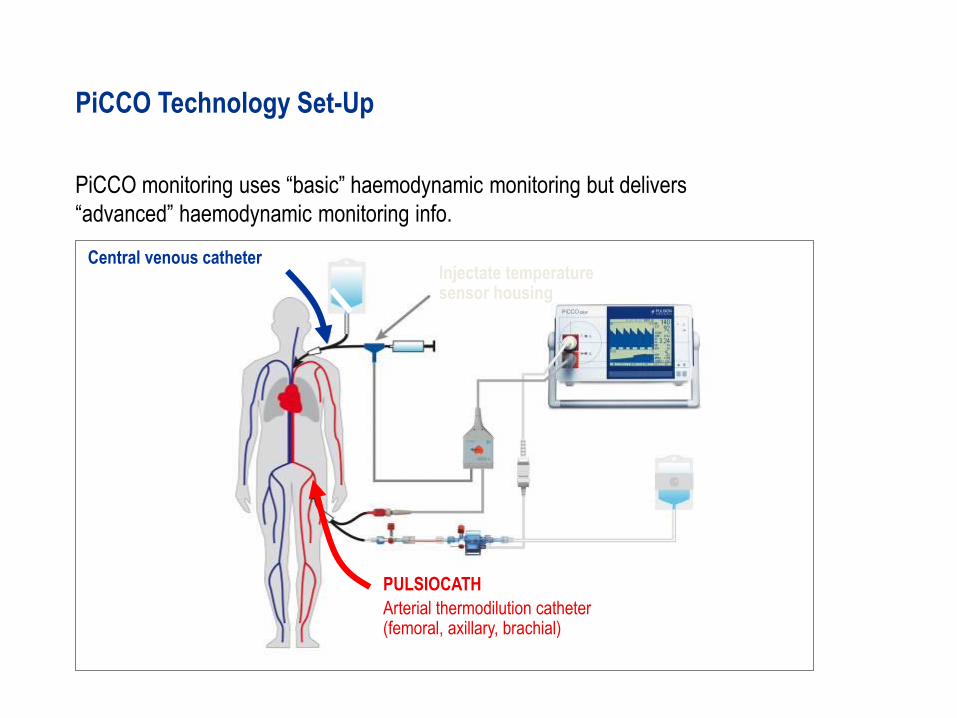
PiCCO monitoring uses “basic” haemodynamic monitoring but delivers
“advanced” haemodynamic monitoring info.
PiCCO Technology Set-Up
Central venous catheter
PULSIOCATH
Arterial thermodilution catheter (femoral, axillary, brachial)
Injectate temperature sensor housing
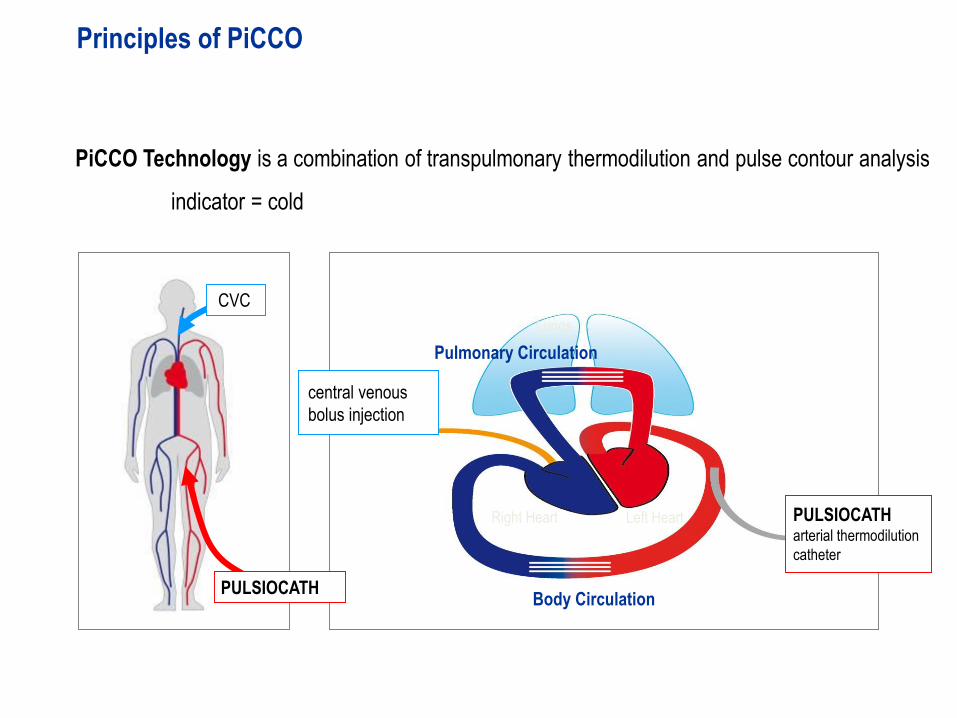
PiCCO Technology is a combination of transpulmonary thermodilution and pulse contour analysis
indicator = cold
Principles of PiCCO
Left HeartRight Heart
Pulmonary Circulation
Lungs
Body CirculationPULSIOCATHPULSIOCATH
CVC
PULSIOCATH arterial thermodilution
catheter
central venous
bolus injection
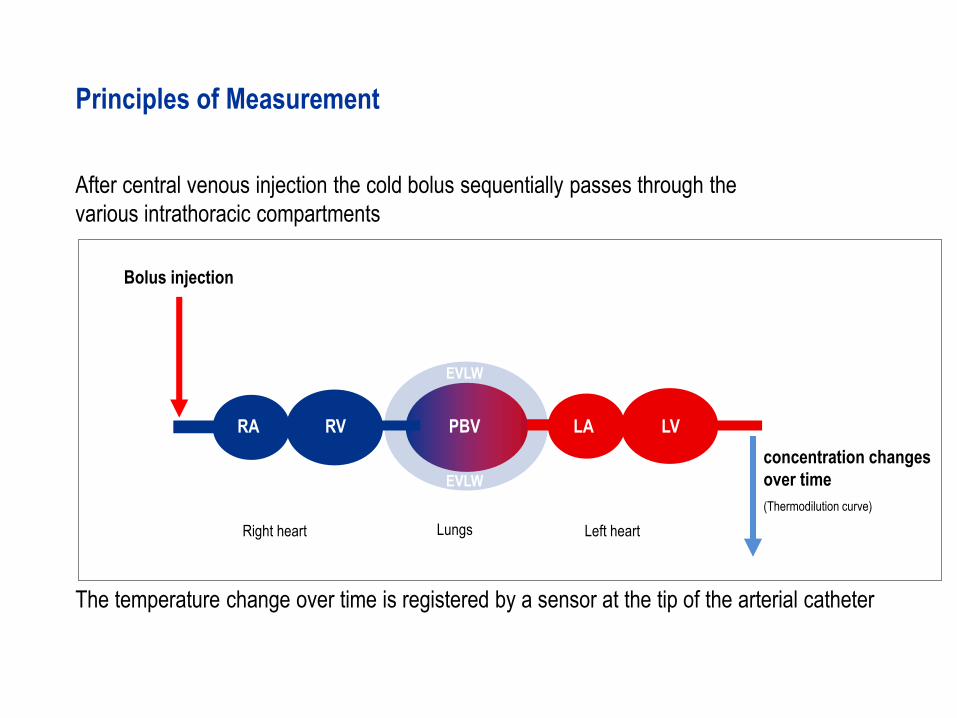
Bolus injection
concentration changes
over time
(Thermodilution curve)
After central venous injection the cold bolus sequentially passes through the
various intrathoracic compartments
The temperature change over time is registered by a sensor at the tip of the arterial catheter
Left heartRight heart Lungs
RA RV LA LVPBV
EVLW
EVLW
Principles of Measurement
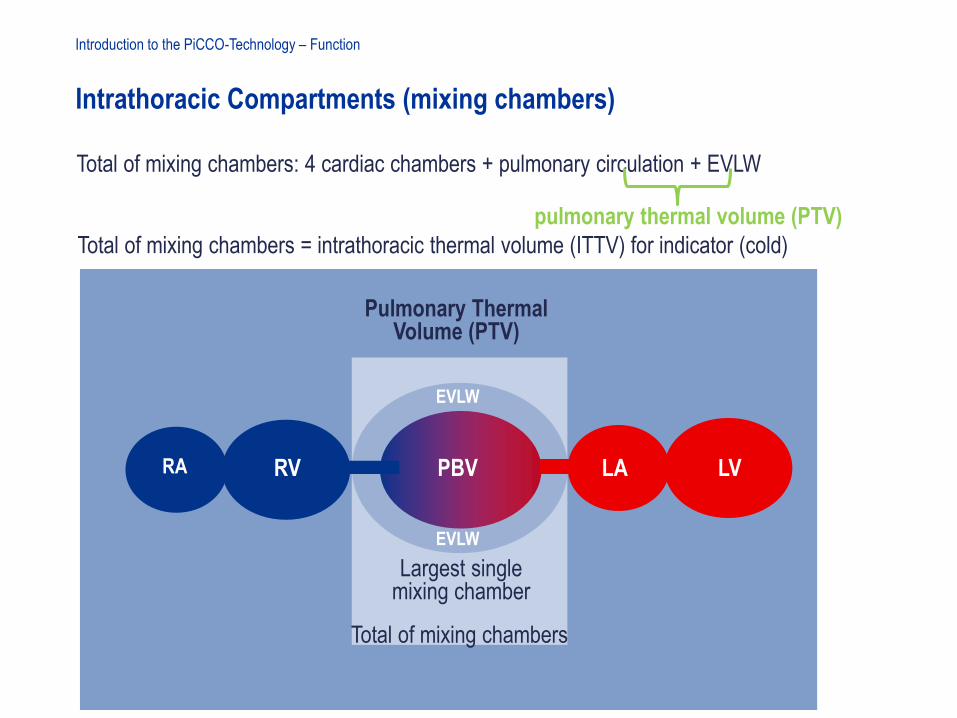
Intrathoracic Compartments (mixing chambers)
Introduction to the PiCCO-Technology – Function
Pulmonary Thermal Volume (PTV)
Total of mixing chambers = intrathoracic thermal volume (ITTV) for indicator (cold)
RA RV LA LVPBV
EVLW
EVLW
Largest single mixing chamber
Total of mixing chambers: 4 cardiac chambers + pulmonary circulation + EVLW
Total of mixing chambers
pulmonary thermal volume (PTV)
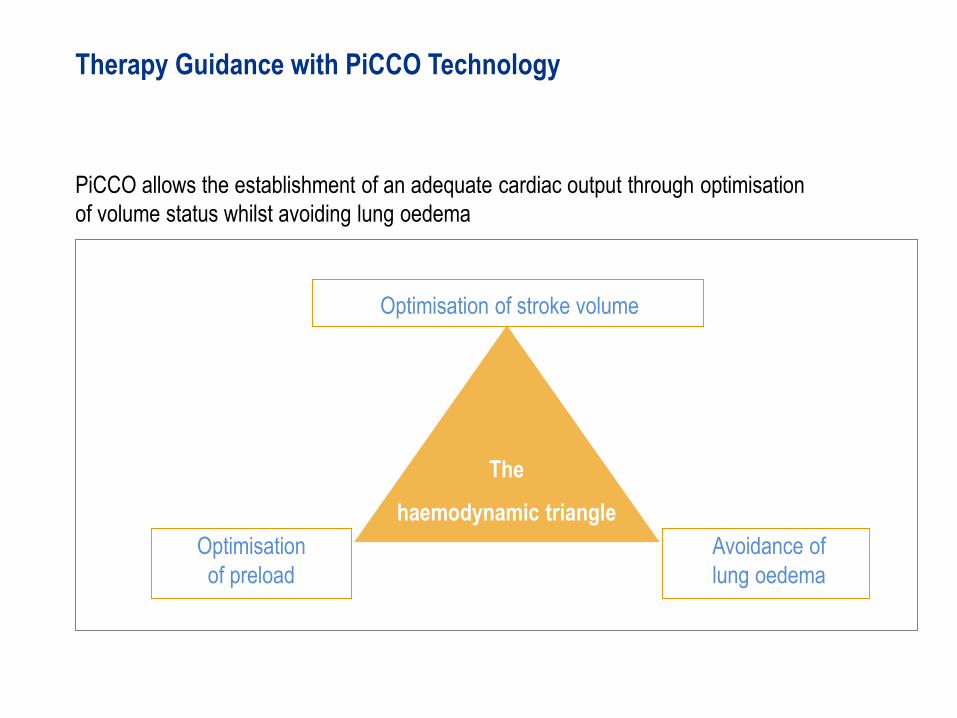
The
haemodynamic triangle
Optimisation
of preload
Optimisation of stroke volume
Therapy Guidance with PiCCO Technology
PiCCO allows the establishment of an adequate cardiac output through optimisation
of volume status whilst avoiding lung oedema
Avoidance of
lung oedema
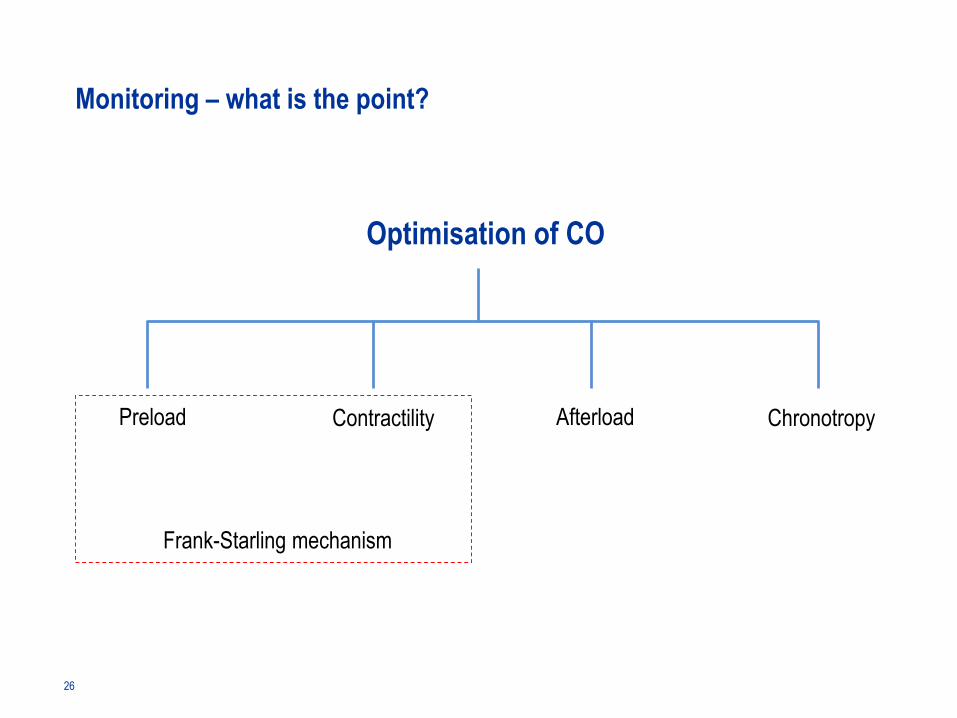
Optimisation of CO
Preload Contractility Afterload Chronotropy
Frank-Starling mechanism
Monitoring – what is the point?
26
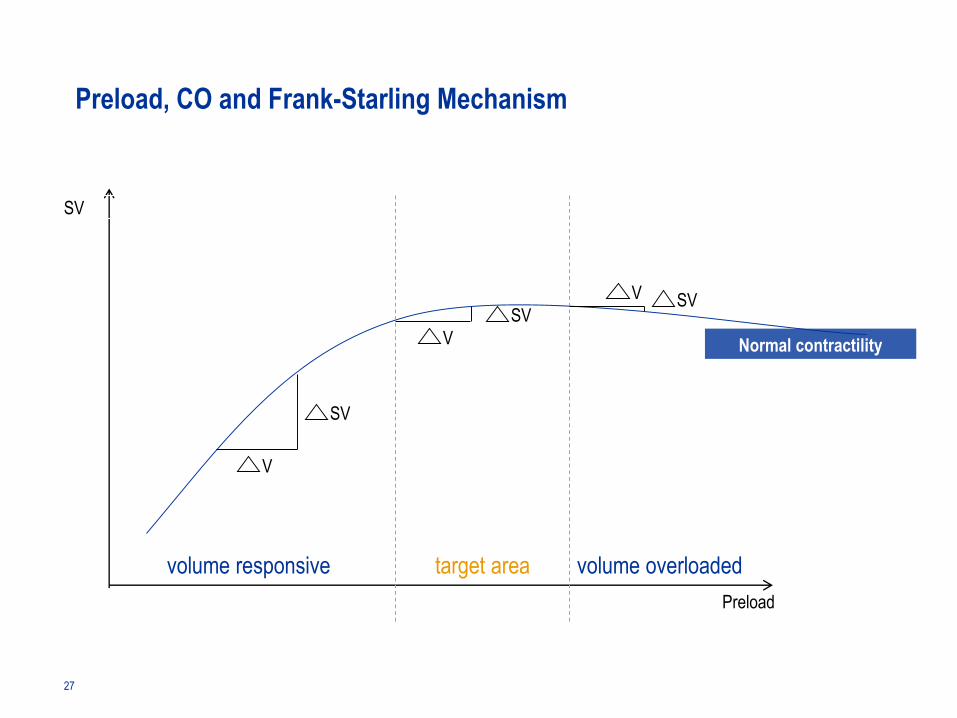
SV
Preload
V
V
V
SV
SVSV
Normal contractility
Preload, CO and Frank-Starling Mechanism
target areavolume responsive volume overloaded
27
Key Points
• The goal of fluid management is the optimisation of cardiac output
• An increase in preload leads to an increase in cardiac output, within certain
limits. This is explained by the Frank-Starling mechanism.
• The measurement of cardiac output does not show where the patient’s heart is
located on the Frank-Starling curve.
• For optimisation of the CO a valid preload measurement is indispensable.
28
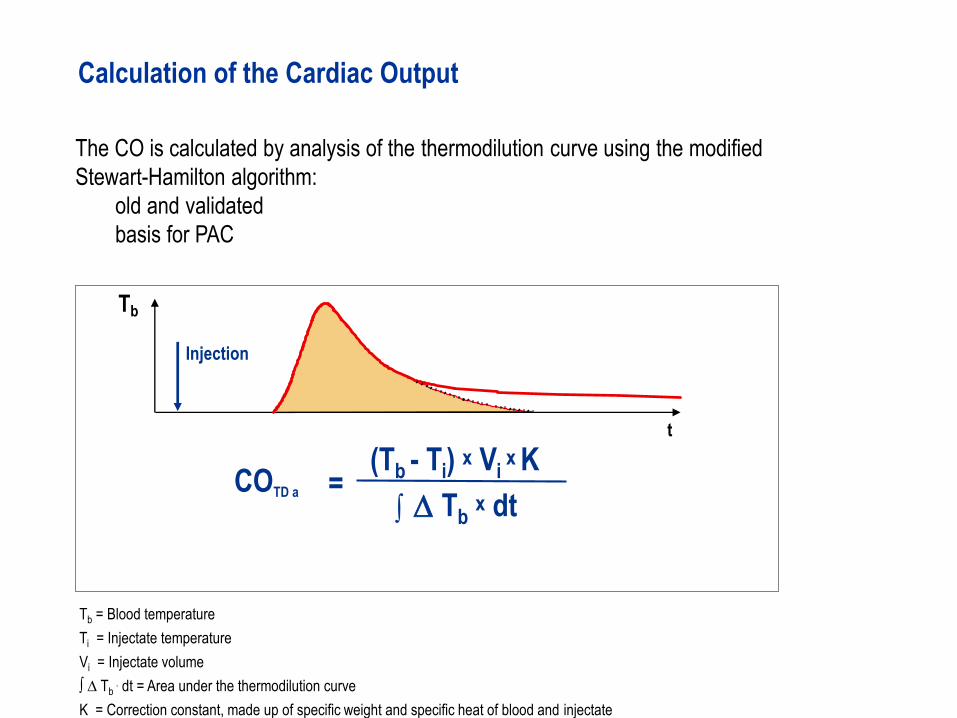
Tbx dt
(Tb - Ti) x Vi x K
Tb
Injection
t
∫ D=COTD a
Tb = Blood temperature
Ti = Injectate temperature
Vi = Injectate volume
∫ ∆ Tb. dt = Area under the thermodilution curve
K = Correction constant, made up of specific weight and specific heat of blood and injectate
The CO is calculated by analysis of the thermodilution curve using the modified
Stewart-Hamilton algorithm:
old and validated
basis for PAC
Calculation of the Cardiac Output
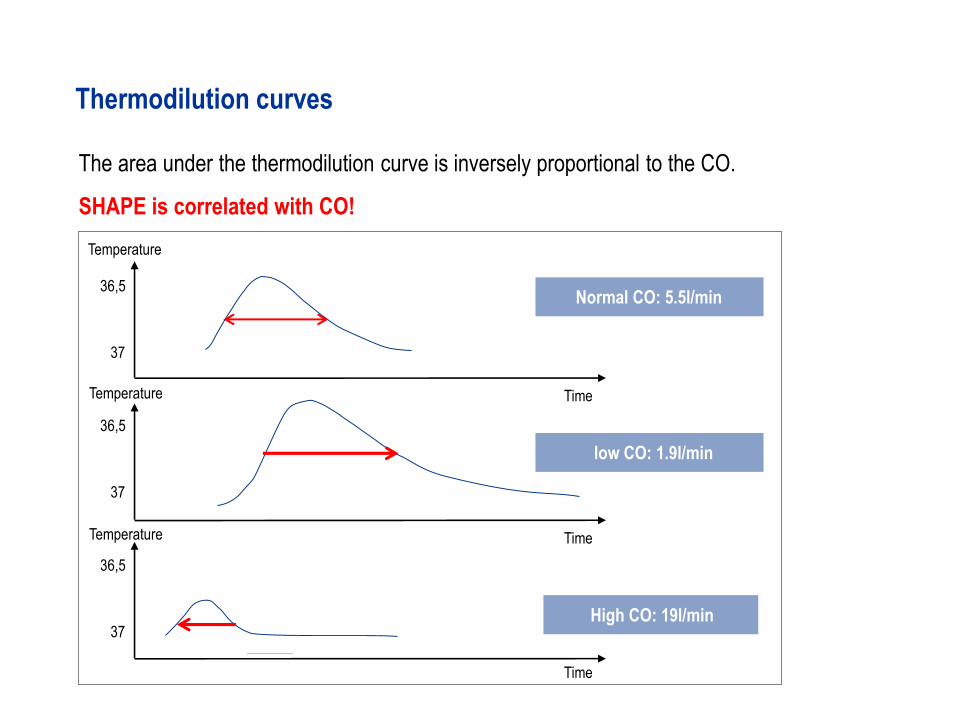
The area under the thermodilution curve is inversely proportional to the CO.
SHAPE is correlated with CO!
36,5
37
5 10
Thermodilution curves
Normal CO: 5.5l/min
36,5
37
36,5
37
Time
low CO: 1.9l/min
High CO: 19l/min
Time
Time
Temperature
Temperature
Temperature
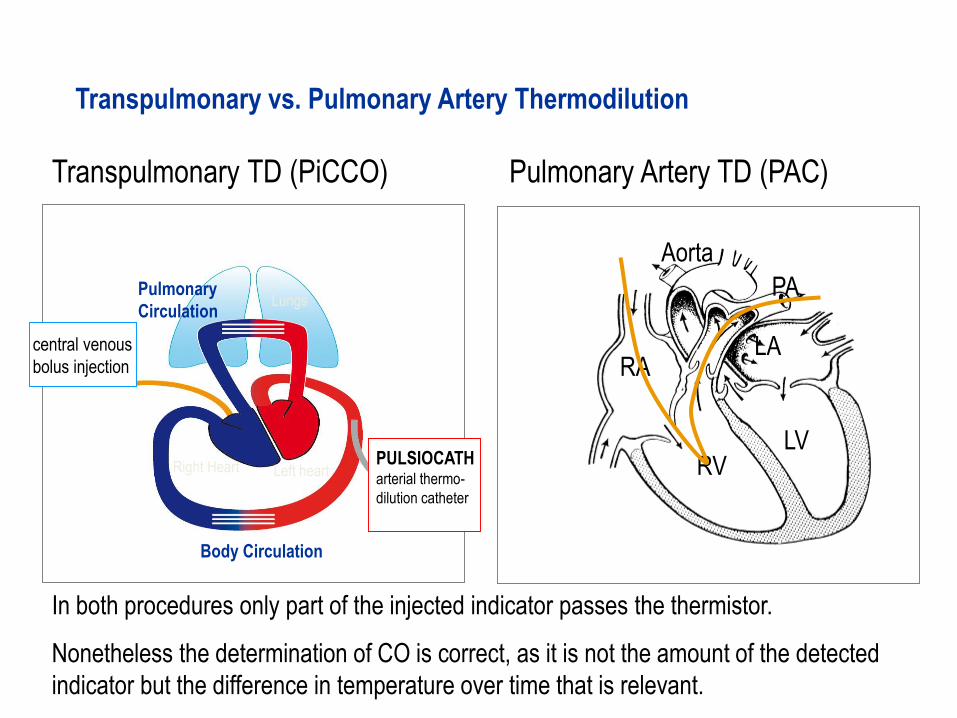
Transpulmonary vs. Pulmonary Artery Thermodilution
Left heartRight Heart
Pulmonary
CirculationLungs
Body Circulation
PULSIOCATH arterial thermo-
dilution catheter
central venous
bolus injection RA
RV
PA
LA
LV
Aorta
Transpulmonary TD (PiCCO) Pulmonary Artery TD (PAC)
In both procedures only part of the injected indicator passes the thermistor.
Nonetheless the determination of CO is correct, as it is not the amount of the detected
indicator but the difference in temperature over time that is relevant.
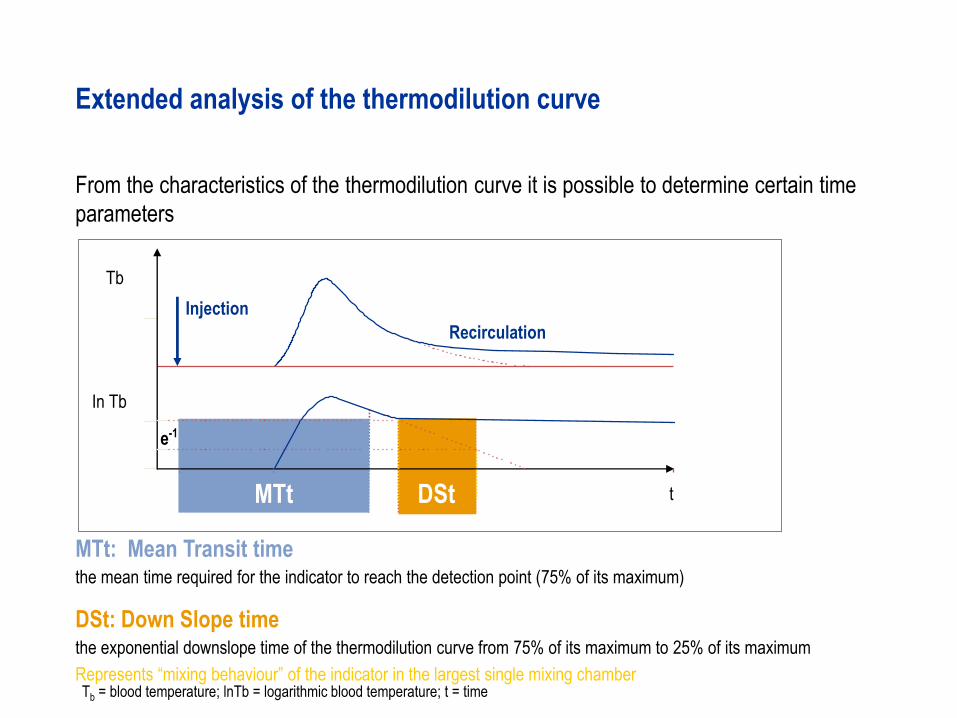
MTt: Mean Transit timethe mean time required for the indicator to reach the detection point (75% of its maximum)
DSt: Down Slope timethe exponential downslope time of the thermodilution curve from 75% of its maximum to 25% of its maximum
Represents “mixing behaviour” of the indicator in the largest single mixing chamber
Recirculation
t
e-1
Tb
From the characteristics of the thermodilution curve it is possible to determine certain time
parameters
Extended analysis of the thermodilution curve
Injection
In Tb
MTt DSt
Tb = blood temperature; lnTb = logarithmic blood temperature; t = time
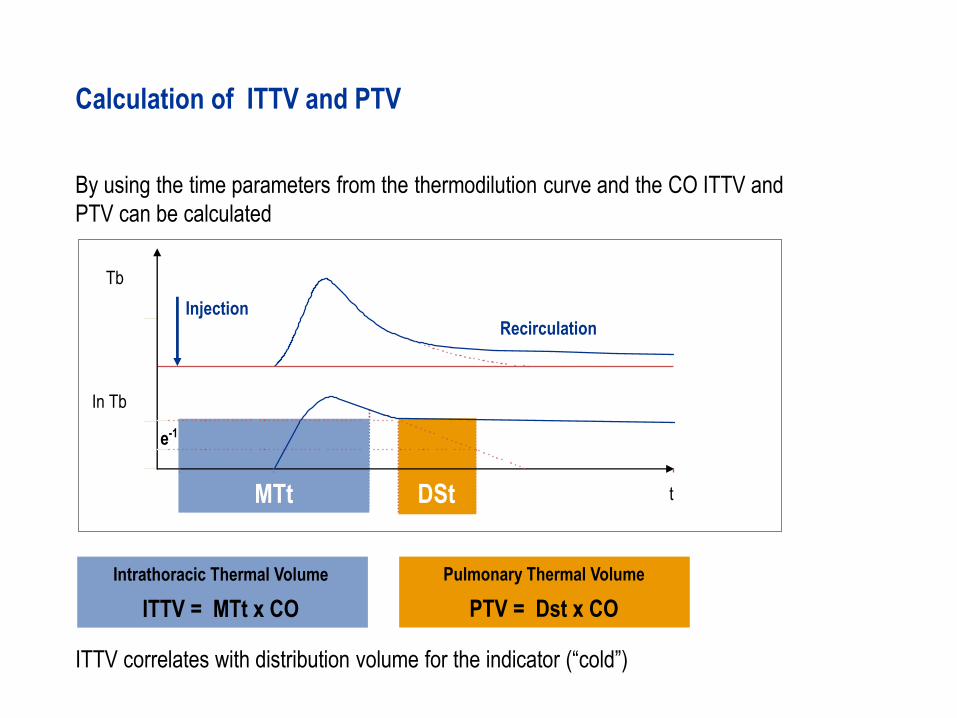
Pulmonary Thermal Volume
PTV = Dst x CO
By using the time parameters from the thermodilution curve and the CO ITTV and
PTV can be calculated
Calculation of ITTV and PTV
Recirculation
t
e-1
Tb
Injection
In Tb
Intrathoracic Thermal Volume
ITTV = MTt x CO
MTt DSt
ITTV correlates with distribution volume for the indicator (“cold”)
Key Points - Thermodilution
• PiCCO Technology is a less invasive method for monitoring the
volume status and cardiovascular function.
• Transpulmonary thermodilution allows calculation of various volumetric parameters.
• The CO is calculated from the shape of the thermodilution curve.
• The volumetric parameters of cardiac preload can be calculated through advanced
analysis of the thermodilution curve.
• For the thermodilution measurement only a fraction of the total injected indicator
needs to pass the detection site, as it is only the change in temperature over time that
is relevant.
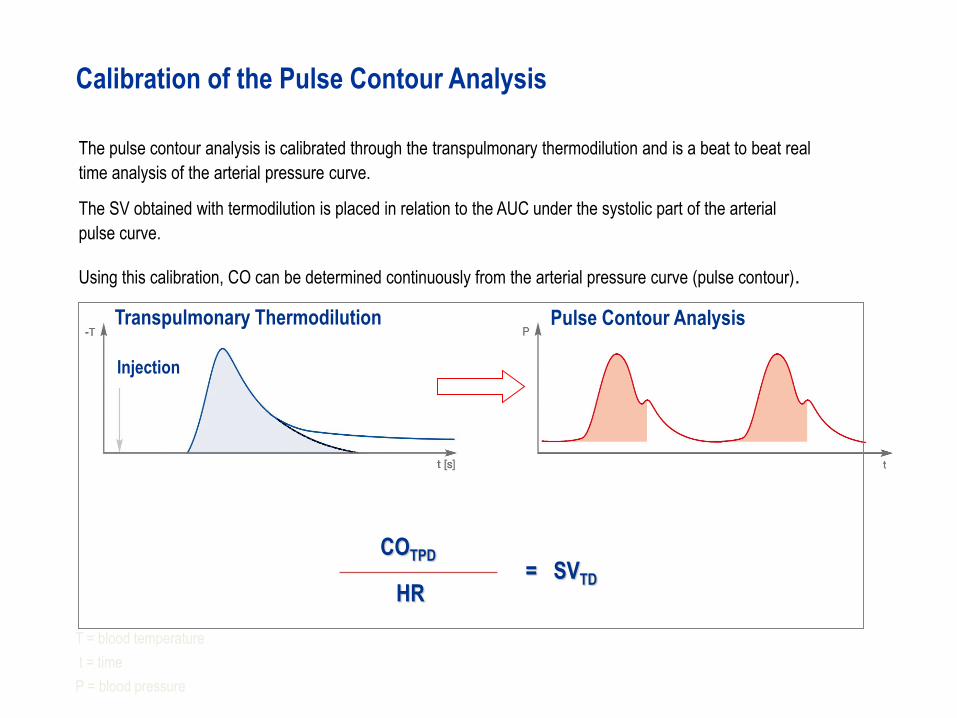
Transpulmonary Thermodilution
The pulse contour analysis is calibrated through the transpulmonary thermodilution and is a beat to beat real
time analysis of the arterial pressure curve.
The SV obtained with termodilution is placed in relation to the AUC under the systolic part of the arterial
pulse curve.
Using this calibration, CO can be determined continuously from the arterial pressure curve (pulse contour).
Calibration of the Pulse Contour Analysis
Injection
Pulse Contour Analysis
T = blood temperature
t = time
P = blood pressure
COTPD= SVTD
HR
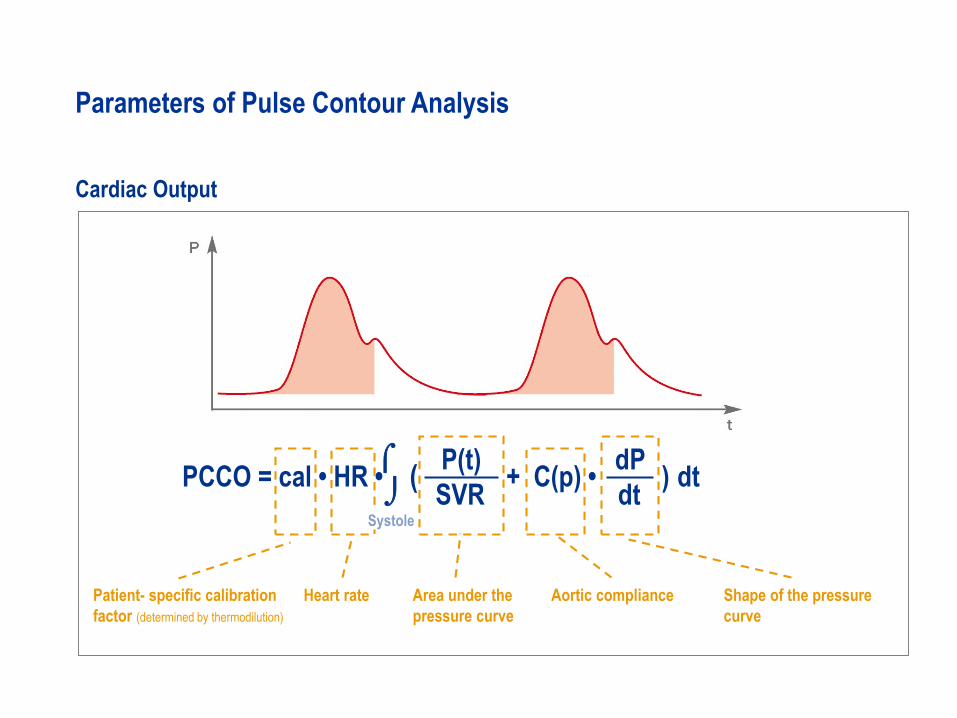
PCCO = cal • HR •
P(t)
SVR+ C(p) •
dP
dt( ) dt
Cardiac Output
Patient- specific calibration
factor (determined by thermodilution)
Heart rate Area under the
pressure curve
Shape of the pressure
curve
Aortic compliance
Systole
Parameters of Pulse Contour Analysis
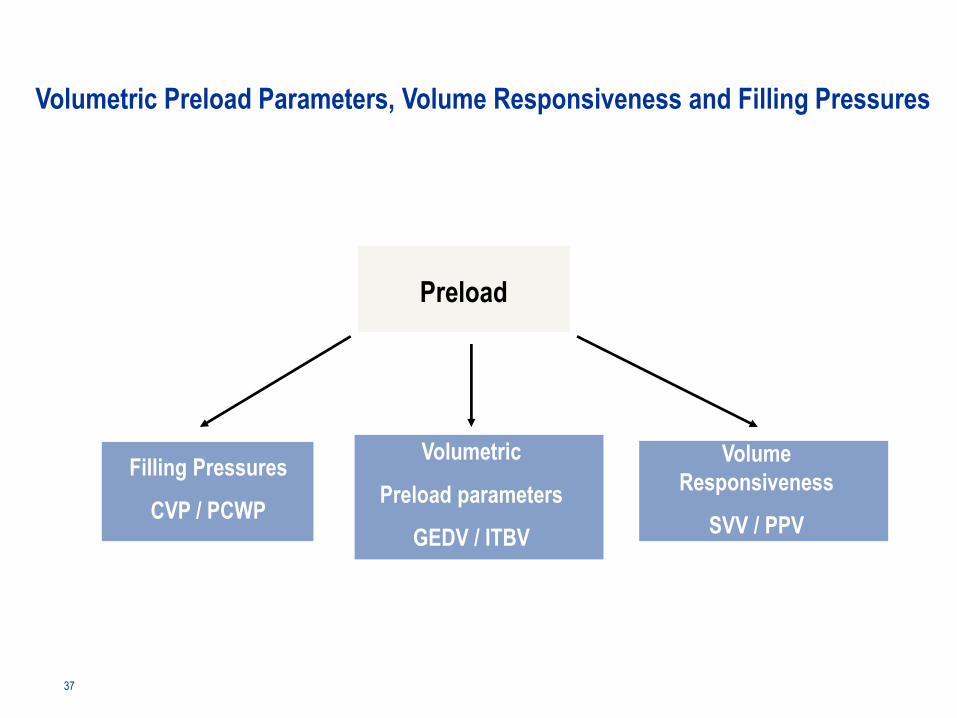
Preload
Filling Pressures
CVP / PCWP
Volumetric Preload Parameters, Volume Responsiveness and Filling Pressures
Volume
Responsiveness
SVV / PPV
Volumetric
Preload parameters
GEDV / ITBV
37
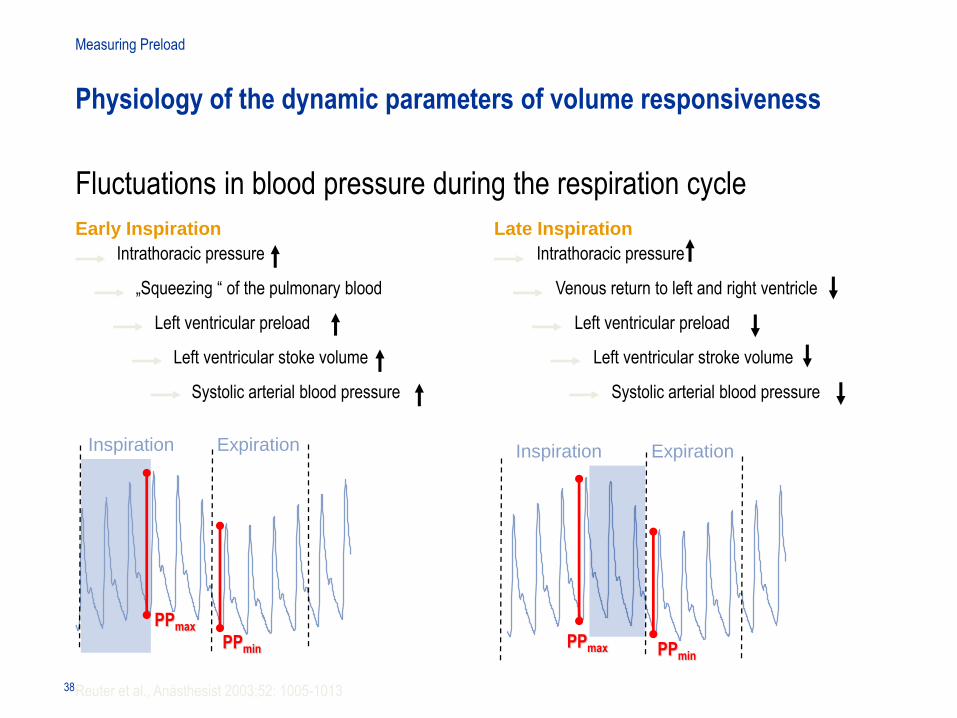
Intrathoracic pressure
Venous return to left and right ventricle
Left ventricular preload
Left ventricular stroke volume
Systolic arterial blood pressure
Intrathoracic pressure
„Squeezing “ of the pulmonary blood
Left ventricular preload
Left ventricular stoke volume
Systolic arterial blood pressure
PPmax PPmin
PPmax
PPmin
Inspiration
Reuter et al., Anästhesist 2003;52: 1005-1013
Measuring Preload
Physiology of the dynamic parameters of volume responsiveness
Expiration Inspiration Expiration
Early Inspiration Late Inspiration
38
Fluctuations in blood pressure during the respiration cycle
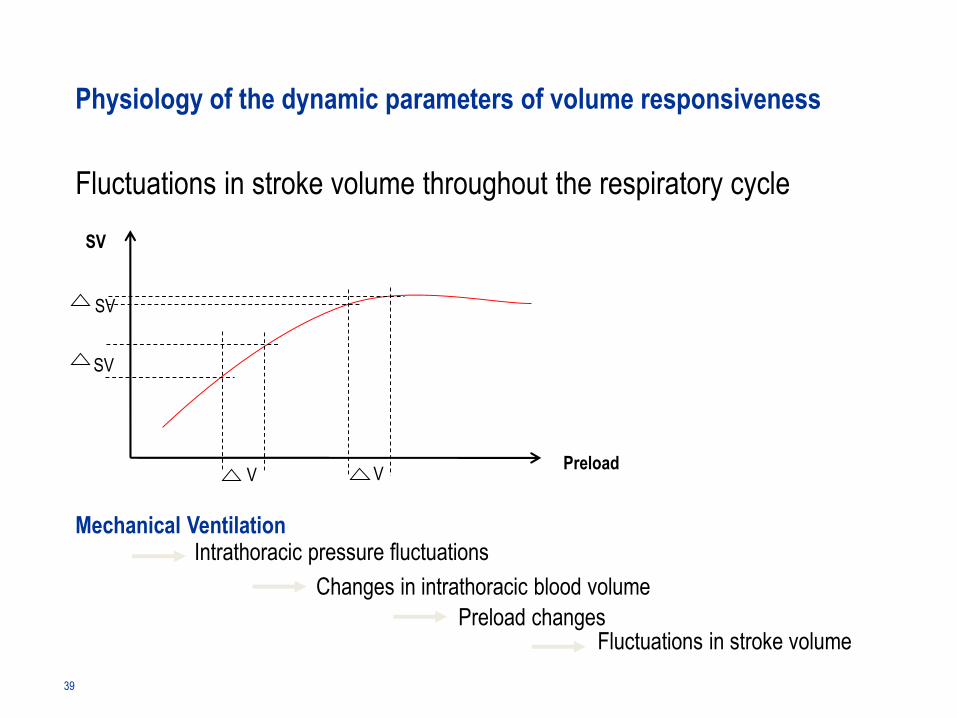
SV
PreloadV
SV
V
SV
Mechanical Ventilation
Fluctuations in stroke volume
Intrathoracic pressure fluctuations
Changes in intrathoracic blood volume
Preload changes
39
Fluctuations in stroke volume throughout the respiratory cycle
Physiology of the dynamic parameters of volume responsiveness
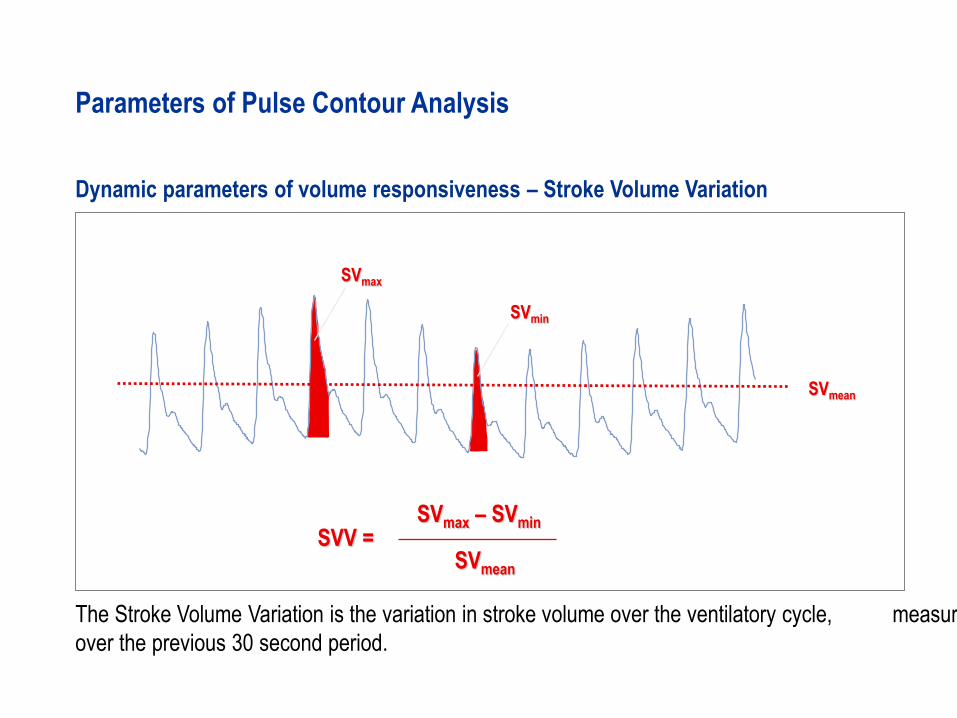
SVmax – SVminSVV =
SVmean
SVmax
SVmin
SVmean
The Stroke Volume Variation is the variation in stroke volume over the ventilatory cycle, measured
over the previous 30 second period.
Parameters of Pulse Contour Analysis
Dynamic parameters of volume responsiveness – Stroke Volume Variation
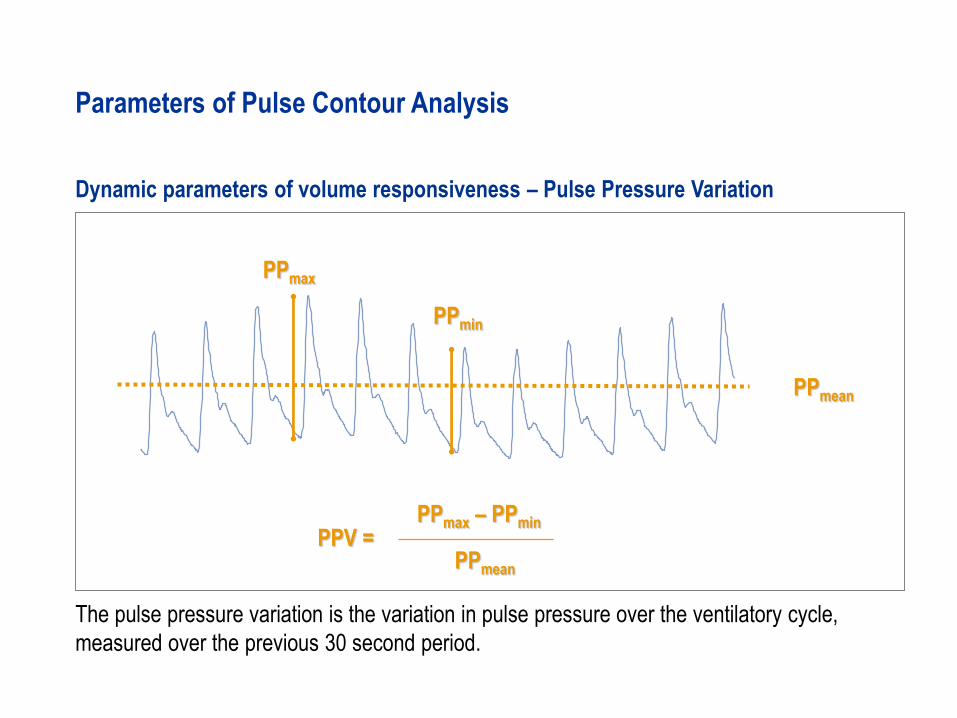
PPmax – PPminPPV =
PPmean
The pulse pressure variation is the variation in pulse pressure over the ventilatory cycle,
measured over the previous 30 second period.
Parameters of Pulse Contour Analysis
Dynamic parameters of volume responsiveness – Pulse Pressure Variation
PPmax
PPmean
PPmin
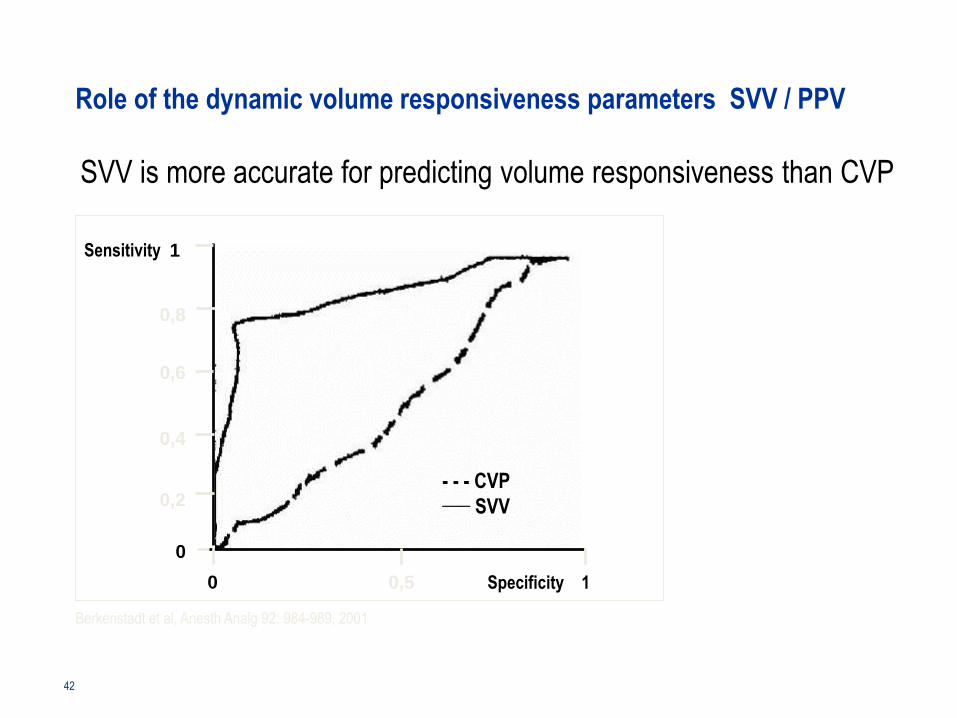
Sensitivity
- - - CVP___ SVV
SVV is more accurate for predicting volume responsiveness than CVP
Berkenstadt et al, Anesth Analg 92: 984-989, 2001
Specificity 1 0,5 0
0
0,2
0,4
0,6
0,8
1
42
Role of the dynamic volume responsiveness parameters SVV / PPV
Summary pulse contour analysis - CO and volume responsiveness
• The PiCCO technology pulse contour analysis is calibrated by transpulmonary
thermodilution
• PiCCO technology analyses the arterial pressure curve beat by beat
thereby providing real time parameters
• Besides cardiac output, the dynamic parameters of volume responsiveness
SVV (stroke volume variation) and PPV (pulse pressure variation) are determined
continuously
The dynamic volume responsiveness parameters SVV and PPV
- are good predictors of a potential increase in CO due to volume administration
- are only valid with patients who are fully ventilated and who have no cardiac
arrhythmias
44
Role of the dynamic volume responsiveness parameters SVV / PPV
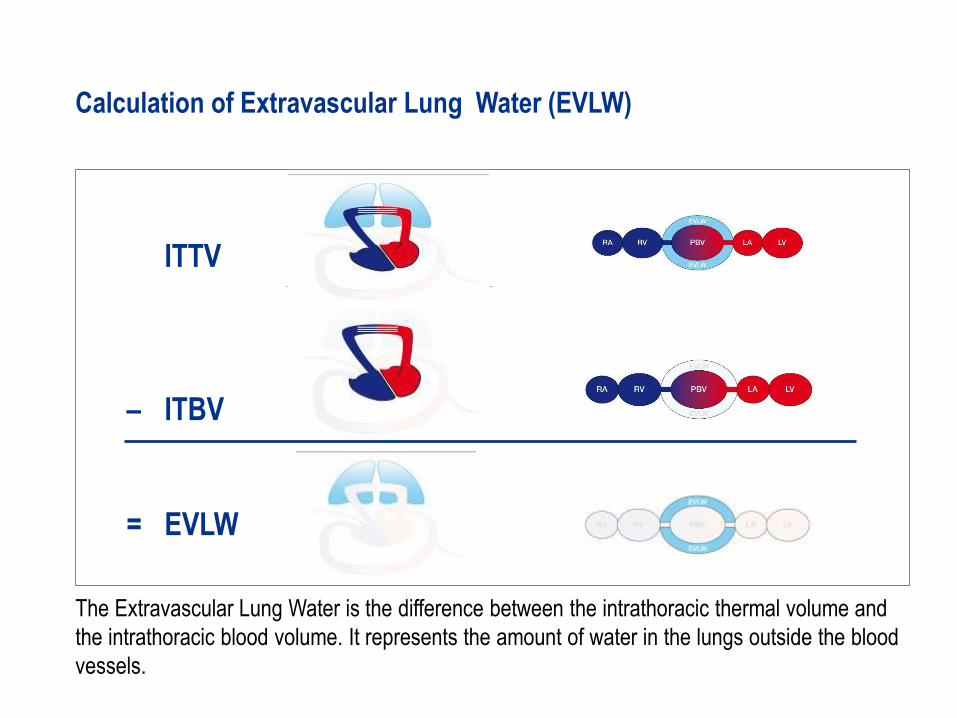
ITTV
– ITBV
= EVLW
The Extravascular Lung Water is the difference between the intrathoracic thermal volume and
the intrathoracic blood volume. It represents the amount of water in the lungs outside the blood
vessels.
Calculation of Extravascular Lung Water (EVLW)
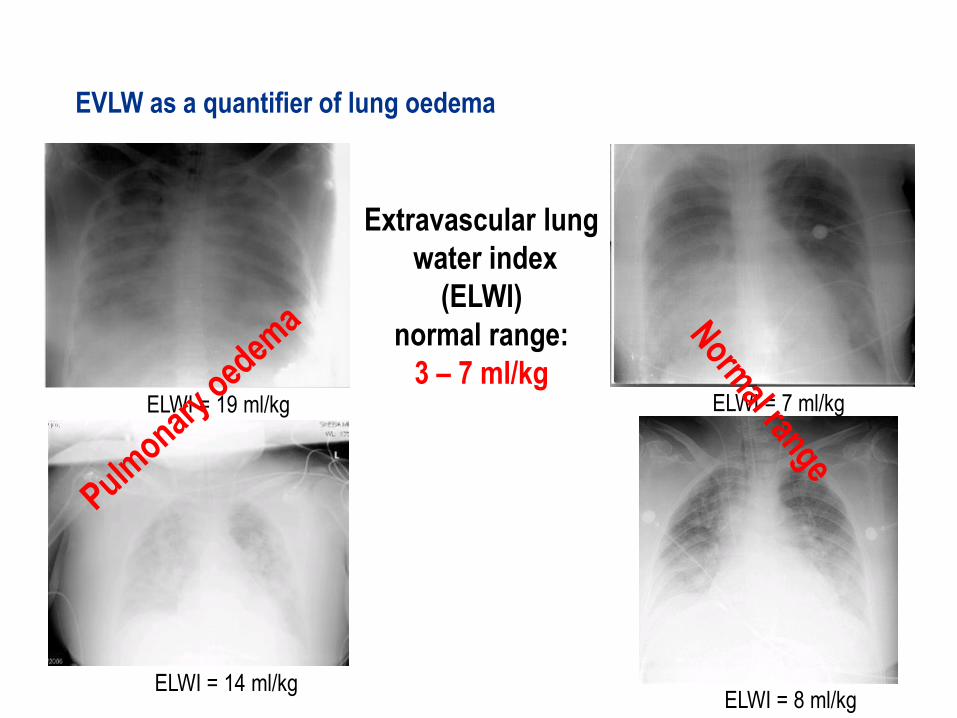
ELWI = 7 ml/kg
ELWI = 8 ml/kgELWI = 14 ml/kg
ELWI = 19 ml/kg
Extravascular lung
water index
(ELWI)
normal range:
3 – 7 ml/kg
EVLW as a quantifier of lung oedema

The
haemodynamic triangle
Optimisation
of preload
Optimisation of stroke volume
Therapy Guidance with PiCCO Technology
PiCCO allows the establishment of an adequate cardiac output through optimisation
of volume status whilst avoiding lung oedema
Avoidance of
lung oedema
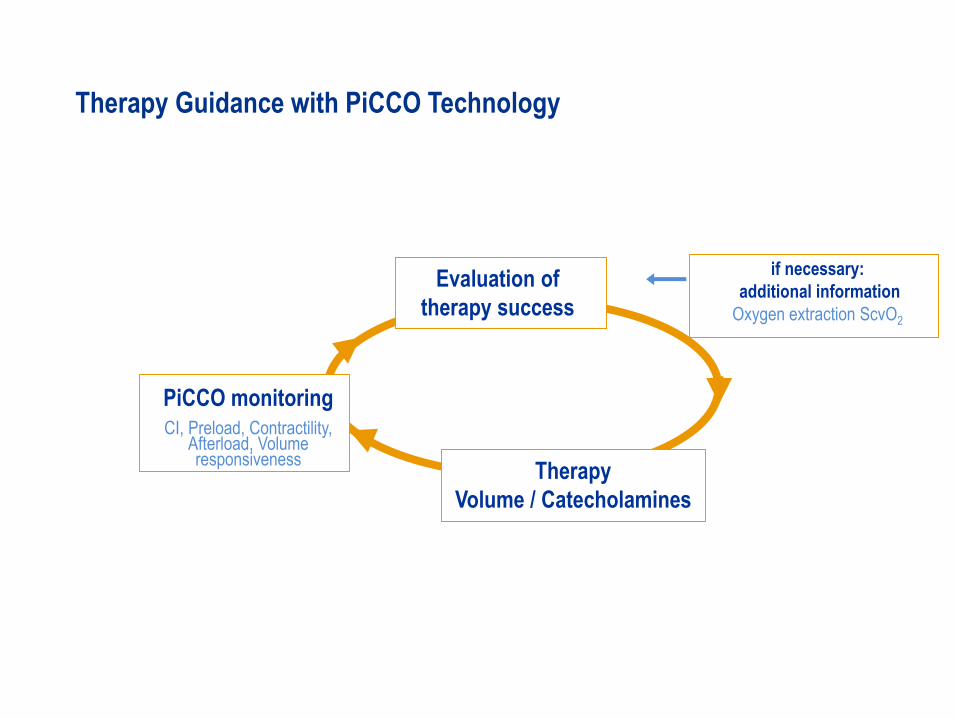
if necessary:
additional information
Oxygen extraction ScvO2
Therapy Guidance with PiCCO Technology
PiCCO monitoring
CI, Preload, Contractility, Afterload, Volume responsiveness
Evaluation of
therapy success
Therapy
Volume / Catecholamines
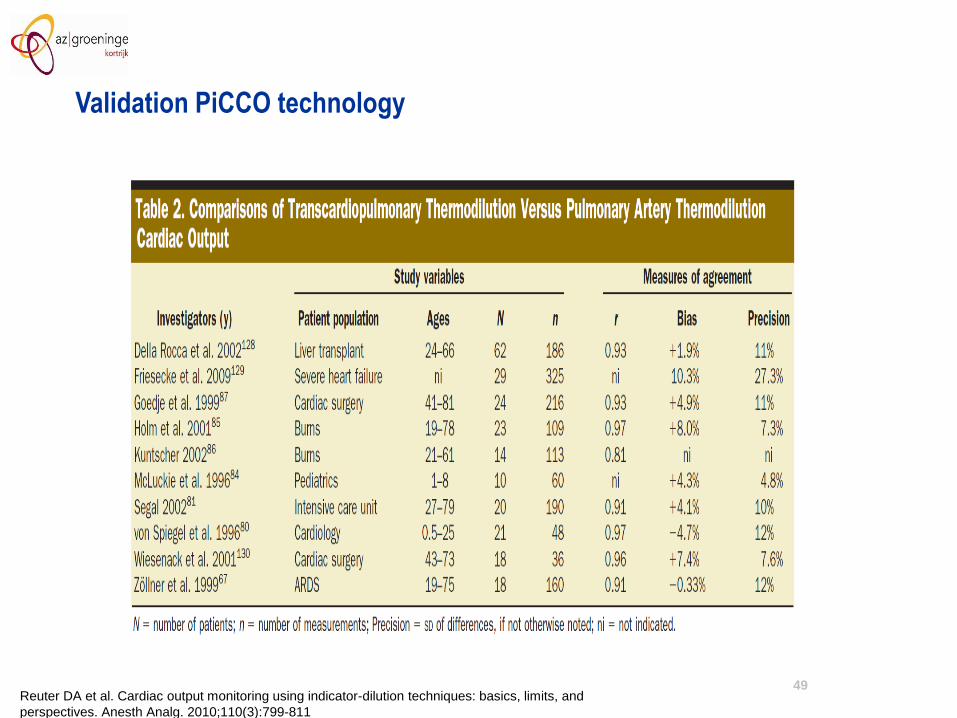
49Reuter DA et al. Cardiac output monitoring using indicator-dilution techniques: basics, limits, and
perspectives. Anesth Analg. 2010;110(3):799-811
Validation PiCCO technology
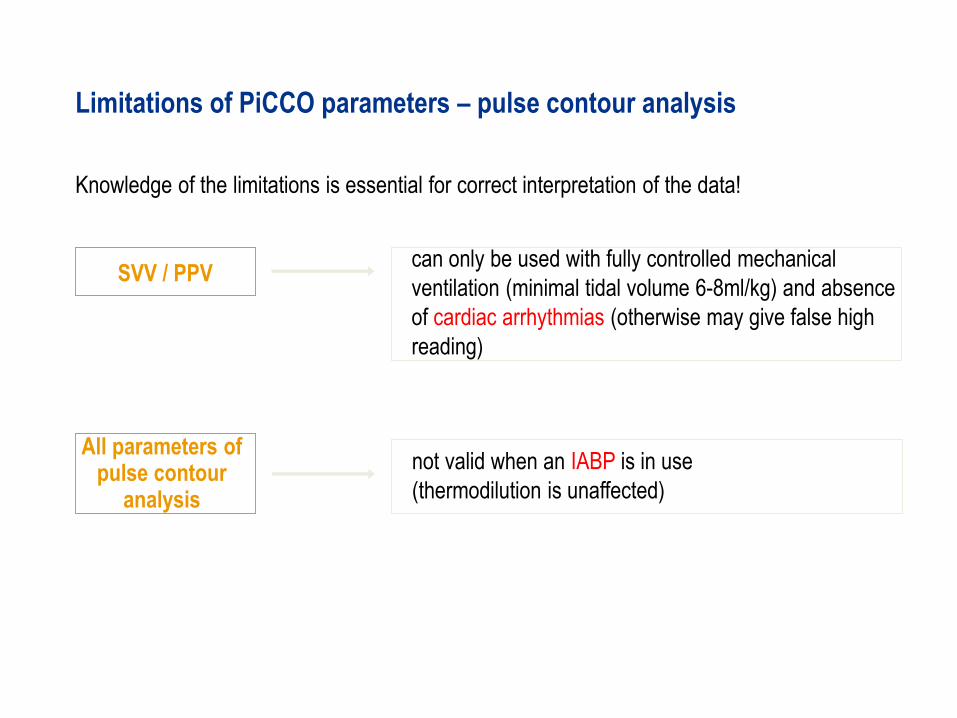
can only be used with fully controlled mechanical
ventilation (minimal tidal volume 6-8ml/kg) and absence
of cardiac arrhythmias (otherwise may give false high
reading)
Knowledge of the limitations is essential for correct interpretation of the data!
Limitations of PiCCO parameters – pulse contour analysis
SVV / PPV
not valid when an IABP is in use
(thermodilution is unaffected)
All parameters of pulse contour
analysis
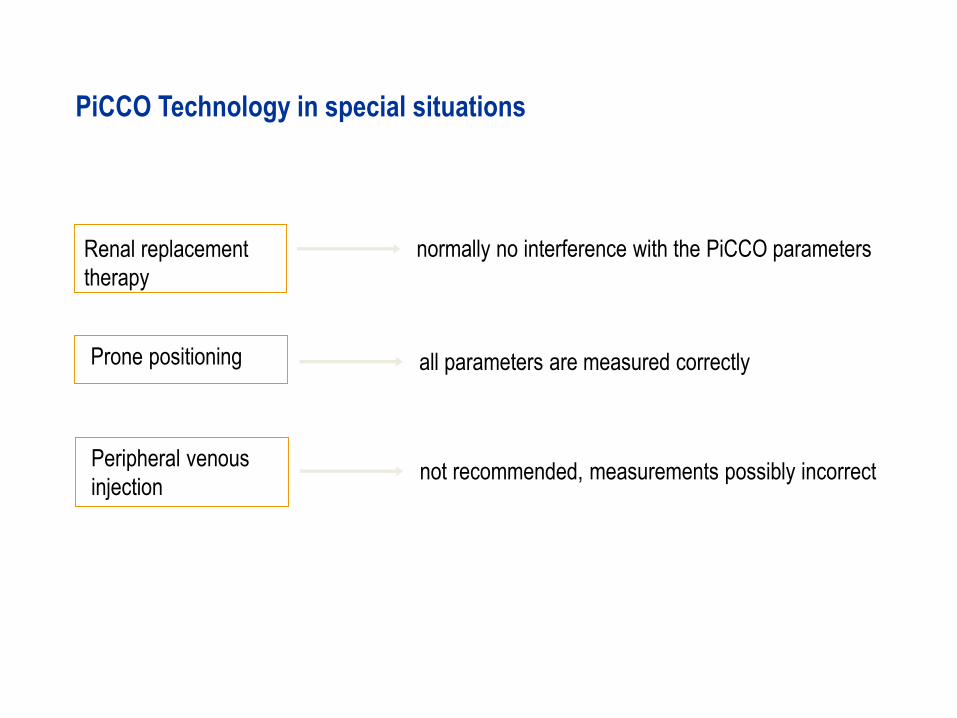
PiCCO Technology in special situations
normally no interference with the PiCCO parametersRenal replacement
therapy
Prone positioning all parameters are measured correctly
Peripheral venous
injection not recommended, measurements possibly incorrect
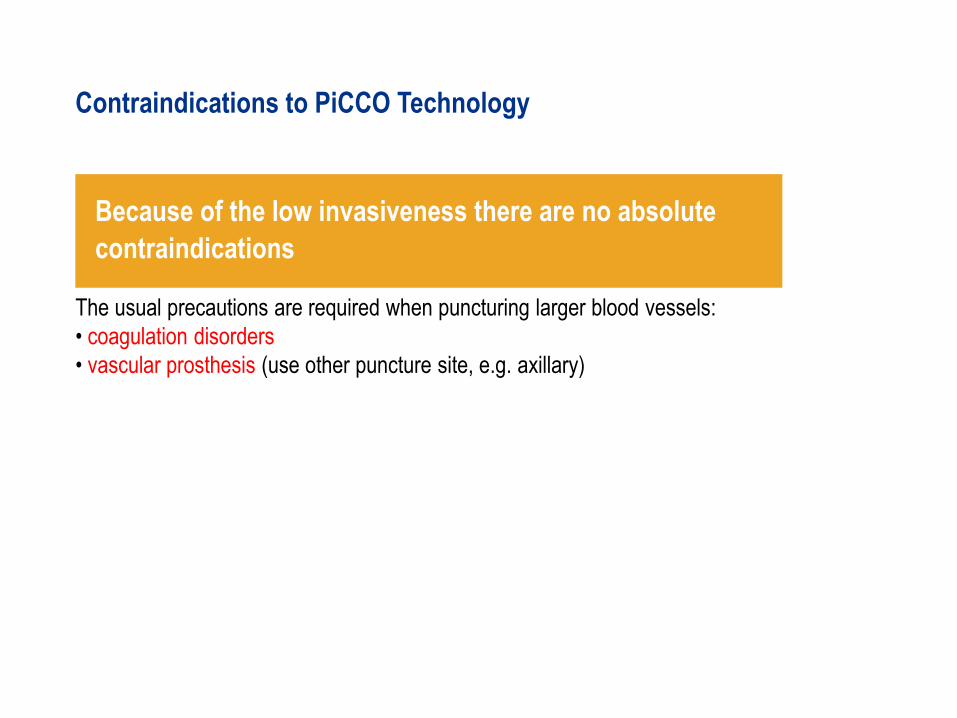
Contraindications to PiCCO Technology
The usual precautions are required when puncturing larger blood vessels:
• coagulation disorders
• vascular prosthesis (use other puncture site, e.g. axillary)
Because of the low invasiveness there are no absolute
contraindications