hager noise exposure assessment - fl-aiha -...
TRANSCRIPT

NOISE EXPOSURE ASSESSMENT
Sampling Strategy and Data Acquisition
Defining Terms
NOISE, n. 1) A stench in the ear. 2) Undomesticated music.3) The chief product and
authenticating sign of civilization. Ambrose Bierce (1842 – 1914?)
American journalist, short-story writer, satirist, and smarty pantsThe Devil's Dictionary
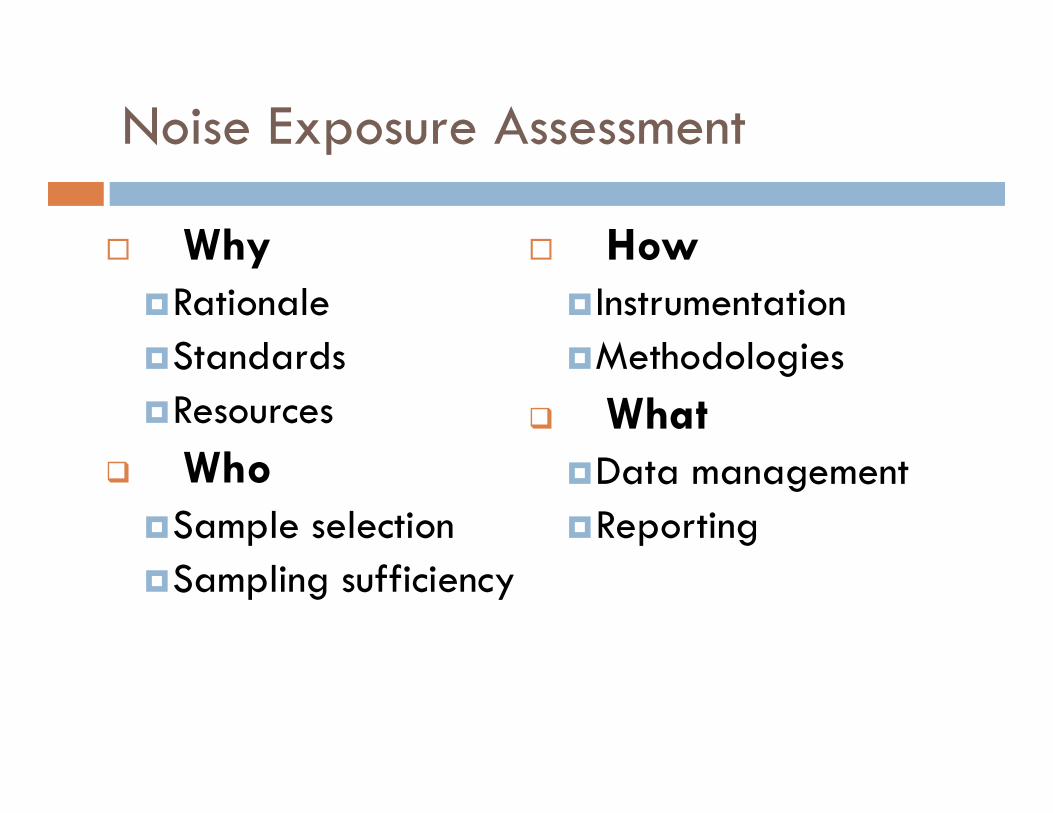
Noise Exposure Assessment
WhyRationaleStandardsResources
WhoSample selectionSampling sufficiency
HowInstrumentationMethodologies
WhatData managementReporting
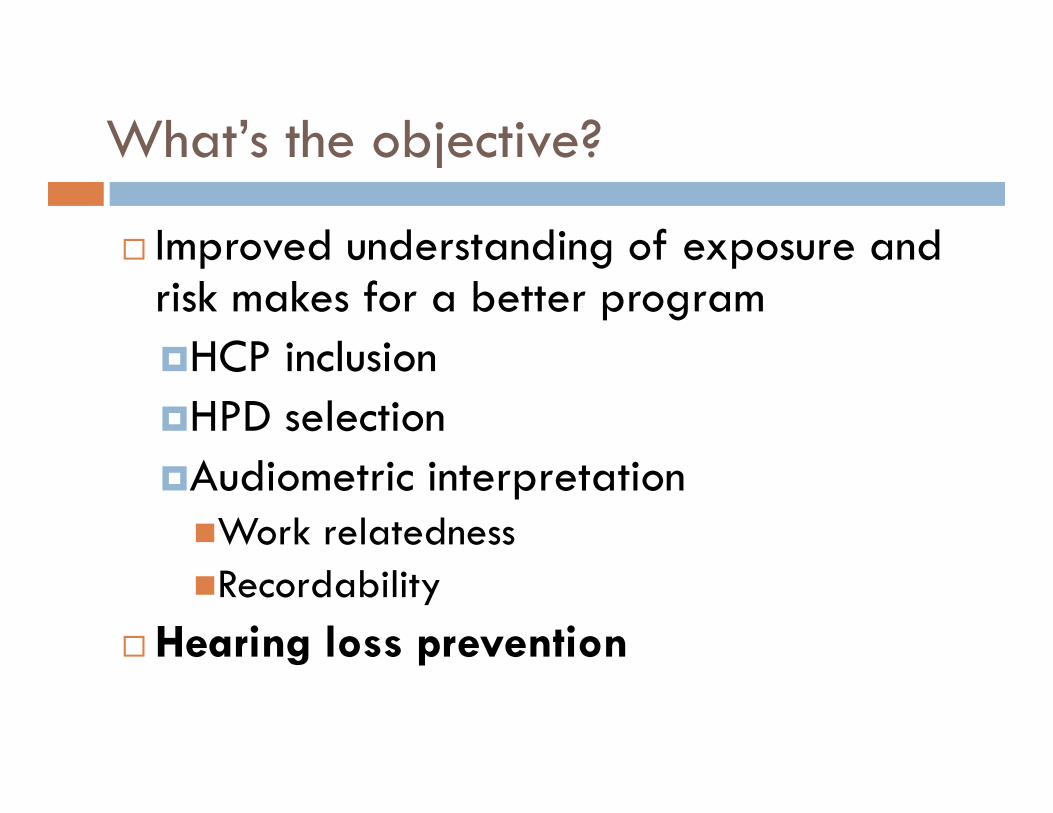
What’s the objective?
Improved understanding of exposure and risk makes for a better programHCP inclusionHPD selectionAudiometric interpretationWork relatednessRecordability
Hearing loss prevention
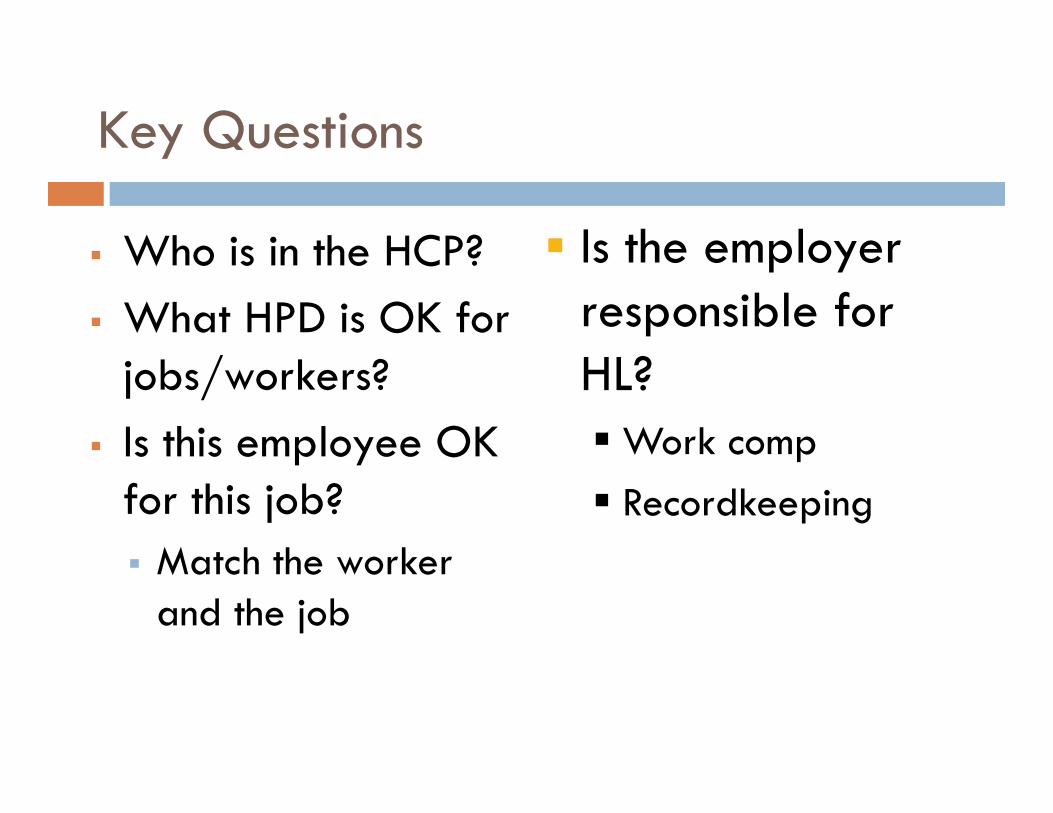
Key Questions
Who is in the HCP? What HPD is OK for
jobs/workers? Is this employee OK
for this job? Match the worker
and the job
Is the employer responsible for HL?Work comp Recordkeeping
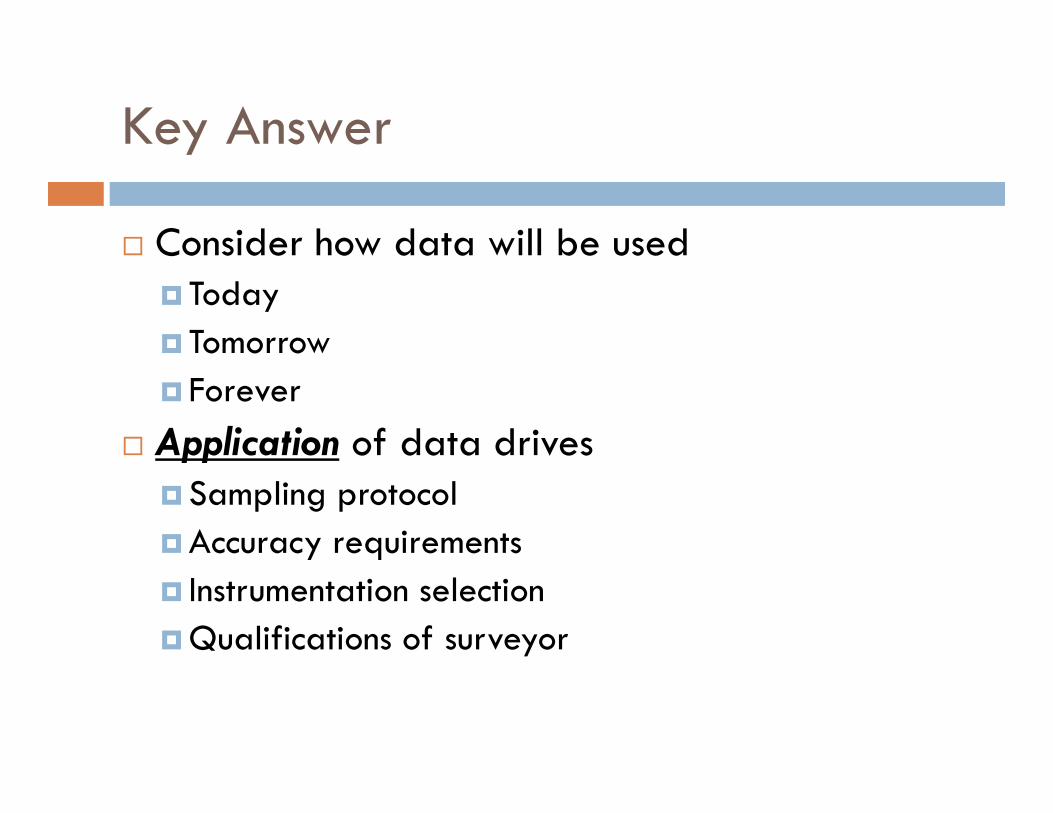
Key Answer
Consider how data will be used Today Tomorrow Forever
Application of data drivesSampling protocolAccuracy requirements Instrumentation selectionQualifications of surveyor
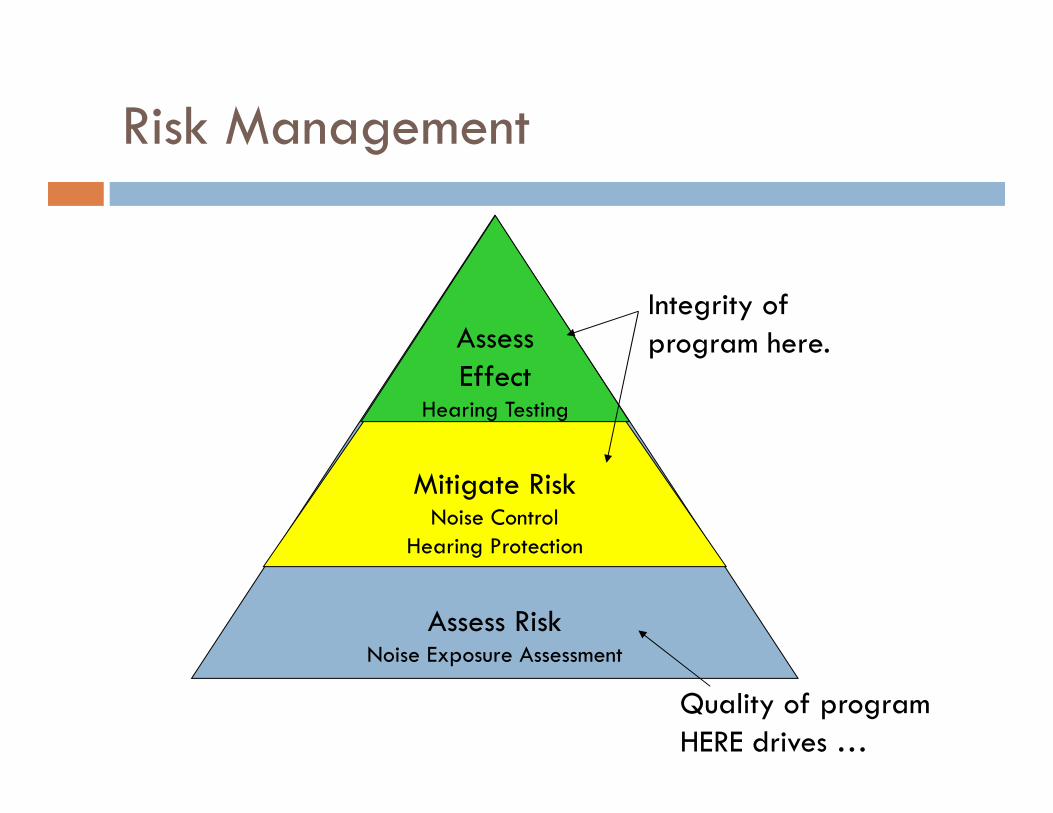
Risk Management
Assess RiskNoise Exposure Assessment
Mitigate RiskNoise Control
Hearing Protection
AssessEffect
Hearing Testing
Quality of program HERE drives …
Integrity of program here.
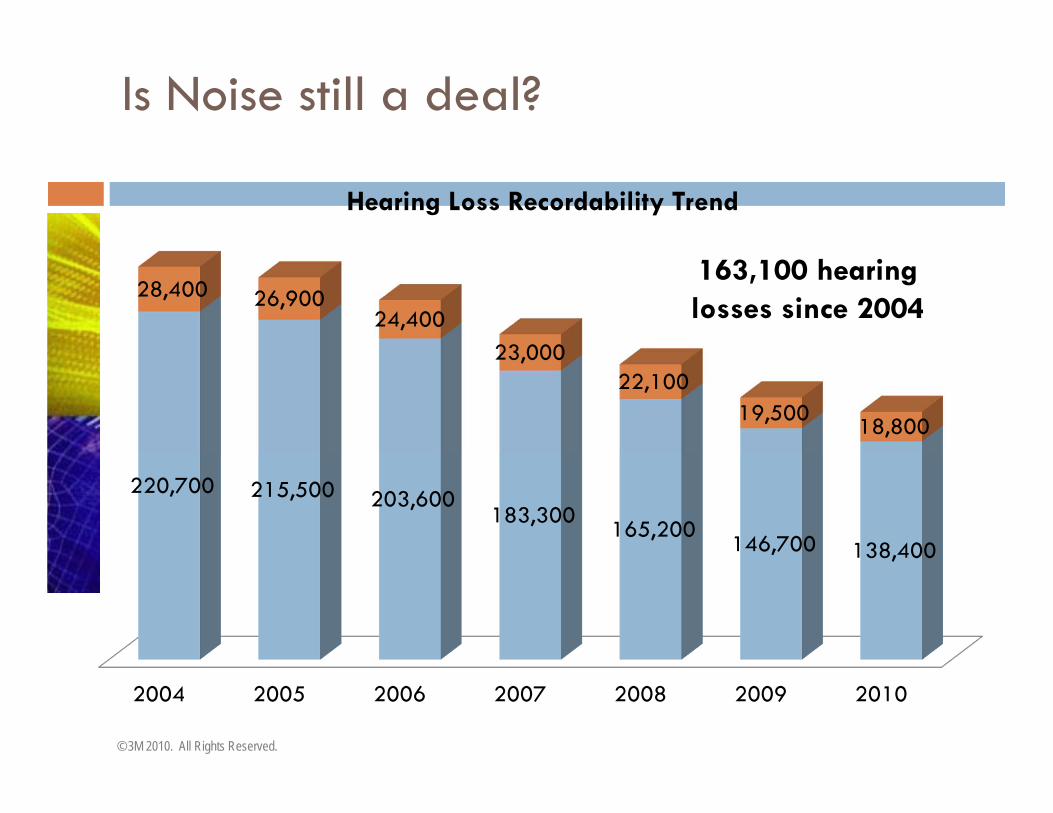
Is Noise still a deal?
2004 2005 2006 2007 2008 2009 2010
220,700 215,500 203,600 183,300 165,200
146,700 138,400
28,400 26,90024,400
23,00022,100
19,500 18,800
Hearing Loss Recordability Trend
163,100 hearing losses since 2004
© 3M 2010. All Rights Reserved.
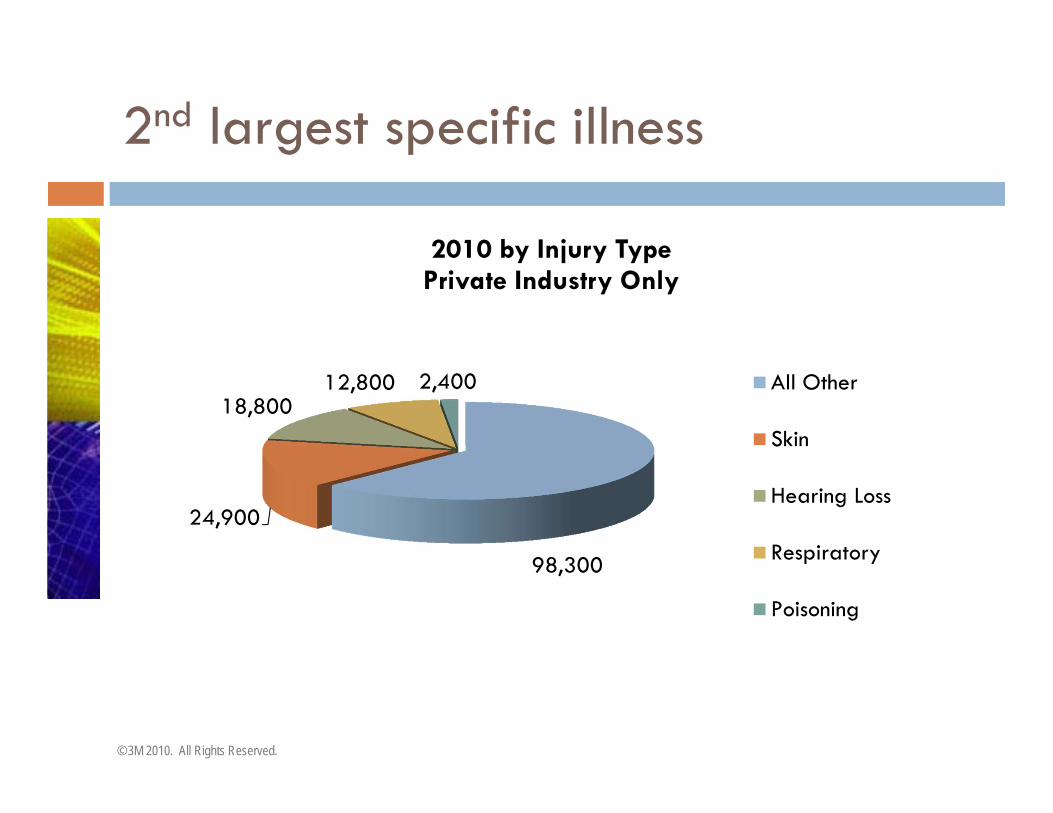
2nd largest specific illness
98,300
24,900
18,800 12,800 2,400
2010 by Injury TypePrivate Industry Only
All Other
Skin
Hearing Loss
Respiratory
Poisoning
© 3M 2010. All Rights Reserved.
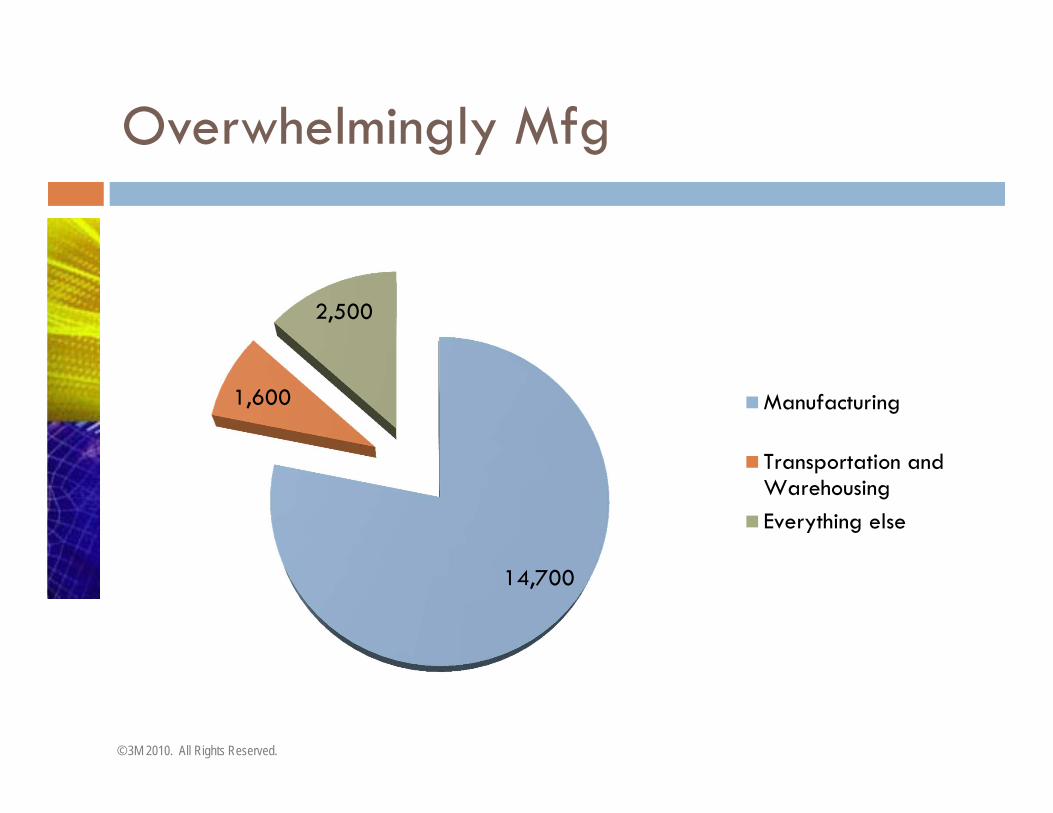
Overwhelmingly Mfg
14,700
1,600
2,500
Manufacturing
Transportation andWarehousingEverything else
© 3M 2010. All Rights Reserved.
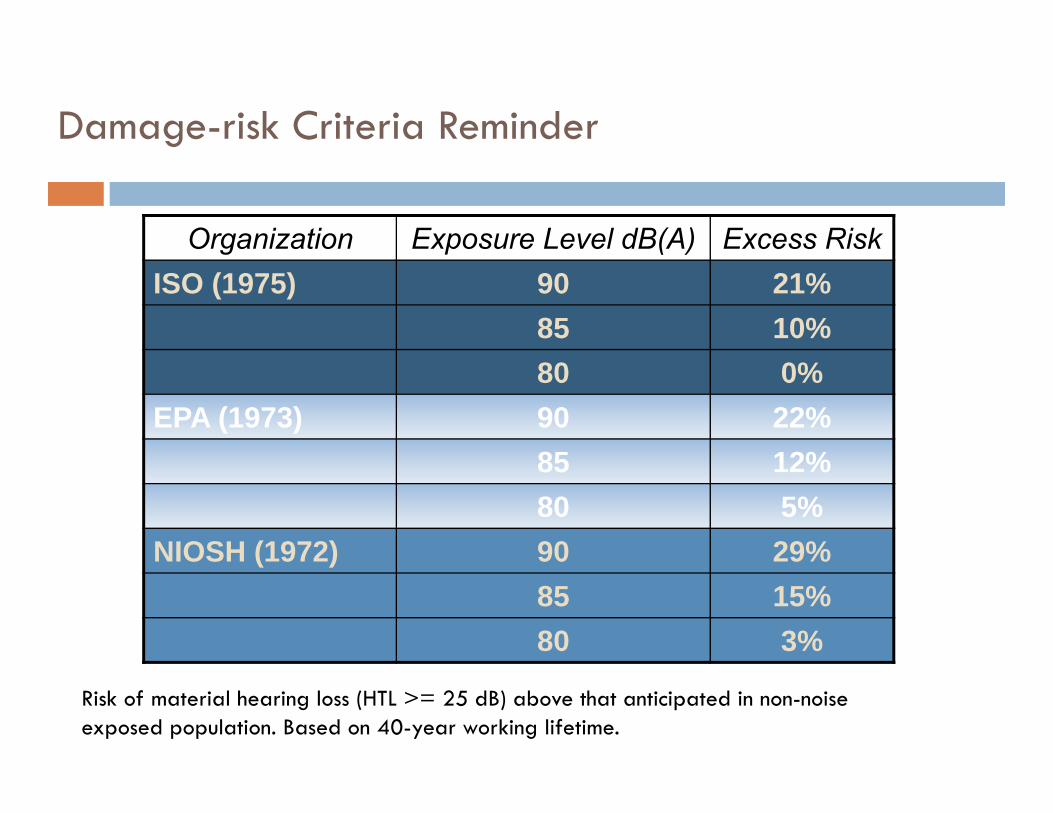
Damage-risk Criteria Reminder
Organization Exposure Level dB(A) Excess RiskISO (1975) 90 21%
85 10%80 0%
EPA (1973) 90 22%85 12%80 5%
NIOSH (1972) 90 29%85 15%80 3%
Risk of material hearing loss (HTL >= 25 dB) above that anticipated in non-noise exposed population. Based on 40-year working lifetime.
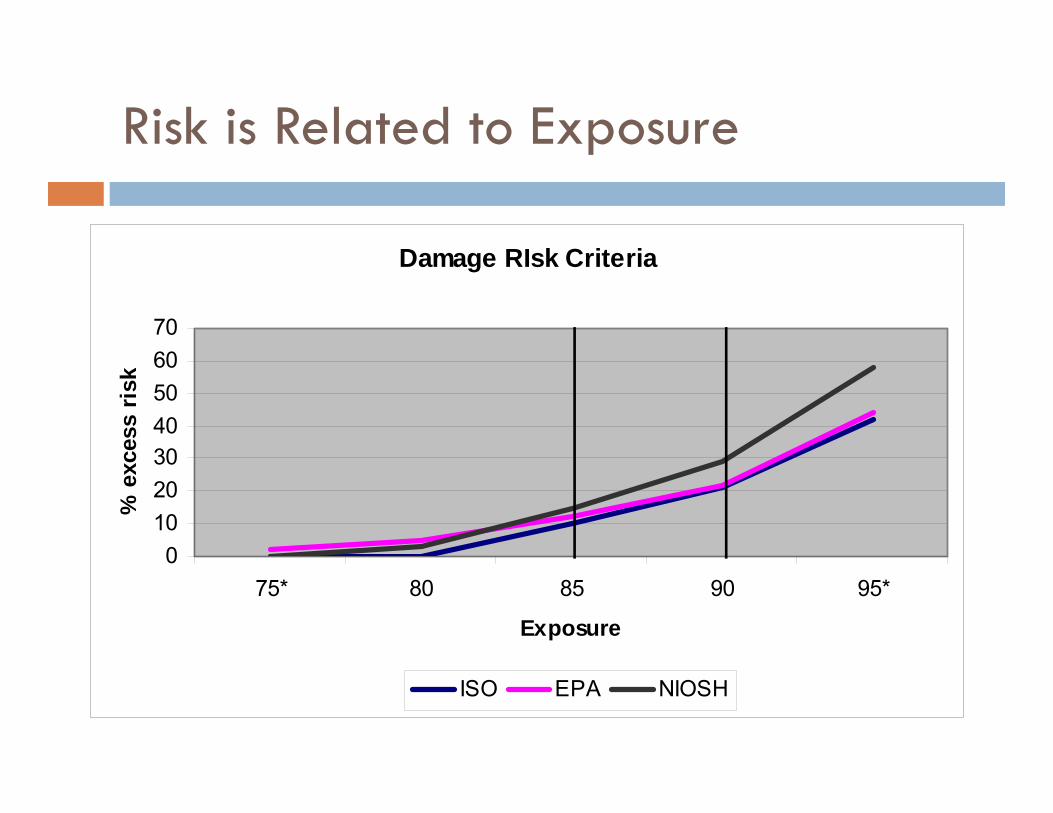
Risk is Related to Exposure
Damage RIsk Criteria
010203040506070
75* 80 85 90 95*
Exposure
% e
xces
s ris
k
ISO EPA NIOSH
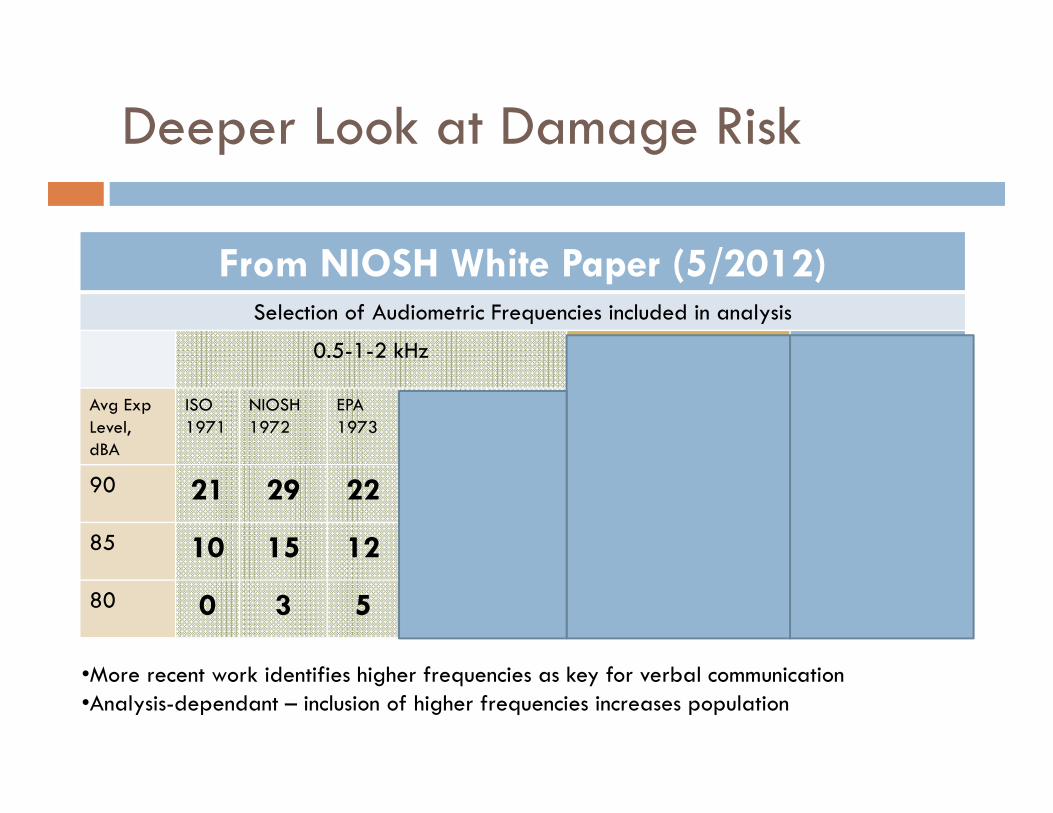
Deeper Look at Damage Risk
From NIOSH White Paper (5/2012)Selection of Audiometric Frequencies included in analysis
0.5-1-2 kHz 1-2-3 kHz 1-2-3-4 kHz
Avg Exp Level,dBA
ISO 1971
NIOSH 1972
EPA 1973
ISO 1990
NIOSH 1997
NIOSH 1972
ISO 1990
NIOSH 1997
ISO 1990
NIOSH 1997
90 21 29 22 3 23 29 14 32 17 25
85 10 15 12 1 10 16 4 14 6 8
80 0 3 5 0 4 3 0 5 1 1
•More recent work identifies higher frequencies as key for verbal communication•Analysis-dependant – inclusion of higher frequencies increases population
14
Is it the labeling process? NRR
EPA testing and labeling requirements
Lab based Unreliability leads to deratingOSHA: (NRR-7)/2NIOSH: Variable by type
Pressure on mfr.
Label value is inaccurate Variability in even lab data Typical SD 3-5 dB per frequency
Test Frequency 125 250 500 1000 2000 3150 4000 6300 8000 NRR
Mean 37.4 40.9 44.8 43.8 36.3 41.9 42.6 46.1 47.3 29SD 5.7 5.0 3.3 3.6 4.9 3.0 3.1 3.5 2.7
© 3M 2012. All Rights Reserved.
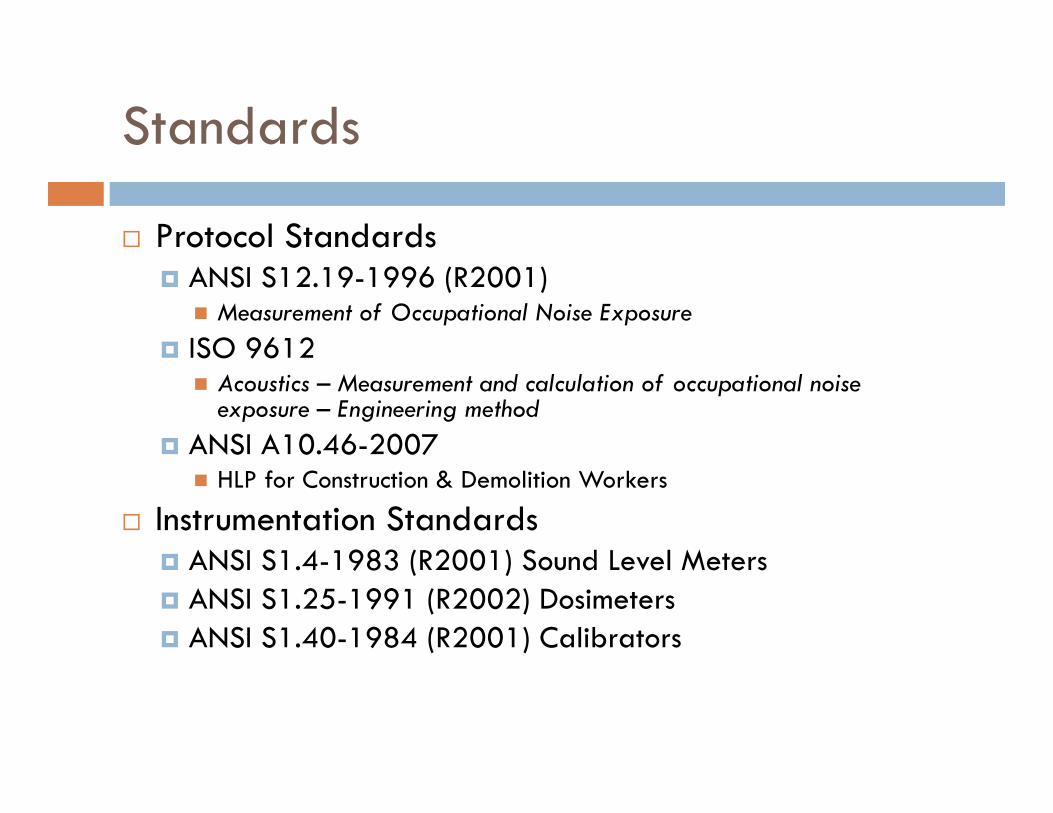
Standards
Protocol Standards ANSI S12.19-1996 (R2001) Measurement of Occupational Noise Exposure
ISO 9612 Acoustics – Measurement and calculation of occupational noise
exposure – Engineering method ANSI A10.46-2007 HLP for Construction & Demolition Workers
Instrumentation Standards ANSI S1.4-1983 (R2001) Sound Level Meters ANSI S1.25-1991 (R2002) Dosimeters ANSI S1.40-1984 (R2001) Calibrators
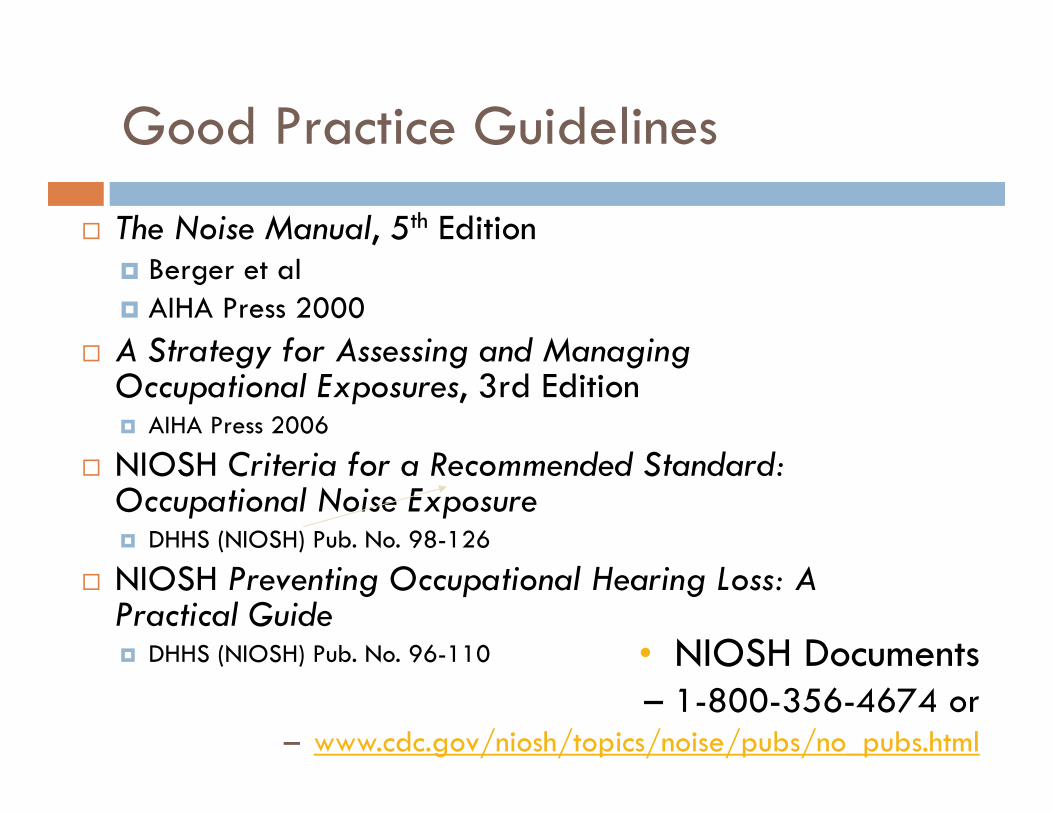
Good Practice Guidelines
The Noise Manual, 5th Edition Berger et al AIHA Press 2000
A Strategy for Assessing and Managing Occupational Exposures, 3rd Edition AIHA Press 2006
NIOSH Criteria for a Recommended Standard: Occupational Noise Exposure DHHS (NIOSH) Pub. No. 98-126
NIOSH Preventing Occupational Hearing Loss: A Practical Guide DHHS (NIOSH) Pub. No. 96-110 • NIOSH Documents
– 1-800-356-4674 or– www.cdc.gov/niosh/topics/noise/pubs/no_pubs.html
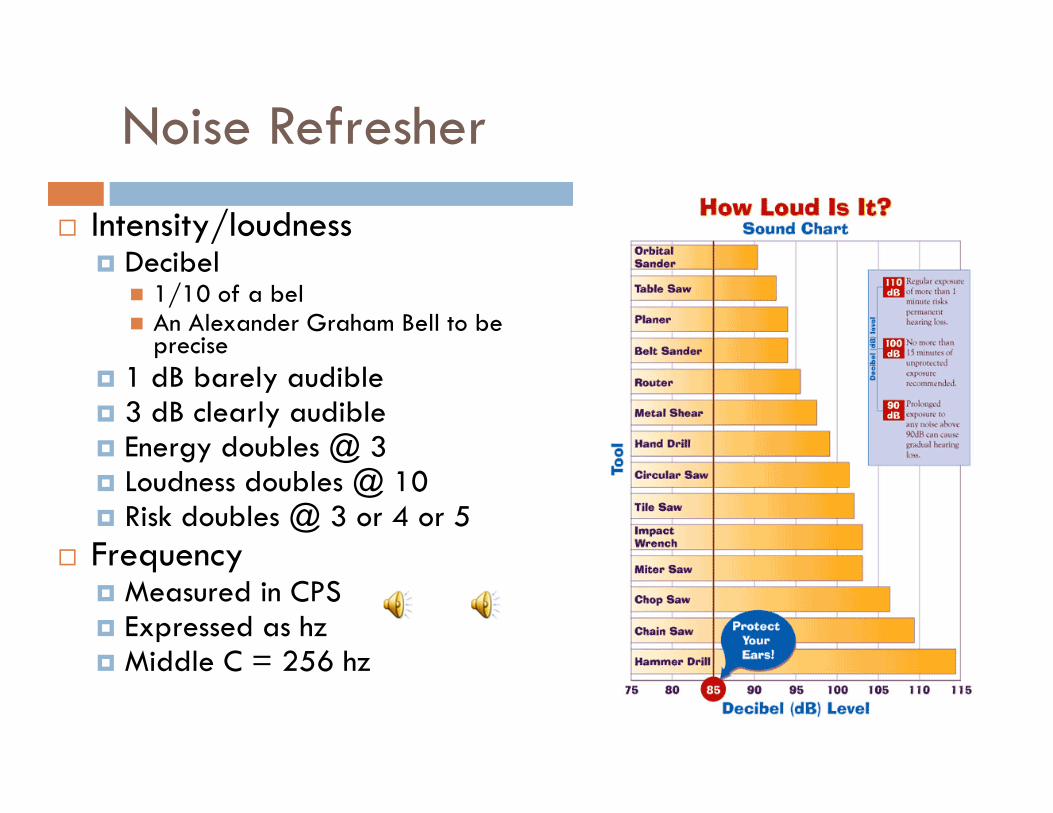
Noise Refresher
Intensity/loudness Decibel 1/10 of a bel An Alexander Graham Bell to be
precise 1 dB barely audible 3 dB clearly audible Energy doubles @ 3 Loudness doubles @ 10 Risk doubles @ 3 or 4 or 5
Frequency Measured in CPS Expressed as hz Middle C = 256 hz
Lee’s Corollary
Sound or Noise vs Exposure Noise People Time
E = N*P*T
As N, P, or T approach zero, so should our concern!
Who do I sample?
Work Force Characterization EAS Strategy
Similar exposure groups (SEG) Groups of workers with similar risk of
exposure Similar location Similar operations Similar risk of exposure?
Base organizational unit Representative Personal Monitoring
Setting UP SEG
At the core, SEG is representation of how the facility operates Who works where? What do they do? How do they group?
Existing personnel infrastructure Department Job Classification
Existing production infrastructure Processes Tasks
Resources A Strategy for Assessing and
Managing Occupational Exposures, AIHA Press 2006
Quick Overview 5 Steps to Industrial Hygiene
Exposure Assessments ISHN January 2006, Spear
AIHA Noise Manual, Chapter 7
Alternative Selection Strategies
Random Sampling Sufficient Days People Conditions
To represent conditions
Within SEG better
Targeted Sampling– “I only sample where I
know I have a problem”– STS/Hearing Loss
A little late, don’t you think?
– Evident problemsMay miss
– Mobility– Intermittency
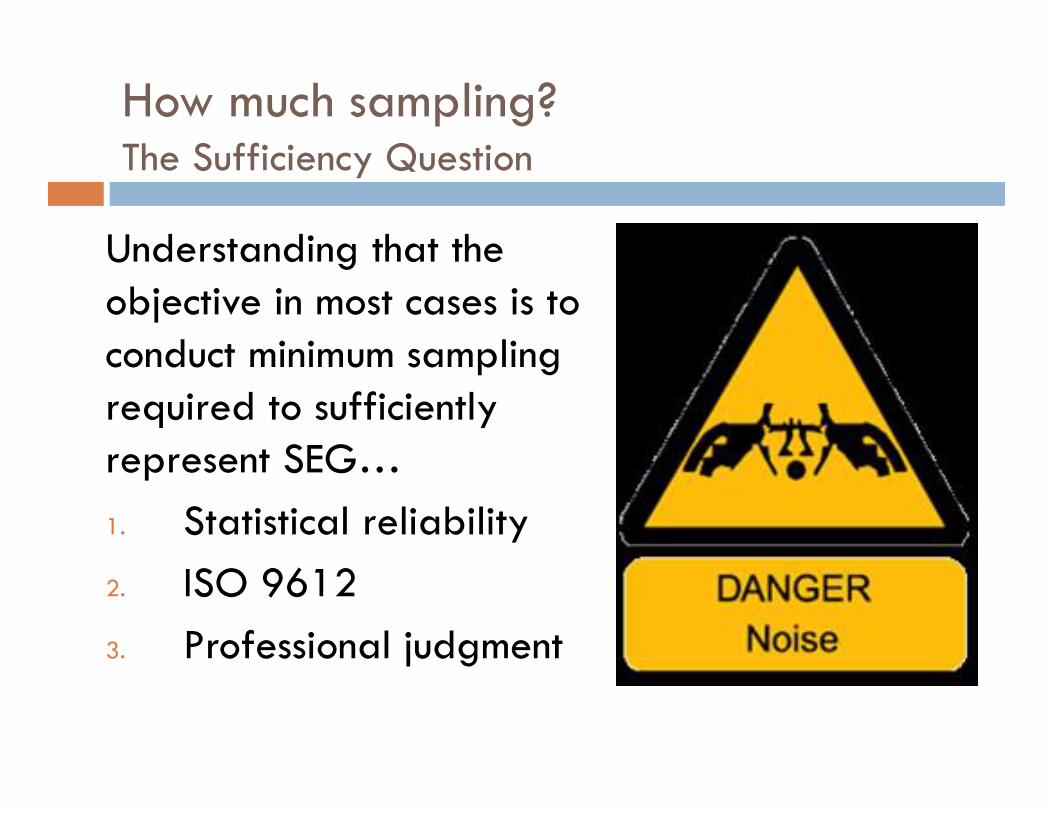
How much sampling?The Sufficiency Question
Understanding that the objective in most cases is to conduct minimum sampling required to sufficiently represent SEG…1. Statistical reliability2. ISO 96123. Professional judgment
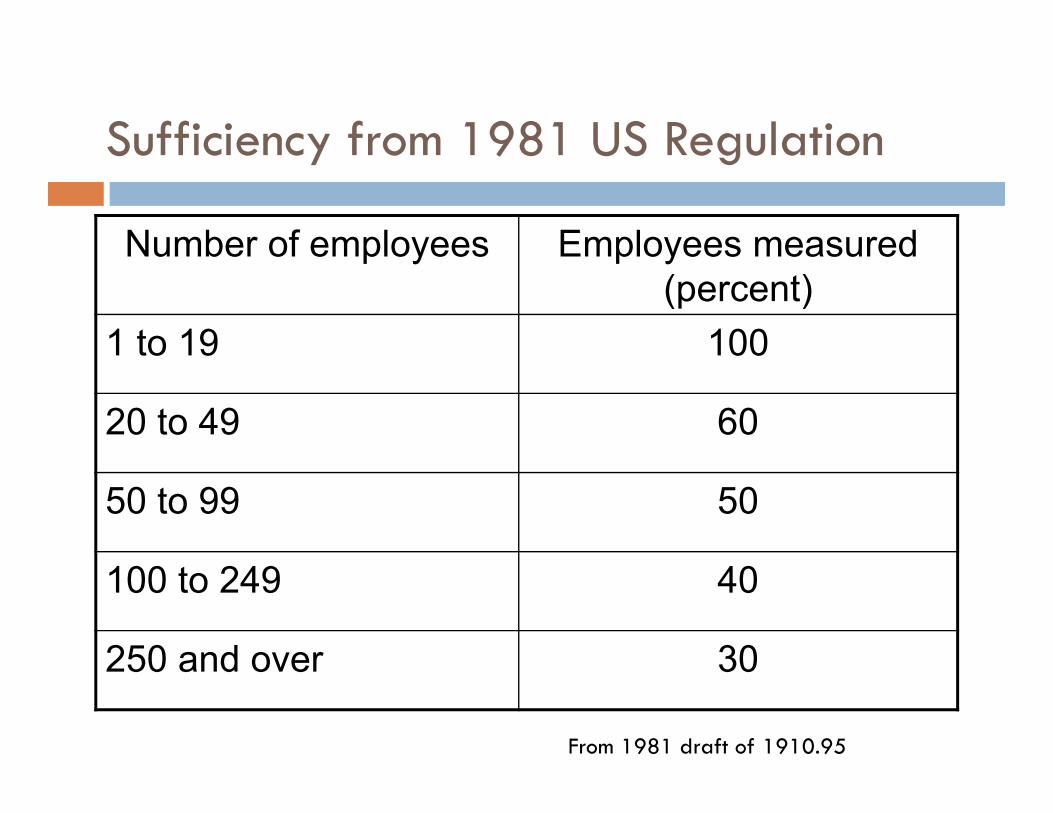
Sufficiency from 1981 US Regulation
Number of employees Employees measured (percent)
1 to 19 100
20 to 49 60
50 to 99 50
100 to 249 40
250 and over 30
From 1981 draft of 1910.95

1. Statistical reliability
As above to Include One or More Observations for Employeeswith Exposure in the Top 10% of the Distribution
Size of Group (N) 12 13-14 15-16 17-18 19-21 22-24 25-27 28-31 32-25 36-41 42-50 51+
29Required # of Measured 12 13 14 15 16 17 1811 19 20 21
Sample Size Needed to Ensure at the 95% Confidence Level thatthe Sample Will Include One or More Observations for Employees
with Exposure in the Top 20% of the Distribution
Size of Group (N) 7-8 9-11 12-14 15-18 19-26 27-43 44-50 51+
9 10 11 12 14Required # of Measured 6 7 8
From Leidel, Busch & Lynch, 1977
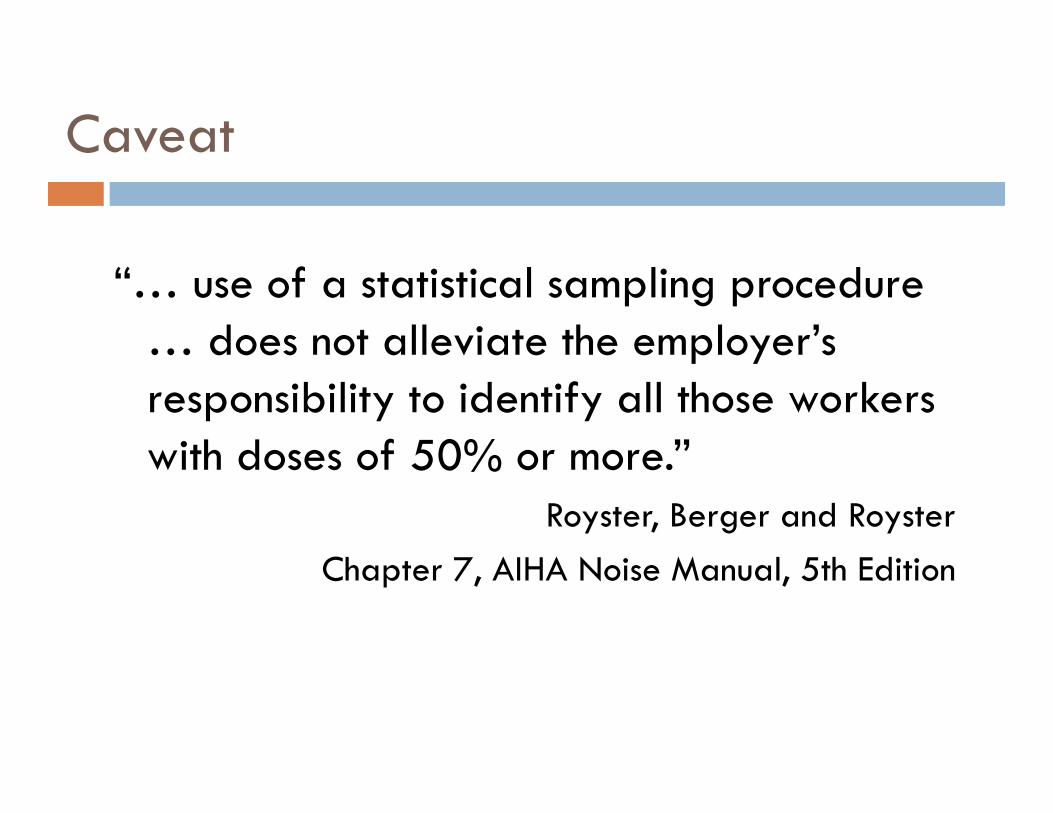
Caveat
“… use of a statistical sampling procedure … does not alleviate the employer’s responsibility to identify all those workers with doses of 50% or more.”
Royster, Berger and RoysterChapter 7, AIHA Noise Manual, 5th Edition
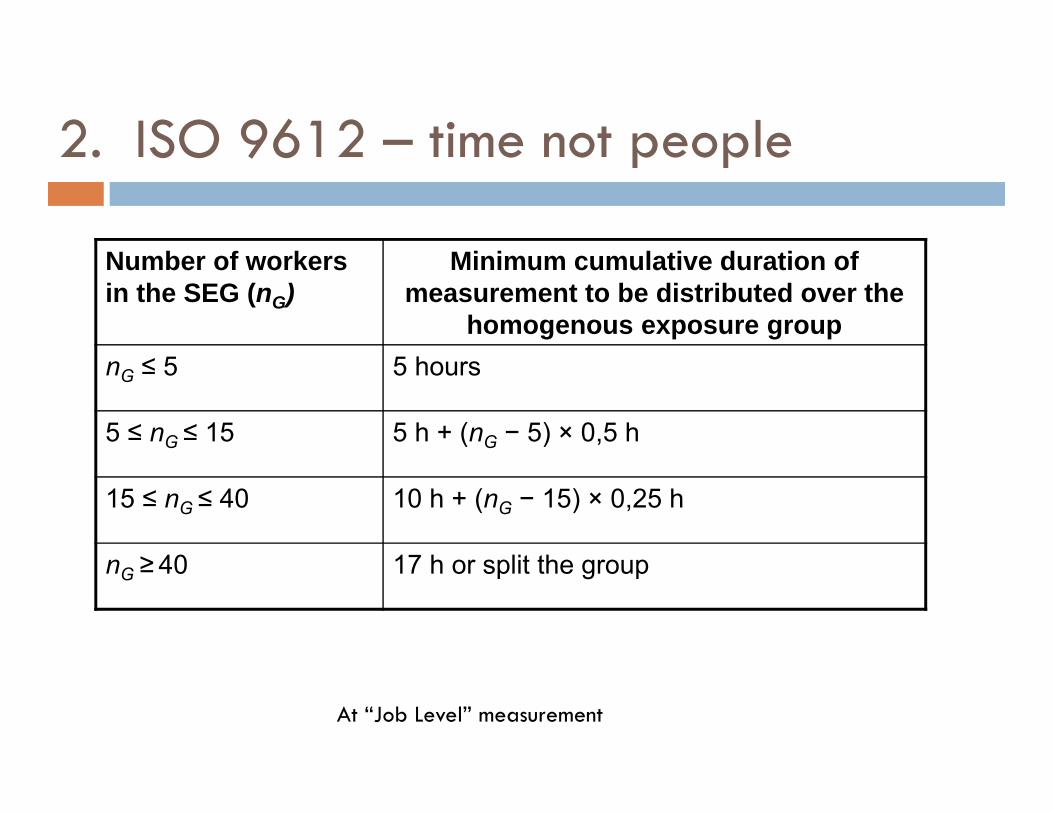
2. ISO 9612 – time not people
Number of workers in the SEG (nG)
Minimum cumulative duration of measurement to be distributed over the
homogenous exposure groupnG ≤ 5 5 hours
5 ≤ nG ≤ 15 5 h + (nG − 5) × 0,5 h
15 ≤ nG ≤ 40 10 h + (nG − 15) × 0,25 h
nG ≥ 40 17 h or split the group
At “Job Level” measurement
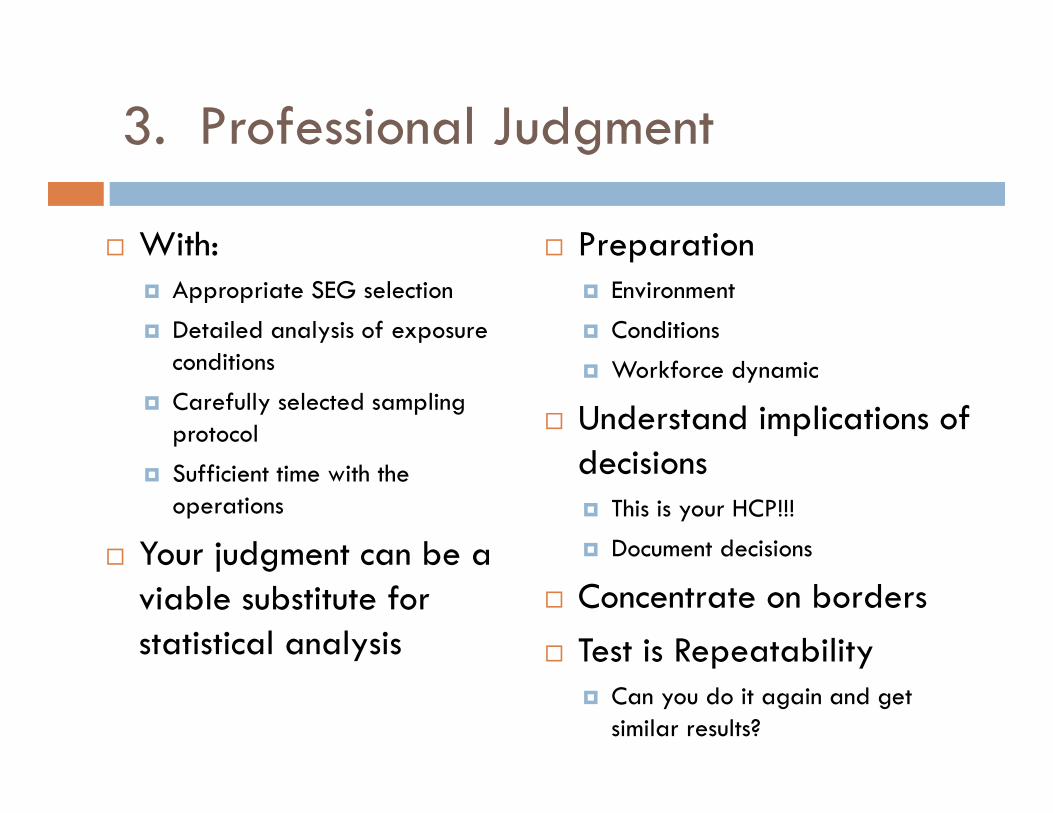
3. Professional Judgment
With: Appropriate SEG selection
Detailed analysis of exposure conditions
Carefully selected sampling protocol
Sufficient time with the operations
Your judgment can be a viable substitute for statistical analysis
Preparation Environment
Conditions
Workforce dynamic
Understand implications of decisions This is your HCP!!!
Document decisions
Concentrate on borders Test is Repeatability
Can you do it again and get similar results?
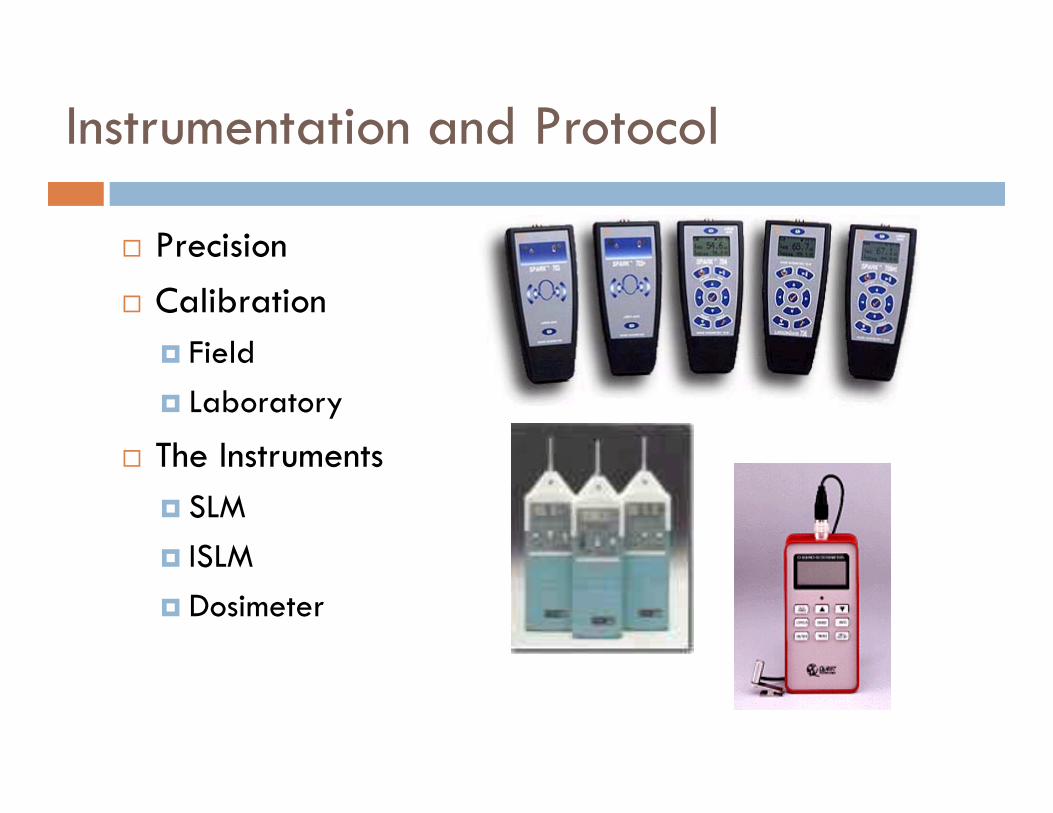
Instrumentation and Protocol
Precision Calibration
Field Laboratory
The Instruments SLM ISLM Dosimeter
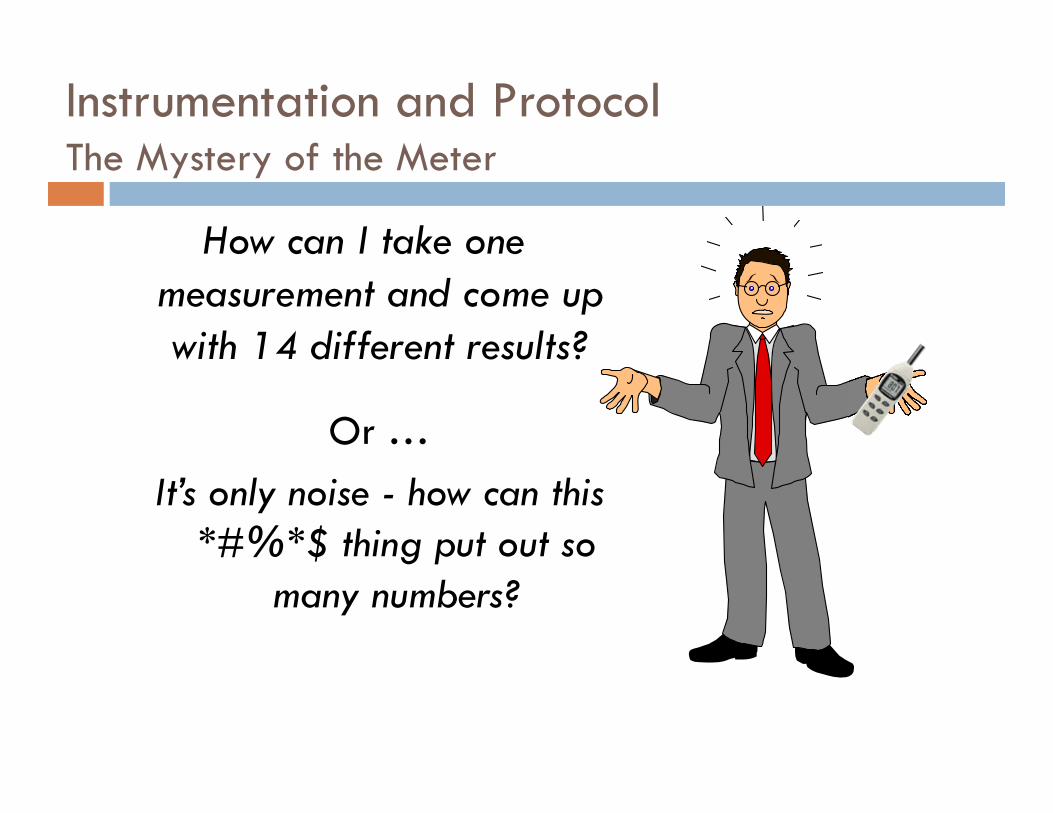
Instrumentation and Protocol The Mystery of the Meter
How can I take one measurement and come up with 14 different results?
Or …It’s only noise - how can this
*#%*$ thing put out so many numbers?
From a leading mfr website
“…then the high performance … is your noise dosimeter. This Type 1 noise dosimeter logs Lavg/Leq, FastMax, SlowMax, FastMin, SlowMin, Fast Ceiling Count, Slow Ceiling Count and Lpeak at intervals from 1 second up to 1 hour.” Editorial aside: 8 parameters recorded every second 480 data points per minute 28,800 data points per hour 230,400 data points per 8-hour shift
“It includes (4) virtual noise dosimeters to measure (4) separate noise standards.” Editor, again: 921,600 data point per shift
Paralysis by Analysis
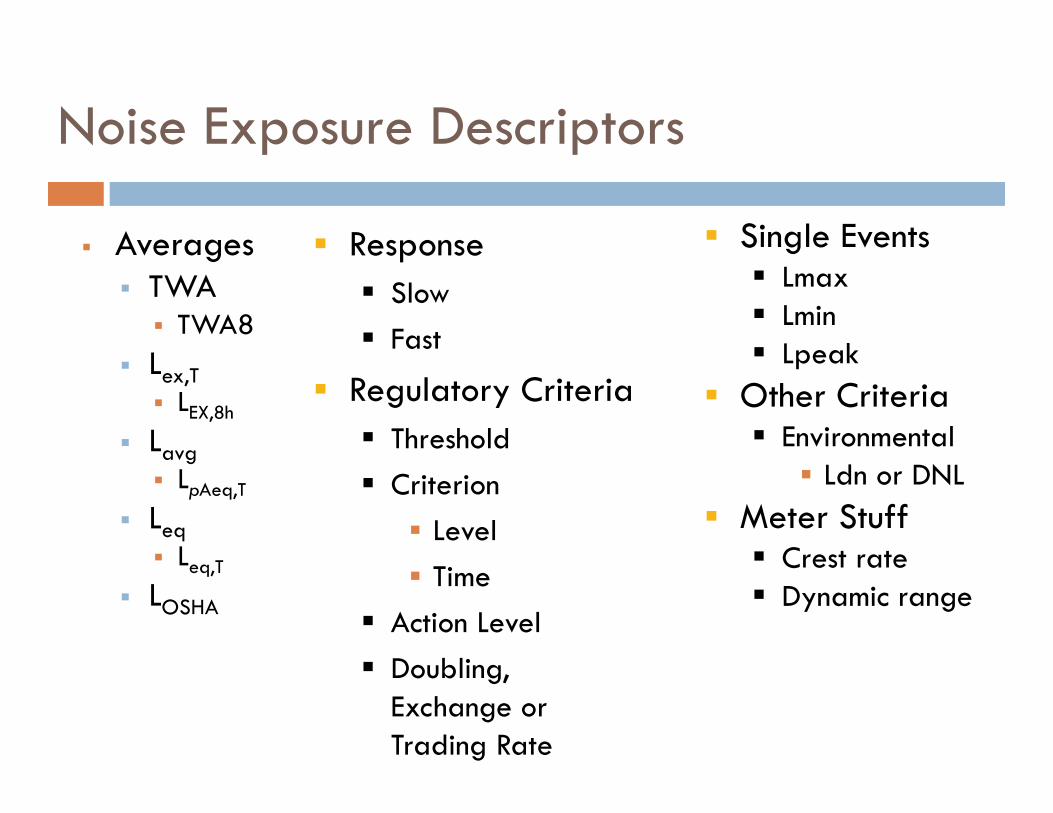
Noise Exposure Descriptors
Averages TWA TWA8
Lex,T LEX,8h
Lavg LpAeq,T
Leq Leq,T
LOSHA
Response Slow Fast
Regulatory Criteria Threshold Criterion Level Time
Action Level Doubling,
Exchange or Trading Rate
Single Events Lmax Lmin Lpeak
Other Criteria Environmental Ldn or DNL
Meter Stuff Crest rate Dynamic range
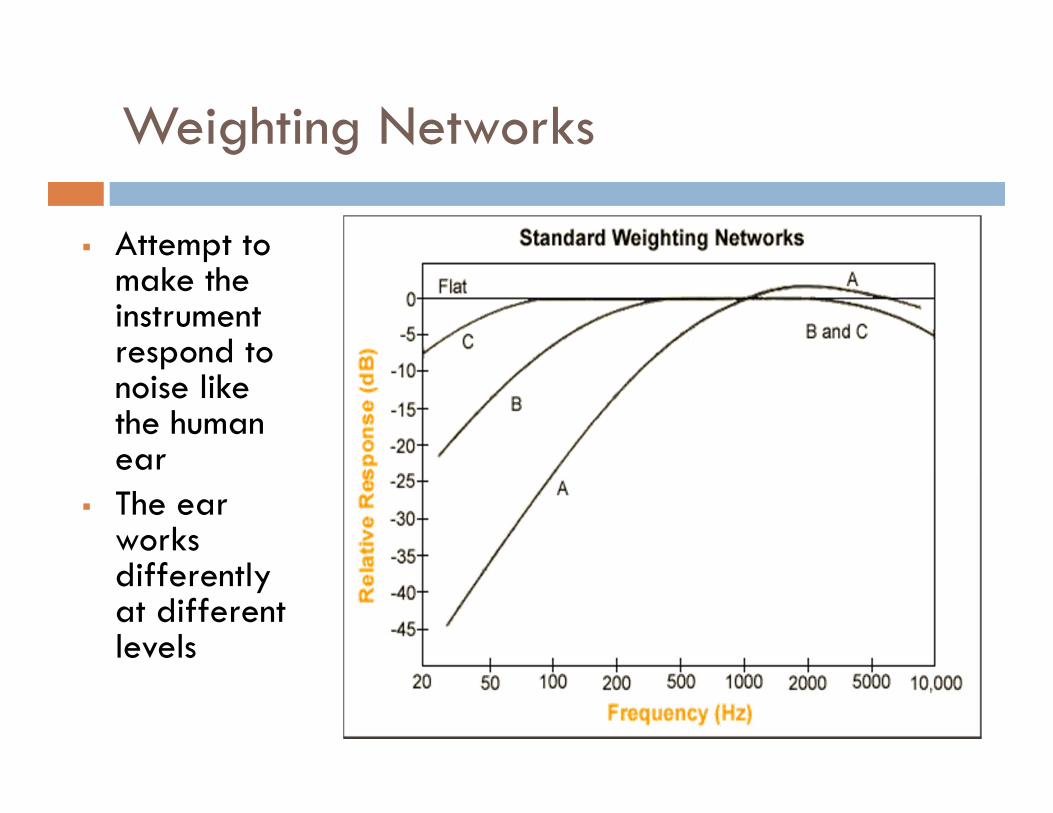
Weighting Networks
Attempt to make the instrument respond to noise like the human ear
The ear works differently at different levels
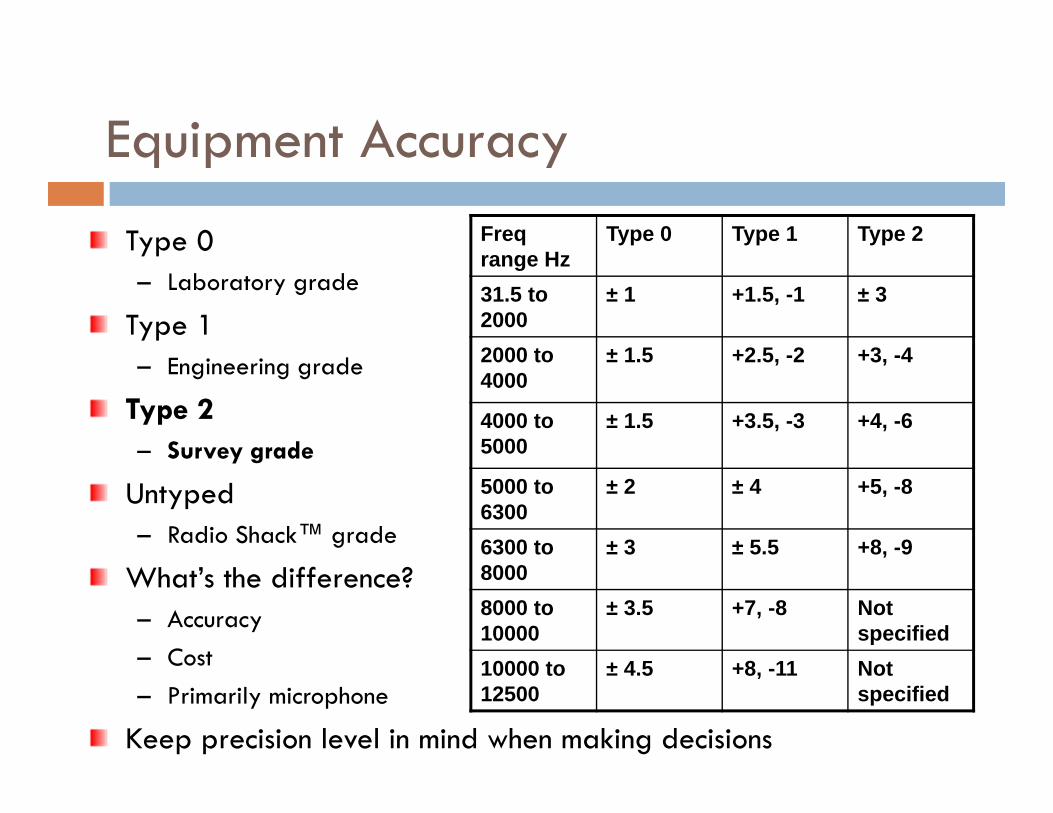
Equipment AccuracyFreq range Hz
Type 0 Type 1 Type 2
31.5 to 2000
± 1 +1.5, -1 ± 3
2000 to 4000
± 1.5 +2.5, -2 +3, -4
4000 to 5000
± 1.5 +3.5, -3 +4, -6
5000 to 6300
± 2 ± 4 +5, -8
6300 to 8000
± 3 ± 5.5 +8, -9
8000 to 10000
± 3.5 +7, -8 Not specified
10000 to 12500
± 4.5 +8, -11 Not specified
Type 0 – Laboratory grade
Type 1 – Engineering grade
Type 2 – Survey grade
Untyped – Radio Shack™ grade
What’s the difference?– Accuracy– Cost– Primarily microphone
Keep precision level in mind when making decisions
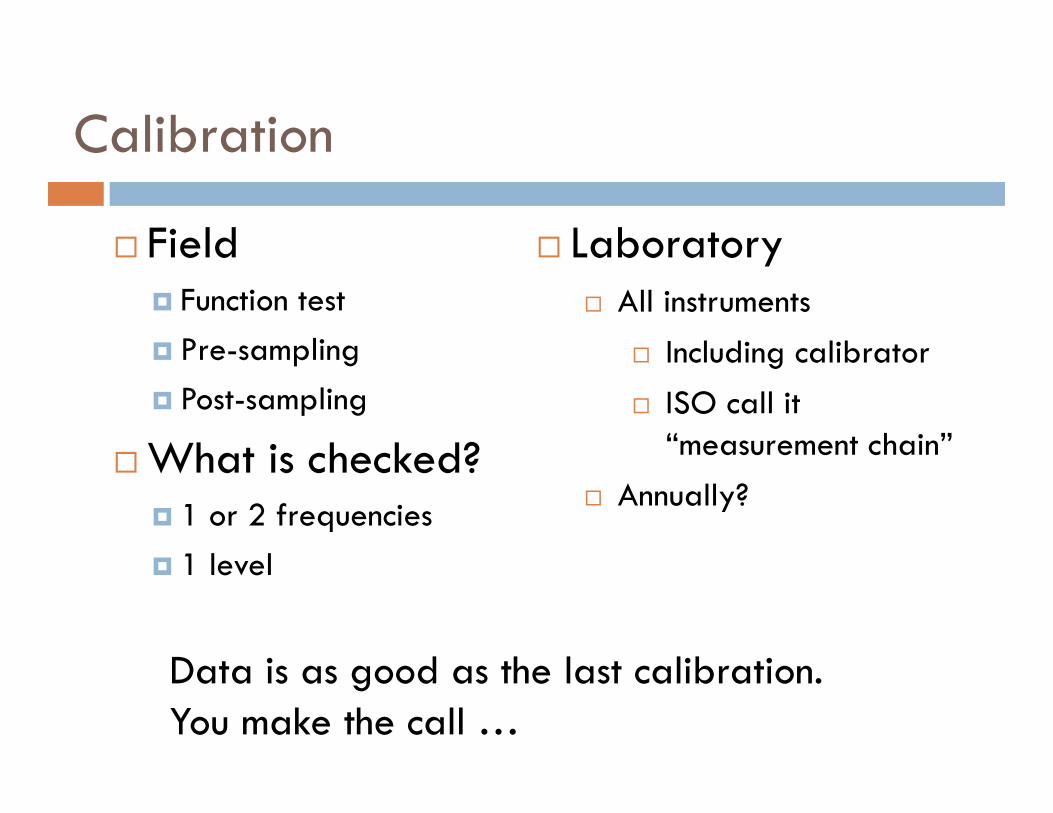
Calibration
Field Function test Pre-sampling Post-sampling
What is checked? 1 or 2 frequencies 1 level
Data is as good as the last calibration. You make the call …
Laboratory All instruments
Including calibrator ISO call it
“measurement chain” Annually?
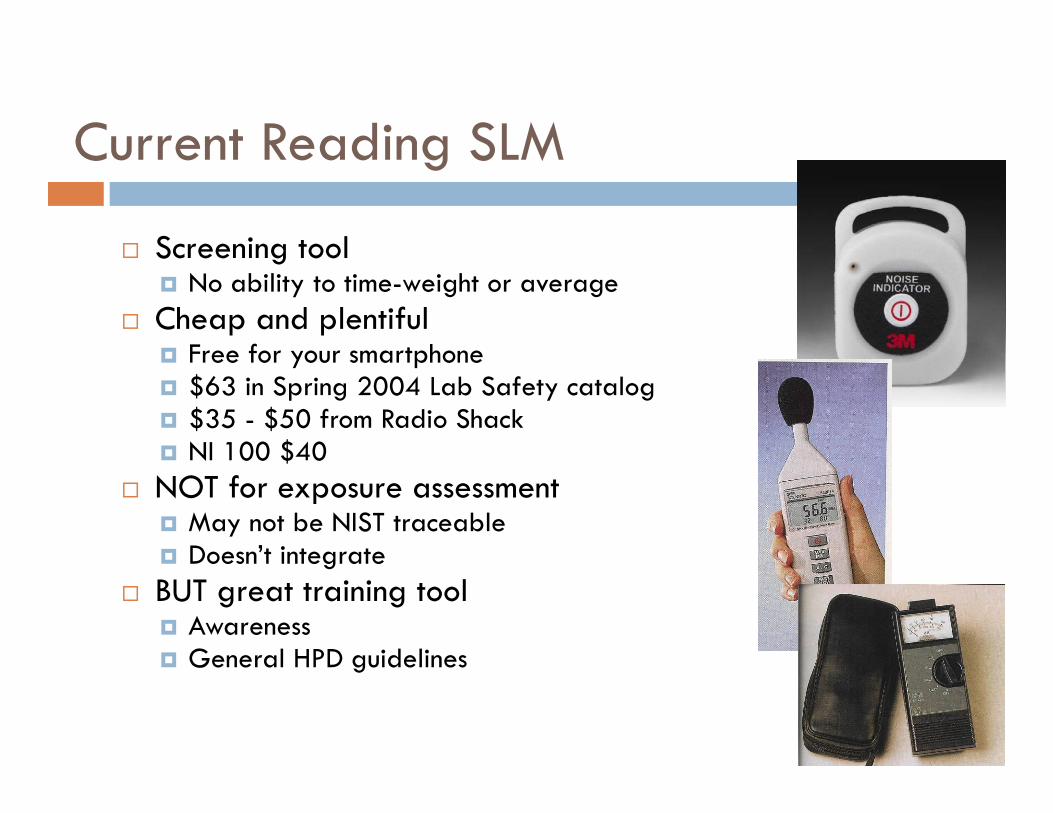
Current Reading SLM
Screening tool No ability to time-weight or average
Cheap and plentiful Free for your smartphone $63 in Spring 2004 Lab Safety catalog $35 - $50 from Radio Shack NI 100 $40
NOT for exposure assessment May not be NIST traceable Doesn’t integrate
BUT great training tool Awareness General HPD guidelines

Integrating Sound Level Meter
Most function as dosimeters and vice versa
What’s the difference? Dosimeters designed to be small ISLM designed for function Many w/OBA capabilities Some available as Type 1
Like dosimeter, internal averaging Like SLM, real-time short duration
readout
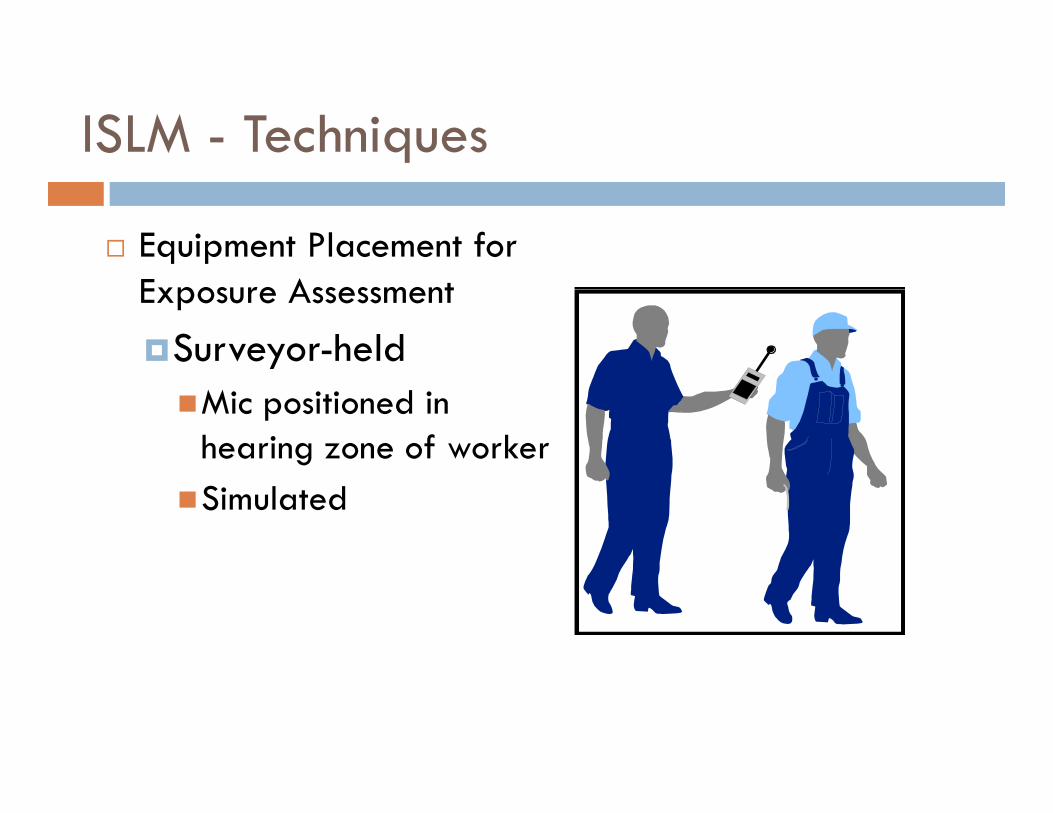
ISLM - Techniques
Equipment Placement for Exposure Assessment
Surveyor-heldMic positioned in
hearing zone of workerSimulated
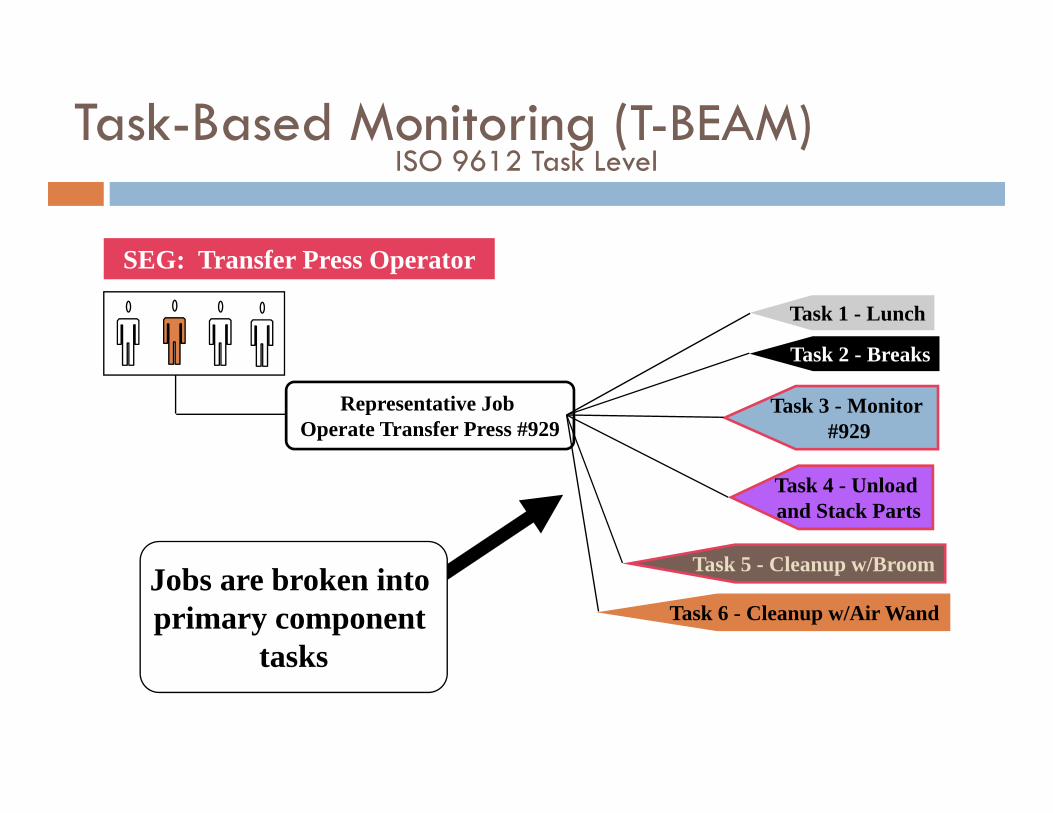
Task-Based Monitoring (T-BEAM)
Representative Job Operate Transfer Press #929
Jobs are broken into primary component
tasks
SEG: Transfer Press Operator
Task 2 - Breaks
Task 3 - Monitor #929
Task 1 - Lunch
Task 4 - Unload and Stack Parts
Task 5 - Cleanup w/Broom
Task 6 - Cleanup w/Air Wand
ISO 9612 Task Level
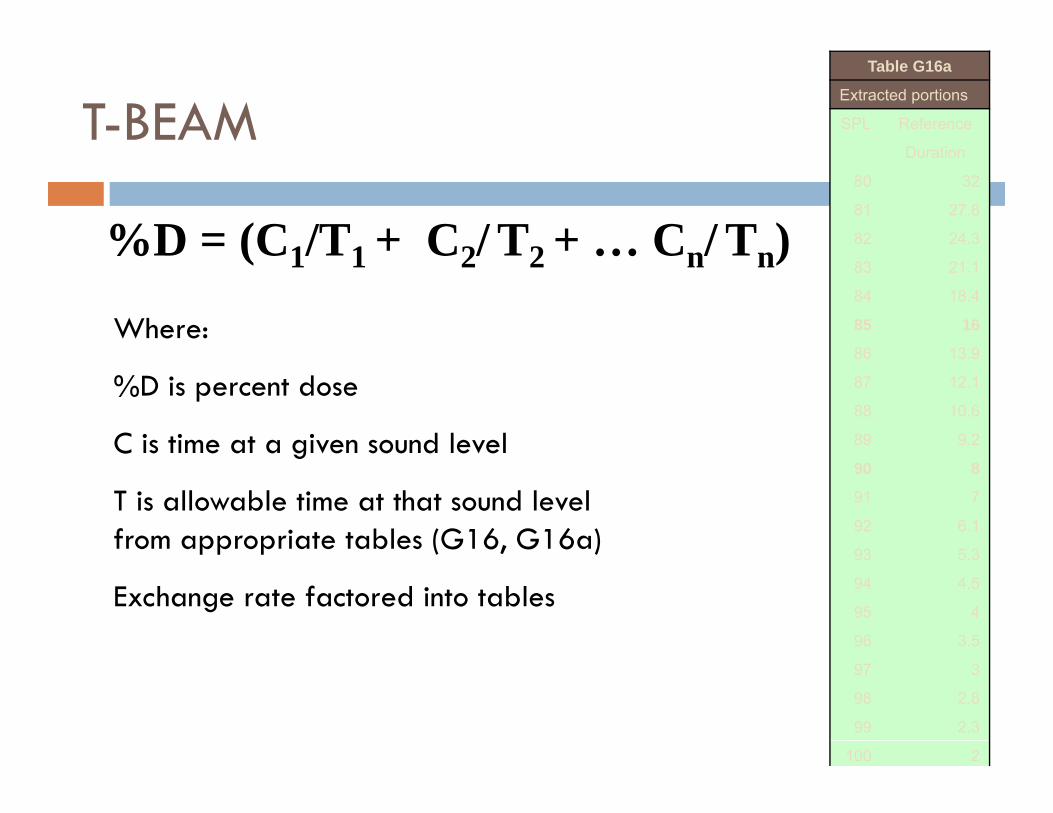
T-BEAMTable G16a
Extracted portions
SPL Reference
Duration
80 32
81 27.8
82 24.3
83 21.1
84 18.4
85 16
86 13.9
87 12.1
88 10.6
89 9.2
90 8
91 7
92 6.1
93 5.3
94 4.5
95 4
96 3.5
97 3
98 2.8
99 2.3
100 2
%D = (C1/T1 + C2/ T2 + … Cn/ Tn)
Where:
%D is percent dose
C is time at a given sound level
T is allowable time at that sound level from appropriate tables (G16, G16a)
Exchange rate factored into tables

Task-Based Noise Exposure Profile
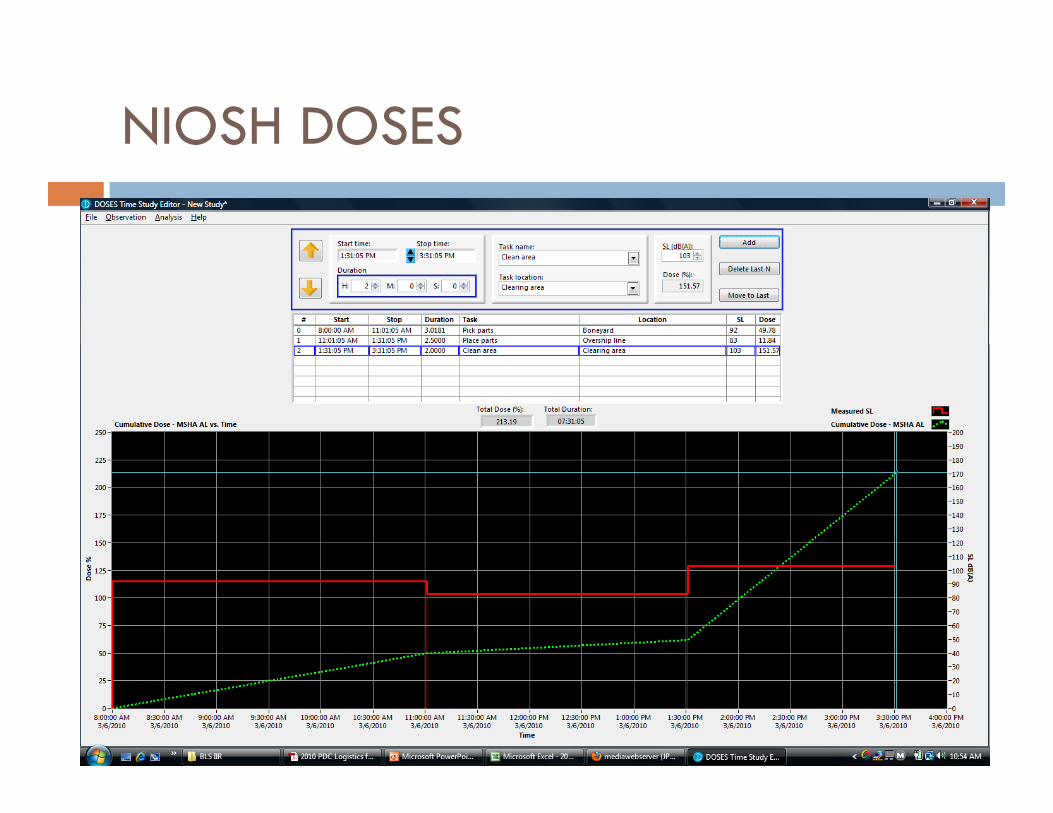
NIOSH DOSES
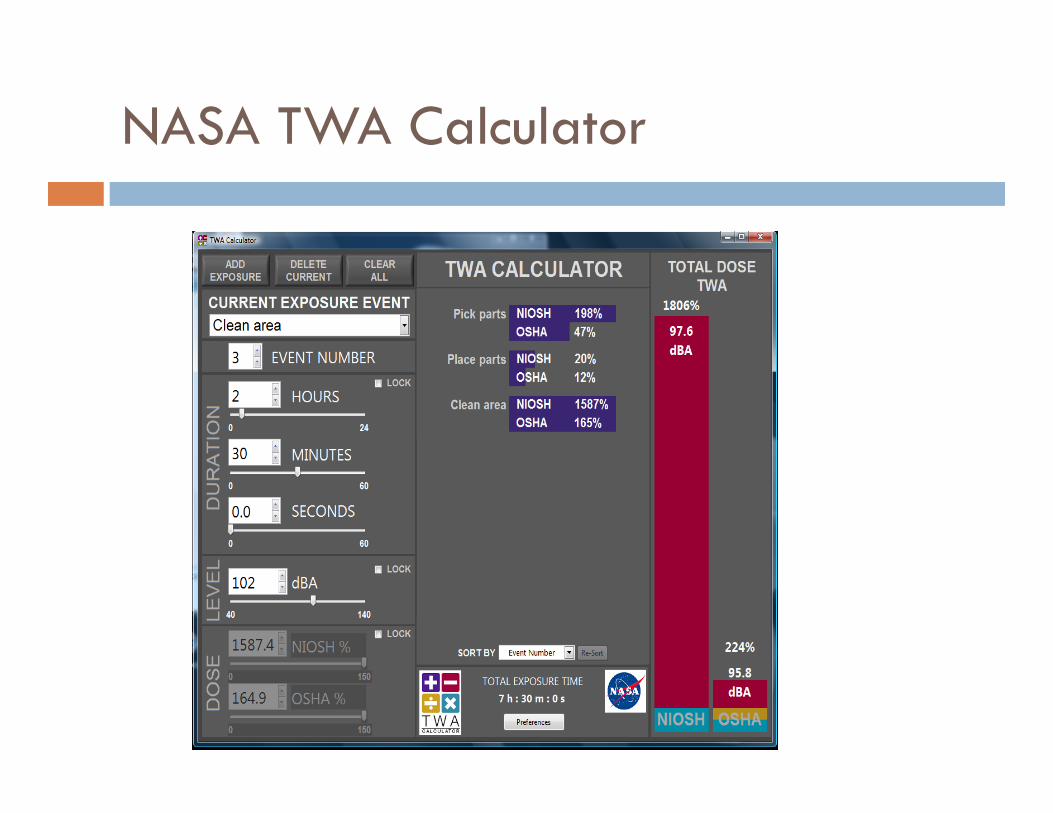
NASA TWA Calculator
ExampleAnalysis
Sampling Strategy
T-BEAM
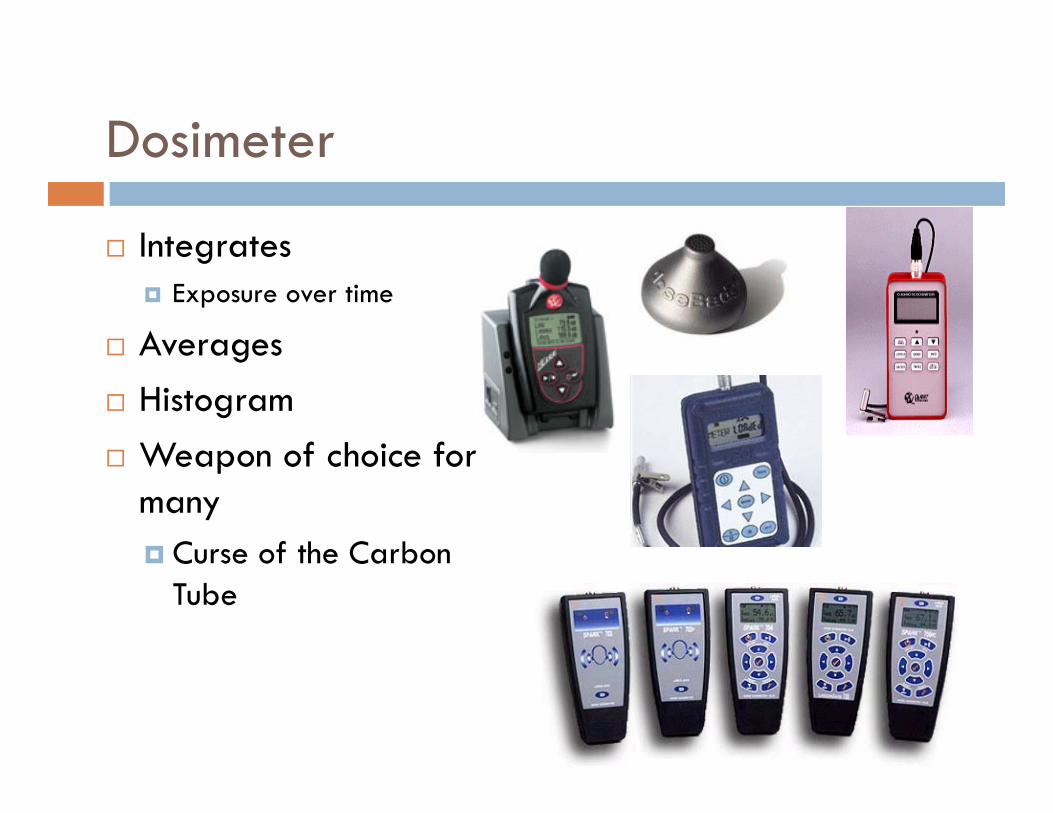
Dosimeter
Integrates Exposure over time
Averages Histogram Weapon of choice for
many Curse of the Carbon
Tube

Dosimeter Techniques
Equipment PlacementMicMid-shoulderOther
Under hood
Instrument Belt Vest Other New technology
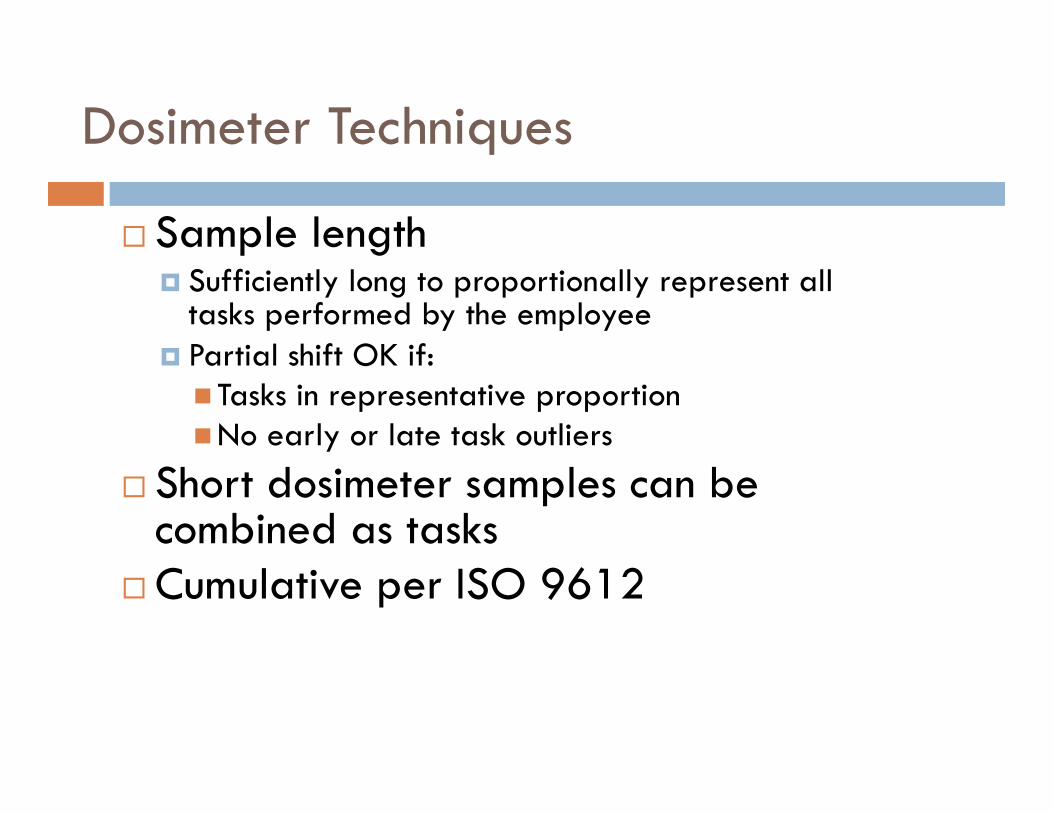
Dosimeter Techniques
Sample length Sufficiently long to proportionally represent all
tasks performed by the employee Partial shift OK if: Tasks in representative proportionNo early or late task outliers
Short dosimeter samples can be combined as tasks
Cumulative per ISO 9612
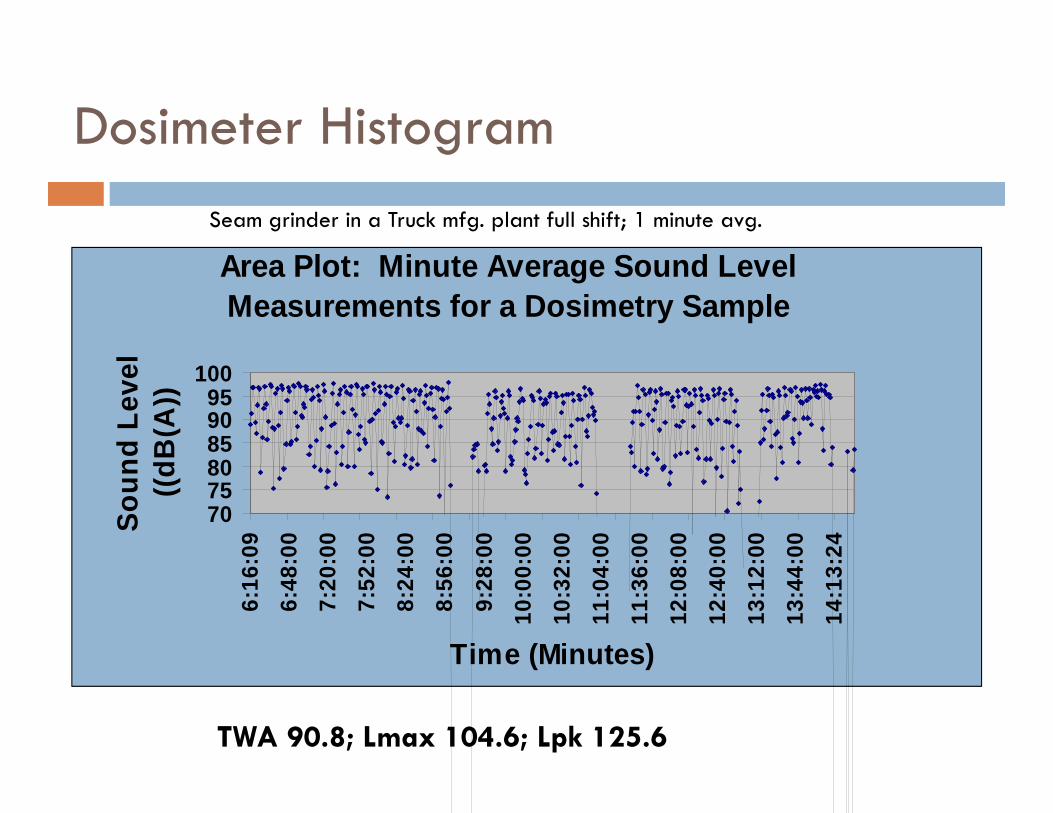
Dosimeter Histogram
Area Plot: Minute Average Sound Level Measurements for a Dosimetry Sample
707580859095
100
6:16
:09
6:48
:00
7:20
:00
7:52
:00
8:24
:00
8:56
:00
9:28
:00
10:0
0:00
10:3
2:00
11:0
4:00
11:3
6:00
12:0
8:00
12:4
0:00
13:1
2:00
13:4
4:00
14:1
3:24
Time (Minutes)
Soun
d Le
vel
((dB
(A))
Seam grinder in a Truck mfg. plant full shift; 1 minute avg.
TWA 90.8; Lmax 104.6; Lpk 125.6
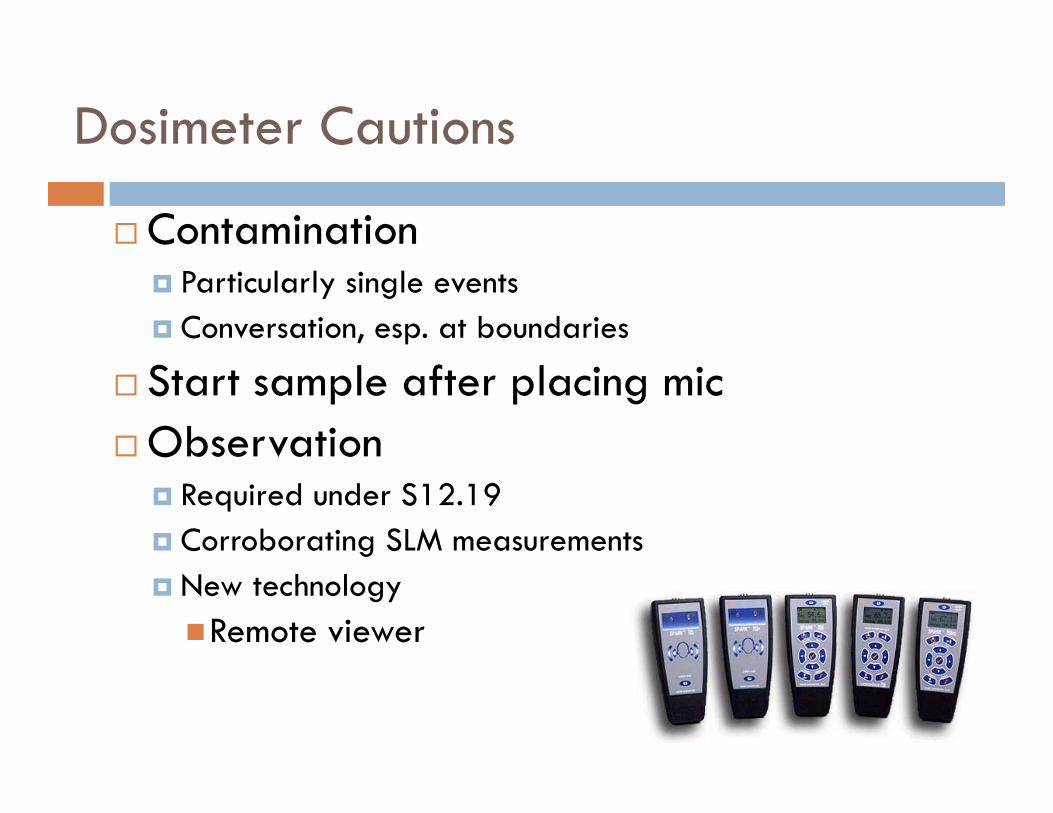
Dosimeter Cautions
Contamination Particularly single events Conversation, esp. at boundaries
Start sample after placing micObservation
Required under S12.19 Corroborating SLM measurements New technologyRemote viewer
Sampling During Breaks?
During lunch and break periods, the dosimeter should be: Left on Turned off Removed Placed on different employee Recalibrated Data should be edited in post processing
Well ….
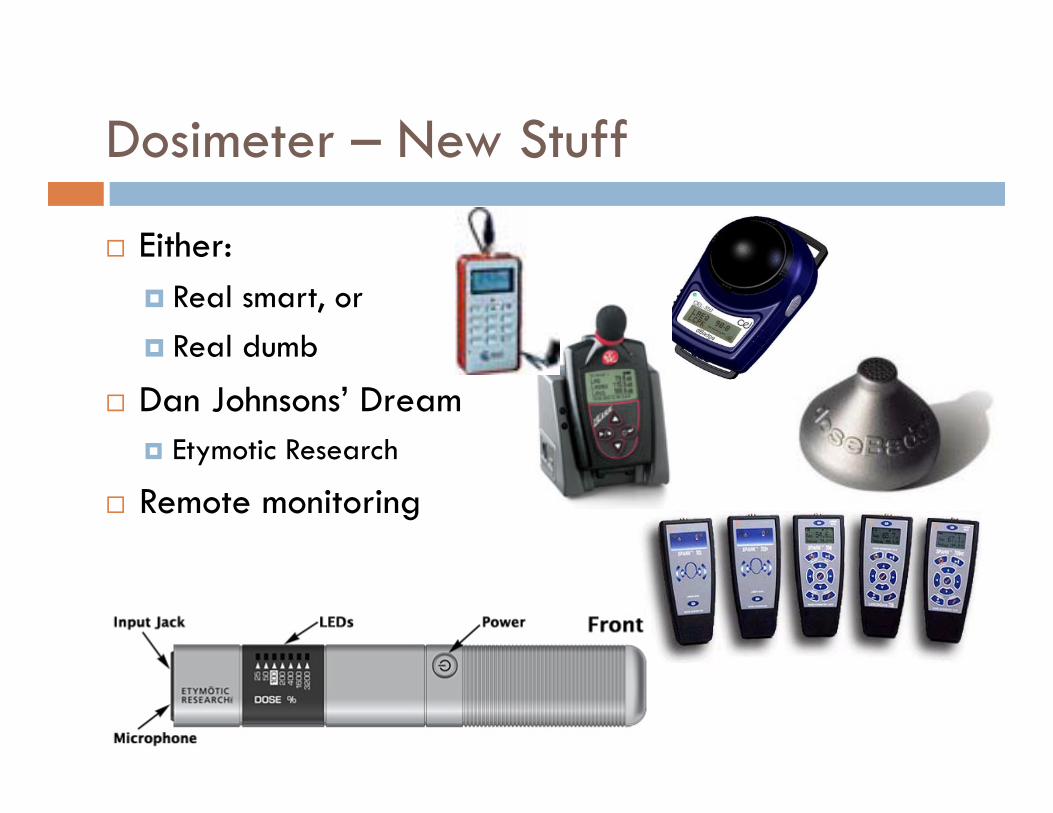
Dosimeter – New Stuff
Either: Real smart, or Real dumb
Dan Johnsons’ Dream Etymotic Research
Remote monitoring
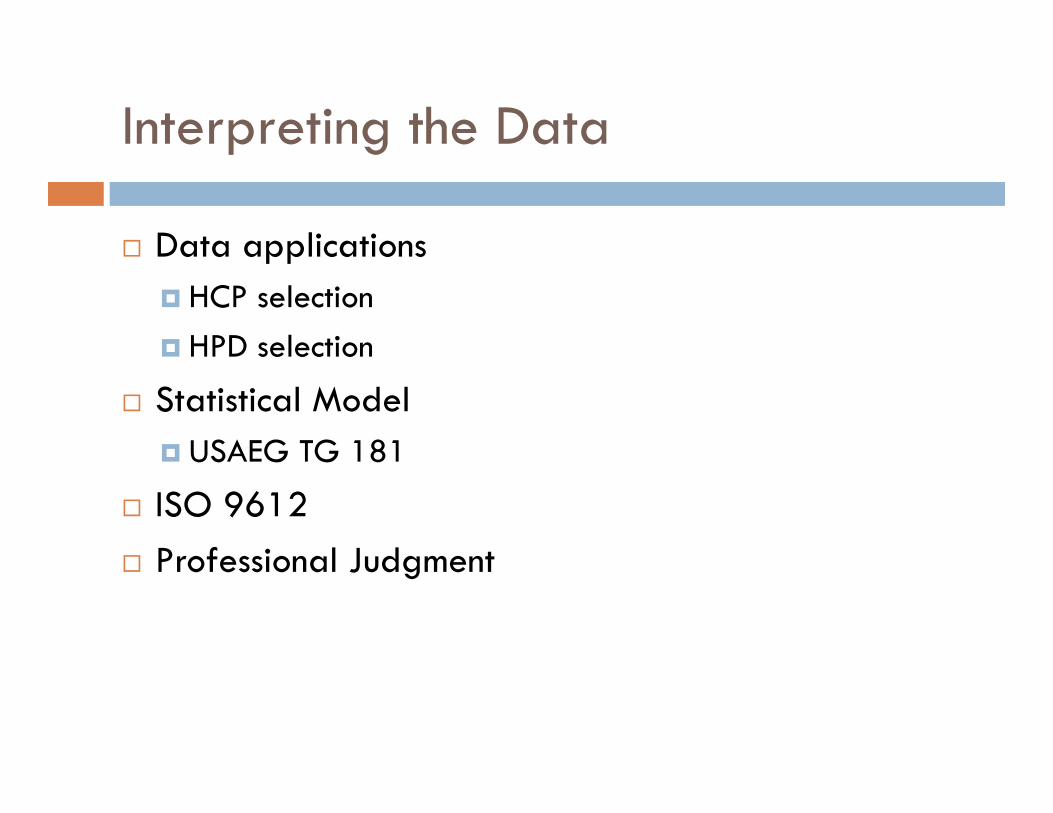
Interpreting the Data
Data applications HCP selection HPD selection
Statistical Model USAEG TG 181
ISO 9612 Professional Judgment
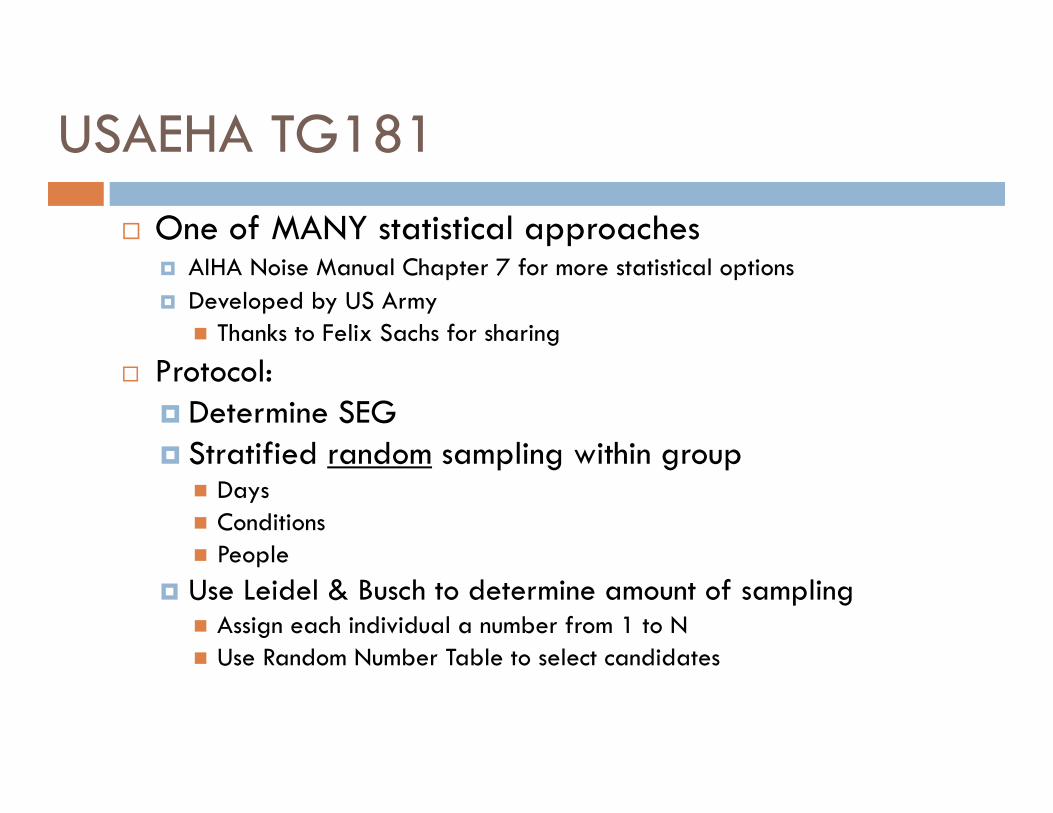
USAEHA TG181 One of MANY statistical approaches
AIHA Noise Manual Chapter 7 for more statistical options Developed by US Army Thanks to Felix Sachs for sharing
Protocol: Determine SEG Stratified random sampling within group Days Conditions People
Use Leidel & Busch to determine amount of sampling Assign each individual a number from 1 to N Use Random Number Table to select candidates

USAEHA TG181
Determine Individual Exposures (LTWA(8HR)) Dosimeter T-BEAM
Calculate Group TWA Risk Compute one-sided upper tolerance limit (UTL) for
the 90th percentile with a 75% confidence limit
Consider discarding TWA values below 80 dBA or rounding up to 80 to avoid scatter*
* Editorial comment: depending on dosimeter settings, this may or may not be a good idea.
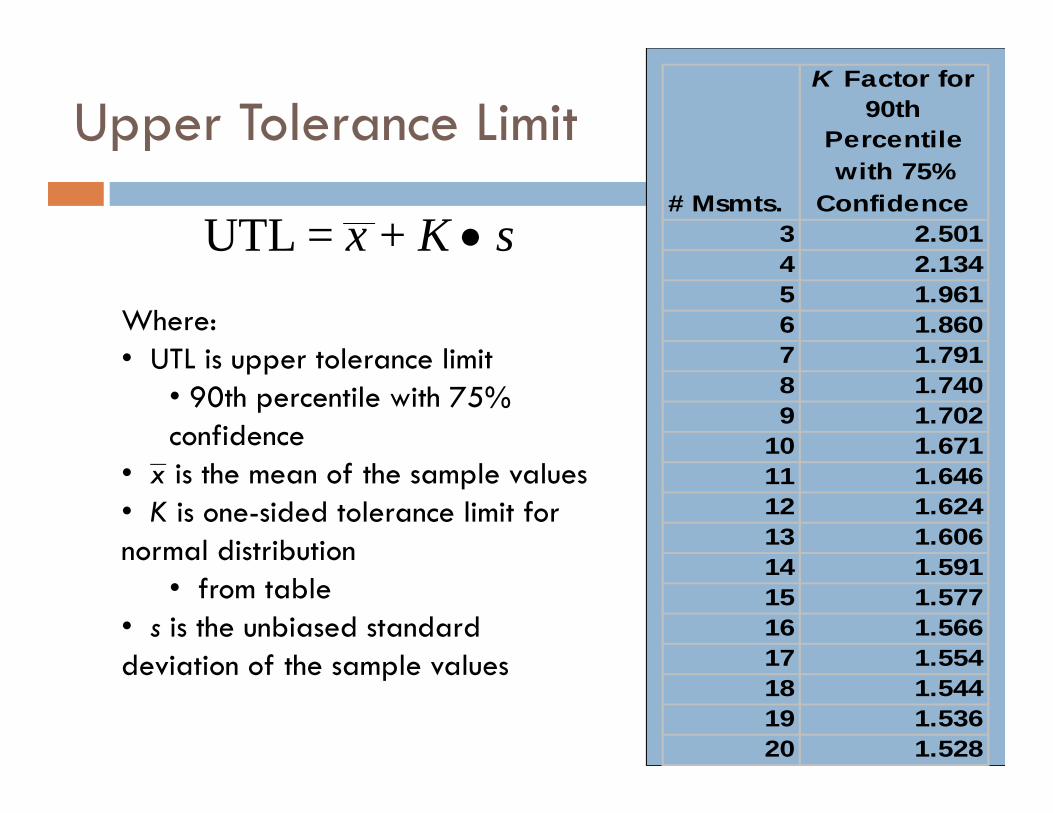
Upper Tolerance Limit
UTL = x + K s
Where:• UTL is upper tolerance limit
• 90th percentile with 75% confidence
• x is the mean of the sample values • K is one-sided tolerance limit for normal distribution
• from table• s is the unbiased standard deviation of the sample values
# Msmts.
K Factor for 90th
Percentile with 75%
Confidence3 2.5014 2.1345 1.9616 1.8607 1.7918 1.7409 1.702
10 1.67111 1.64612 1.62413 1.60614 1.59115 1.57716 1.56617 1.55418 1.54419 1.53620 1.528
ExampleAnalysis
TG-181
Bayesian Statistics
• Can you combine:• Your sampling data• Your best judgment• Other factors?
• Sure – with conservative results
Bayesian Analysis
ExampleAnalysis
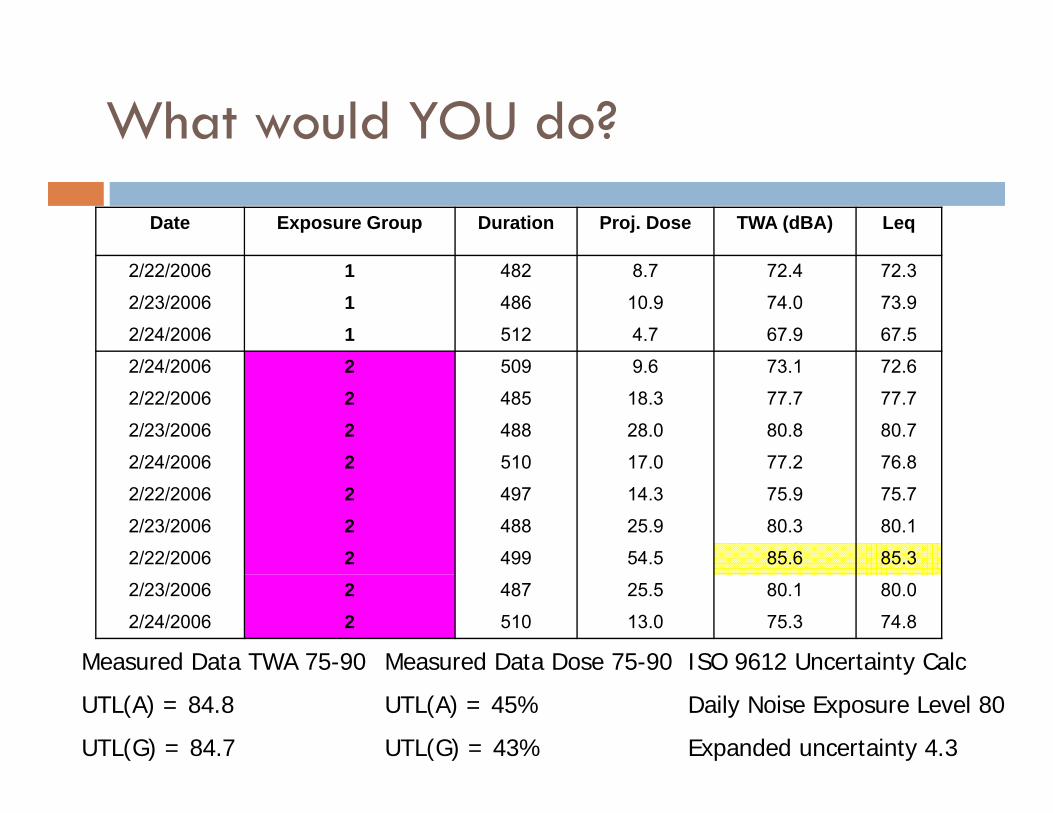
What would YOU do?
Date Exposure Group Duration Proj. Dose TWA (dBA) Leq
2/22/2006 1 482 8.7 72.4 72.3
2/23/2006 1 486 10.9 74.0 73.9
2/24/2006 1 512 4.7 67.9 67.5
2/24/2006 2 509 9.6 73.1 72.6
2/22/2006 2 485 18.3 77.7 77.7
2/23/2006 2 488 28.0 80.8 80.7
2/24/2006 2 510 17.0 77.2 76.8
2/22/2006 2 497 14.3 75.9 75.7
2/23/2006 2 488 25.9 80.3 80.1
2/22/2006 2 499 54.5 85.6 85.3
2/23/2006 2 487 25.5 80.1 80.0
2/24/2006 2 510 13.0 75.3 74.8
Measured Data TWA 75-90
UTL(A) = 84.8
UTL(G) = 84.7
Measured Data Dose 75-90
UTL(A) = 45%
UTL(G) = 43%
ISO 9612 Uncertainty Calc
Daily Noise Exposure Level 80
Expanded uncertainty 4.3
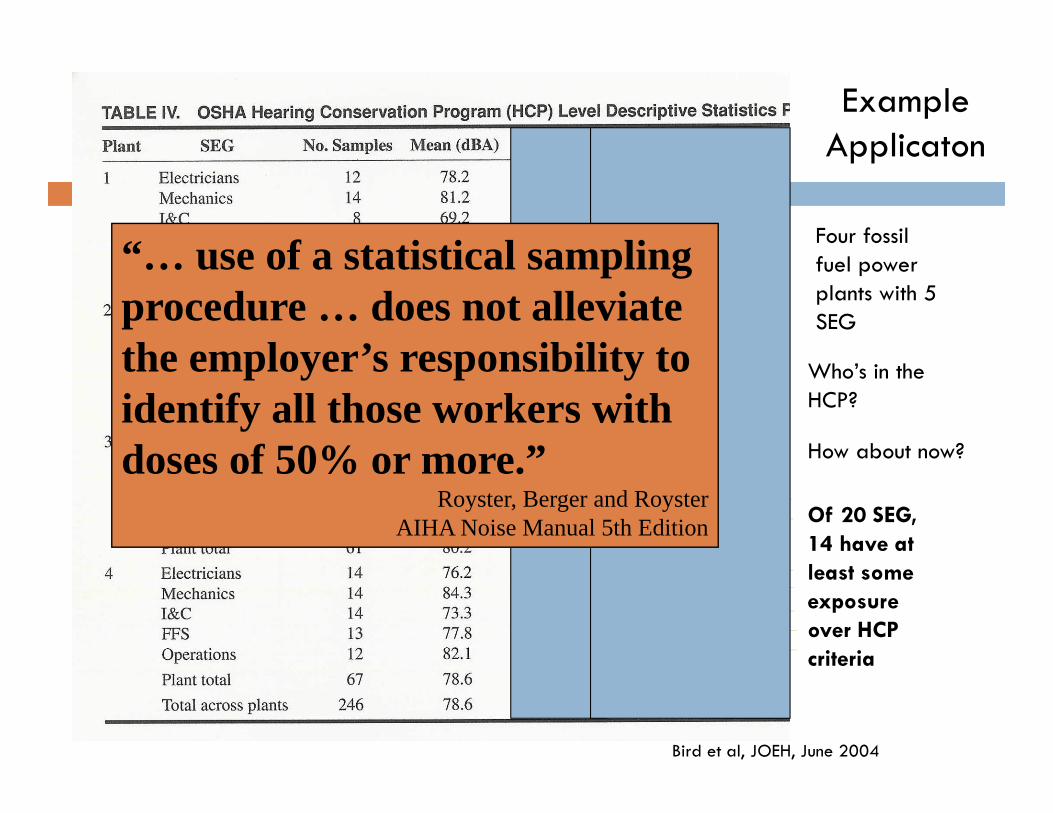
Bird et al, JOEH, June 2004
Of 20 SEG, 14 have at least some exposure over HCP criteria
“… use of a statistical sampling procedure … does not alleviate the employer’s responsibility to identify all those workers with doses of 50% or more.”
Royster, Berger and RoysterAIHA Noise Manual 5th Edition
Who’s in the HCP?
How about now?
Four fossil fuel power plants with 5 SEG
Example Applicaton

Accuracy and Classification
TWA (dBA) Classification84 or lower A
85 – 89 B90 – 94 C95 – 99 D
100 or above E
Keep accuracy limitations in mindClose scrutiny at borderlinesConsider class or group alternatives
Noise exposure classification scheme from Noise Manual, Roysteret al
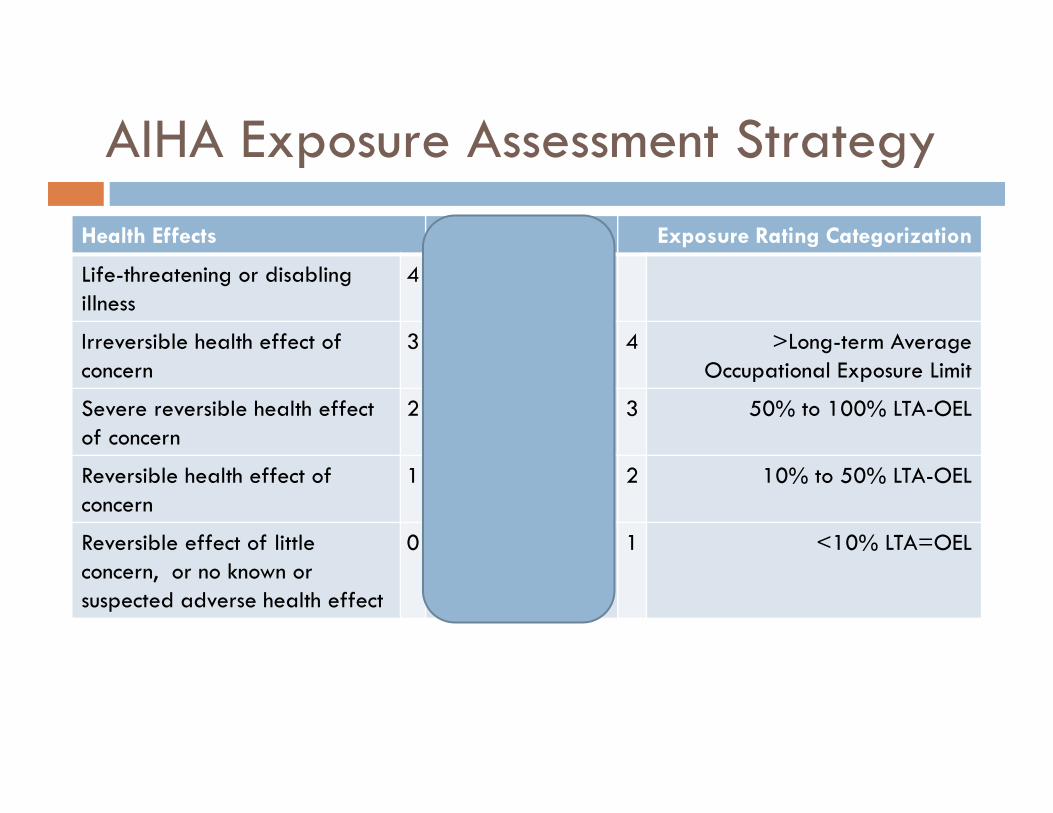
AIHA Exposure Assessment StrategyHealth Effects Lee’s dBA Est Exposure Rating Categorization
Life-threatening or disabling illness
4 >105
Irreversible health effect of concern
3 90-105 4 >Long-term Average Occupational Exposure Limit
Severe reversible health effect of concern
2 85-90 3 50% to 100% LTA-OEL
Reversible health effect ofconcern
1 80-85 2 10% to 50% LTA-OEL
Reversible effect of little concern, or no known or suspected adverse health effect
0 <80 1 <10% LTA=OEL
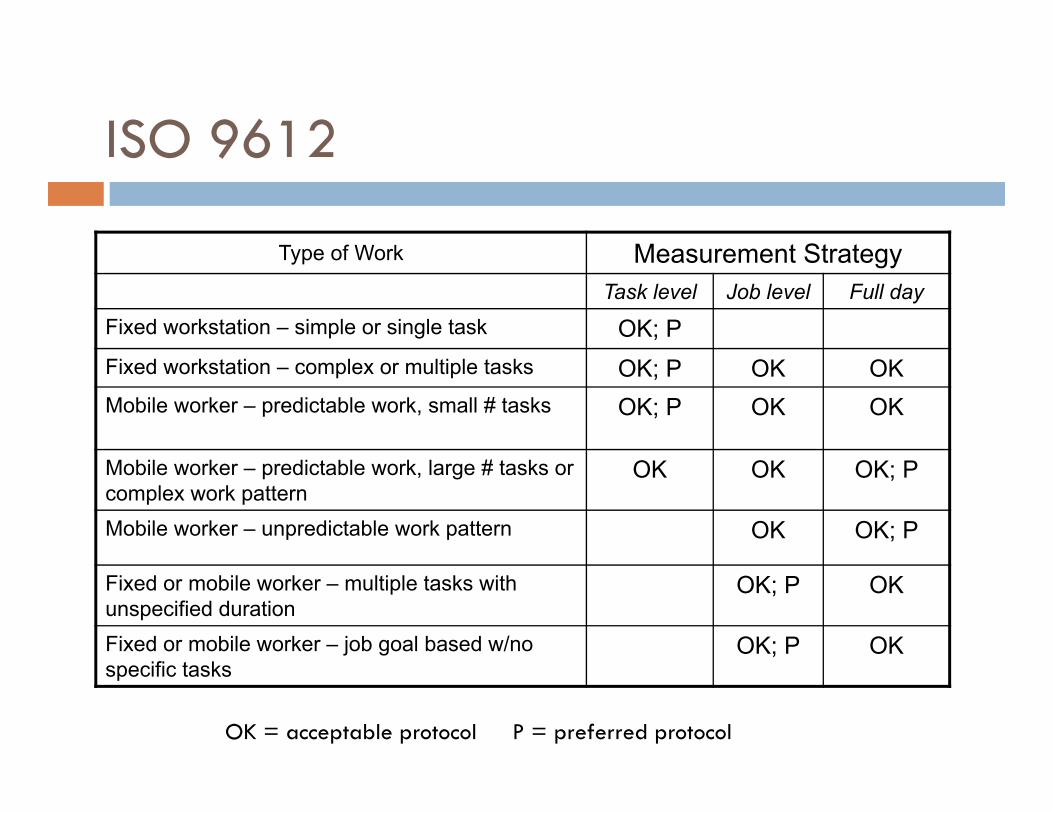
ISO 9612
Type of Work Measurement StrategyTask level Job level Full day
Fixed workstation – simple or single task OK; PFixed workstation – complex or multiple tasks OK; P OK OKMobile worker – predictable work, small # tasks OK; P OK OK
Mobile worker – predictable work, large # tasks or complex work pattern
OK OK OK; P
Mobile worker – unpredictable work pattern OK OK; P
Fixed or mobile worker – multiple tasks with unspecified duration
OK; P OK
Fixed or mobile worker – job goal based w/no specific tasks
OK; P OK
OK = acceptable protocol P = preferred protocol
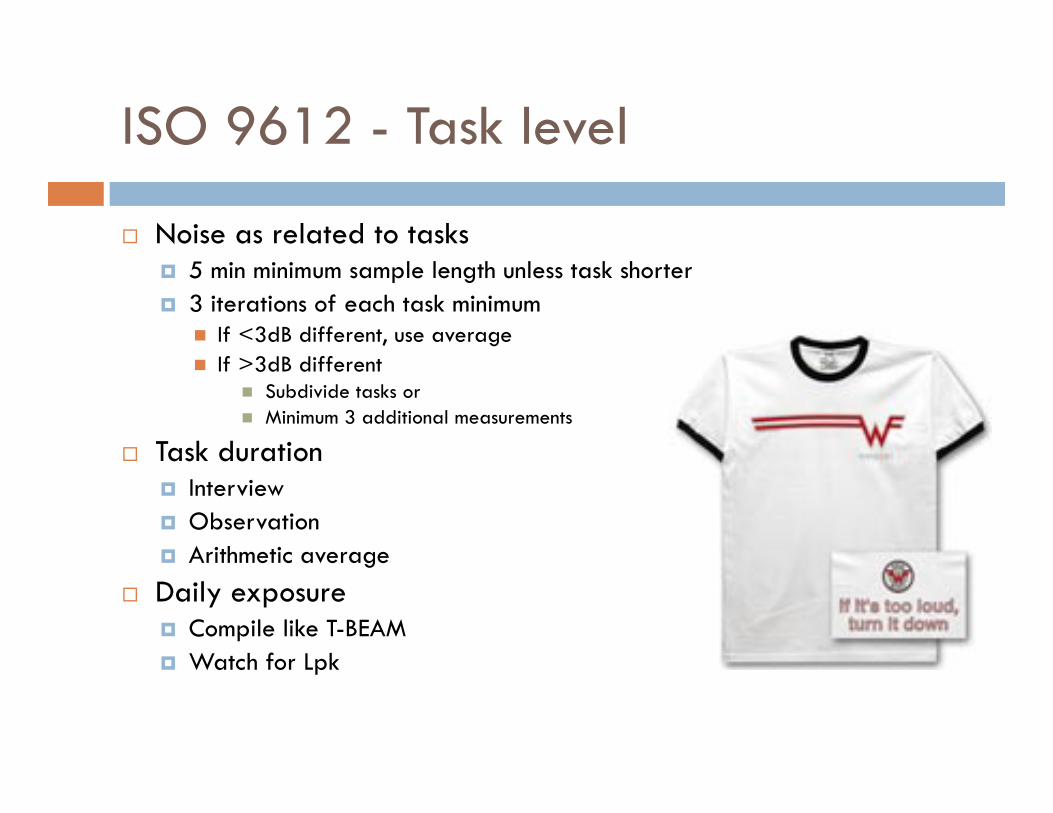
ISO 9612 - Task level
Noise as related to tasks 5 min minimum sample length unless task shorter 3 iterations of each task minimum
If <3dB different, use average If >3dB different
Subdivide tasks or Minimum 3 additional measurements
Task duration Interview Observation Arithmetic average
Daily exposure Compile like T-BEAM Watch for Lpk
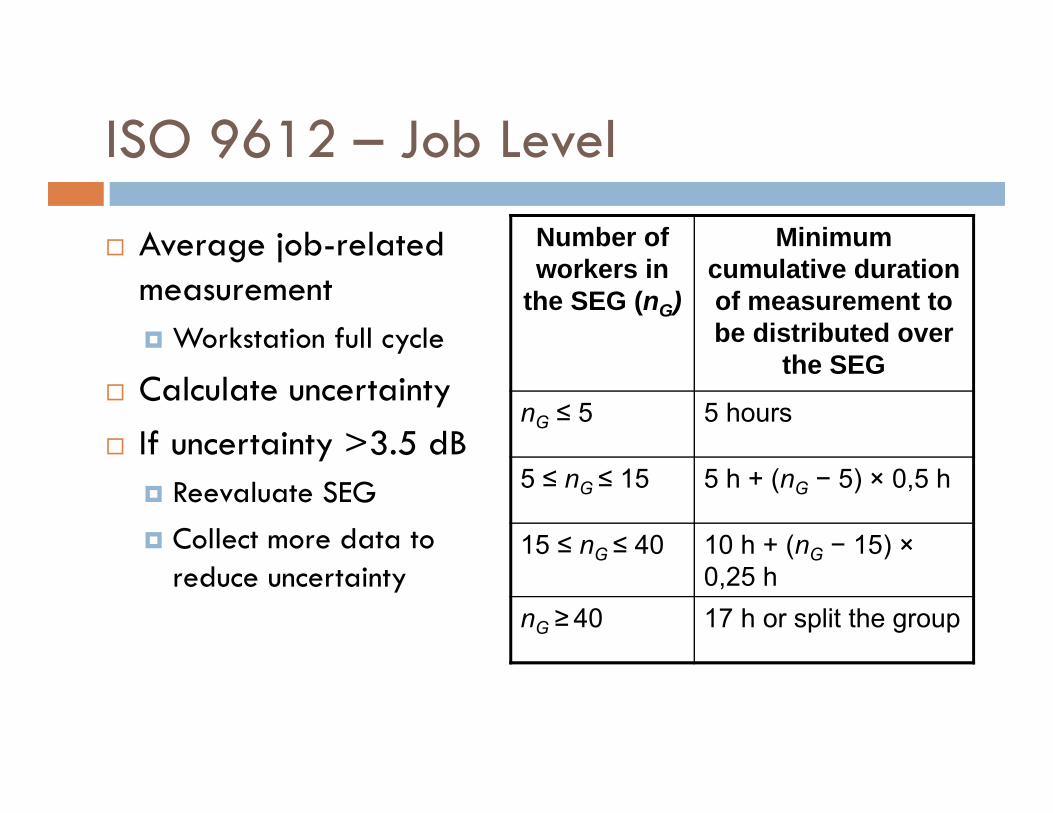
ISO 9612 – Job Level
Average job-related measurement Workstation full cycle
Calculate uncertainty If uncertainty >3.5 dB
Reevaluate SEG Collect more data to
reduce uncertainty
Number of workers in
the SEG (nG)
Minimum cumulative duration of measurement to be distributed over
the SEG
nG ≤ 5 5 hours
5 ≤ nG ≤ 15 5 h + (nG − 5) × 0,5 h
15 ≤ nG ≤ 40 10 h + (nG − 15) ×0,25 h
nG ≥ 40 17 h or split the group
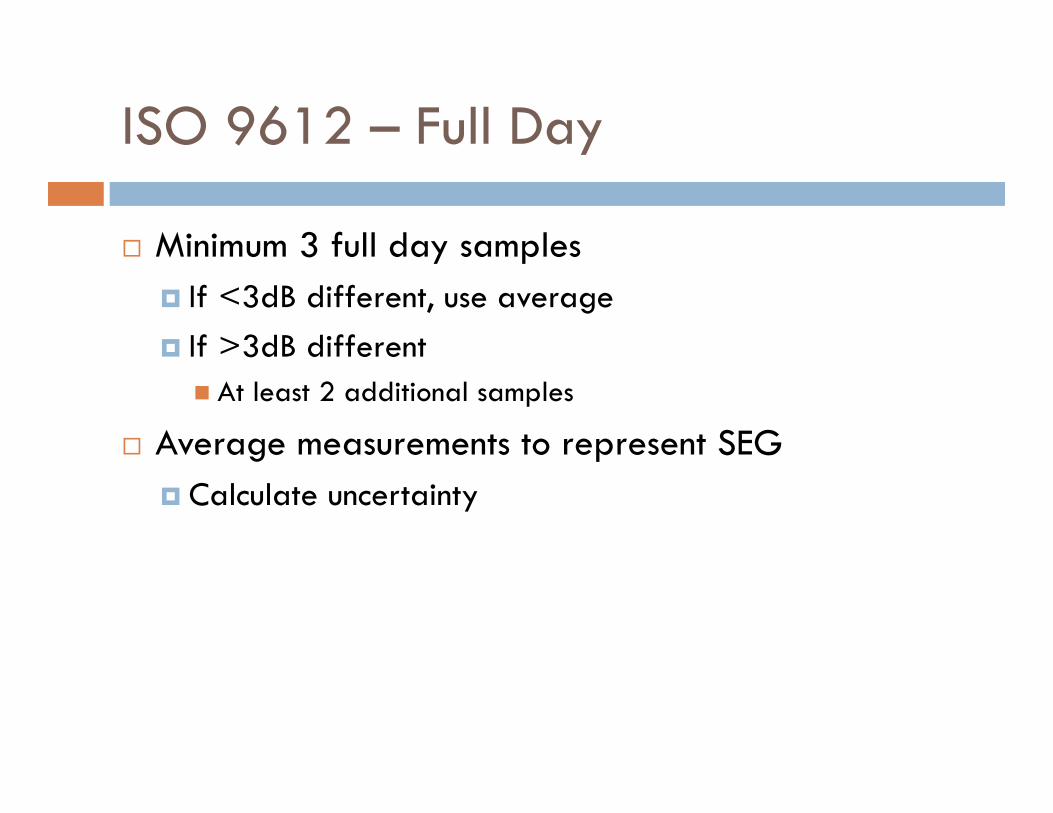
ISO 9612 – Full Day
Minimum 3 full day samples If <3dB different, use average If >3dB different At least 2 additional samples
Average measurements to represent SEG Calculate uncertainty
ISO 9612 – Uncertainty
Mechanism to address and quantify variability Instruments Imperfect selection of measurement position Sampling
Combine to develop combined measurement uncertainty ISO Guide to the Expression of Uncertainty in
Measurement (GUM)
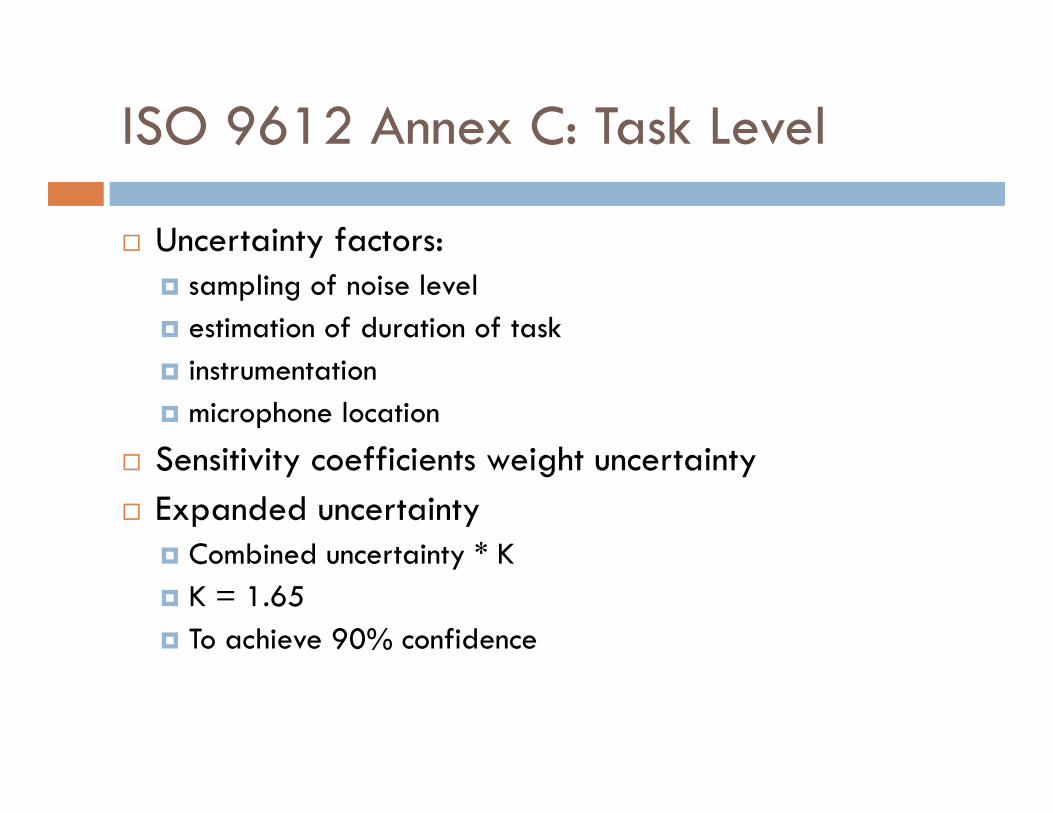
ISO 9612 Annex C: Task Level
Uncertainty factors: sampling of noise level estimation of duration of task instrumentation microphone location
Sensitivity coefficients weight uncertainty Expanded uncertainty
Combined uncertainty * K K = 1.65 To achieve 90% confidence
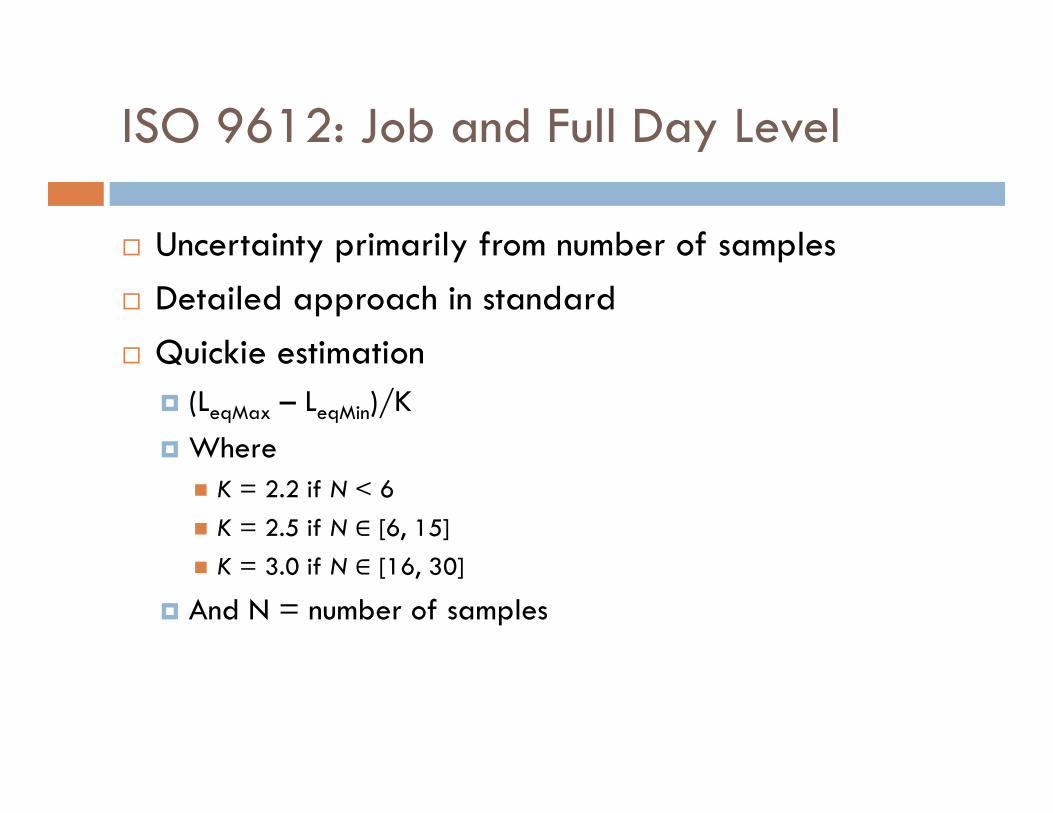
ISO 9612: Job and Full Day Level
Uncertainty primarily from number of samples Detailed approach in standard Quickie estimation
(LeqMax – LeqMin)/K Where K = 2.2 if N < 6 K = 2.5 if N ∈ [6, 15] K = 3.0 if N ∈ [16, 30]
And N = number of samples
Survey Reports
Think about purpose Communicate results Assign exposure to individuals based on representative
monitoring Record
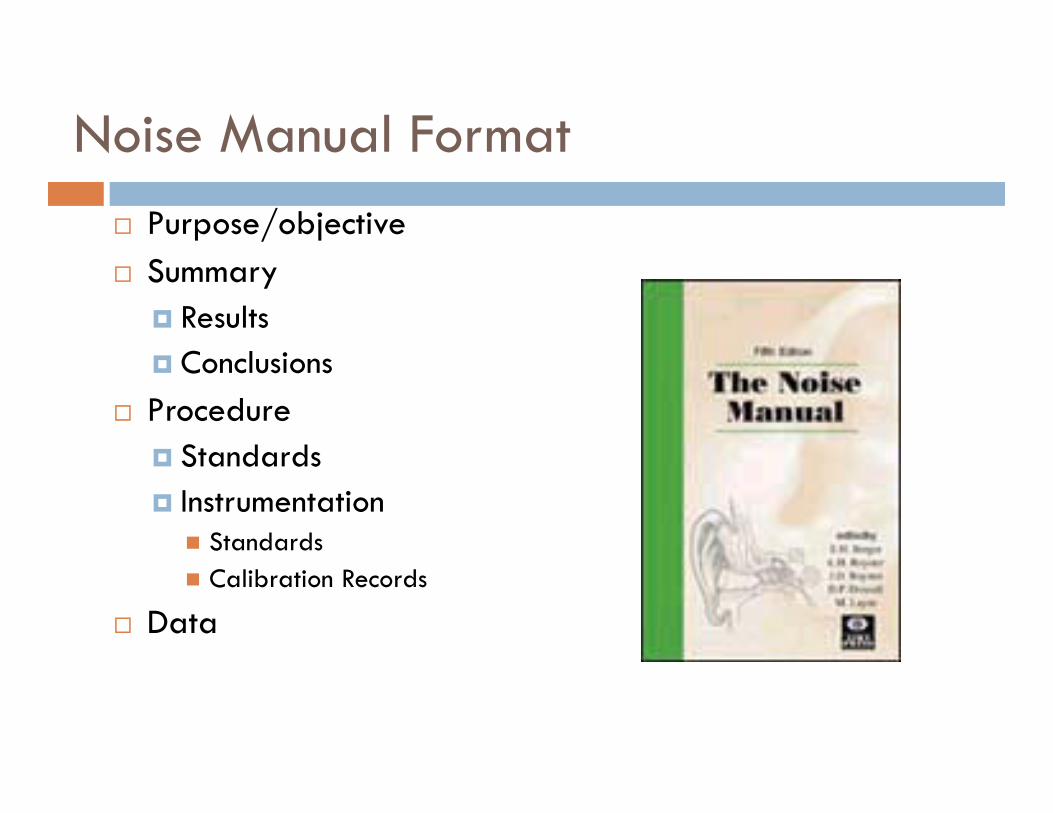
Noise Manual Format Purpose/objective Summary
Results Conclusions
Procedure Standards Instrumentation Standards Calibration Records
Data

ISO 9612 Format
General Purpose Who
Client Surveyor
Work Analysis SEG definition Definition of “normal day” Msmt strategies
Instrumentation Calibration traceability
Measurement description Who/SEG When Instruments Conditions
Production Non-relevant
Measurement Mic position/location Duration Count Results
Conclusions Uncertainty
Lee’s Suggestion
Executive Summary Introduction
Table of Findings Medical & Safety Report
Survey Layout/Map Appendix
Calibration records Surveyor certifications
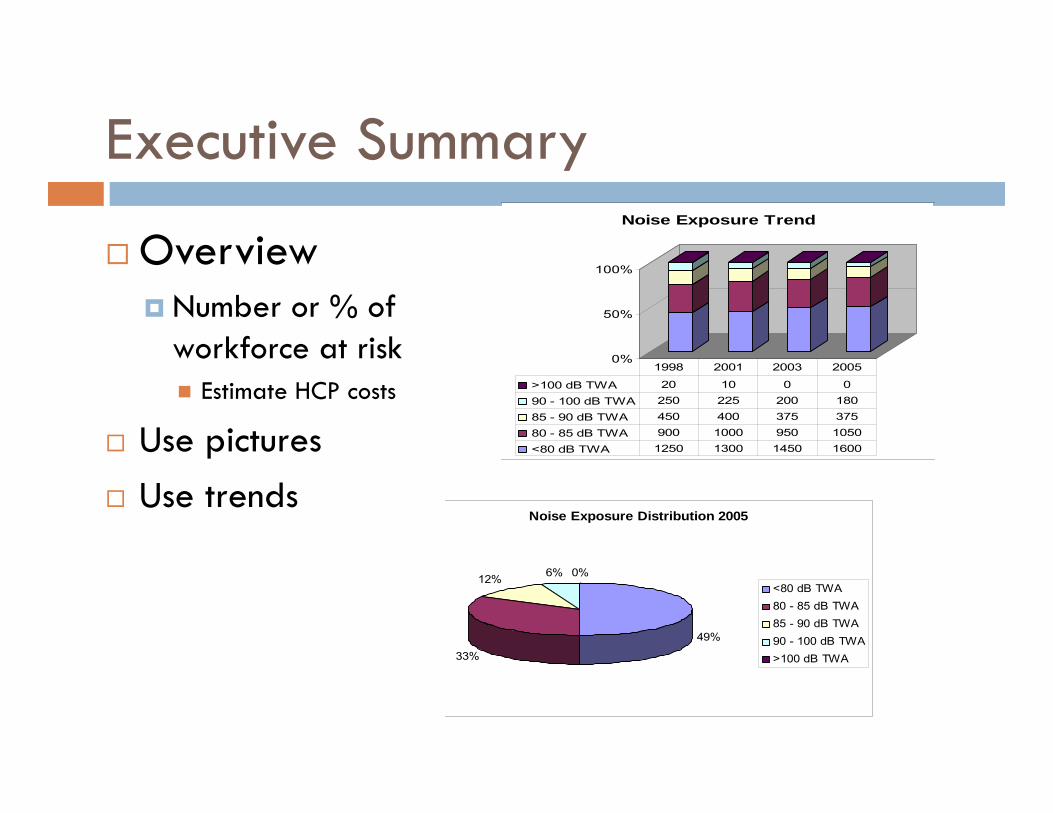
Executive Summary
Overview Number or % of
workforce at risk Estimate HCP costs
Use pictures Use trends
0%
50%
100%
Noise Exposure Trend
>100 dB TWA 20 10 0 0
90 - 100 dB TWA 250 225 200 180
85 - 90 dB TWA 450 400 375 375
80 - 85 dB TWA 900 1000 950 1050
<80 dB TWA 1250 1300 1450 1600
1998 2001 2003 2005
Noise Exposure Distribution 2005
49%
33%
12% 6% 0%<80 dB TWA80 - 85 dB TWA85 - 90 dB TWA90 - 100 dB TWA>100 dB TWA
Medical and Safety Reports
Exposure (TWA or Dose) Representative data back to people HCP Inclusion and Selection Who makes this decision?
Hearing Testing/Audiogram Medical or functionary Scheduling
HPD Purchasing Safety

What does it look like?
Noise Survey Summary Report June 2011
Dept Job Code Job Description TWA Lmax Lpk Min NRR
245 Machines 846 Material Handler East 87 94 9
245 Machines 846 Material Handler West 82 88
245 Machines 848 Machine Operator Bradley 92 99 126 14
245 Machines 848 Machine Operator Headlee 89 96 114 11
292 Operations 912 Maintenance Millwright East 78 99 135
292 Operations 915 Electrician 81 102 118
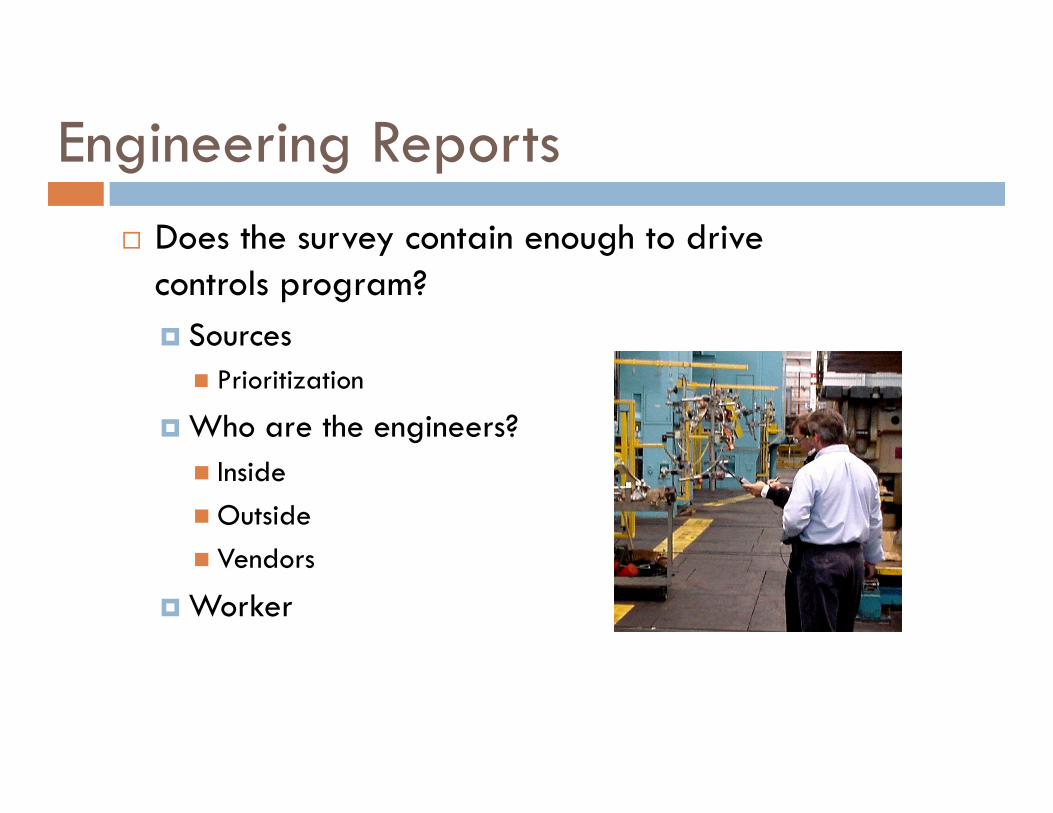
Engineering Reports Does the survey contain enough to drive
controls program? Sources Prioritization
Who are the engineers? InsideOutside Vendors
Worker

Sound Survey Map
Consider application HPD enforcement Noise status
Consider utility Colors Grid patterns
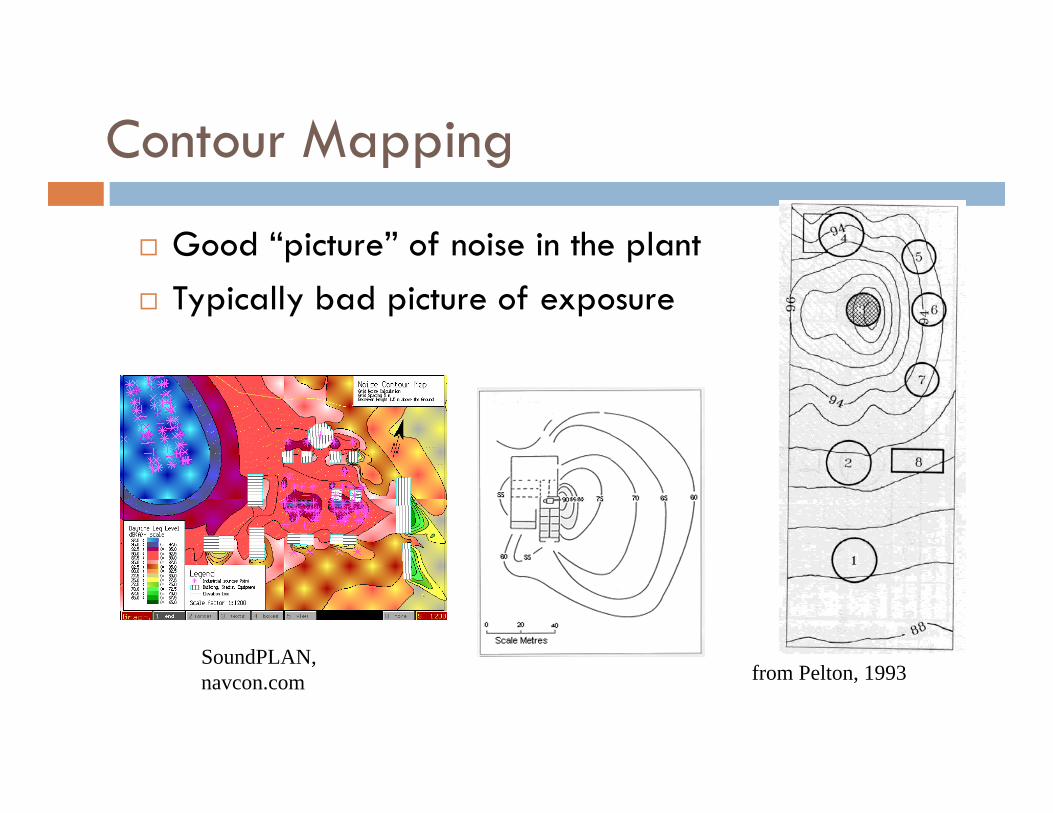
Contour Mapping
Good “picture” of noise in the plant Typically bad picture of exposure
from Pelton, 1993SoundPLAN, navcon.com

HPD Zone Layout
Built on existing administrative boundaries
Good for HPD Good for
worker notification
May overstate exposure
Other potential inclusions
HPD Audit HCP Audit Exposure by department
Trend
Source identification Controls?
How about recommendations?
Do your clients expect recommendations with the survey report?
Be cautious Don’t overstate your experience or capability Who collected the data?
Difference between identifying problems and suggesting solutions
Client liability exposure
83
Making it Work
Preparation Understanding
Protocol Conditions Limitations
Application… as research continues …
Courtesy Audibel
© 3M 2012. All Rights Reserved.